Embed Size (px)
Citation preview
1
Software Industry Update
Q2 2013
2
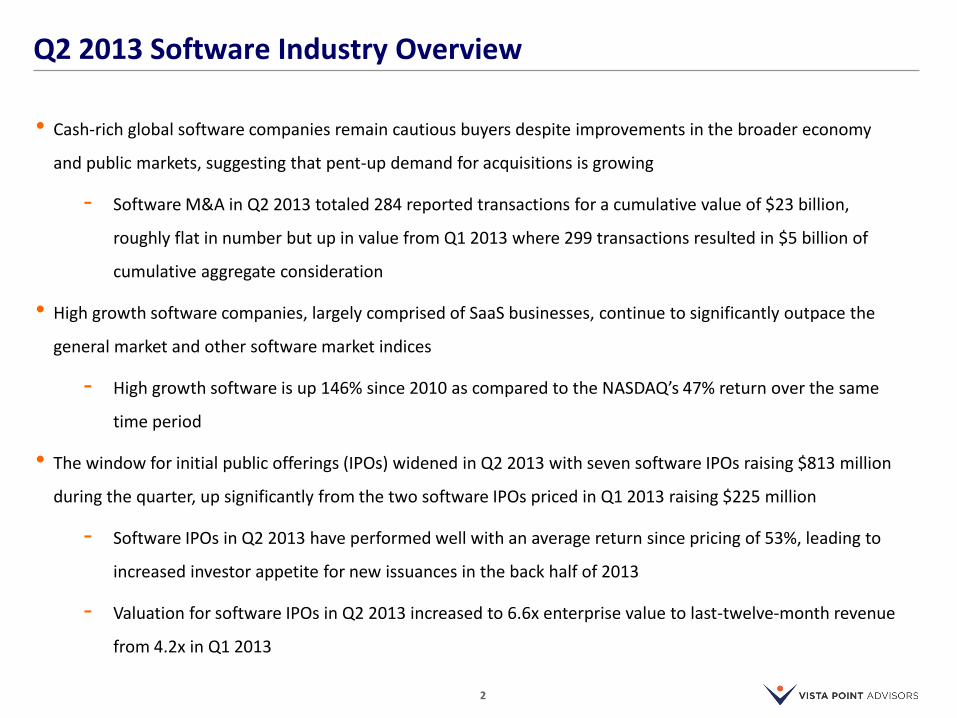
Q2 2013 Software Industry Overview
• Cash-rich global software companies remain cautious buyers despite improvements in the broader economy
and public markets, suggesting that pent-up demand for acquisitions is growing
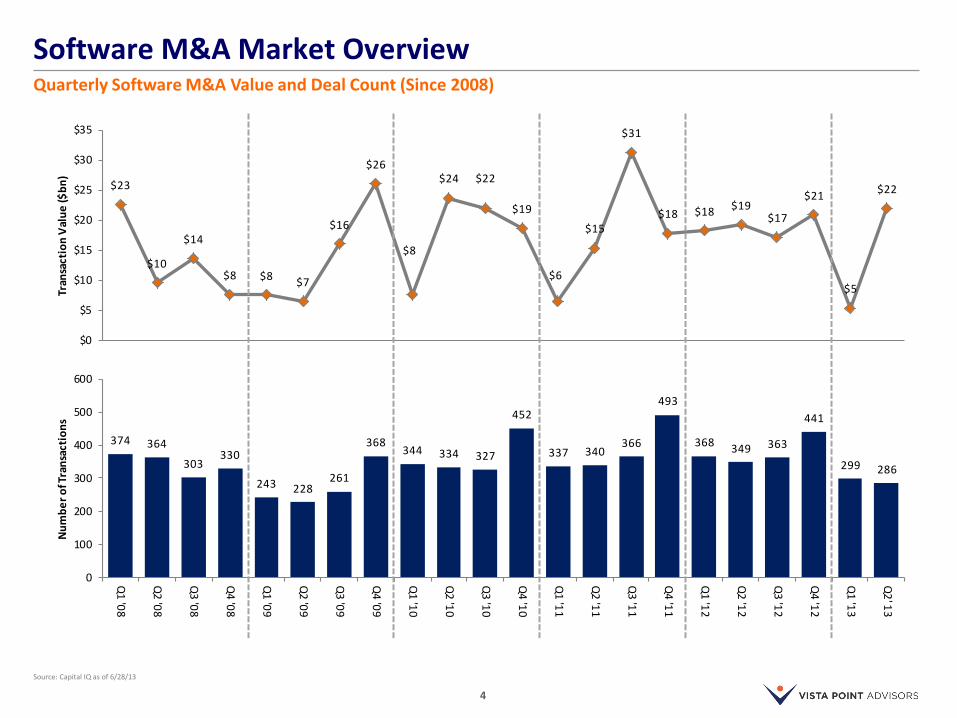
- Software M&A in Q2 2013 totaled 284 reported transactions for a cumulative value of $23 billion,
roughly flat in number but up in value from Q1 2013 where 299 transactions resulted in $5 billion of
cumulative aggregate consideration
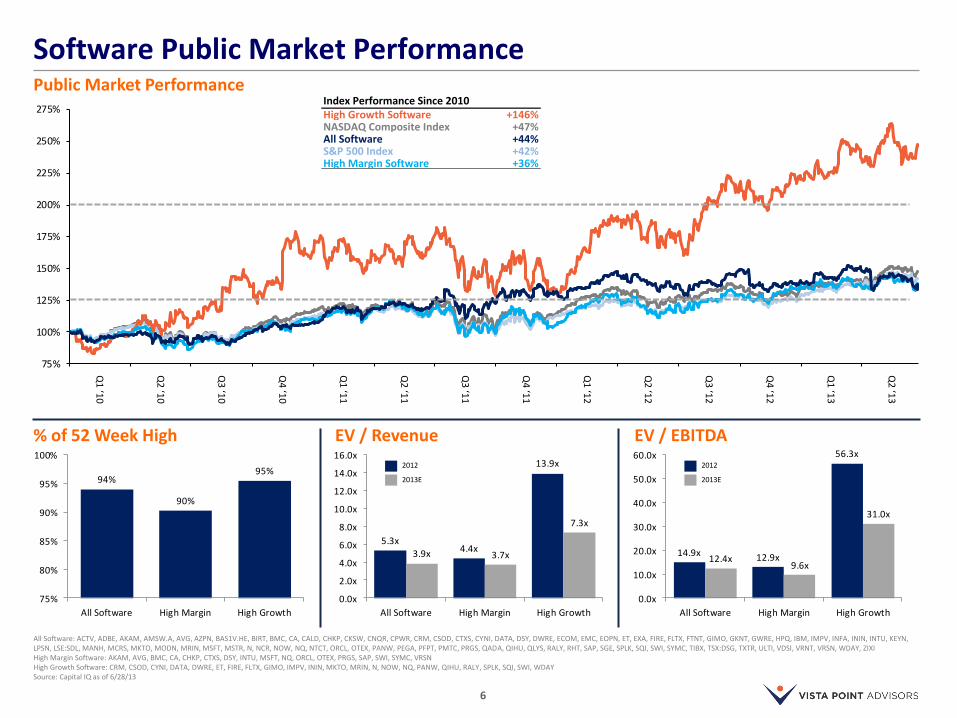
• High growth software companies, largely comprised of SaaS businesses, continue to significantly outpace the
general market and other software market indices
- High growth software is up 146% since 2010 as compared to the NASDAQ’s 47% return over the same
time period
• The window for initial public offerings (IPOs) widened in Q2 2013 with seven software IPOs raising $813 million
during the quarter, up significantly from the two software IPOs priced in Q1 2013 raising $225 million
- Software IPOs in Q2 2013 have performed well with an average return since pricing of 53%, leading to
increased investor appetite for new issuances in the back half of 2013
- Valuation for software IPOs in Q2 2013 increased to 6.6x enterprise value to last-twelve-month revenue
from 4.2x in Q1 2013
3
4033 35
31
21 20 21 19 19 1814 15 15 14 14
3
4
21 1
3 2
0
15
30
45
Nu
mb
er
of T
ran
sact
ion
s
$5.6
$15.6
$2.0 $1.2
$5.0 $3.0
$0.5 $2.0
N/A $1.0
$15.1
$5.3
$0.3 $1.2 $0.8
$0.0
$10.0
$20.0
$30.0
Tran
sact
ion
Val
ue
($b
n)
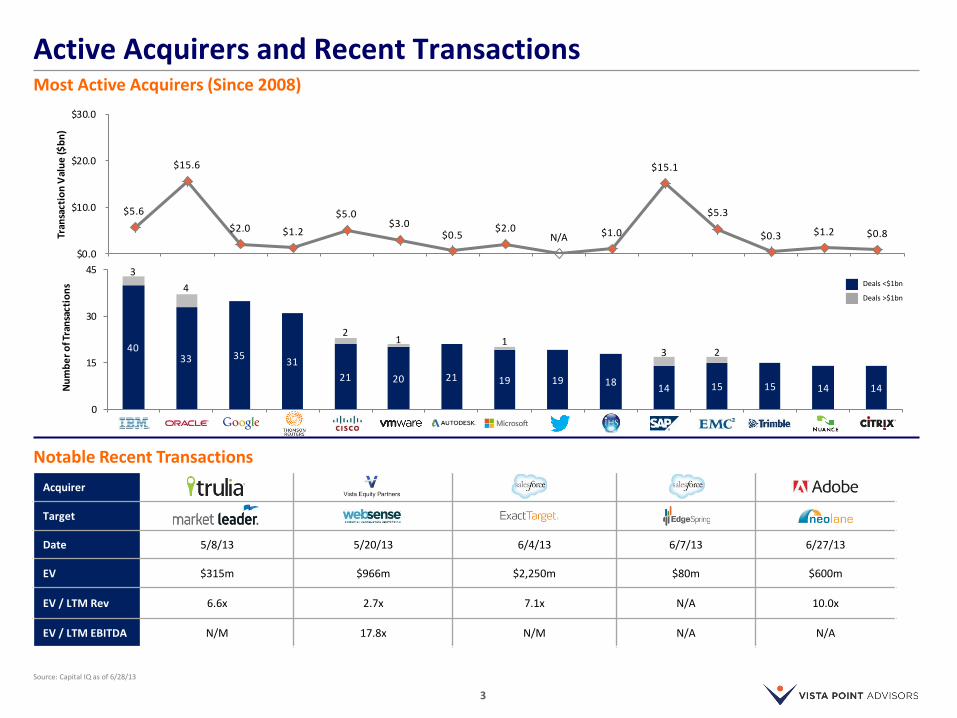
Active Acquirers and Recent Transactions Most Active Acquirers (Since 2008)
Source: Capital IQ as of 6/28/13
Notable Recent Transactions
Deals <$1bn
Deals >$1bn
Acquirer
Target
Date 5/8/13 5/20/13 6/4/13 6/7/13 6/27/13
EV $315m $966m $2,250m $80m $600m
EV / LTM Rev 6.6x 2.7x 7.1x N/A 10.0x
EV / LTM EBITDA N/M 17.8x N/M N/A N/A
4
374 364
303330
243 228261
368344 334 327
452
337 340366
493
368349 363
441
299 286
0
100
200
300
400
500
600
Q1
'08
Q2
'08
Q3
'08
Q4
'08
Q1
'09
Q2
'09
Q3
'09
Q4
'09
Q1
'10
Q2
'10
Q3
'10
Q4
'10
Q1
'11
Q2
'11
Q3
'11
Q4
'11
Q1
'12
Q2
'12
Q3
'12
Q4
'12
Q1
'13
Q2
' 13
Nu
mb
er
of T
ran
sact
ion
s
$23
$10
$14
$8 $8$7
$16
$26
$8
$24 $22
$19
$6
$15
$31
$18 $18 $19$17
$21
$5
$22
$0
$5
$10
$15
$20
$25
$30
$35
Tran
sact
ion
Val
ue
($b
n)
Software M&A Market Overview
Source: Capital IQ as of 6/28/13
Quarterly Software M&A Value and Deal Count (Since 2008)
5
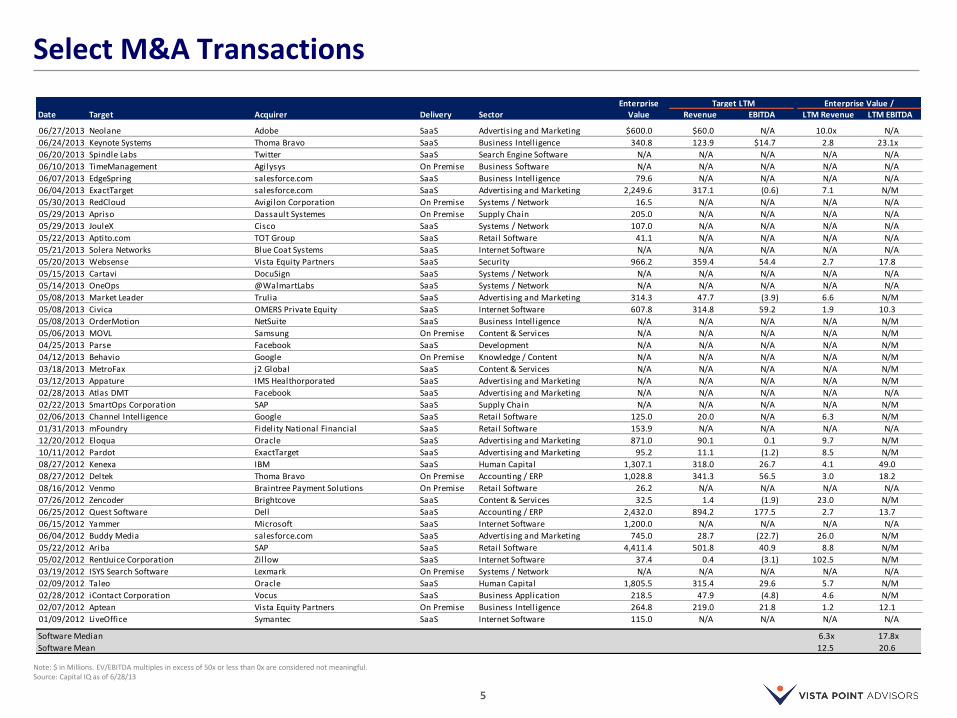
Enterprise Target LTM Enterprise Value / Date Target Acquirer Delivery Sector Value Revenue EBITDA LTM Revenue LTM EBITDA
06/27/2013 Neolane Adobe SaaS Advertising and Marketing $600.0 $60.0 N/A 10.0x N/A
06/24/2013 Keynote Systems Thoma Bravo SaaS Business Intell igence 340.8 123.9 $14.7 2.8 23.1x
06/20/2013 Spindle Labs Twitter SaaS Search Engine Software N/A N/A N/A N/A N/A
06/10/2013 TimeManagement Agilysys On Premise Business Software N/A N/A N/A N/A N/A
06/07/2013 EdgeSpring salesforce.com SaaS Business Intell igence 79.6 N/A N/A N/A N/A
06/04/2013 ExactTarget salesforce.com SaaS Advertising and Marketing 2,249.6 317.1 (0.6) 7.1 N/M
05/30/2013 RedCloud Avigilon Corporation On Premise Systems / Network 16.5 N/A N/A N/A N/A
05/29/2013 Apriso Dassault Systemes On Premise Supply Chain 205.0 N/A N/A N/A N/A
05/29/2013 JouleX Cisco SaaS Systems / Network 107.0 N/A N/A N/A N/A
05/22/2013 Aptito.com TOT Group SaaS Retail Software 41.1 N/A N/A N/A N/A
05/21/2013 Solera Networks Blue Coat Systems SaaS Internet Software N/A N/A N/A N/A N/A
05/20/2013 Websense Vista Equity Partners SaaS Security 966.2 359.4 54.4 2.7 17.8
05/15/2013 Cartavi DocuSign SaaS Systems / Network N/A N/A N/A N/A N/A
05/14/2013 OneOps @WalmartLabs SaaS Systems / Network N/A N/A N/A N/A N/A
05/08/2013 Market Leader Trulia SaaS Advertising and Marketing 314.3 47.7 (3.9) 6.6 N/M
05/08/2013 Civica OMERS Private Equity SaaS Internet Software 607.8 314.8 59.2 1.9 10.3
05/08/2013 OrderMotion NetSuite SaaS Business Intell igence N/A N/A N/A N/A N/M
05/06/2013 MOVL Samsung On Premise Content & Services N/A N/A N/A N/A N/M
04/25/2013 Parse Facebook SaaS Development N/A N/A N/A N/A N/M
04/12/2013 Behavio Google On Premise Knowledge / Content N/A N/A N/A N/A N/M
03/18/2013 MetroFax j2 Global SaaS Content & Services N/A N/A N/A N/A N/M
03/12/2013 Appature IMS Healthorporated SaaS Advertising and Marketing N/A N/A N/A N/A N/M
02/28/2013 Atlas DMT Facebook SaaS Advertising and Marketing N/A N/A N/A N/A N/A
02/22/2013 SmartOps Corporation SAP SaaS Supply Chain N/A N/A N/A N/A N/M
02/06/2013 Channel Intell igence Google SaaS Retail Software 125.0 20.0 N/A 6.3 N/M
01/31/2013 mFoundry Fidelity National Financial SaaS Retail Software 153.9 N/A N/A N/A N/A
12/20/2012 Eloqua Oracle SaaS Advertising and Marketing 871.0 90.1 0.1 9.7 N/M
10/11/2012 Pardot ExactTarget SaaS Advertising and Marketing 95.2 11.1 (1.2) 8.5 N/M
08/27/2012 Kenexa IBM SaaS Human Capital 1,307.1 318.0 26.7 4.1 49.0
08/27/2012 Deltek Thoma Bravo On Premise Accounting / ERP 1,028.8 341.3 56.5 3.0 18.2
08/16/2012 Venmo Braintree Payment Solutions On Premise Retail Software 26.2 N/A N/A N/A N/A
07/26/2012 Zencoder Brightcove SaaS Content & Services 32.5 1.4 (1.9) 23.0 N/M
06/25/2012 Quest Software Dell SaaS Accounting / ERP 2,432.0 894.2 177.5 2.7 13.7
06/15/2012 Yammer Microsoft SaaS Internet Software 1,200.0 N/A N/A N/A N/A
06/04/2012 Buddy Media salesforce.com SaaS Advertising and Marketing 745.0 28.7 (22.7) 26.0 N/M
05/22/2012 Ariba SAP SaaS Retail Software 4,411.4 501.8 40.9 8.8 N/M
05/02/2012 RentJuice Corporation Zillow SaaS Internet Software 37.4 0.4 (3.1) 102.5 N/M
03/19/2012 ISYS Search Software Lexmark On Premise Systems / Network N/A N/A N/A N/A N/A
02/09/2012 Taleo Oracle SaaS Human Capital 1,805.5 315.4 29.6 5.7 N/M
02/28/2012 iContact Corporation Vocus SaaS Business Application 218.5 47.9 (4.8) 4.6 N/M
02/07/2012 Aptean Vista Equity Partners On Premise Business Intell igence 264.8 219.0 21.8 1.2 12.1
01/09/2012 LiveOffice Symantec SaaS Internet Software 115.0 N/A N/A N/A N/A
Software Median 6.3x 17.8x
Software Mean 12.5 20.6
Select M&A Transactions
Note: $ in Millions. EV/EBITDA multiples in excess of 50x or less than 0x are considered not meaningful. Source: Capital IQ as of 6/28/13
6
94%
90%
95%
75%
80%
85%
90%
95%
100%
All Software High Margin High Growth
5.3x4.4x
13.9x
3.9x 3.7x
7.3x
0.0x
2.0x
4.0x
6.0x
8.0x
10.0x
12.0x
14.0x
16.0x
All Software High Margin High Growth
14.9x 12.9x
56.3x
12.4x9.6x
31.0x
0.0x
10.0x
20.0x
30.0x
40.0x
50.0x
60.0x
All Software High Margin High Growth
75%
100%
125%
150%
175%
200%
225%
250%
275%
Software Public Market Performance
EV / Revenue EV / EBITDA
All Software: ACTV, ADBE, AKAM, AMSW.A, AVG, AZPN, BAS1V.HE, BIRT, BMC, CA, CALD, CHKP, CKSW, CNQR, CPWR, CRM, CSOD, CTXS, CYNI, DATA, DSY, DWRE, ECOM, EMC, EOPN, ET, EXA, FIRE, FLTX, FTNT, GIMO, GKNT, GWRE, HPQ, IBM, IMPV, INFA, ININ, INTU, KEYN, LPSN, LSE:SDL, MANH, MCRS, MKTO, MODN, MRIN, MSFT, MSTR, N, NCR, NOW, NQ, NTCT, ORCL, OTEX, PANW, PEGA, PFPT, PMTC, PRGS, QADA, QIHU, QLYS, RALY, RHT, SAP, SGE, SPLK, SQI, SWI, SYMC, TIBX, TSX:DSG, TXTR, ULTI, VDSI, VRNT, VRSN, WDAY, ZIXI High Margin Software: AKAM, AVG, BMC, CA, CHKP, CTXS, DSY, INTU, MSFT, NQ, ORCL, OTEX, PRGS, SAP, SWI, SYMC, VRSN High Growth Software: CRM, CSOD, CYNI, DATA, DWRE, ET, FIRE, FLTX, GIMO, IMPV, ININ, MKTO, MRIN, N, NOW, NQ, PANW, QIHU, RALY, SPLK, SQI, SWI, WDAY Source: Capital IQ as of 6/28/13
Q1
‘10
Q2
‘10
Q3
‘10
Q4
‘10
Q1
‘11
Q2
‘11
Q3
‘11
Q4
‘11
Q1
‘12
Q2
‘12
Q3
‘12
Q4
‘12
Q1
‘13
Public Market Performance
% of 52 Week High
Q2
‘13
2012
2013E
2012
2013E
Index Performance Since 2010High Growth Software +146%NASDAQ Composite Index +47%All Software +44%S&P 500 Index +42%High Margin Software +36%
7
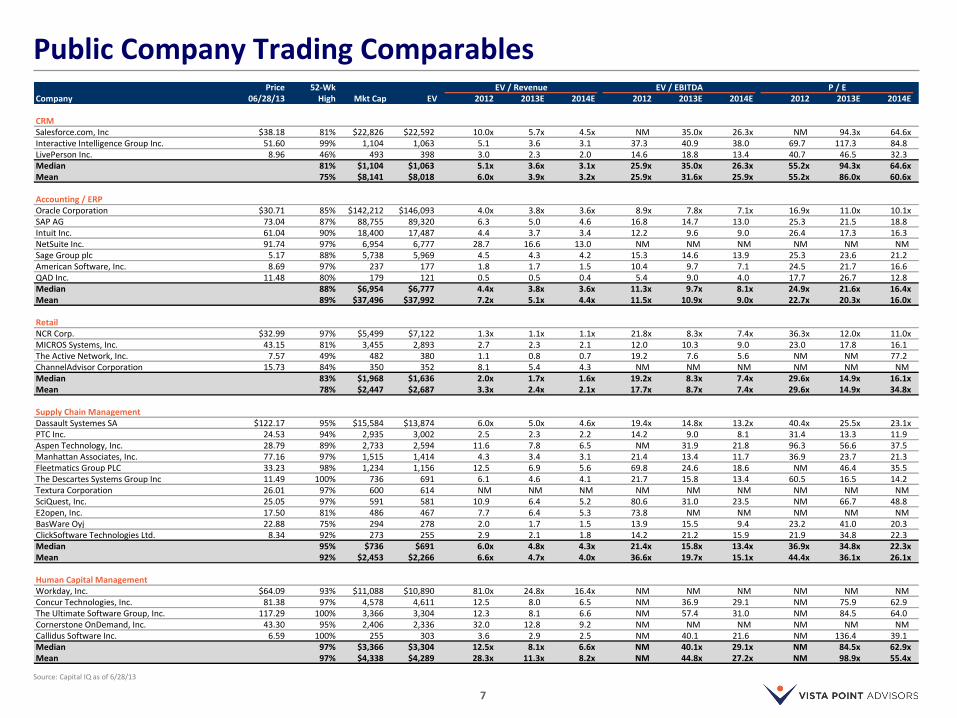
Public Company Trading Comparables Price 52-Wk EV / Revenue EV / EBITDA P / E 52 Week
Company 06/28/13 High Mkt Cap EV 2012 2013E 2014E 2012 2013E 2014E 2012 2013E 2014E
CRMSalesforce.com, Inc $38.18 81% $22,826 $22,592 10.0x 5.7x 4.5x NM 35.0x 26.3x NM 94.3x 64.6xInteractive Intelligence Group Inc. 51.60 99% 1,104 1,063 5.1 3.6 3.1 37.3 40.9 38.0 69.7 117.3 84.8LivePerson Inc. 8.96 46% 493 398 3.0 2.3 2.0 14.6 18.8 13.4 40.7 46.5 32.3Median 81% $1,104 $1,063 5.1x 3.6x 3.1x 25.9x 35.0x 26.3x 55.2x 94.3x 64.6xMean 75% $8,141 $8,018 6.0x 3.9x 3.2x 25.9x 31.6x 25.9x 55.2x 86.0x 60.6x
Accounting / ERPOracle Corporation $30.71 85% $142,212 $146,093 4.0x 3.8x 3.6x 8.9x 7.8x 7.1x 16.9x 11.0x 10.1xSAP AG 73.04 87% 88,755 89,320 6.3 5.0 4.6 16.8 14.7 13.0 25.3 21.5 18.8Intuit Inc. 61.04 90% 18,400 17,487 4.4 3.7 3.4 12.2 9.6 9.0 26.4 17.3 16.3NetSuite Inc. 91.74 97% 6,954 6,777 28.7 16.6 13.0 NM NM NM NM NM NM Sage Group plc 5.17 88% 5,738 5,969 4.5 4.3 4.2 15.3 14.6 13.9 25.3 23.6 21.2American Software, Inc. 8.69 97% 237 177 1.8 1.7 1.5 10.4 9.7 7.1 24.5 21.7 16.6QAD Inc. 11.48 80% 179 121 0.5 0.5 0.4 5.4 9.0 4.0 17.7 26.7 12.8Median 88% $6,954 $6,777 4.4x 3.8x 3.6x 11.3x 9.7x 8.1x 24.9x 21.6x 16.4xMean 89% $37,496 $37,992 7.2x 5.1x 4.4x 11.5x 10.9x 9.0x 22.7x 20.3x 16.0x
RetailNCR Corp. $32.99 97% $5,499 $7,122 1.3x 1.1x 1.1x 21.8x 8.3x 7.4x 36.3x 12.0x 11.0xMICROS Systems, Inc. 43.15 81% 3,455 2,893 2.7 2.3 2.1 12.0 10.3 9.0 23.0 17.8 16.1The Active Network, Inc. 7.57 49% 482 380 1.1 0.8 0.7 19.2 7.6 5.6 NM NM 77.2ChannelAdvisor Corporation 15.73 84% 350 352 8.1 5.4 4.3 NM NM NM NM NM NM Median 83% $1,968 $1,636 2.0x 1.7x 1.6x 19.2x 8.3x 7.4x 29.6x 14.9x 16.1xMean 78% $2,447 $2,687 3.3x 2.4x 2.1x 17.7x 8.7x 7.4x 29.6x 14.9x 34.8x
Supply Chain ManagementDassault Systemes SA $122.17 95% $15,584 $13,874 6.0x 5.0x 4.6x 19.4x 14.8x 13.2x 40.4x 25.5x 23.1xPTC Inc. 24.53 94% 2,935 3,002 2.5 2.3 2.2 14.2 9.0 8.1 31.4 13.3 11.9Aspen Technology, Inc. 28.79 89% 2,733 2,594 11.6 7.8 6.5 NM 31.9 21.8 96.3 56.6 37.5Manhattan Associates, Inc. 77.16 97% 1,515 1,414 4.3 3.4 3.1 21.4 13.4 11.7 36.9 23.7 21.3Fleetmatics Group PLC 33.23 98% 1,234 1,156 12.5 6.9 5.6 69.8 24.6 18.6 NM 46.4 35.5The Descartes Systems Group Inc 11.49 100% 736 691 6.1 4.6 4.1 21.7 15.8 13.4 60.5 16.5 14.2Textura Corporation 26.01 97% 600 614 NM NM NM NM NM NM NM NM NM SciQuest, Inc. 25.05 97% 591 581 10.9 6.4 5.2 80.6 31.0 23.5 NM 66.7 48.8E2open, Inc. 17.50 81% 486 467 7.7 6.4 5.3 73.8 NM NM NM NM NM BasWare Oyj 22.88 75% 294 278 2.0 1.7 1.5 13.9 15.5 9.4 23.2 41.0 20.3ClickSoftware Technologies Ltd. 8.34 92% 273 255 2.9 2.1 1.8 14.2 21.2 15.9 21.9 34.8 22.3Median 95% $736 $691 6.0x 4.8x 4.3x 21.4x 15.8x 13.4x 36.9x 34.8x 22.3xMean 92% $2,453 $2,266 6.6x 4.7x 4.0x 36.6x 19.7x 15.1x 44.4x 36.1x 26.1x
Human Capital ManagementWorkday, Inc. $64.09 93% $11,088 $10,890 81.0x 24.8x 16.4x NM NM NM NM NM NM Concur Technologies, Inc. 81.38 97% 4,578 4,611 12.5 8.0 6.5 NM 36.9 29.1 NM 75.9 62.9The Ultimate Software Group, Inc. 117.29 100% 3,366 3,304 12.3 8.1 6.6 NM 57.4 31.0 NM 84.5 64.0Cornerstone OnDemand, Inc. 43.30 95% 2,406 2,336 32.0 12.8 9.2 NM NM NM NM NM NM Callidus Software Inc. 6.59 100% 255 303 3.6 2.9 2.5 NM 40.1 21.6 NM 136.4 39.1Median 97% $3,366 $3,304 12.5x 8.1x 6.6x NM 40.1x 29.1x NM 84.5x 62.9xMean 97% $4,338 $4,289 28.3x 11.3x 8.2x NM 44.8x 27.2x NM 98.9x 55.4x
Source: Capital IQ as of 6/28/13
8
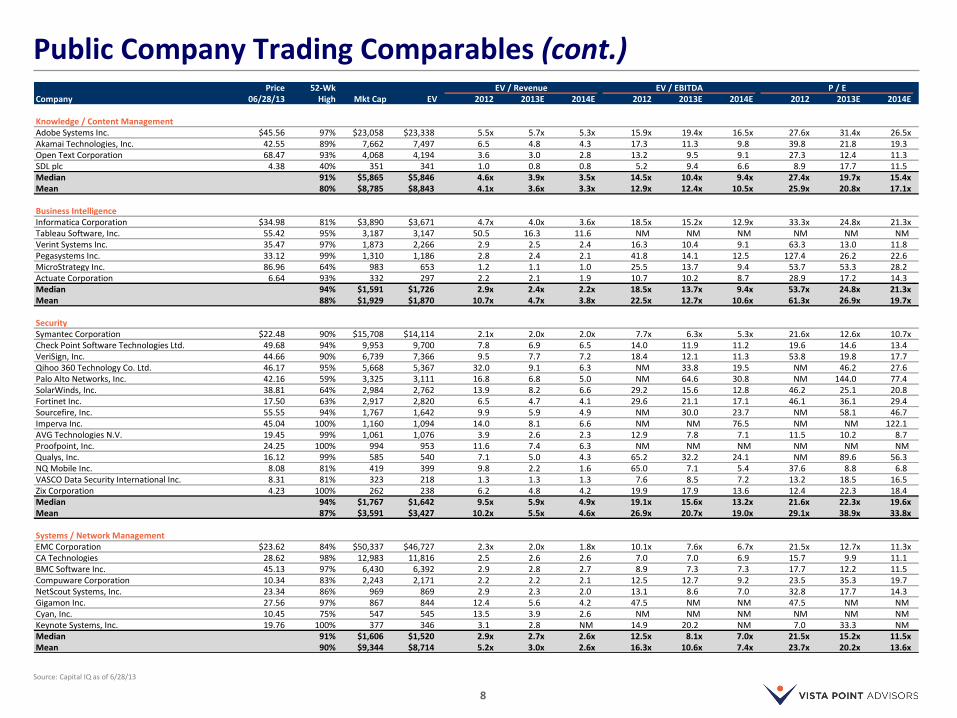
Public Company Trading Comparables (cont.) Price 52-Wk EV / Revenue EV / EBITDA P / E 52 Week
Company 06/28/13 High Mkt Cap EV 2012 2013E 2014E 2012 2013E 2014E 2012 2013E 2014E
Knowledge / Content ManagementAdobe Systems Inc. $45.56 97% $23,058 $23,338 5.5x 5.7x 5.3x 15.9x 19.4x 16.5x 27.6x 31.4x 26.5xAkamai Technologies, Inc. 42.55 89% 7,662 7,497 6.5 4.8 4.3 17.3 11.3 9.8 39.8 21.8 19.3Open Text Corporation 68.47 93% 4,068 4,194 3.6 3.0 2.8 13.2 9.5 9.1 27.3 12.4 11.3SDL plc 4.38 40% 351 341 1.0 0.8 0.8 5.2 9.4 6.6 8.9 17.7 11.5Median 91% $5,865 $5,846 4.6x 3.9x 3.5x 14.5x 10.4x 9.4x 27.4x 19.7x 15.4xMean 80% $8,785 $8,843 4.1x 3.6x 3.3x 12.9x 12.4x 10.5x 25.9x 20.8x 17.1x
Business IntelligenceInformatica Corporation $34.98 81% $3,890 $3,671 4.7x 4.0x 3.6x 18.5x 15.2x 12.9x 33.3x 24.8x 21.3xTableau Software, Inc. 55.42 95% 3,187 3,147 50.5 16.3 11.6 NM NM NM NM NM NM Verint Systems Inc. 35.47 97% 1,873 2,266 2.9 2.5 2.4 16.3 10.4 9.1 63.3 13.0 11.8Pegasystems Inc. 33.12 99% 1,310 1,186 2.8 2.4 2.1 41.8 14.1 12.5 127.4 26.2 22.6MicroStrategy Inc. 86.96 64% 983 653 1.2 1.1 1.0 25.5 13.7 9.4 53.7 53.3 28.2Actuate Corporation 6.64 93% 332 297 2.2 2.1 1.9 10.7 10.2 8.7 28.9 17.2 14.3Median 94% $1,591 $1,726 2.9x 2.4x 2.2x 18.5x 13.7x 9.4x 53.7x 24.8x 21.3xMean 88% $1,929 $1,870 10.7x 4.7x 3.8x 22.5x 12.7x 10.6x 61.3x 26.9x 19.7x
SecuritySymantec Corporation $22.48 90% $15,708 $14,114 2.1x 2.0x 2.0x 7.7x 6.3x 5.3x 21.6x 12.6x 10.7xCheck Point Software Technologies Ltd. 49.68 94% 9,953 9,700 7.8 6.9 6.5 14.0 11.9 11.2 19.6 14.6 13.4VeriSign, Inc. 44.66 90% 6,739 7,366 9.5 7.7 7.2 18.4 12.1 11.3 53.8 19.8 17.7Qihoo 360 Technology Co. Ltd. 46.17 95% 5,668 5,367 32.0 9.1 6.3 NM 33.8 19.5 NM 46.2 27.6Palo Alto Networks, Inc. 42.16 59% 3,325 3,111 16.8 6.8 5.0 NM 64.6 30.8 NM 144.0 77.4SolarWinds, Inc. 38.81 64% 2,984 2,762 13.9 8.2 6.6 29.2 15.6 12.8 46.2 25.1 20.8Fortinet Inc. 17.50 63% 2,917 2,820 6.5 4.7 4.1 29.6 21.1 17.1 46.1 36.1 29.4Sourcefire, Inc. 55.55 94% 1,767 1,642 9.9 5.9 4.9 NM 30.0 23.7 NM 58.1 46.7Imperva Inc. 45.04 100% 1,160 1,094 14.0 8.1 6.6 NM NM 76.5 NM NM 122.1AVG Technologies N.V. 19.45 99% 1,061 1,076 3.9 2.6 2.3 12.9 7.8 7.1 11.5 10.2 8.7Proofpoint, Inc. 24.25 100% 994 953 11.6 7.4 6.3 NM NM NM NM NM NM Qualys, Inc. 16.12 99% 585 540 7.1 5.0 4.3 65.2 32.2 24.1 NM 89.6 56.3NQ Mobile Inc. 8.08 81% 419 399 9.8 2.2 1.6 65.0 7.1 5.4 37.6 8.8 6.8VASCO Data Security International Inc. 8.31 81% 323 218 1.3 1.3 1.3 7.6 8.5 7.2 13.2 18.5 16.5Zix Corporation 4.23 100% 262 238 6.2 4.8 4.2 19.9 17.9 13.6 12.4 22.3 18.4Median 94% $1,767 $1,642 9.5x 5.9x 4.9x 19.1x 15.6x 13.2x 21.6x 22.3x 19.6xMean 87% $3,591 $3,427 10.2x 5.5x 4.6x 26.9x 20.7x 19.0x 29.1x 38.9x 33.8x
Systems / Network ManagementEMC Corporation $23.62 84% $50,337 $46,727 2.3x 2.0x 1.8x 10.1x 7.6x 6.7x 21.5x 12.7x 11.3xCA Technologies 28.62 98% 12,983 11,816 2.5 2.6 2.6 7.0 7.0 6.9 15.7 9.9 11.1BMC Software Inc. 45.13 97% 6,430 6,392 2.9 2.8 2.7 8.9 7.3 7.3 17.7 12.2 11.5Compuware Corporation 10.34 83% 2,243 2,171 2.2 2.2 2.1 12.5 12.7 9.2 23.5 35.3 19.7NetScout Systems, Inc. 23.34 86% 969 869 2.9 2.3 2.0 13.1 8.6 7.0 32.8 17.7 14.3Gigamon Inc. 27.56 97% 867 844 12.4 5.6 4.2 47.5 NM NM 47.5 NM NM Cyan, Inc. 10.45 75% 547 545 13.5 3.9 2.6 NM NM NM NM NM NM Keynote Systems, Inc. 19.76 100% 377 346 3.1 2.8 NM 14.9 20.2 NM 7.0 33.3 NM Median 91% $1,606 $1,520 2.9x 2.7x 2.6x 12.5x 8.1x 7.0x 21.5x 15.2x 11.5xMean 90% $9,344 $8,714 5.2x 3.0x 2.6x 16.3x 10.6x 7.4x 23.7x 20.2x 13.6x
Source: Capital IQ as of 6/28/13
9
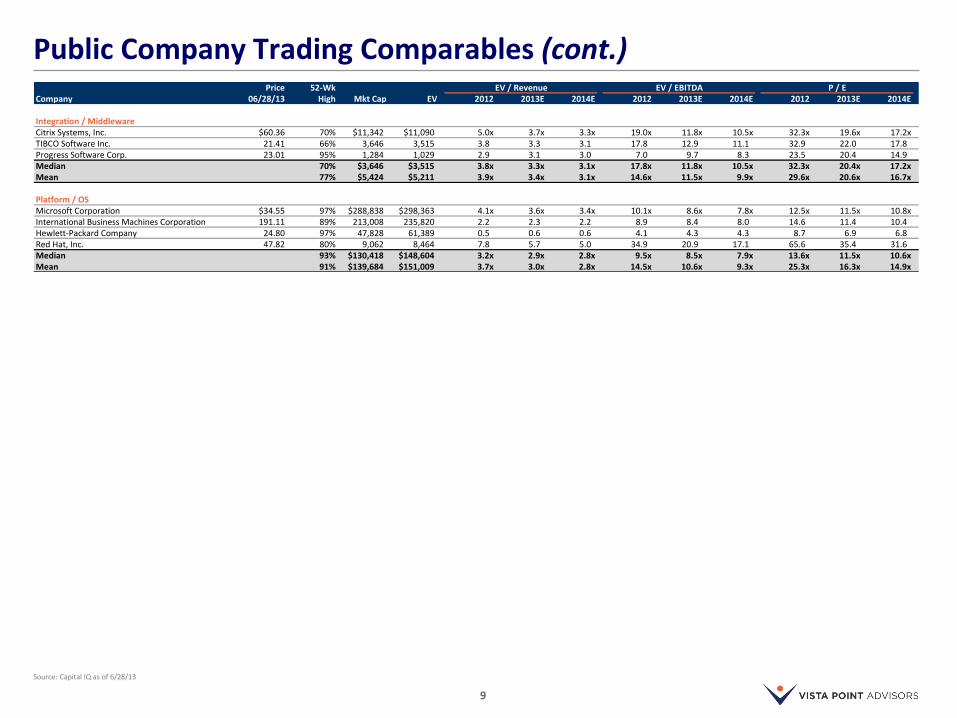
Public Company Trading Comparables (cont.) Price 52-Wk EV / Revenue EV / EBITDA P / E 52 Week
Company 06/28/13 High Mkt Cap EV 2012 2013E 2014E 2012 2013E 2014E 2012 2013E 2014E
Integration / MiddlewareCitrix Systems, Inc. $60.36 70% $11,342 $11,090 5.0x 3.7x 3.3x 19.0x 11.8x 10.5x 32.3x 19.6x 17.2xTIBCO Software Inc. 21.41 66% 3,646 3,515 3.8 3.3 3.1 17.8 12.9 11.1 32.9 22.0 17.8Progress Software Corp. 23.01 95% 1,284 1,029 2.9 3.1 3.0 7.0 9.7 8.3 23.5 20.4 14.9Median 70% $3,646 $3,515 3.8x 3.3x 3.1x 17.8x 11.8x 10.5x 32.3x 20.4x 17.2xMean 77% $5,424 $5,211 3.9x 3.4x 3.1x 14.6x 11.5x 9.9x 29.6x 20.6x 16.7x
Platform / OSMicrosoft Corporation $34.55 97% $288,838 $298,363 4.1x 3.6x 3.4x 10.1x 8.6x 7.8x 12.5x 11.5x 10.8xInternational Business Machines Corporation 191.11 89% 213,008 235,820 2.2 2.3 2.2 8.9 8.4 8.0 14.6 11.4 10.4Hewlett-Packard Company 24.80 97% 47,828 61,389 0.5 0.6 0.6 4.1 4.3 4.3 8.7 6.9 6.8Red Hat, Inc. 47.82 80% 9,062 8,464 7.8 5.7 5.0 34.9 20.9 17.1 65.6 35.4 31.6Median 93% $130,418 $148,604 3.2x 2.9x 2.8x 9.5x 8.5x 7.9x 13.6x 11.5x 10.6xMean 91% $139,684 $151,009 3.7x 3.0x 2.8x 14.5x 10.6x 9.3x 25.3x 16.3x 14.9x
Source: Capital IQ as of 6/28/13
10
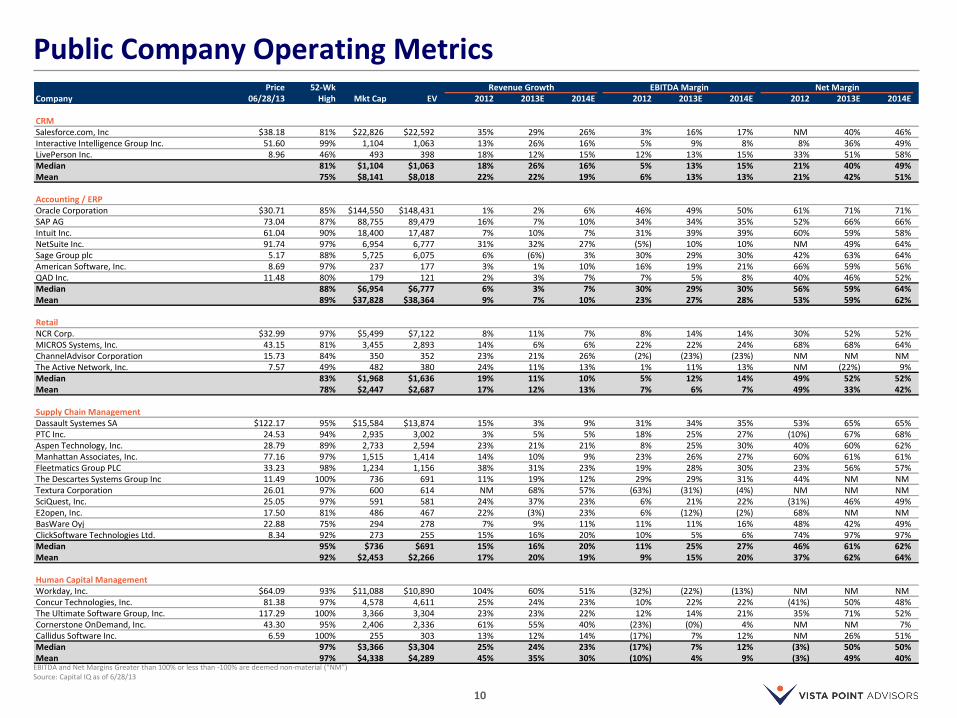
Public Company Operating Metrics Price 52-Wk Revenue Growth EBITDA Margin Net Margin 52 Week
Company 06/28/13 High Mkt Cap EV 2012 2013E 2014E 2012 2013E 2014E 2012 2013E 2014E
CRMSalesforce.com, Inc $38.18 81% $22,826 $22,592 35% 29% 26% 3% 16% 17% NM 40% 46%Interactive Intelligence Group Inc. 51.60 99% 1,104 1,063 13% 26% 16% 5% 9% 8% 8% 36% 49%LivePerson Inc. 8.96 46% 493 398 18% 12% 15% 12% 13% 15% 33% 51% 58%Median 81% $1,104 $1,063 18% 26% 16% 5% 13% 15% 21% 40% 49%Mean 75% $8,141 $8,018 22% 22% 19% 6% 13% 13% 21% 42% 51%
Accounting / ERPOracle Corporation $30.71 85% $144,550 $148,431 1% 2% 6% 46% 49% 50% 61% 71% 71%SAP AG 73.04 87% 88,755 89,479 16% 7% 10% 34% 34% 35% 52% 66% 66%Intuit Inc. 61.04 90% 18,400 17,487 7% 10% 7% 31% 39% 39% 60% 59% 58%NetSuite Inc. 91.74 97% 6,954 6,777 31% 32% 27% (5%) 10% 10% NM 49% 64%Sage Group plc 5.17 88% 5,725 6,075 6% (6%) 3% 30% 29% 30% 42% 63% 64%American Software, Inc. 8.69 97% 237 177 3% 1% 10% 16% 19% 21% 66% 59% 56%QAD Inc. 11.48 80% 179 121 2% 3% 7% 7% 5% 8% 40% 46% 52%Median 88% $6,954 $6,777 6% 3% 7% 30% 29% 30% 56% 59% 64%Mean 89% $37,828 $38,364 9% 7% 10% 23% 27% 28% 53% 59% 62%
RetailNCR Corp. $32.99 97% $5,499 $7,122 8% 11% 7% 8% 14% 14% 30% 52% 52%MICROS Systems, Inc. 43.15 81% 3,455 2,893 14% 6% 6% 22% 22% 24% 68% 68% 64%ChannelAdvisor Corporation 15.73 84% 350 352 23% 21% 26% (2%) (23%) (23%) NM NM NM The Active Network, Inc. 7.57 49% 482 380 24% 11% 13% 1% 11% 13% NM (22%) 9%Median 83% $1,968 $1,636 19% 11% 10% 5% 12% 14% 49% 52% 52%Mean 78% $2,447 $2,687 17% 12% 13% 7% 6% 7% 49% 33% 42%
Supply Chain ManagementDassault Systemes SA $122.17 95% $15,584 $13,874 15% 3% 9% 31% 34% 35% 53% 65% 65%PTC Inc. 24.53 94% 2,935 3,002 3% 5% 5% 18% 25% 27% (10%) 67% 68%Aspen Technology, Inc. 28.79 89% 2,733 2,594 23% 21% 21% 8% 25% 30% 40% 60% 62%Manhattan Associates, Inc. 77.16 97% 1,515 1,414 14% 10% 9% 23% 26% 27% 60% 61% 61%Fleetmatics Group PLC 33.23 98% 1,234 1,156 38% 31% 23% 19% 28% 30% 23% 56% 57%The Descartes Systems Group Inc 11.49 100% 736 691 11% 19% 12% 29% 29% 31% 44% NM NM Textura Corporation 26.01 97% 600 614 NM 68% 57% (63%) (31%) (4%) NM NM NM SciQuest, Inc. 25.05 97% 591 581 24% 37% 23% 6% 21% 22% (31%) 46% 49%E2open, Inc. 17.50 81% 486 467 22% (3%) 23% 6% (12%) (2%) 68% NM NM BasWare Oyj 22.88 75% 294 278 7% 9% 11% 11% 11% 16% 48% 42% 49%ClickSoftware Technologies Ltd. 8.34 92% 273 255 15% 16% 20% 10% 5% 6% 74% 97% 97%Median 95% $736 $691 15% 16% 20% 11% 25% 27% 46% 61% 62%Mean 92% $2,453 $2,266 17% 20% 19% 9% 15% 20% 37% 62% 64%
Human Capital ManagementWorkday, Inc. $64.09 93% $11,088 $10,890 104% 60% 51% (32%) (22%) (13%) NM NM NM Concur Technologies, Inc. 81.38 97% 4,578 4,611 25% 24% 23% 10% 22% 22% (41%) 50% 48%The Ultimate Software Group, Inc. 117.29 100% 3,366 3,304 23% 23% 22% 12% 14% 21% 35% 71% 52%Cornerstone OnDemand, Inc. 43.30 95% 2,406 2,336 61% 55% 40% (23%) (0%) 4% NM NM 7%Callidus Software Inc. 6.59 100% 255 303 13% 12% 14% (17%) 7% 12% NM 26% 51%Median 97% $3,366 $3,304 25% 24% 23% (17%) 7% 12% (3%) 50% 50%Mean 97% $4,338 $4,289 45% 35% 30% (10%) 4% 9% (3%) 49% 40%
EBITDA and Net Margins Greater than 100% or less than -100% are deemed non-material (“NM”) Source: Capital IQ as of 6/28/13
11
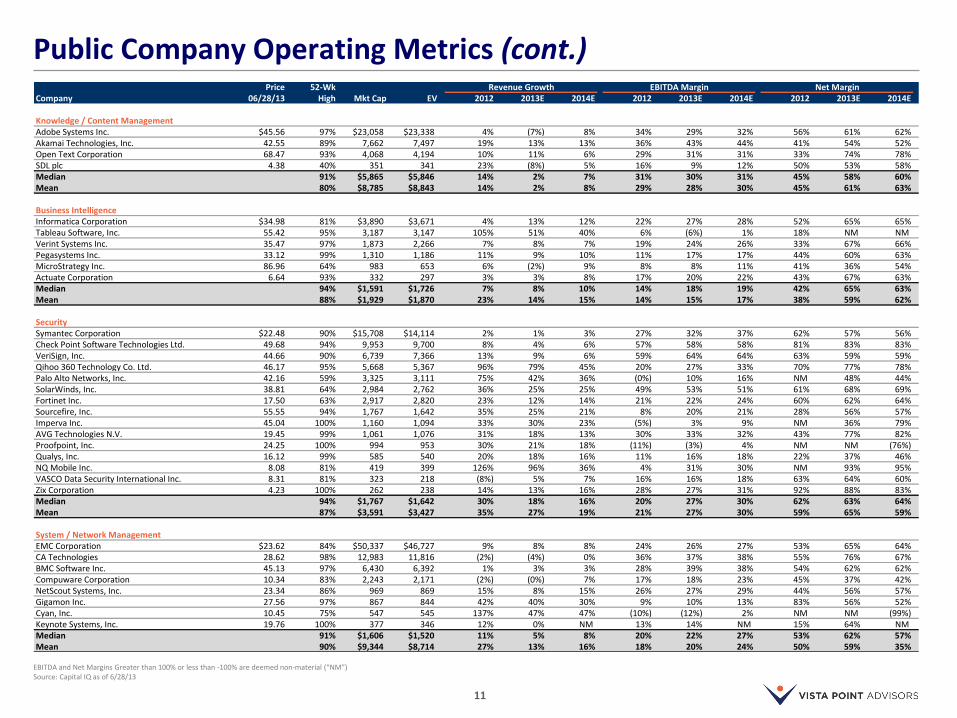
Public Company Operating Metrics (cont.)
EBITDA and Net Margins Greater than 100% or less than -100% are deemed non-material (“NM”) Source: Capital IQ as of 6/28/13
Price 52-Wk Revenue Growth EBITDA Margin Net Margin 52 Week
Company 06/28/13 High Mkt Cap EV 2012 2013E 2014E 2012 2013E 2014E 2012 2013E 2014E
Knowledge / Content ManagementAdobe Systems Inc. $45.56 97% $23,058 $23,338 4% (7%) 8% 34% 29% 32% 56% 61% 62%Akamai Technologies, Inc. 42.55 89% 7,662 7,497 19% 13% 13% 36% 43% 44% 41% 54% 52%Open Text Corporation 68.47 93% 4,068 4,194 10% 11% 6% 29% 31% 31% 33% 74% 78%SDL plc 4.38 40% 351 341 23% (8%) 5% 16% 9% 12% 50% 53% 58%Median 91% $5,865 $5,846 14% 2% 7% 31% 30% 31% 45% 58% 60%Mean 80% $8,785 $8,843 14% 2% 8% 29% 28% 30% 45% 61% 63%
Business IntelligenceInformatica Corporation $34.98 81% $3,890 $3,671 4% 13% 12% 22% 27% 28% 52% 65% 65%Tableau Software, Inc. 55.42 95% 3,187 3,147 105% 51% 40% 6% (6%) 1% 18% NM NM Verint Systems Inc. 35.47 97% 1,873 2,266 7% 8% 7% 19% 24% 26% 33% 67% 66%Pegasystems Inc. 33.12 99% 1,310 1,186 11% 9% 10% 11% 17% 17% 44% 60% 63%MicroStrategy Inc. 86.96 64% 983 653 6% (2%) 9% 8% 8% 11% 41% 36% 54%Actuate Corporation 6.64 93% 332 297 3% 3% 8% 17% 20% 22% 43% 67% 63%Median 94% $1,591 $1,726 7% 8% 10% 14% 18% 19% 42% 65% 63%Mean 88% $1,929 $1,870 23% 14% 15% 14% 15% 17% 38% 59% 62%
SecuritySymantec Corporation $22.48 90% $15,708 $14,114 2% 1% 3% 27% 32% 37% 62% 57% 56%Check Point Software Technologies Ltd. 49.68 94% 9,953 9,700 8% 4% 6% 57% 58% 58% 81% 83% 83%VeriSign, Inc. 44.66 90% 6,739 7,366 13% 9% 6% 59% 64% 64% 63% 59% 59%Qihoo 360 Technology Co. Ltd. 46.17 95% 5,668 5,367 96% 79% 45% 20% 27% 33% 70% 77% 78%Palo Alto Networks, Inc. 42.16 59% 3,325 3,111 75% 42% 36% (0%) 10% 16% NM 48% 44%SolarWinds, Inc. 38.81 64% 2,984 2,762 36% 25% 25% 49% 53% 51% 61% 68% 69%Fortinet Inc. 17.50 63% 2,917 2,820 23% 12% 14% 21% 22% 24% 60% 62% 64%Sourcefire, Inc. 55.55 94% 1,767 1,642 35% 25% 21% 8% 20% 21% 28% 56% 57%Imperva Inc. 45.04 100% 1,160 1,094 33% 30% 23% (5%) 3% 9% NM 36% 79%AVG Technologies N.V. 19.45 99% 1,061 1,076 31% 18% 13% 30% 33% 32% 43% 77% 82%Proofpoint, Inc. 24.25 100% 994 953 30% 21% 18% (11%) (3%) 4% NM NM (76%)Qualys, Inc. 16.12 99% 585 540 20% 18% 16% 11% 16% 18% 22% 37% 46%NQ Mobile Inc. 8.08 81% 419 399 126% 96% 36% 4% 31% 30% NM 93% 95%VASCO Data Security International Inc. 8.31 81% 323 218 (8%) 5% 7% 16% 16% 18% 63% 64% 60%Zix Corporation 4.23 100% 262 238 14% 13% 16% 28% 27% 31% 92% 88% 83%Median 94% $1,767 $1,642 30% 18% 16% 20% 27% 30% 62% 63% 64%Mean 87% $3,591 $3,427 35% 27% 19% 21% 27% 30% 59% 65% 59%
System / Network ManagementEMC Corporation $23.62 84% $50,337 $46,727 9% 8% 8% 24% 26% 27% 53% 65% 64%CA Technologies 28.62 98% 12,983 11,816 (2%) (4%) 0% 36% 37% 38% 55% 76% 67%BMC Software Inc. 45.13 97% 6,430 6,392 1% 3% 3% 28% 39% 38% 54% 62% 62%Compuware Corporation 10.34 83% 2,243 2,171 (2%) (0%) 7% 17% 18% 23% 45% 37% 42%NetScout Systems, Inc. 23.34 86% 969 869 15% 8% 15% 26% 27% 29% 44% 56% 57%Gigamon Inc. 27.56 97% 867 844 42% 40% 30% 9% 10% 13% 83% 56% 52%Cyan, Inc. 10.45 75% 547 545 137% 47% 47% (10%) (12%) 2% NM NM (99%)Keynote Systems, Inc. 19.76 100% 377 346 12% 0% NM 13% 14% NM 15% 64% NM Median 91% $1,606 $1,520 11% 5% 8% 20% 22% 27% 53% 62% 57%Mean 90% $9,344 $8,714 27% 13% 16% 18% 20% 24% 50% 59% 35%
12
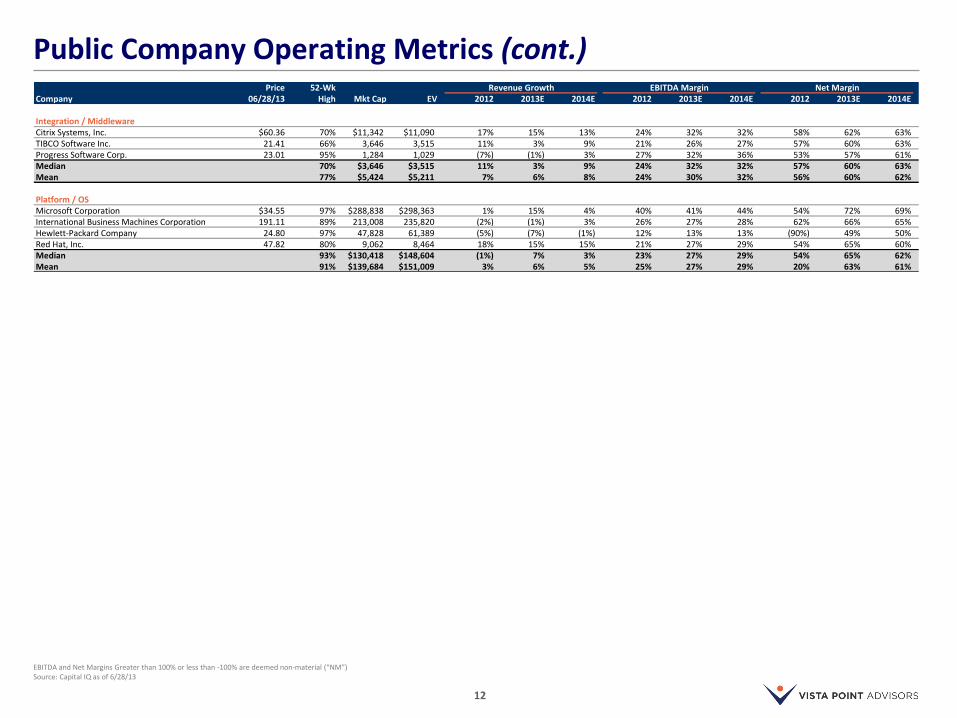
Public Company Operating Metrics (cont.)
EBITDA and Net Margins Greater than 100% or less than -100% are deemed non-material (“NM”) Source: Capital IQ as of 6/28/13
Price 52-Wk Revenue Growth EBITDA Margin Net Margin 52 Week
Company 06/28/13 High Mkt Cap EV 2012 2013E 2014E 2012 2013E 2014E 2012 2013E 2014E
Integration / MiddlewareCitrix Systems, Inc. $60.36 70% $11,342 $11,090 17% 15% 13% 24% 32% 32% 58% 62% 63%TIBCO Software Inc. 21.41 66% 3,646 3,515 11% 3% 9% 21% 26% 27% 57% 60% 63%Progress Software Corp. 23.01 95% 1,284 1,029 (7%) (1%) 3% 27% 32% 36% 53% 57% 61%Median 70% $3,646 $3,515 11% 3% 9% 24% 32% 32% 57% 60% 63%Mean 77% $5,424 $5,211 7% 6% 8% 24% 30% 32% 56% 60% 62%
Platform / OSMicrosoft Corporation $34.55 97% $288,838 $298,363 1% 15% 4% 40% 41% 44% 54% 72% 69%International Business Machines Corporation 191.11 89% 213,008 235,820 (2%) (1%) 3% 26% 27% 28% 62% 66% 65%Hewlett-Packard Company 24.80 97% 47,828 61,389 (5%) (7%) (1%) 12% 13% 13% (90%) 49% 50%Red Hat, Inc. 47.82 80% 9,062 8,464 18% 15% 15% 21% 27% 29% 54% 65% 60%Median 93% $130,418 $148,604 (1%) 7% 3% 23% 27% 29% 54% 65% 62%Mean 91% $139,684 $151,009 3% 6% 5% 25% 27% 29% 20% 63% 61%
13
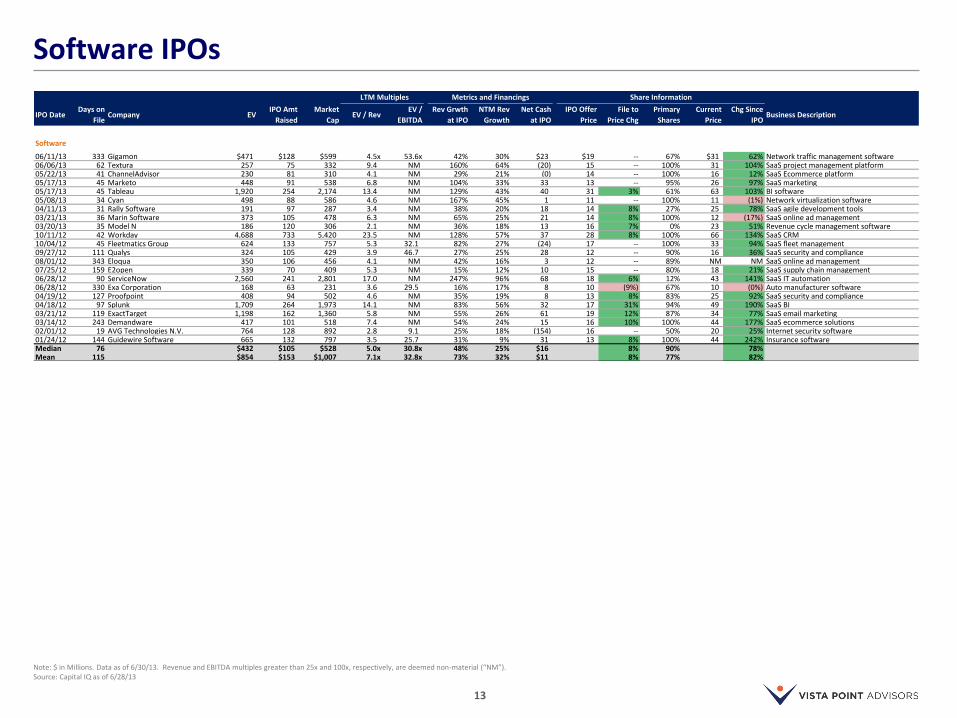
Software IPOs
LTM Multiples Metrics and Financings Share Information
IPO DateDays on
FileCompany EV
IPO Amt
Raised
Market
CapEV / Rev
EV /
EBITDA
Rev Grwth
at IPO
NTM Rev
Growth
Net Cash
at IPO
IPO Offer
Price
File to
Price Chg
Primary
Shares
Current
Price
Chg Since
IPOBusiness Description
Software
06/11/13 333 Gigamon $471 $128 $599 4.5x 53.6x 42% 30% $23 $19 -- 67% $31 62% Network traffic management software06/06/13 62 Textura 257 75 332 9.4 NM 160% 64% (20) 15 -- 100% 31 104% SaaS project management platform05/22/13 41 ChannelAdvisor 230 81 310 4.1 NM 29% 21% (0) 14 -- 100% 16 12% SaaS Ecommerce platform05/17/13 45 Marketo 448 91 538 6.8 NM 104% 33% 33 13 -- 95% 26 97% SaaS marketing 05/17/13 45 Tableau 1,920 254 2,174 13.4 NM 129% 43% 40 31 3% 61% 63 103% BI software05/08/13 34 Cyan 498 88 586 4.6 NM 167% 45% 1 11 -- 100% 11 (1%) Network virtualization software04/11/13 31 Rally Software 191 97 287 3.4 NM 38% 20% 18 14 8% 27% 25 78% SaaS agile development tools03/21/13 36 Marin Software 373 105 478 6.3 NM 65% 25% 21 14 8% 100% 12 (17%) SaaS online ad management03/20/13 35 Model N 186 120 306 2.1 NM 36% 18% 13 16 7% 0% 23 51% Revenue cycle management software10/11/12 42 Workday 4,688 733 5,420 23.5 NM 128% 57% 37 28 8% 100% 66 134% SaaS CRM10/04/12 45 Fleetmatics Group 624 133 757 5.3 32.1 82% 27% (24) 17 -- 100% 33 94% SaaS fleet management09/27/12 111 Qualys 324 105 429 3.9 46.7 27% 25% 28 12 -- 90% 16 36% SaaS security and compliance08/01/12 343 Eloqua 350 106 456 4.1 NM 42% 16% 3 12 -- 89% NM NM SaaS online ad management07/25/12 159 E2open 339 70 409 5.3 NM 15% 12% 10 15 -- 80% 18 21% SaaS supply chain management06/28/12 90 ServiceNow 2,560 241 2,801 17.0 NM 247% 96% 68 18 6% 12% 43 141% SaaS IT automation06/28/12 330 Exa Corporation 168 63 231 3.6 29.5 16% 17% 8 10 (9%) 67% 10 (0%) Auto manufacturer software04/19/12 127 Proofpoint 408 94 502 4.6 NM 35% 19% 8 13 8% 83% 25 92% SaaS security and compliance04/18/12 97 Splunk 1,709 264 1,973 14.1 NM 83% 56% 32 17 31% 94% 49 190% SaaS BI03/21/12 119 ExactTarget 1,198 162 1,360 5.8 NM 55% 26% 61 19 12% 87% 34 77% SaaS email marketing03/14/12 243 Demandware 417 101 518 7.4 NM 54% 24% 15 16 10% 100% 44 177% SaaS ecommerce solutions02/01/12 19 AVG Technologies N.V. 764 128 892 2.8 9.1 25% 18% (154) 16 -- 50% 20 25% Internet security software01/24/12 144 Guidewire Software 665 132 797 3.5 25.7 31% 9% 31 13 8% 100% 44 242% Insurance softwareMedian 76 $432 $105 $528 5.0x 30.8x 48% 25% $16 8% 90% 78%Mean 115 $854 $153 $1,007 7.1x 32.8x 73% 32% $11 8% 77% 82%
Note: $ in Millions. Data as of 6/30/13. Revenue and EBITDA multiples greater than 25x and 100x, respectively, are deemed non-material (“NM”). Source: Capital IQ as of 6/28/13
14
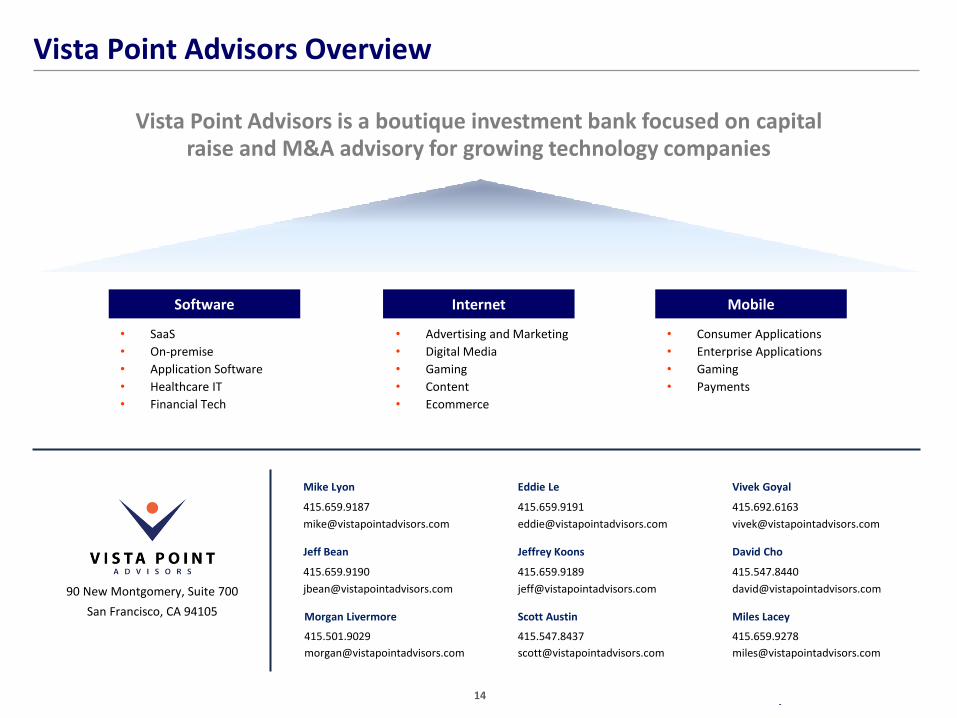
Vista Point Advisors Overview
Mike Lyon
415.659.9187
Jeff Bean
415.659.9190
Morgan Livermore
415.501.9029
Vivek Goyal
415.692.6163
David Cho
415.547.8440
Miles Lacey
415.659.9278
Eddie Le
415.659.9191
Scott Austin
415.547.8437
Jeffrey Koons
415.659.9189
[email protected] 90 New Montgomery, Suite 700
San Francisco, CA 94105
• SaaS
• On-premise
• Application Software
• Healthcare IT
• Financial Tech
• Advertising and Marketing
• Digital Media
• Gaming
• Content
• Ecommerce
• Consumer Applications
• Enterprise Applications
• Gaming
• Payments
Software Internet Mobile
Vista Point Advisors is a boutique investment bank focused on capital raise and M&A advisory for growing technology companies


![Investor Update Q2 FY16 / H1 FY16 [Company Update]](https://img.pdfslide.us/doc/110x75/577ca80a1a28abea748caad0/investor-update-q2-fy16-h1-fy16-company-update.jpg)
![Result update presentation Q2 FY16 [Company Update]](https://img.pdfslide.us/doc/110x75/577ca7c81a28abea748c8e41/result-update-presentation-q2-fy16-company-update.jpg)