Embed Size (px)
DESCRIPTION
Columbus MSA employment was up 8,200 (0.8 percent) from March to June, ahead of Ohio’s increase of 0.4 percent and the U.S. increase of 0.6 percent, according to the Q2 economic update report produced by Columbus 2020. Going into the second half of the year, unemployment in the Columbus Region continued to decline at 4.6 percent, compared to June state and national rates of 5.5 and 6.1, respectively.
Citation preview

QUARTERLY ECONOMIC
UPDATEQ2 2014
columbusregion.com 614-225-6063
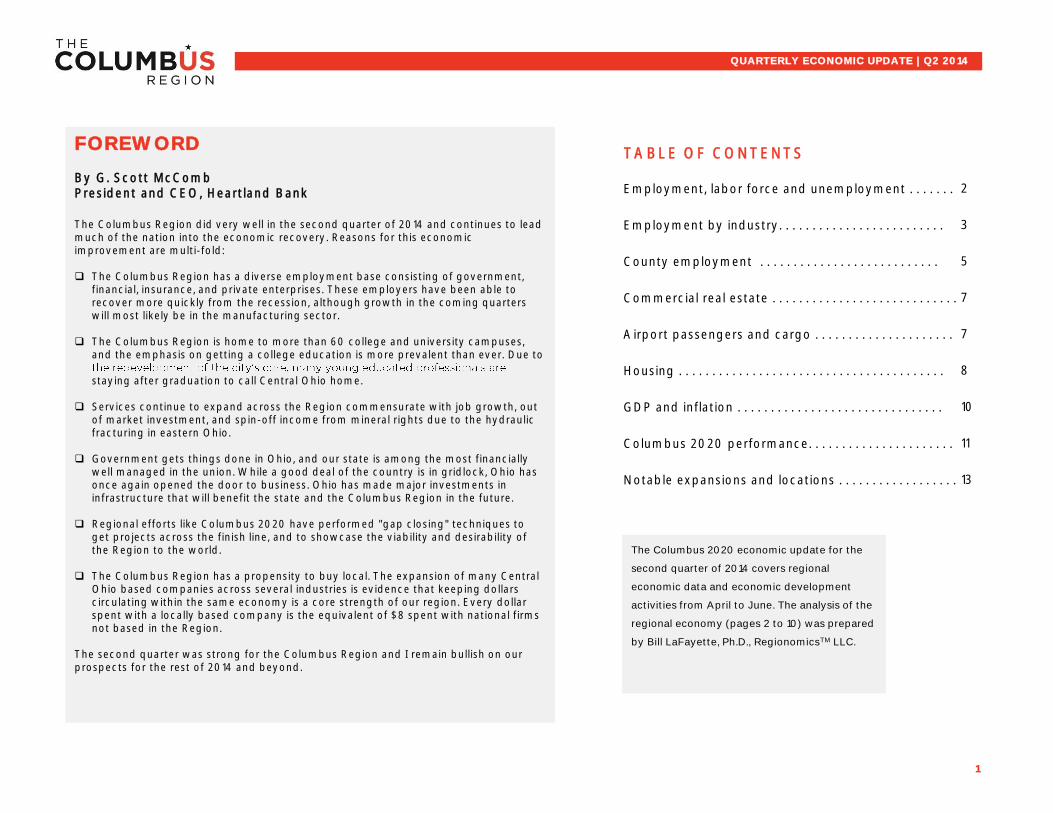
TABLE OF CONTENTS
Employment, labor force and unemployment . . . . . . . . . . . .2
Employment by industry. . . . . . . . . . . . . . . . . . . . . . . . . 3
County employment . . . . . . . . . . . . . . . . . . . . . . . . . . . 5
Commercial real estate . . . . . . . . . . . . . . . . . . . . . . . . . . . . .7
Airport passengers and cargo . . . . . . . . . . . . . . . . . . . . . 7
Housing . . . . . . . . . . . . . . . . . . . . . . . . . . . . . . . . . . . . . . . . 8
GDP and inflation . . . . . . . . . . . . . . . . . . . . . . . . . . . . . . . 10
Columbus 2020 performance. . . . . . . . . . . . . . . . . . . . . . 11
Notable expansions and locations . . . . . . . . . . . . . . . . . . 13
1
QUARTERLY ECONOMIC UPDATE | Q2 2014
The Columbus 2020 economic update for the
second quarter of 2014 covers regional
economic data and economic development
activities from April to June. The analysis of the
regional economy (pages 2 to 10) was prepared
by Bill LaFayette, Ph.D., RegionomicsTM LLC.
FOREWORD By G. Scott McComb President and CEO, Heartland Bank
The Columbus Region did very well in the second quarter of 2014 and continues to lead much of the nation into the economic recovery. Reasons for this economic improvement are multi-fold: The Columbus Region has a diverse employment base consisting of government,
financial, insurance, and private enterprises. These employers have been able to recover more quickly from the recession, although growth in the coming quarters will most likely be in the manufacturing sector.
The Columbus Region is home to more than 60 college and university campuses, and the emphasis on getting a college education is more prevalent than ever. Due to
staying after graduation to call Central Ohio home.
Services continue to expand across the Region commensurate with job growth, out of market investment, and spin-off income from mineral rights due to the hydraulic fracturing in eastern Ohio.
Government gets things done in Ohio, and our state is among the most financially well managed in the union. While a good deal of the country is in gridlock, Ohio has once again opened the door to business. Ohio has made major investments in infrastructure that will benefit the state and the Columbus Region in the future.
Regional efforts like Columbus 2020 have performed "gap closing" techniques to get projects across the finish line, and to showcase the viability and desirability of the Region to the world.
The Columbus Region has a propensity to buy local. The expansion of many Central Ohio based companies across several industries is evidence that keeping dollars circulating within the same economy is a core strength of our region. Every dollar spent with a locally based company is the equivalent of $8 spent with national firms not based in the Region.
The second quarter was strong for the Columbus Region and I remain bullish on our prospects for the rest of 2014 and beyond.
TOTAL PAYROLL EMPLOYMENT
Source: Current Employment Statistics, U.S. Bureau of Labor Statistics. Source: Local Area Unemployment Statistics, Bureau of Labor Statistics.
Seasonal adjustment of MSA employment by Regionomics LLC. Seasonal adjustment of regional rate by Regionomics LLC.
COLUMBUS REGION LABOR FORCE
Source: Local Area Unemployment Statistics, Bureau of Labor Statistics.
Seasonal adjustment of regional rate by Regionomics LLC.
2
QUARTERLY ECONOMIC UPDATE | Q2 2014
EMPLOYMENT, LABOR FORCE, UNEMPLOYMENT RATES
COLUMBUS REGION UNEMPLOYMENT
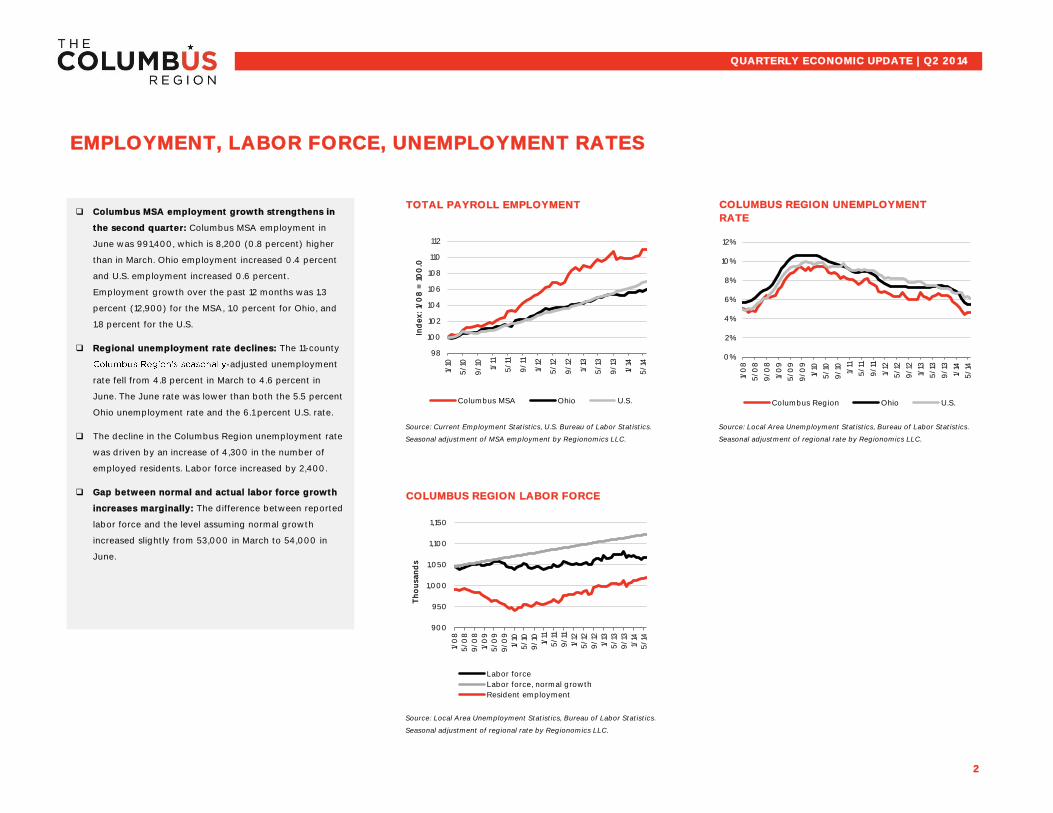
RATE Columbus MSA employment growth strengthens in
the second quarter: Columbus MSA employment in
June was 991,400, which is 8,200 (0.8 percent) higher
than in March. Ohio employment increased 0.4 percent
and U.S. employment increased 0.6 percent.
Employment growth over the past 12 months was 1.3
percent (12,900) for the MSA, 1.0 percent for Ohio, and
1.8 percent for the U.S.
Regional unemployment rate declines: The 11-county
-adjusted unemployment
rate fell from 4.8 percent in March to 4.6 percent in
June. The June rate was lower than both the 5.5 percent
Ohio unemployment rate and the 6.1 percent U.S. rate.
The decline in the Columbus Region unemployment rate
was driven by an increase of 4,300 in the number of
employed residents. Labor force increased by 2,400.
Gap between normal and actual labor force growth
increases marginally: The difference between reported
labor force and the level assuming normal growth
increased slightly from 53,000 in March to 54,000 in
June.
98
100
102
104
106
108
110
112
1/10
5/1
0
9/10
1/11
5/1
1
9/11
1/12
5/1
2
9/12
1/13
5/1
3
9/13
1/14
5/1
4
Ind
ex: 1/
08
= 1
00
.0
Columbus MSA Ohio U.S.
0%
2%
4%
6%
8%
10%
12%
1/0
8
5/0
8
9/0
8
1/0
9
5/0
9
9/0
9
1/10
5/1
0
9/10
1/11
5/1
1
9/11
1/12
5/1
2
9/12
1/13
5/1
3
9/13
1/14
5/1
4
Columbus Region Ohio U.S.
900
950
1,000
1,050
1,100
1,150
1/0
8
5/0
8
9/0
8
1/0
9
5/0
9
9/0
9
1/10
5/1
0
9/10
1/11
5/1
1
9/11
1/12
5/1
2
9/12
1/13
5/1
3
9/13
1/14
5/1
4
Th
ou
san
ds
Labor force
Labor force, normal growth
Resident employment
MANUFACTURING
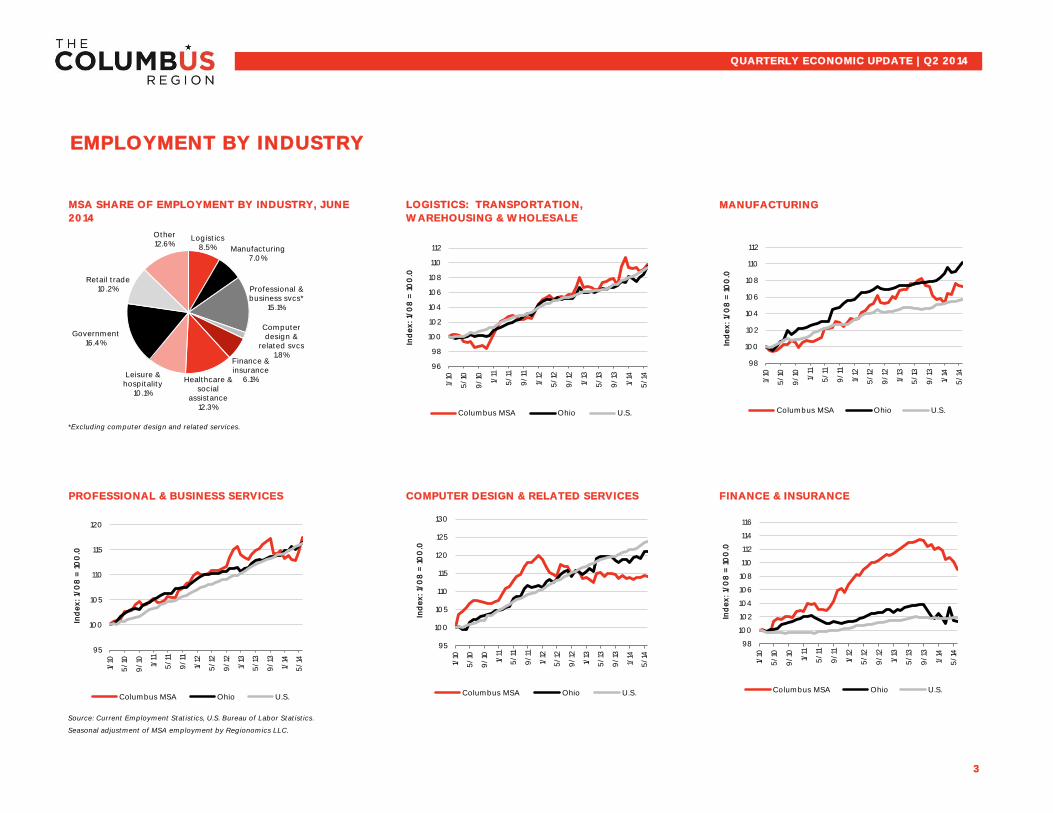
*Excluding computer design and related services.
PROFESSIONAL & BUSINESS SERVICES COMPUTER DESIGN & RELATED SERVICES FINANCE & INSURANCE
Source: Current Employment Statistics, U.S. Bureau of Labor Statistics.
Seasonal adjustment of MSA employment by Regionomics LLC.
3
QUARTERLY ECONOMIC UPDATE | Q2 2014
EMPLOYMENT BY INDUSTRY
LOGISTICS: TRANSPORTATION,
WAREHOUSING & WHOLESALE
MSA SHARE OF EMPLOYMENT BY INDUSTRY, JUNE
2014
Logistics 8.5% Manufacturing
7.0%
Professional & business svcs*
15.1%
Computer design &
related svcs 1.8%
Finance & insurance
6.1% Healthcare & social
assistance 12.3%
Leisure & hospitality
10.1%
Government 16.4%
Retail trade 10.2%
Other 12.6%
96
98
100
102
104
106
108
110
112
1/10
5/1
0
9/10
1/11
5/1
1
9/11
1/12
5/1
2
9/12
1/13
5/1
3
9/13
1/14
5/1
4
Ind
ex: 1/
08
= 1
00
.0
Columbus MSA Ohio U.S.
98
100
102
104
106
108
110
112
1/10
5/1
0
9/10
1/11
5/1
1
9/11
1/12
5/1
2
9/12
1/13
5/1
3
9/13
1/14
5/1
4
Ind
ex: 1/
08
= 1
00
.0
Columbus MSA Ohio U.S.
95
100
105
110
115
120
1/10
5/1
0
9/10
1/11
5/1
1
9/11
1/12
5/1
2
9/12
1/13
5/1
3
9/13
1/14
5/1
4
Ind
ex:
1/0
8 =
10
0.0
Columbus MSA Ohio U.S.
98
100
102
104
106
108
110
112
114
116
1/10
5/1
0
9/10
1/11
5/1
1
9/11
1/12
5/1
2
9/12
1/13
5/1
3
9/13
1/14
5/1
4
Ind
ex: 1/
08
= 1
00
.0
Columbus MSA Ohio U.S.
95
100
105
110
115
120
125
130
1/10
5/1
0
9/10
1/11
5/1
1
9/11
1/12
5/1
2
9/12
1/13
5/1
3
9/13
1/14
5/1
4
Ind
ex: 1/
08
= 1
00
.0
Columbus MSA Ohio U.S.
LEISURE & HOSPITALITY
QUARTERLY EMPLOYMENT CHANGE BY INDUSTRY GOVERNMENT RETAIL TRADE
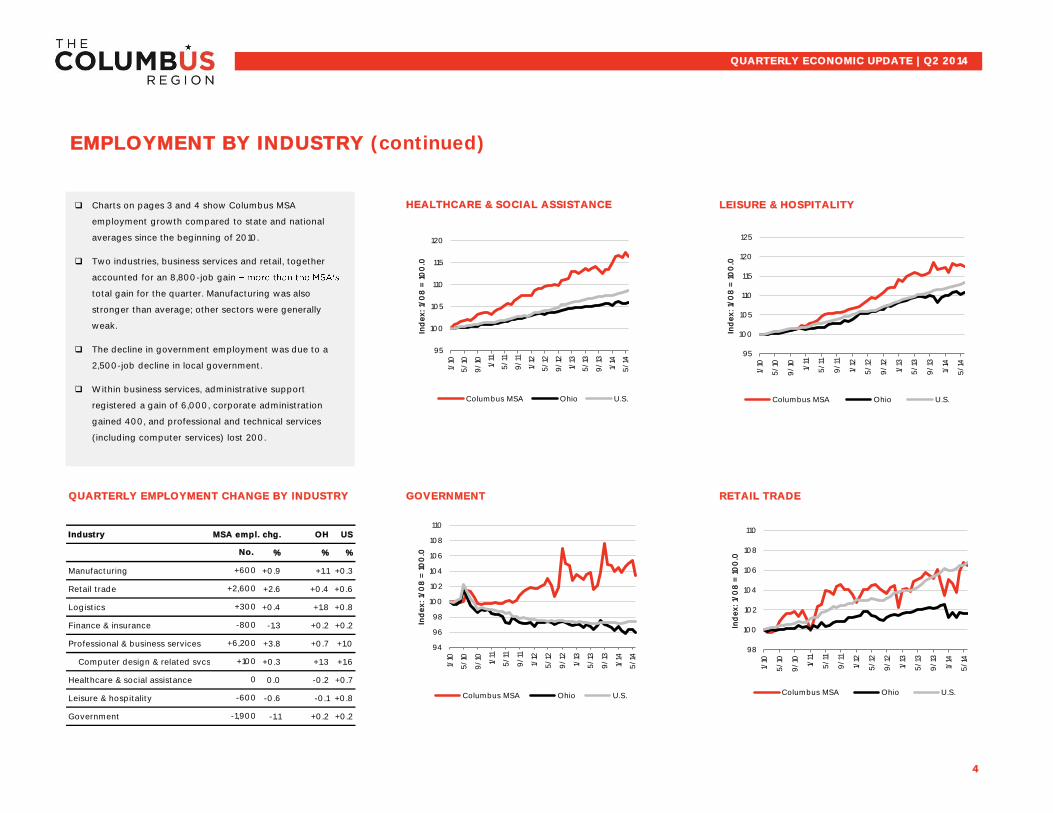
Industry MSA empl. chg. OH US
% % %
Manufacturing +0.9 +1.1 +0.3
Retail trade +2.6 +0.4 +0.6
Logistics +0.4 +1.8 +0.8
Finance & insurance -1.3 +0.2 +0.2
Professional & business services +3.8 +0.7 +1.0
Computer design & related svcs. +0.3 +1.3 +1.6
Healthcare & social assistance 0.0 -0.2 +0.7
Leisure & hospitality -0.6 -0.1 +0.8
Government -1.1 +0.2 +0.2
4
-1,900
0
+6,200
-600
HEALTHCARE & SOCIAL ASSISTANCE
QUARTERLY ECONOMIC UPDATE | Q2 2014
EMPLOYMENT BY INDUSTRY (continued)
+100
-800
+2,600
No.
+300
+600
Charts on pages 3 and 4 show Columbus MSA
employment growth compared to state and national
averages since the beginning of 2010.
Two industries, business services and retail, together
accounted for an 8,800-job gain
total gain for the quarter. Manufacturing was also
stronger than average; other sectors were generally
weak.
The decline in government employment was due to a
2,500-job decline in local government.
Within business services, administrative support
registered a gain of 6,000, corporate administration
gained 400, and professional and technical services
(including computer services) lost 200.
95
100
105
110
115
120
1/10
5/1
0
9/10
1/11
5/1
1
9/11
1/12
5/1
2
9/12
1/13
5/1
3
9/13
1/14
5/1
4
Ind
ex: 1/
08
= 1
00
.0
Columbus MSA Ohio U.S.
95
100
105
110
115
120
125
1/10
5/1
0
9/10
1/11
5/1
1
9/11
1/12
5/1
2
9/12
1/13
5/1
3
9/13
1/14
5/1
4
Ind
ex:
1/0
8 =
10
0.0
Columbus MSA Ohio U.S.
94
96
98
100
102
104
106
108
110
1/10
5/1
0
9/10
1/11
5/1
1
9/11
1/12
5/1
2
9/12
1/13
5/1
3
9/13
1/14
5/1
4
Ind
ex:
1/0
8 =
10
0.0
Columbus MSA Ohio U.S.
98
100
102
104
106
108
110
1/10
5/1
0
9/10
1/11
5/1
1
9/11
1/12
5/1
2
9/12
1/13
5/1
3
9/13
1/14
5/1
4
Ind
ex: 1/
08
= 1
00
.0
Columbus MSA Ohio U.S.
FAIRFIELD COUNTY
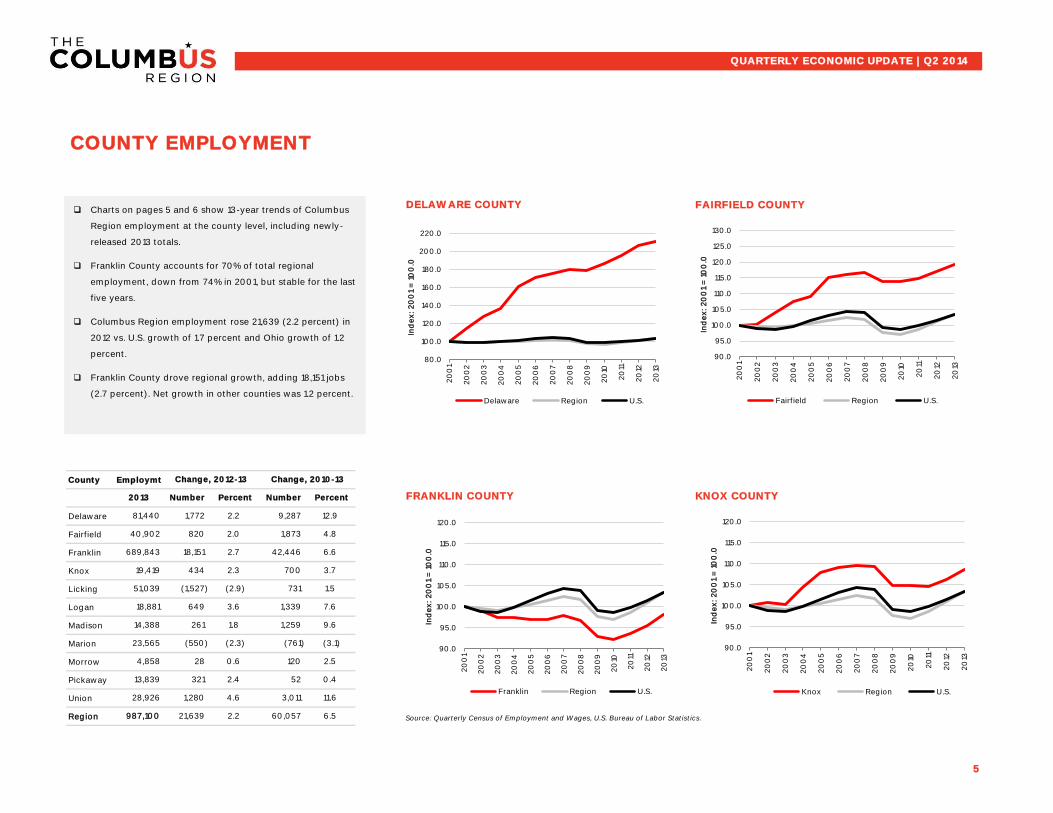
County Employmt.
FRANKLIN COUNTY KNOX COUNTY
Delaware
Fairfield
Franklin
Knox
Licking
Logan
Madison
Marion
Morrow
Pickaway
Union
Region Source: Quarterly Census of Employment and Wages, U.S. Bureau of Labor Statistics.
5
Change, 2010-13Change, 2012-13
Percent
12.9
4.8
6.6
3.7
(2.3)
2013 Number
81,440 1,772 9,287
40,902 820 1,873
Number
2.0
2.7
2.3
(2.9)
3.6
13,839 321 52
261 1,259
1,339
1.8
51,039 (1,527) 731
18,881 649
1.5
28,926 1,280 3,011
987,100 21,639 60,057
23,565
9.6
Percent
2.2
42,446
14,388
4,858 28 1200.6
2.2 6.5
(550) (761)
2.4
4.6
(3.1)
2.5
0.4
11.6
7.6
COUNTY EMPLOYMENT
DELAWARE COUNTY
QUARTERLY ECONOMIC UPDATE | Q2 2014
689,843 18,151
19,419 434 700
Charts on pages 5 and 6 show 13-year trends of Columbus
Region employment at the county level, including newly-
released 2013 totals.
Franklin County accounts for 70% of total regional
employment, down from 74% in 2001, but stable for the last
five years.
Columbus Region employment rose 21,639 (2.2 percent) in
2012 vs. U.S. growth of 1.7 percent and Ohio growth of 1.2
percent.
Franklin County drove regional growth, adding 18,151 jobs
(2.7 percent). Net growth in other counties was 1.2 percent.
80.0
100.0
120.0
140.0
160.0
180.0
200.0
220.0
20
01
20
02
20
03
20
04
20
05
20
06
20
07
20
08
20
09
20
10
20
11
20
12
20
13
Ind
ex: 2
00
1 =
10
0.0
Delaware Region U.S.
90.0
95.0
100.0
105.0
110.0
115.0
120.0
125.0
130.0
20
01
20
02
20
03
20
04
20
05
20
06
20
07
20
08
20
09
20
10
20
11
20
12
20
13
Ind
ex: 2
00
1 =
10
0.0
Fairfield Region U.S.
90.0
95.0
100.0
105.0
110.0
115.0
120.0
20
01
20
02
20
03
20
04
20
05
20
06
20
07
20
08
20
09
20
10
20
11
20
12
20
13
Ind
ex: 2
00
1 =
10
0.0
Franklin Region U.S.
90.0
95.0
100.0
105.0
110.0
115.0
120.0
20
01
20
02
20
03
20
04
20
05
20
06
20
07
20
08
20
09
20
10
20
11
20
12
20
13
Ind
ex: 2
00
1 =
10
0.0
Knox Region U.S.
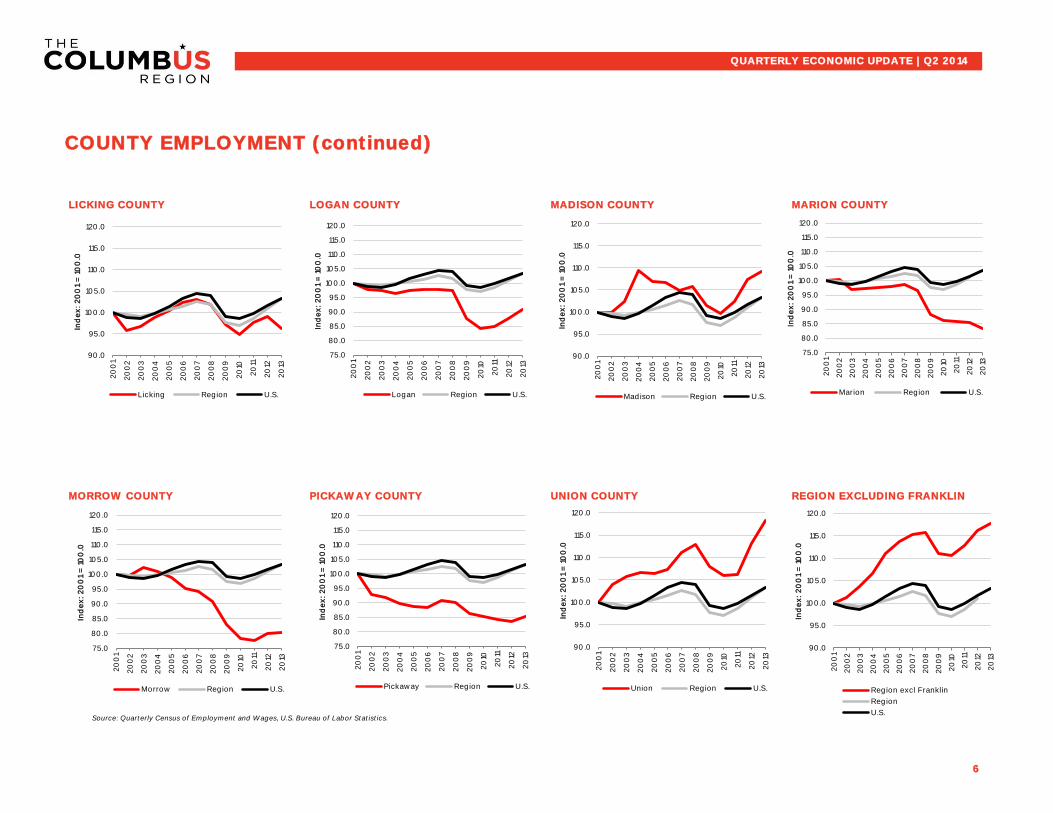
LICKING COUNTY LOGAN COUNTY MADISON COUNTY MARION COUNTY
EDUCATION & HEALTH SERVICESMORROW COUNTY PICKAWAY COUNTY UNION COUNTY REGION EXCLUDING FRANKLIN
Source: Quarterly Census of Employment and Wages, U.S. Bureau of Labor Statistics.
6
QUARTERLY ECONOMIC UPDATE | Q2 2014
COUNTY EMPLOYMENT (continued)
90.0
95.0
100.0
105.0
110.0
115.0
120.0
20
01
20
02
20
03
20
04
20
05
20
06
20
07
20
08
20
09
20
10
20
11
20
12
20
13
Ind
ex: 2
00
1 =
10
0.0
Licking Region U.S.
75.0
80.0
85.0
90.0
95.0
100.0
105.0
110.0
115.0
120.0
20
01
20
02
20
03
20
04
20
05
20
06
20
07
20
08
20
09
20
10
20
11
20
12
20
13
Ind
ex: 2
00
1 =
10
0.0
Logan Region U.S.
90.0
95.0
100.0
105.0
110.0
115.0
120.0
20
01
20
02
20
03
20
04
20
05
20
06
20
07
20
08
20
09
20
10
20
11
20
12
20
13
Ind
ex:
20
01
= 1
00
.0
Madison Region U.S.
75.0
80.0
85.0
90.0
95.0
100.0
105.0
110.0
115.0
120.0
20
01
20
02
20
03
20
04
20
05
20
06
20
07
20
08
20
09
20
10
20
11
20
12
20
13
Ind
ex: 2
00
1 =
10
0.0
Marion Region U.S.
75.0
80.0
85.0
90.0
95.0
100.0
105.0
110.0
115.0
120.0
20
01
20
02
20
03
20
04
20
05
20
06
20
07
20
08
20
09
20
10
20
11
20
12
20
13
Ind
ex: 2
00
1 =
10
0.0
Morrow Region U.S.
75.0
80.0
85.0
90.0
95.0
100.0
105.0
110.0
115.0
120.0
20
01
20
02
20
03
20
04
20
05
20
06
20
07
20
08
20
09
20
10
20
11
20
12
20
13
Ind
ex: 2
00
1 =
10
0.0
Pickaway Region U.S.
90.0
95.0
100.0
105.0
110.0
115.0
120.0
20
01
20
02
20
03
20
04
20
05
20
06
20
07
20
08
20
09
20
10
20
11
20
12
20
13
Ind
ex: 2
00
1 =
10
0.0
Union Region U.S.
90.0
95.0
100.0
105.0
110.0
115.0
120.0
20
01
20
02
20
03
20
04
20
05
20
06
20
07
20
08
20
09
20
10
20
11
20
12
20
13
Ind
ex:
20
01
= 1
00
.0
Region excl Franklin
Region
U.S.
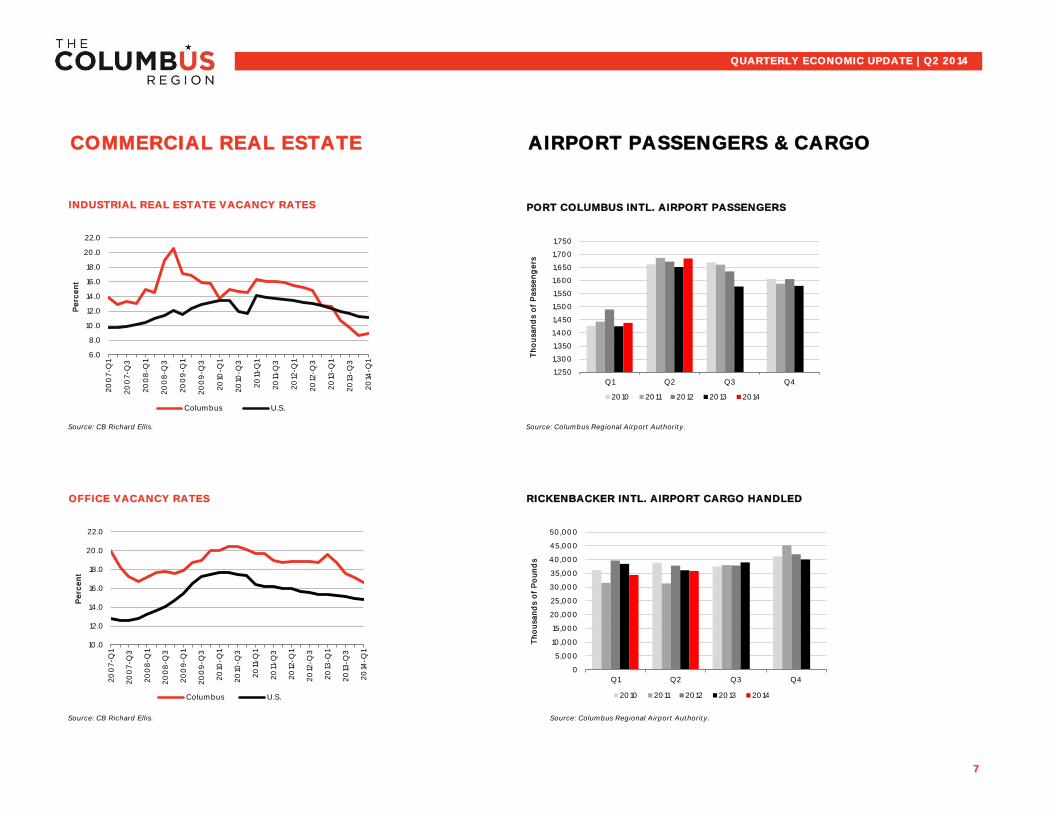
INDUSTRIAL REAL ESTATE VACANCY RATES PORT COLUMBUS INTL. AIRPORT PASSENGERS
Source: CB Richard Ellis. Source: Columbus Regional Airport Authority.
OFFICE VACANCY RATES RICKENBACKER INTL. AIRPORT CARGO HANDLED
Source: CB Richard Ellis. Source: Columbus Regional Airport Authority.
7
AIRPORT PASSENGERS & CARGOCOMMERCIAL REAL ESTATE
QUARTERLY ECONOMIC UPDATE | Q2 2014
6.0
8.0
10.0
12.0
14.0
16.0
18.0
20.0
22.0
20
07-Q
1
20
07-Q
3
20
08
-Q1
20
08
-Q3
20
09
-Q1
20
09
-Q3
20
10-Q
1
20
10-Q
3
20
11-Q
1
20
11-Q
3
20
12-Q
1
20
12-Q
3
20
13-Q
1
20
13-Q
3
20
14-Q
1
Pe
rce
nt
Columbus U.S.
1,250
1,300
1,350
1,400
1,450
1,500
1,550
1,600
1,650
1,700
1,750
Q1 Q2 Q3 Q4
Th
ou
san
ds o
f P
asse
ng
ers
2010 2011 2012 2013 2014
0
5,000
10,000
15,000
20,000
25,000
30,000
35,000
40,000
45,000
50,000
Q1 Q2 Q3 Q4
Th
ou
san
ds o
f P
ou
nd
s
2010 2011 2012 2013 2014
10.0
12.0
14.0
16.0
18.0
20.0
22.0
20
07-Q
1
20
07-Q
3
20
08
-Q1
20
08
-Q3
20
09
-Q1
20
09
-Q3
20
10-Q
1
20
10-Q
3
20
11-Q
1
20
11-Q
3
20
12-Q
1
20
12-Q
3
20
13-Q
1
20
13-Q
3
20
14-Q
1
Pe
rce
nt
Columbus U.S.
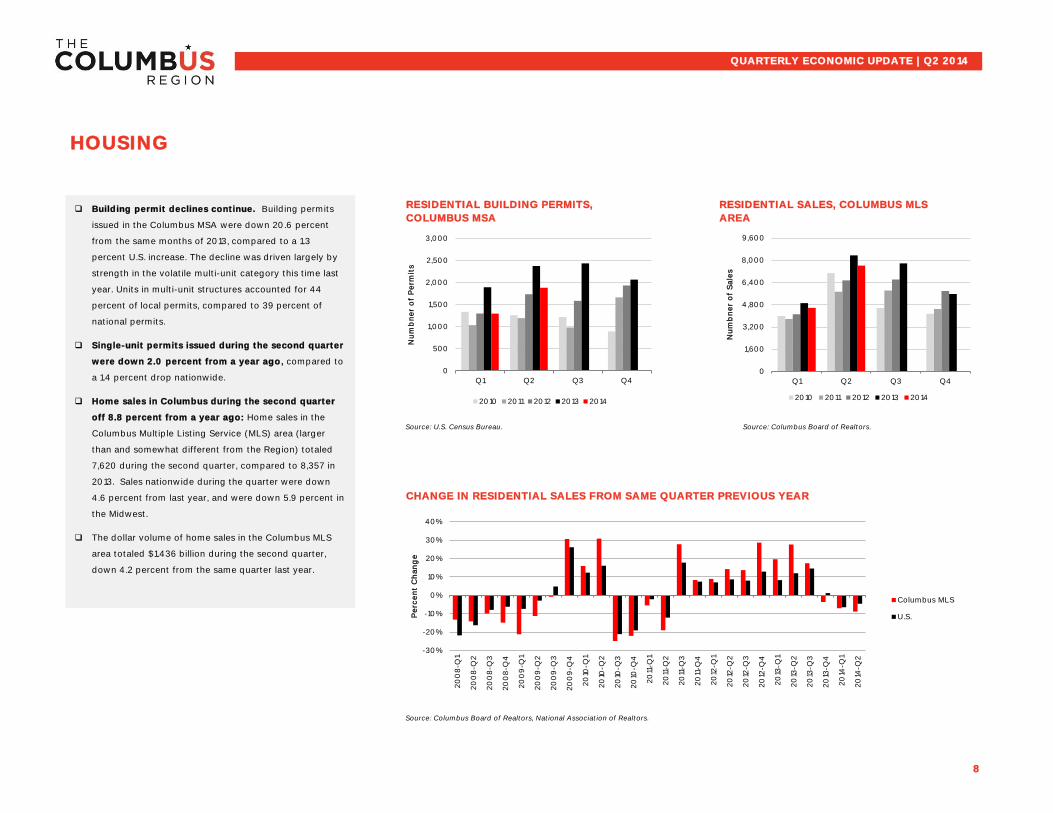
Source: U.S. Census Bureau. Source: Columbus Board of Realtors.
CHANGE IN RESIDENTIAL SALES FROM SAME QUARTER PREVIOUS YEAR
Source: Columbus Board of Realtors, National Association of Realtors.
8
RESIDENTIAL SALES, COLUMBUS MLS
AREA
RESIDENTIAL BUILDING PERMITS,
COLUMBUS MSA
QUARTERLY ECONOMIC UPDATE | Q2 2014
HOUSING
Building permit declines continue. Building permits
issued in the Columbus MSA were down 20.6 percent
from the same months of 2013, compared to a 1.3
percent U.S. increase. The decline was driven largely by
strength in the volatile multi-unit category this time last
year. Units in multi-unit structures accounted for 44
percent of local permits, compared to 39 percent of
national permits.
Single-unit permits issued during the second quarter
were down 2.0 percent from a year ago, compared to
a 1.4 percent drop nationwide.
Home sales in Columbus during the second quarter
off 8.8 percent from a year ago: Home sales in the
Columbus Multiple Listing Service (MLS) area (larger
than and somewhat different from the Region) totaled
7,620 during the second quarter, compared to 8,357 in
2013. Sales nationwide during the quarter were down
4.6 percent from last year, and were down 5.9 percent in
the Midwest.
The dollar volume of home sales in the Columbus MLS
area totaled $1.436 billion during the second quarter,
down 4.2 percent from the same quarter last year.
0
500
1,000
1,500
2,000
2,500
3,000
Q1 Q2 Q3 Q4
Nu
mb
ne
r o
f P
erm
its
2010 2011 2012 2013 2014
0
1,600
3,200
4,800
6,400
8,000
9,600
Q1 Q2 Q3 Q4
Nu
mb
ne
r o
f S
ale
s
2010 2011 2012 2013 2014
-30%
-20%
-10%
0%
10%
20%
30%
40%
20
08
-Q1
20
08
-Q2
20
08
-Q3
20
08
-Q4
20
09
-Q1
20
09
-Q2
20
09
-Q3
20
09
-Q4
20
10-Q
1
20
10-Q
2
20
10-Q
3
20
10-Q
4
20
11-Q
1
20
11-Q
2
20
11-Q
3
20
11-Q
4
20
12-Q
1
20
12-Q
2
20
12-Q
3
20
12-Q
4
20
13-Q
1
20
13-Q
2
20
13-Q
3
20
13-Q
4
20
14-Q
1
20
14-Q
2
Pe
rce
nt
Ch
an
ge
Columbus MLS
U.S.
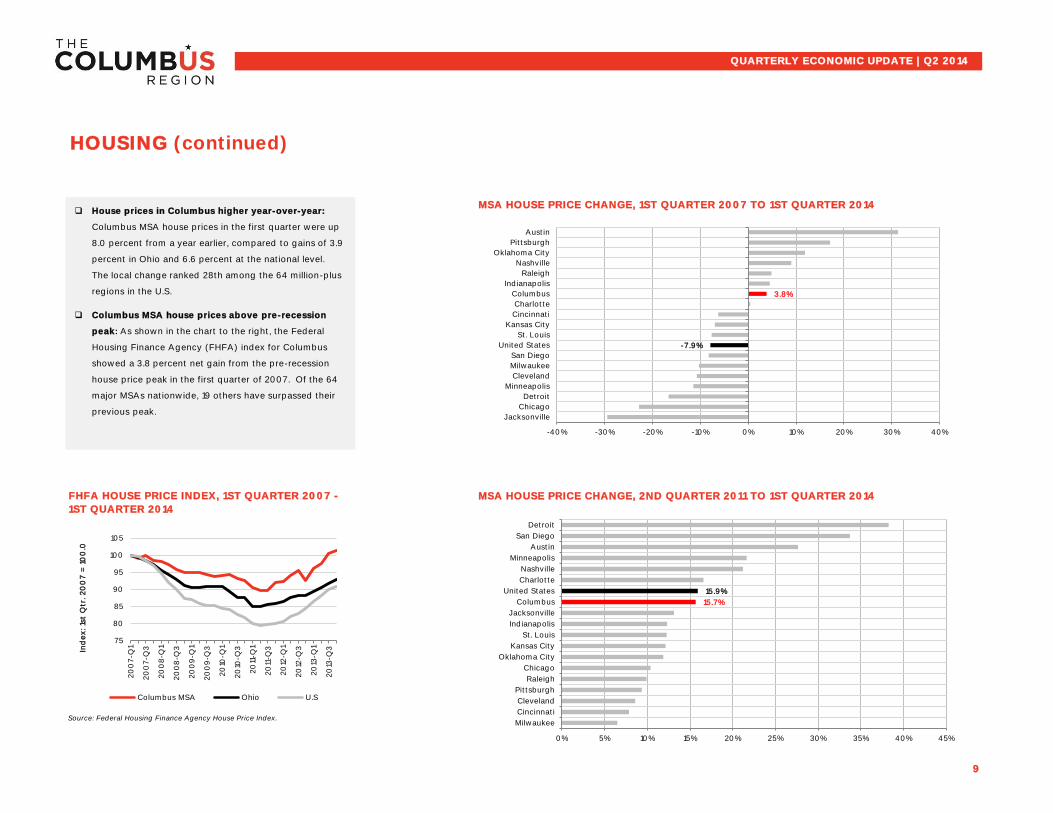
MSA HOUSE PRICE CHANGE, 1ST QUARTER 2007 TO 1ST QUARTER 2014
MSA HOUSE PRICE CHANGE, 2ND QUARTER 2011 TO 1ST QUARTER 2014
Source: Federal Housing Finance Agency House Price Index.
9
QUARTERLY ECONOMIC UPDATE | Q2 2014
HOUSING (continued)
FHFA HOUSE PRICE INDEX, 1ST QUARTER 2007 -
1ST QUARTER 2014
House prices in Columbus higher year-over-year:
Columbus MSA house prices in the first quarter were up
8.0 percent from a year earlier, compared to gains of 3.9
percent in Ohio and 6.6 percent at the national level.
The local change ranked 28th among the 64 million-plus
regions in the U.S.
Columbus MSA house prices above pre-recession
peak: As shown in the chart to the right, the Federal
Housing Finance Agency (FHFA) index for Columbus
showed a 3.8 percent net gain from the pre-recession
house price peak in the first quarter of 2007. Of the 64
major MSAs nationwide, 19 others have surpassed their
previous peak.
-7.9%
3.8%
-40% -30% -20% -10% 0% 10% 20% 30% 40%
Jacksonville
Chicago
Detroit
Minneapolis
Cleveland
Milwaukee
San Diego
United States
St. Louis
Kansas City
Cincinnati
Charlotte
Columbus
Indianapolis
Raleigh
Nashville
Oklahoma City
Pittsburgh
Austin
15.7%
15.9%
0% 5% 10% 15% 20% 25% 30% 35% 40% 45%
Milwaukee
Cincinnati
Cleveland
Pittsburgh
Raleigh
Chicago
Oklahoma City
Kansas City
St. Louis
Indianapolis
Jacksonville
Columbus
United States
Charlotte
Nashville
Minneapolis
Austin
San Diego
Detroit
75
80
85
90
95
100
105
20
07-Q
1
20
07-Q
3
20
08
-Q1
20
08
-Q3
20
09
-Q1
20
09
-Q3
20
10-Q
1
20
10-Q
3
20
11-Q
1
20
11-Q
3
20
12-Q
1
20
12-Q
3
20
13-Q
1
20
13-Q
3Ind
ex: 1s
t Q
tr. 2
00
7 =
10
0.0
Columbus MSA Ohio U.S
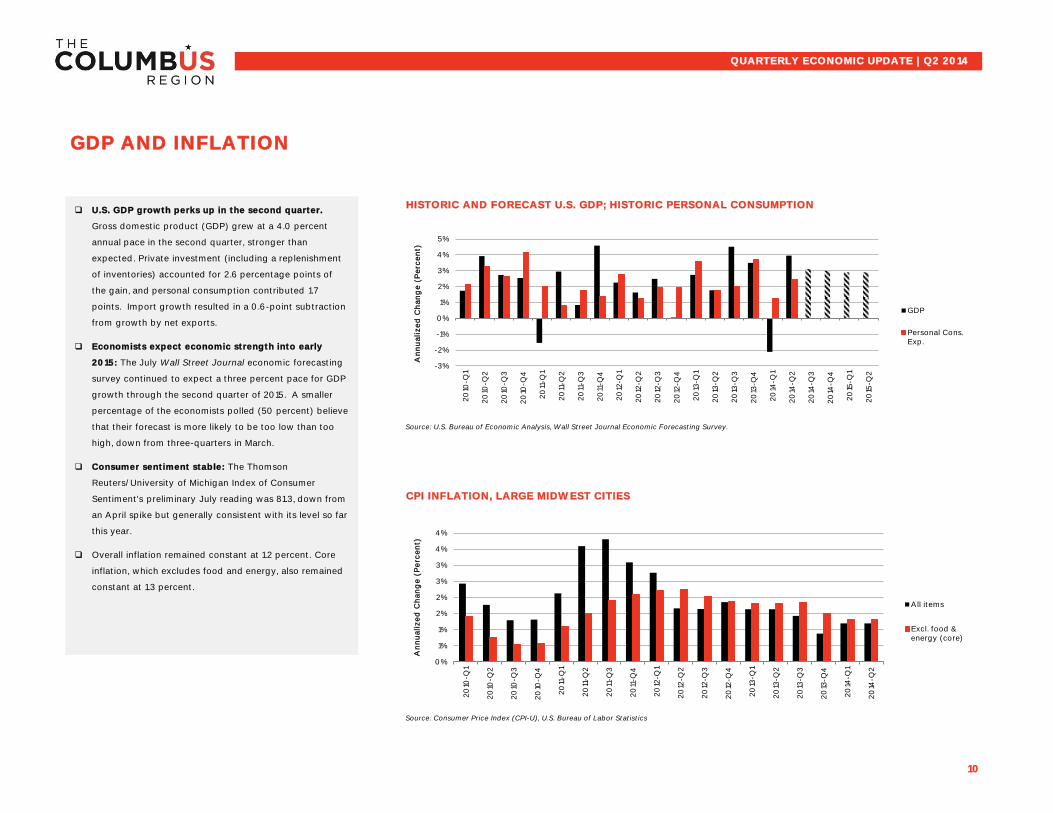
HISTORIC AND FORECAST U.S. GDP; HISTORIC PERSONAL CONSUMPTION
Source: U.S. Bureau of Economic Analysis, Wall Street Journal Economic Forecasting Survey.
CPI INFLATION, LARGE MIDWEST CITIES
Source: Consumer Price Index (CPI-U), U.S. Bureau of Labor Statistics
10
QUARTERLY ECONOMIC UPDATE | Q2 2014
GDP AND INFLATION
U.S. GDP growth perks up in the second quarter.
Gross domestic product (GDP) grew at a 4.0 percent
annual pace in the second quarter, stronger than
expected. Private investment (including a replenishment
of inventories) accounted for 2.6 percentage points of
the gain, and personal consumption contributed 1.7
points. Import growth resulted in a 0.6-point subtraction
from growth by net exports.
Economists expect economic strength into early
2015: The July Wall Street Journal economic forecasting
survey continued to expect a three percent pace for GDP
growth through the second quarter of 2015. A smaller
percentage of the economists polled (50 percent) believe
that their forecast is more likely to be too low than too
high, down from three-quarters in March.
Consumer sentiment stable: The Thomson
Reuters/University of Michigan Index of Consumer
Sentiment's preliminary July reading was 81.3, down from
an April spike but generally consistent with its level so far
this year.
Overall inflation remained constant at 1.2 percent. Core
inflation, which excludes food and energy, also remained
constant at 1.3 percent.
-3%
-2%
-1%
0%
1%
2%
3%
4%
5%
20
10-Q
1
20
10-Q
2
20
10-Q
3
20
10-Q
4
20
11-Q
1
20
11-Q
2
20
11-Q
3
20
11-Q
4
20
12-Q
1
20
12-Q
2
20
12-Q
3
20
12-Q
4
20
13-Q
1
20
13-Q
2
20
13-Q
3
20
13-Q
4
20
14-Q
1
20
14-Q
2
20
14-Q
3
20
14-Q
4
20
15-Q
1
20
15-Q
2
An
nu
alize
d C
han
ge
(P
erc
en
t)
GDP
Personal Cons.Exp.
0%
1%
1%
2%
2%
3%
3%
4%
4%
20
10-Q
1
20
10-Q
2
20
10-Q
3
20
10-Q
4
20
11-Q
1
20
11-Q
2
20
11-Q
3
20
11-Q
4
20
12-Q
1
20
12-Q
2
20
12-Q
3
20
12-Q
4
20
13-Q
1
20
13-Q
2
20
13-Q
3
20
13-Q
4
20
14-Q
1
20
14-Q
2
An
nu
alize
d C
han
ge
(P
erc
en
t)
All items
Excl. food &energy (core)
PROJECTS ACTIVE AT END OF EACH MONTH
11
PROJECTS ACTIVE AT END OF EACH MONTH
BY SECTOR
NUMBER OF PROJECTS STARTED
(2013 v. 2014)
FIRST-TIME VISITS (2013 v. 2014)
QUARTERLY ECONOMIC UPDATE | Q2 2014
COLUMBUS 2020 PERFORMANCE | PROJECTS JAN-JUN 2014
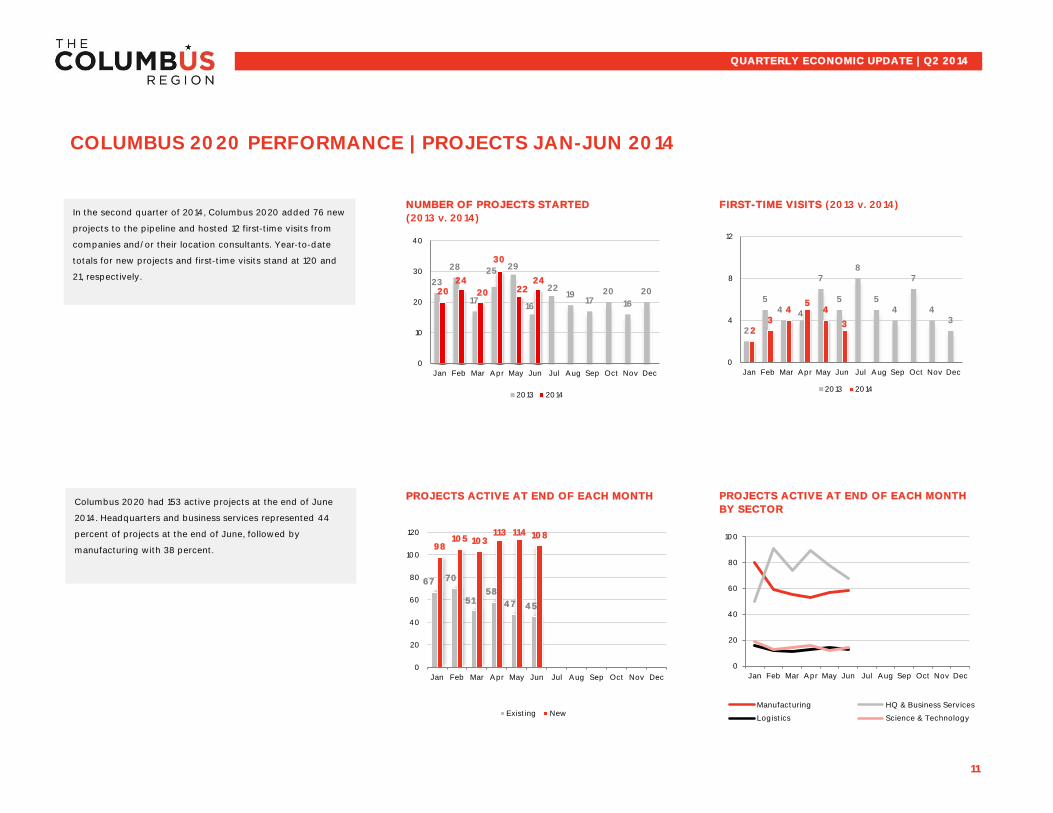
In the second quarter of 2014, Columbus 2020 added 76 new
projects to the pipeline and hosted 12 first-time visits from
companies and/or their location consultants. Year-to-date
totals for new projects and first-time visits stand at 120 and
21, respectively.
Columbus 2020 had 153 active projects at the end of June
2014. Headquarters and business services represented 44
percent of projects at the end of June, followed by
manufacturing with 38 percent.
67 70
51 58
47 45
98 105 103
113 114 108
0
20
40
60
80
100
120
Jan Feb Mar Apr May Jun Jul Aug Sep Oct Nov Dec
Existing New
0
20
40
60
80
100
Jan Feb Mar Apr May Jun Jul Aug Sep Oct Nov Dec
Manufacturing HQ & Business Services
Logistics Science & Technology
23
28
17
25 29
16
22 19
17 20
16
20 20 24
20
30
22 24
0
10
20
30
40
Jan Feb Mar Apr May Jun Jul Aug Sep Oct Nov Dec
2013 2014
2
5 4 4
7
5
8
5 4
7
4 3
2 3
4 5
4
3
0
4
8
12
Jan Feb Mar Apr May Jun Jul Aug Sep Oct Nov Dec
2013 2014
2014 Q3 PLANNED ACTIVITIES
12
EXISTING BUSINESS VISITS CONDUCTED BY
SECTOR
EXISTING BUSINESS VISITS CONDUCTED BY PLACE
QUARTERLY ECONOMIC UPDATE | Q2 2014
2014 Q2 COMPLETED ACTIVITIES
COLUMBUS 2020 PERFORMANCE | DEVELOPMENT ACTIVITIES JAN-JUN 2014
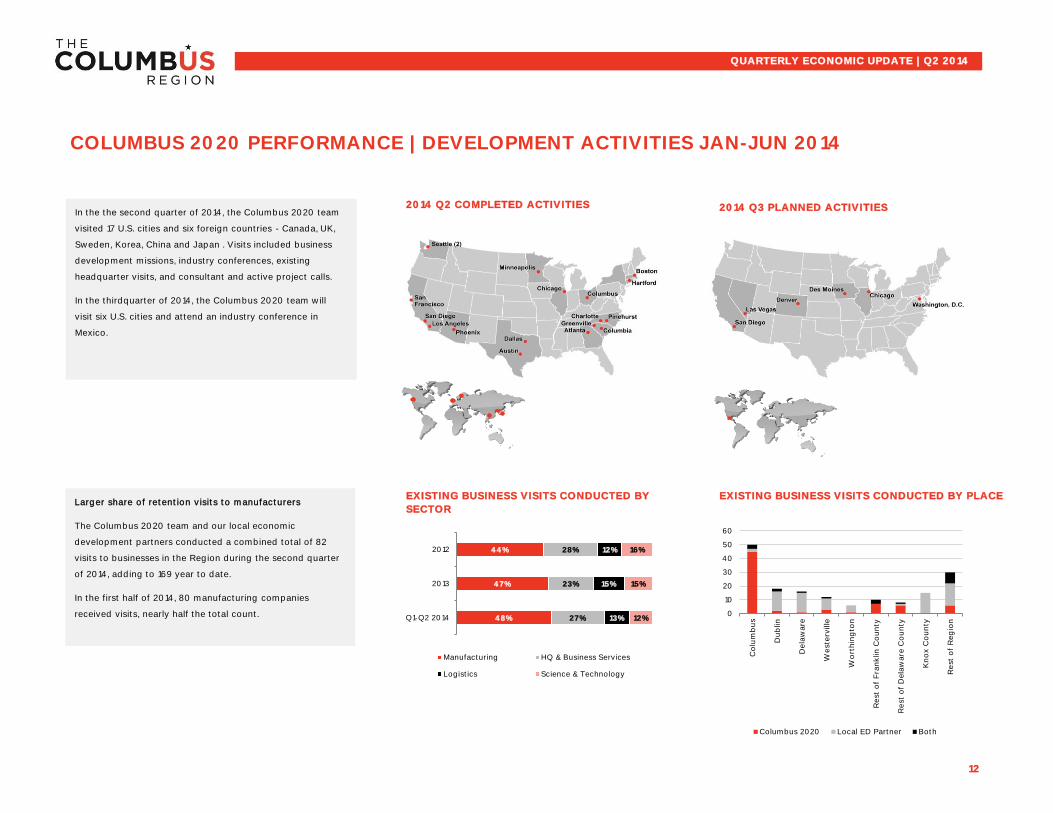
In the the second quarter of 2014, the Columbus 2020 team
visited 17 U.S. cities and six foreign countries - Canada, UK,
Sweden, Korea, China and Japan . Visits included business
development missions, industry conferences, existing
headquarter visits, and consultant and active project calls.
In the thirdquarter of 2014, the Columbus 2020 team will
visit six U.S. cities and attend an industry conference in
Mexico.
Larger share of retention visits to manufacturers
The Columbus 2020 team and our local economic
development partners conducted a combined total of 82
visits to businesses in the Region during the second quarter
of 2014, adding to 169 year to date.
In the first half of 2014, 80 manufacturing companies
received visits, nearly half the total count. 0
10
20
30
40
50
60
Co
lum
bu
s
Du
blin
De
law
are
West
erv
ille
Wo
rth
ing
ton
Rest
of
Fra
nklin
Co
un
ty
Rest
of
Dela
ware
Co
un
ty
Kn
ox C
ou
nty
Rest
of
Reg
ion
Columbus 2020 Local ED Partner Both
44%
47%
48%
28%
23%
27%
12%
15%
13%
16%
15%
12%
2012
2013
Q1-Q2 2014
Manufacturing HQ & Business Services
Logistics Science & Technology
13
ED PROJECT ANNOUNCEMENTS - JOB
CREATION
QUARTERLY ECONOMIC UPDATE | Q2 2014
ED PROJECT ANNOUNCEMENTS BY
SECTOR
NOTABLE EXPANSIONS & LOCATIONS | JAN-JUN 2014
ED PROJECT ANNOUNCEMENTS, COUNT
BY MUNICIPALITY
ED PROJECT ANNOUNCEMENTS, COUNT
BY PLACE
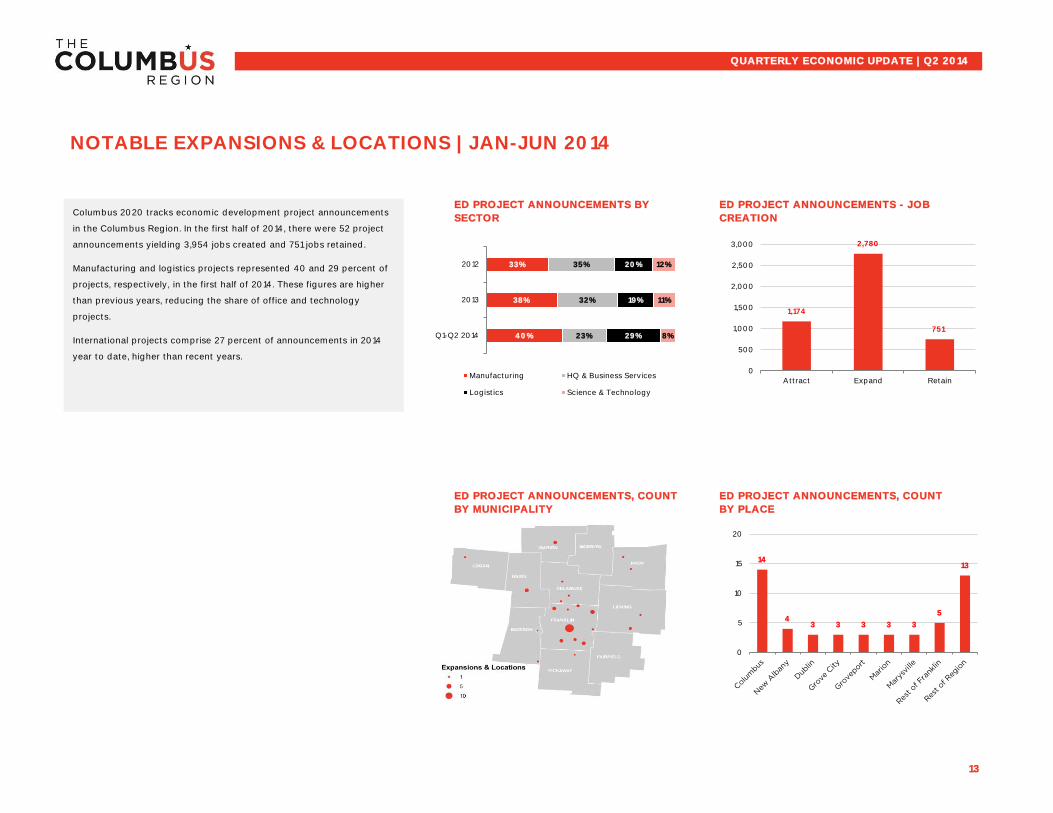
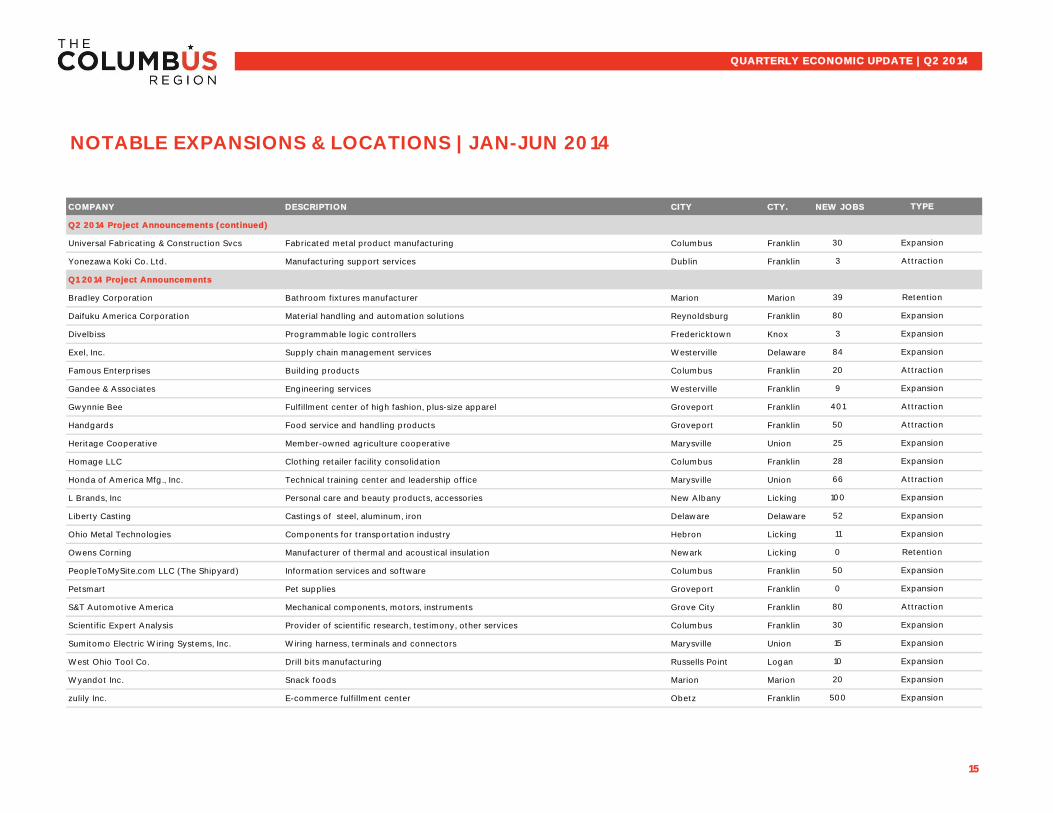
Columbus 2020 tracks economic development project announcements
in the Columbus Region. In the first half of 2014, there were 52 project
announcements yielding 3,954 jobs created and 751 jobs retained.
Manufacturing and logistics projects represented 40 and 29 percent of
projects, respectively, in the first half of 2014. These figures are higher
than previous years, reducing the share of office and technology
projects.
International projects comprise 27 percent of announcements in 2014
year to date, higher than recent years.
1,174
2,780
751
0
500
1,000
1,500
2,000
2,500
3,000
Attract Expand Retain
14
4 3 3 3 3 3
5
13
0
5
10
15
20
33%
38%
40%
35%
32%
23%
20%
19%
29%
12%
11%
8%
2012
2013
Q1-Q2 2014
Manufacturing HQ & Business Services
Logistics Science & Technology
COMPANY DESCRIPTION CITY CTY. NEW JOBS
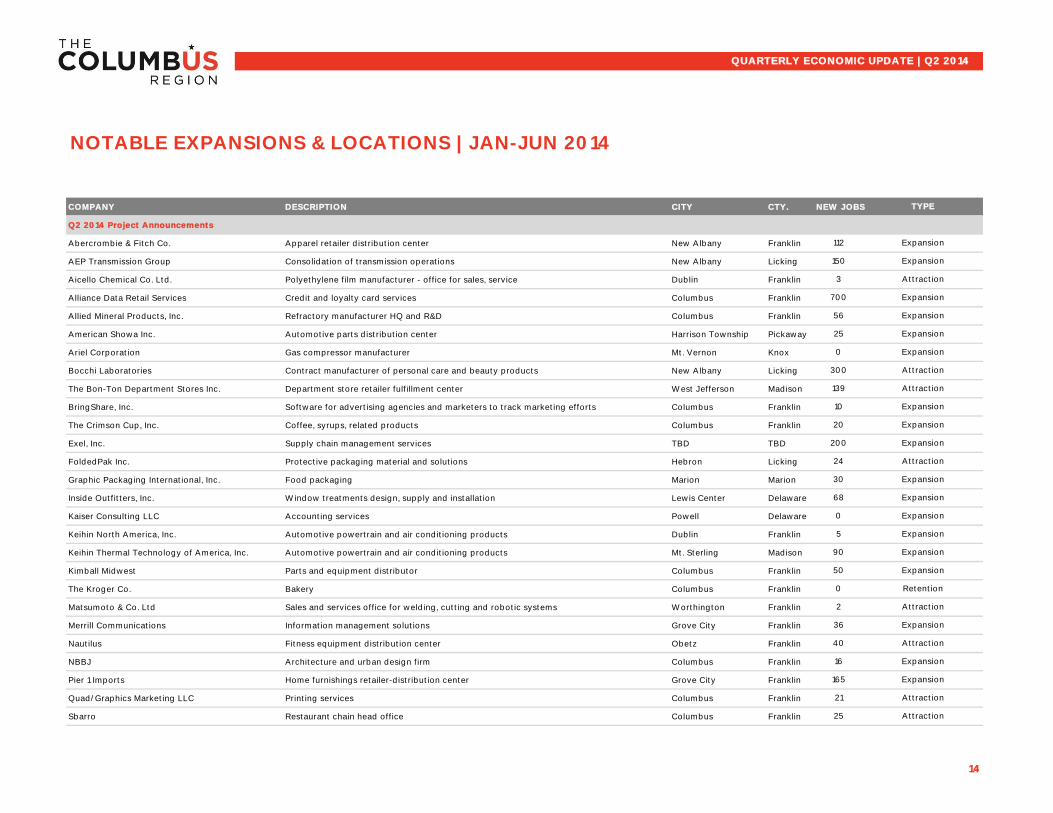
Q2 2014 Project Announcements
Abercrombie & Fitch Co. Apparel retailer distribution center New Albany Franklin
AEP Transmission Group Consolidation of transmission operations New Albany Licking
Aicello Chemical Co. Ltd. Polyethylene film manufacturer - office for sales, service Dublin Franklin
Alliance Data Retail Services Credit and loyalty card services Columbus Franklin
Allied Mineral Products, Inc. Refractory manufacturer HQ and R&D Columbus Franklin
American Showa Inc. Automotive parts distribution center Harrison Township Pickaway
Ariel Corporation Gas compressor manufacturer Mt. Vernon Knox
Bocchi Laboratories Contract manufacturer of personal care and beauty products New Albany Licking
The Bon-Ton Department Stores Inc. Department store retailer fulfillment center West Jefferson Madison
BringShare, Inc. Software for advertising agencies and marketers to track marketing efforts Columbus Franklin
The Crimson Cup, Inc. Coffee, syrups, related products Columbus Franklin
Exel, Inc. Supply chain management services TBD TBD
FoldedPak Inc. Protective packaging material and solutions Hebron Licking
Graphic Packaging International, Inc. Food packaging Marion Marion
Inside Outfitters, Inc. Window treatments design, supply and installation Lewis Center Delaware
Kaiser Consulting LLC Accounting services Powell Delaware
Keihin North America, Inc. Automotive powertrain and air conditioning products Dublin Franklin
Keihin Thermal Technology of America, Inc. Automotive powertrain and air conditioning products Mt. Sterling Madison
Kimball Midwest Parts and equipment distributor Columbus Franklin
The Kroger Co. Bakery Columbus Franklin
Matsumoto & Co. Ltd Sales and services office for welding, cutting and robotic systems Worthington Franklin
Merrill Communications Information management solutions Grove City Franklin
Nautilus Fitness equipment distribution center Obetz Franklin
NBBJ Architecture and urban design firm Columbus Franklin
Pier 1 Imports Home furnishings retailer-distribution center Grove City Franklin
Quad/Graphics Marketing LLC Printing services Columbus Franklin
Sbarro Restaurant chain head office Columbus Franklin
14
Retention
Expansion
Expansion
25 Expansion
139
50
Expansion
40
36 Expansion
Attraction
2 Attraction
165 Expansion
21 Attraction
25 Attraction
Expansion
30 Expansion
68 Expansion
20 Expansion
300
10
0
Expansion
Attraction
700 Expansion
Attraction
Attraction
Expansion
Expansion
0
56
Attraction
QUARTERLY ECONOMIC UPDATE | Q2 2014
NOTABLE EXPANSIONS & LOCATIONS | JAN-JUN 2014
TYPE
112 Expansion
150 Expansion
3
Expansion
0
Expansion
200
24
5
90
16
COMPANY DESCRIPTION CITY CTY. NEW JOBS
Q2 2014 Project Announcements (continued)
Universal Fabricating & Construction Svcs Fabricated metal product manufacturing Columbus Franklin
Yonezawa Koki Co. Ltd. Manufacturing support services Dublin Franklin
Q1 2014 Project Announcements
Bradley Corporation Bathroom fixtures manufacturer Marion Marion
Daifuku America Corporation Material handling and automation solutions Reynoldsburg Franklin
Divelbiss Programmable logic controllers Fredericktown Knox
Exel, Inc. Supply chain management services Westerville Delaware
Famous Enterprises Building products Columbus Franklin
Gandee & Associates Engineering services Westerville Franklin
Gwynnie Bee Fulfillment center of high fashion, plus-size apparel Groveport Franklin
Handgards Food service and handling products Groveport Franklin
Heritage Cooperative Member-owned agriculture cooperative Marysville Union
Homage LLC Clothing retailer facility consolidation Columbus Franklin
Honda of America Mfg., Inc. Technical training center and leadership office Marysville Union
L Brands, Inc Personal care and beauty products, accessories New Albany Licking
Liberty Casting Castings of steel, aluminum, iron Delaware Delaware
Ohio Metal Technologies Components for transportation industry Hebron Licking
Owens Corning Manufacturer of thermal and acoustical insulation Newark Licking
PeopleToMySite.com LLC (The Shipyard) Information services and software Columbus Franklin
Petsmart Pet supplies Groveport Franklin
S&T Automotive America Mechanical components, motors, instruments Grove City Franklin
Scientific Expert Analysis Provider of scientific research, testimony, other services Columbus Franklin
Sumitomo Electric Wiring Systems, Inc. Wiring harness, terminals and connectors Marysville Union
West Ohio Tool Co. Drill bits manufacturing Russells Point Logan
Wyandot Inc. Snack foods Marion Marion
zulily Inc. E-commerce fulfillment center Obetz Franklin
15
80 Attraction
52 Expansion
39 Retention
11 Expansion
0 Retention
50 Expansion
0
30 Expansion
15 Expansion
10 Expansion
20 Expansion
500 Expansion
Expansion
28 Expansion
66 Attraction
100 Expansion
QUARTERLY ECONOMIC UPDATE | Q2 2014
NOTABLE EXPANSIONS & LOCATIONS | JAN-JUN 2014
TYPE
80 Expansion
3 Expansion
Attraction
9 Expansion
401 Attraction
50 Attraction
25 Expansion
30 Expansion
3 Attraction
84 Expansion
20