Embed Size (px)
Citation preview
energy.gov/sunshotNREL/PR-6A20-67246
Q2/Q3 2016 Solar Industry Update
David Feldman, NREL Daniel Boff, DOE Robert Margolis, NREL
October 11, 2016
energy.gov/sunshot
Executive Summary
2
• The United States installed 4.0 GWDC in H1 2016, a 47% increase from H1 2015 – 29.9 GWDC totalthrough H1 2016.
– While the top five states in H1 2016 are established markets, many new large markets areemerging, with 14 states installing more than 50 MW in H1 2016, including Utah, Georgia, andSouth Carolina.
– Emerging business practices are driving more solar deployment, such as Community Solar,Corporate PPA’s, and PURPA contracts.
• Analysts estimate that between 61 GW and 74 GW of PV will be installed globally in 2016 (53 GWwere installed in 2015).
– China installed 20 GW in H1 2016 in large part due to scheduled FiT change in H2 2016.• In Q2 2016, residential installation costs (excluding SG&A) for three of the leading firms in the
United States ranged from $2.07/W to $2.27/W.• After several years of relatively flat pricing, modules and components have begun a period of rapid
price declines.– Analysts have reported a significant drop in module pricing since July 2016, with module
quotes between $0.40/W–$0.50/W in the second half of 2016 and still falling – some in theindustry have seen quotes well below $0.40/W for 2017 delivery.
• Nine publically traded PV companies shipped a total of 9 GW in Q2 2016.– This is 12% more than Q1 2016 and 48% more than Q2 2015.
• U.S. module and cell manufacturers had the largest six months of production ever, caused in part byU.S. tariffs in place on Chinese modules and cells, and by a growing U.S. market.
– However, U.S. manufacturers may encounter increased competition due to the downwardmodule price pressure and the expansion of manufacturing capacityin countries not subject to U.S. tariffs.
energy.gov/sunshot
Agenda
3
• Global Deployment • U.S. Deployment • U.S. Pricing • Global Manufacturing • Component Pricing • Market Activity • Tax Credit Availability
energy.gov/sunshot
0
20
40
60
80
100
120
2011 2012 2013 2014 2015 2016P 2017P 2018P 2019P 2020P
PV A
nnua
l Ins
talla
tions
(GW
DC) Europe
ROWIndiaJapanChinaU.S.
Global PV Demand
Historic Projection
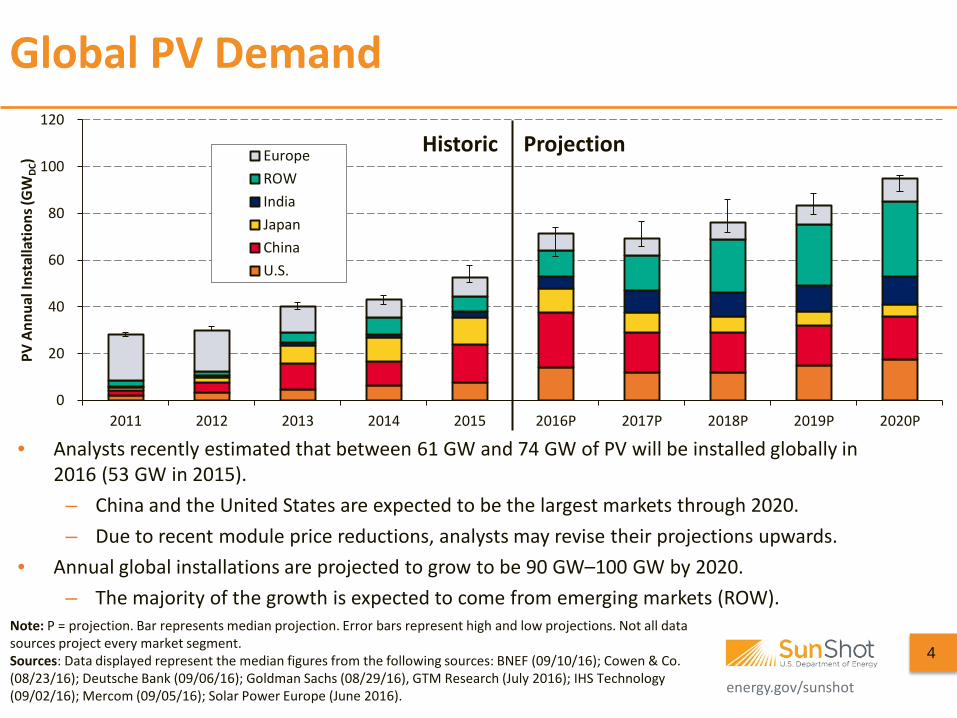
• Analysts recently estimated that between 61 GW and 74 GW of PV will be installed globally in 2016 (53 GW in 2015).
– China and the United States are expected to be the largest markets through 2020. – Due to recent module price reductions, analysts may revise their projections upwards.
• Annual global installations are projected to grow to be 90 GW–100 GW by 2020. – The majority of the growth is expected to come from emerging markets (ROW).
4
Note: P = projection. Bar represents median projection. Error bars represent high and low projections. Not all data sources project every market segment. Sources: Data displayed represent the median figures from the following sources: BNEF (09/10/16); Cowen & Co. (08/23/16); Deutsche Bank (09/06/16); Goldman Sachs (08/29/16), GTM Research (July 2016); IHS Technology (09/02/16); Mercom (09/05/16); Solar Power Europe (June 2016).
energy.gov/sunshot
05
1015202530
2012 2013 2014 2015 2016 2012 2013 2014 2015 2016 2012 2013 2014 2015 2016 2012 2013 2014 2015 2016
China India Japan USA
Annu
al In
stal
latio
ns (G
W)
Country Installations
FYH2H1Q4Q3
Key Markets Update
Note: P=projection for second half of 2016 Sources. Projections: See Slide 4. Historic: China, 2012, Photon Consulting (06/21/13); 2013–14, PVTech, "China, 2012–2015: Mercom (04/23/16); H1 2016: PVMagazine (07/22/16); India: Mercom (09/05/16); Taiyang News (07/22/16). Japan, pre-FiT, BNEF 01/05/14; FiT, METI published data, accessed 09/23/16. United States: GTM/SEIA, “U.S. Solar Market Insight, Q3 2016.
5
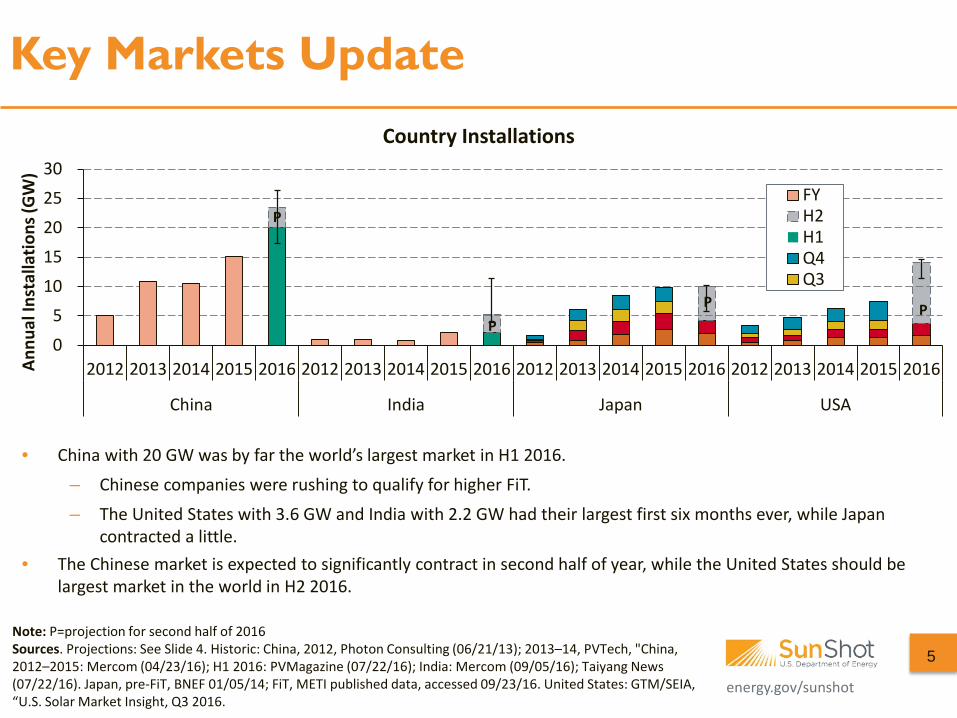
• China with 20 GW was by far the world’s largest market in H1 2016.
– Chinese companies were rushing to qualify for higher FiT.
– The United States with 3.6 GW and India with 2.2 GW had their largest first six months ever, while Japan contracted a little.
• The Chinese market is expected to significantly contract in second half of year, while the United States should be largest market in the world in H2 2016.
P
P P P
energy.gov/sunshot
U.S.
Spain
Australia
6
Morocco Middle East
India
China
Chile
Global
Other
Commissioned Financing secured / under construction
Permitted Announced / planning begun
5.9 GW 1.3 GW 1.3 GW
2.3 GW
1.8 GW
1.0 GW
2.6 GW
0.5 GW 1.2 GW
0.5 GW
1.3 GW
0.5 GW
1.3 GW
Source: Bloomberg NEF “Power Plant” database, accessed 09/30/16
CSP Market Worldwide
energy.gov/sunshot
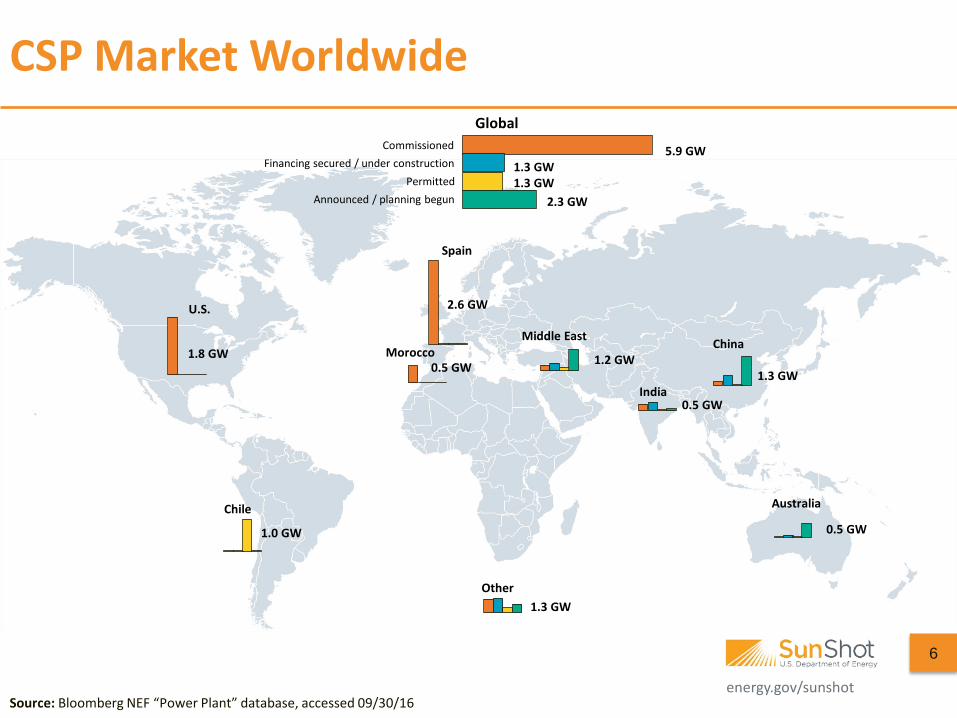
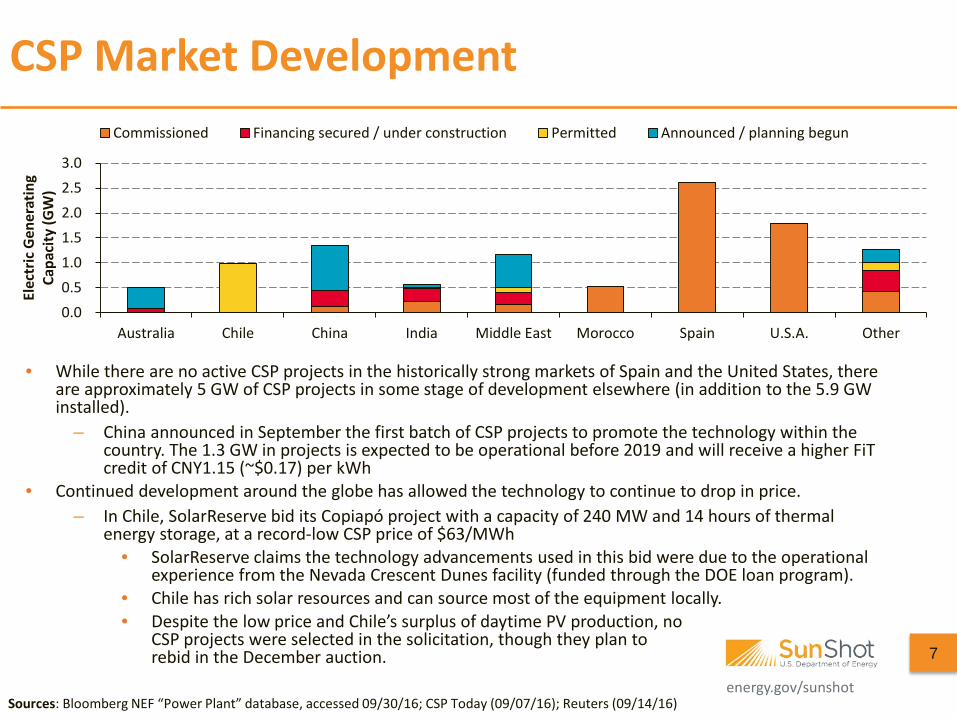
• While there are no active CSP projects in the historically strong markets of Spain and the United States, there are approximately 5 GW of CSP projects in some stage of development elsewhere (in addition to the 5.9 GW installed).
– China announced in September the first batch of CSP projects to promote the technology within the country. The 1.3 GW in projects is expected to be operational before 2019 and will receive a higher FiT credit of CNY1.15 (~$0.17) per kWh
• Continued development around the globe has allowed the technology to continue to drop in price. – In Chile, SolarReserve bid its Copiapó project with a capacity of 240 MW and 14 hours of thermal
energy storage, at a record-low CSP price of $63/MWh • SolarReserve claims the technology advancements used in this bid were due to the operational
experience from the Nevada Crescent Dunes facility (funded through the DOE loan program). • Chile has rich solar resources and can source most of the equipment locally. • Despite the low price and Chile’s surplus of daytime PV production, no
CSP projects were selected in the solicitation, though they plan to rebid in the December auction.
Sources: Bloomberg NEF “Power Plant” database, accessed 09/30/16; CSP Today (09/07/16); Reuters (09/14/16)
0.00.51.01.52.02.53.0
Australia Chile China India Middle East Morocco Spain U.S.A. Other
Elec
tric
Gen
erat
ing
Capa
city
(GW
)
Commissioned Financing secured / under construction Permitted Announced / planning begun
CSP Market Development
7
energy.gov/sunshot
Agenda
8
• Global Deployment • U.S. Deployment • U.S. Pricing • Global Manufacturing • Component Pricing • Market Activity • Tax Credit Availability
energy.gov/sunshot
0.8 1.2 2.2 2.6 2.9 3.3 3.7 3.8 5.0 1.0 1.1
1.3 1.7 1.9 2.0 3.0 3.5
3.2
3.0 4.0
4.4
8.8 6.3 6.3
8.0 8.7
9.6
0
5
10
15
20
25
2013 2014 2015 2016P 2017P 2018P 2019P 2020P 2021P
PV A
nnua
l Ins
talla
tions
(GW
DC)
Utility-scaleNon-Res.Residential
U.S. PV Demand
Historic Projection
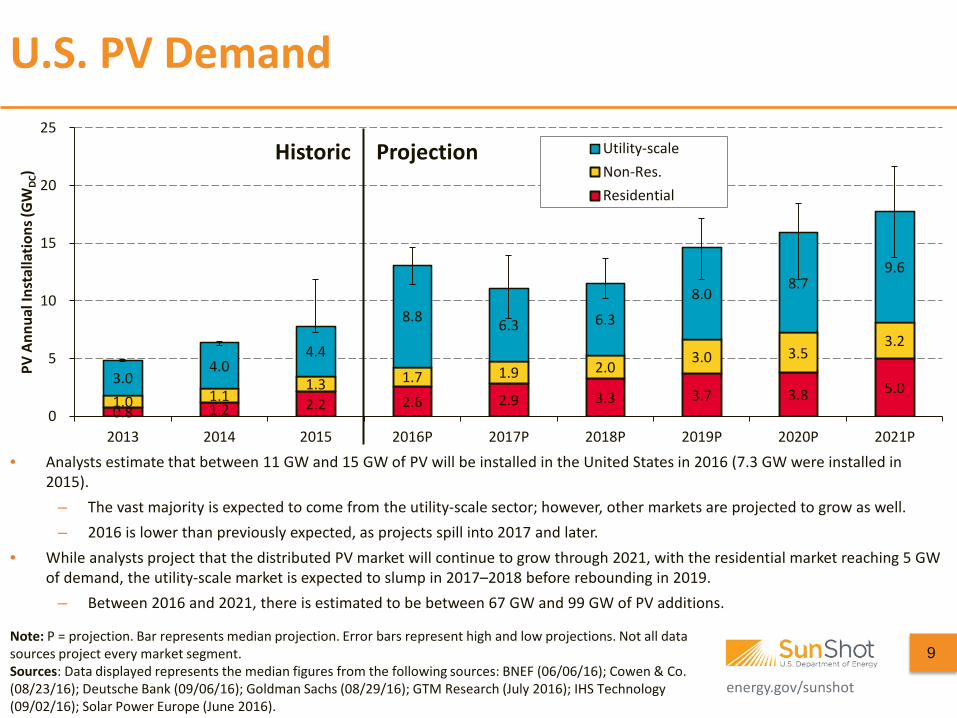
• Analysts estimate that between 11 GW and 15 GW of PV will be installed in the United States in 2016 (7.3 GW were installed in 2015).
– The vast majority is expected to come from the utility-scale sector; however, other markets are projected to grow as well. – 2016 is lower than previously expected, as projects spill into 2017 and later.
• While analysts project that the distributed PV market will continue to grow through 2021, with the residential market reaching 5 GW of demand, the utility-scale market is expected to slump in 2017–2018 before rebounding in 2019.
– Between 2016 and 2021, there is estimated to be between 67 GW and 99 GW of PV additions.
9 Note: P = projection. Bar represents median projection. Error bars represent high and low projections. Not all data sources project every market segment. Sources: Data displayed represents the median figures from the following sources: BNEF (06/06/16); Cowen & Co. (08/23/16); Deutsche Bank (09/06/16); Goldman Sachs (08/29/16); GTM Research (July 2016); IHS Technology (09/02/16); Solar Power Europe (June 2016).
energy.gov/sunshot
U.S. Installation Breakdown
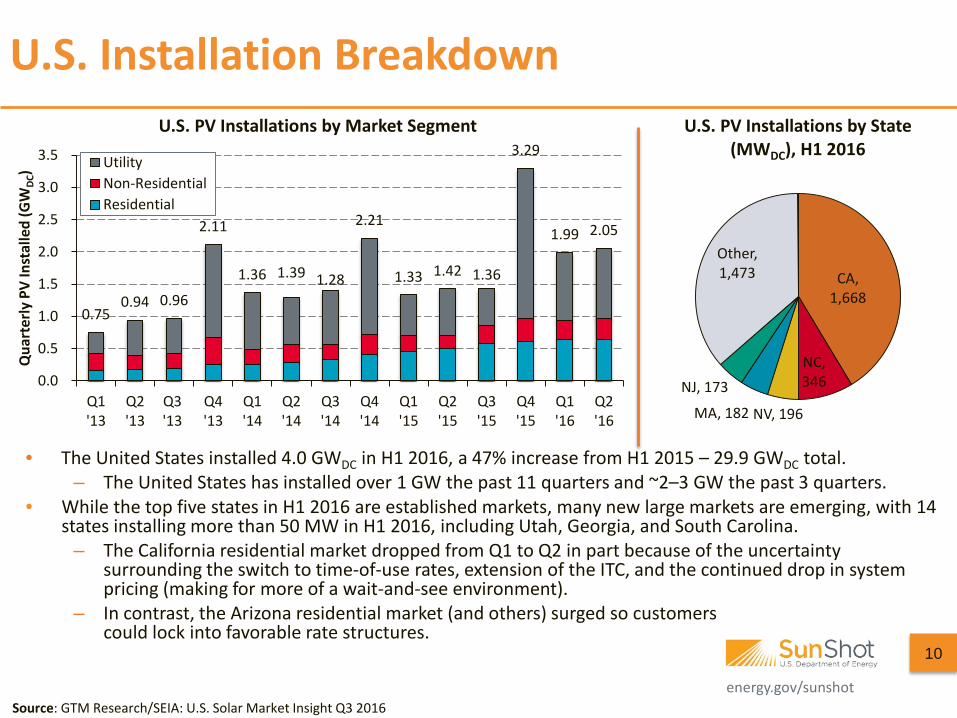
• The United States installed 4.0 GWDC in H1 2016, a 47% increase from H1 2015 – 29.9 GWDC total. – The United States has installed over 1 GW the past 11 quarters and ~2–3 GW the past 3 quarters.
• While the top five states in H1 2016 are established markets, many new large markets are emerging, with 14 states installing more than 50 MW in H1 2016, including Utah, Georgia, and South Carolina.
– The California residential market dropped from Q1 to Q2 in part because of the uncertainty surrounding the switch to time-of-use rates, extension of the ITC, and the continued drop in system pricing (making for more of a wait-and-see environment).
– In contrast, the Arizona residential market (and others) surged so customers could lock into favorable rate structures.
10
Source: GTM Research/SEIA: U.S. Solar Market Insight Q3 2016
0.75 0.94 0.96
2.11
1.36 1.39 1.28
2.21
1.33 1.42 1.36
3.29
1.99 2.05
0.0
0.5
1.0
1.5
2.0
2.5
3.0
3.5
Q1'13
Q2'13
Q3'13
Q4'13
Q1'14
Q2'14
Q3'14
Q4'14
Q1'15
Q2'15
Q3'15
Q4'15
Q1'16
Q2'16
Qua
rter
ly P
V In
stal
led
(GW
DC)
U.S. PV Installations by Market Segment
UtilityNon-ResidentialResidential
CA, 1,668
NC, 346
NV, 196 MA, 182
NJ, 173
Other, 1,473
U.S. PV Installations by State (MWDC), H1 2016
energy.gov/sunshot
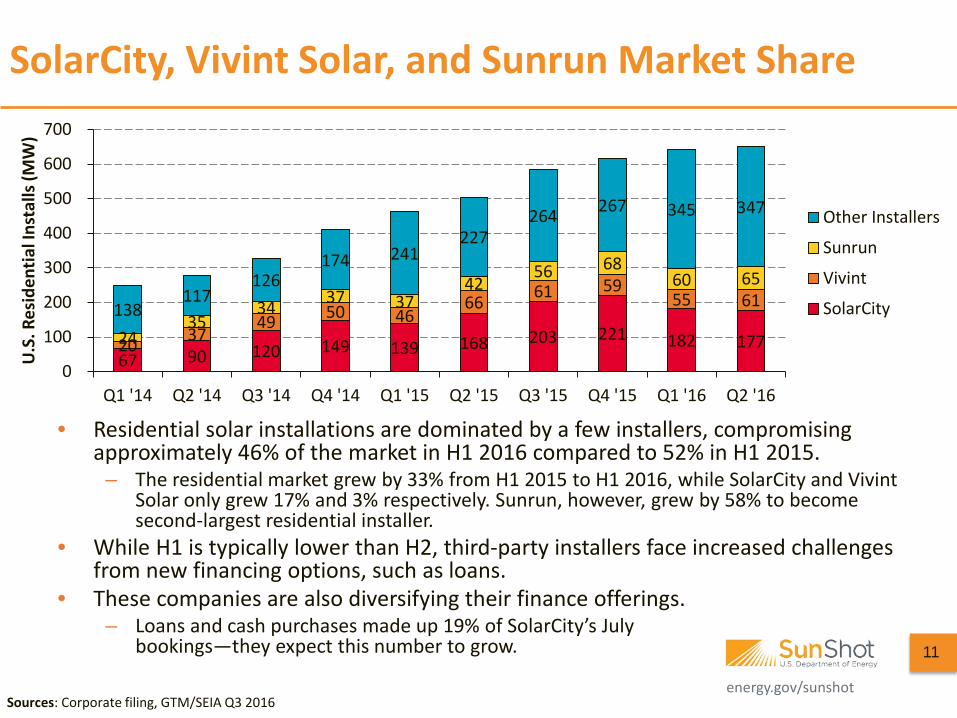
• Residential solar installations are dominated by a few installers, compromising approximately 46% of the market in H1 2016 compared to 52% in H1 2015.
– The residential market grew by 33% from H1 2015 to H1 2016, while SolarCity and Vivint Solar only grew 17% and 3% respectively. Sunrun, however, grew by 58% to become second-largest residential installer.
• While H1 is typically lower than H2, third-party installers face increased challenges from new financing options, such as loans.
• These companies are also diversifying their finance offerings. – Loans and cash purchases made up 19% of SolarCity’s July
bookings—they expect this number to grow.
SolarCity, Vivint Solar, and Sunrun Market Share
Sources: Corporate filing, GTM/SEIA Q3 2016
11
67 90 120 149 139 168 203 221 182 177 20 37 49 50 46
66 61 59 55 61
24 35
34 37 37 42
56 68 60 65
138 117
126 174 241
227 264 267 345 347
0
100
200
300
400
500
600
700
Q1 '14 Q2 '14 Q3 '14 Q4 '14 Q1 '15 Q2 '15 Q3 '15 Q4 '15 Q1 '16 Q2 '16
U.S
. Res
iden
tial I
nsta
lls (M
W)
Other Installers
Sunrun
Vivint
SolarCity
energy.gov/sunshot energy.gov/sunshot
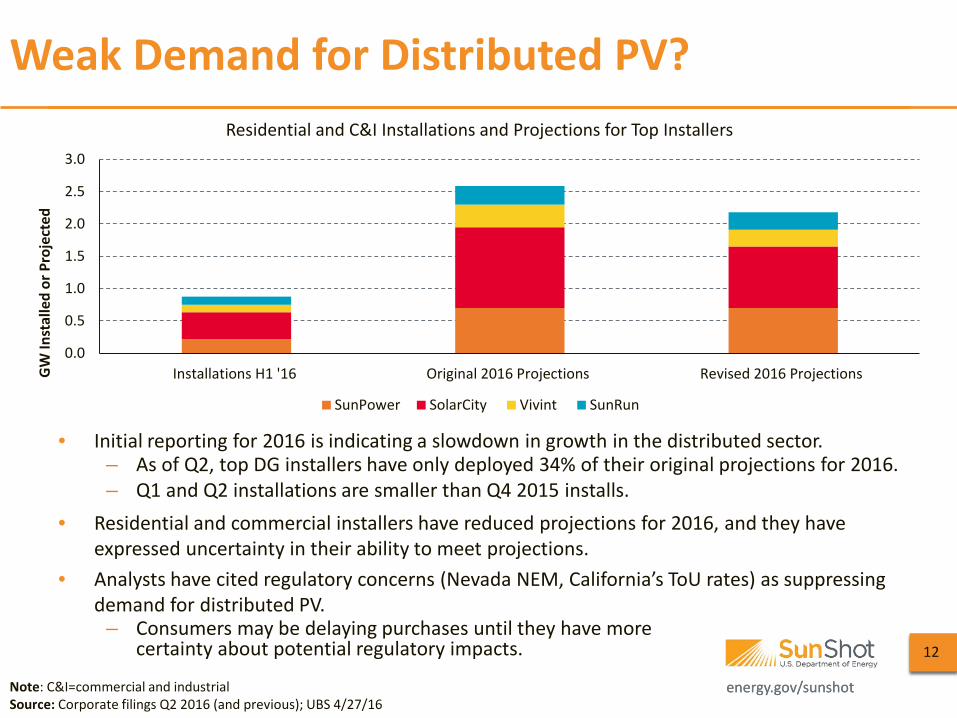
• Initial reporting for 2016 is indicating a slowdown in growth in the distributed sector. – As of Q2, top DG installers have only deployed 34% of their original projections for 2016. – Q1 and Q2 installations are smaller than Q4 2015 installs.
• Residential and commercial installers have reduced projections for 2016, and they have expressed uncertainty in their ability to meet projections.
• Analysts have cited regulatory concerns (Nevada NEM, California’s ToU rates) as suppressing demand for distributed PV.
– Consumers may be delaying purchases until they have more certainty about potential regulatory impacts.
Weak Demand for Distributed PV?
Note: C&I=commercial and industrial Source: Corporate filings Q2 2016 (and previous); UBS 4/27/16
0.0
0.5
1.0
1.5
2.0
2.5
3.0
Installations H1 '16 Original 2016 Projections Revised 2016 ProjectionsGW
Inst
alle
d or
Pro
ject
ed
Residential and C&I Installations and Projections for Top Installers
SunPower SolarCity Vivint SunRun
12
energy.gov/sunshot
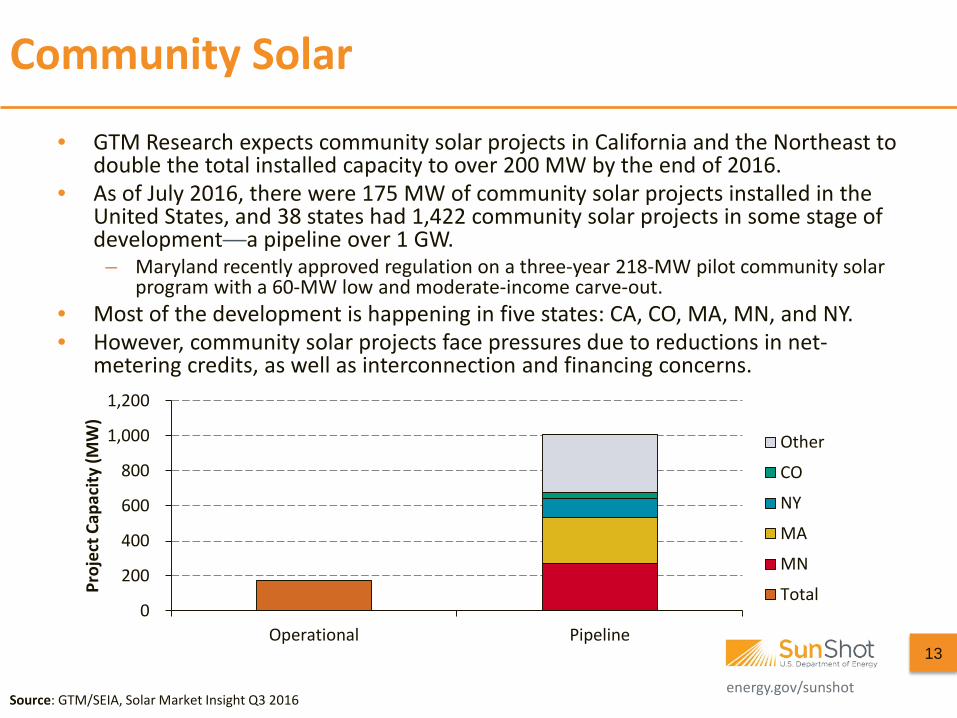
Community Solar
• GTM Research expects community solar projects in California and the Northeast to double the total installed capacity to over 200 MW by the end of 2016.
• As of July 2016, there were 175 MW of community solar projects installed in the United States, and 38 states had 1,422 community solar projects in some stage of development—a pipeline over 1 GW.
– Maryland recently approved regulation on a three-year 218-MW pilot community solar program with a 60-MW low and moderate-income carve-out.
• Most of the development is happening in five states: CA, CO, MA, MN, and NY. • However, community solar projects face pressures due to reductions in net-
metering credits, as well as interconnection and financing concerns.
Source: GTM/SEIA, Solar Market Insight Q3 2016
13
0
200
400
600
800
1,000
1,200
Operational Pipeline
Proj
ect C
apac
ity (M
W)
Other
CO
NY
MA
MN
Total
energy.gov/sunshot
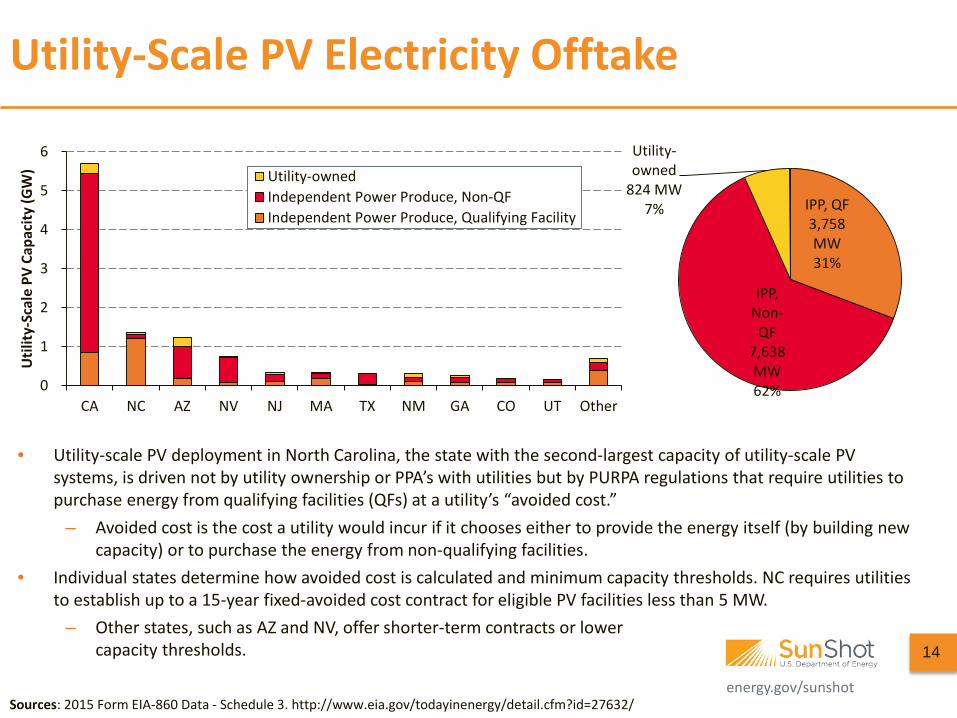
Utility-Scale PV Electricity Offtake
• Utility-scale PV deployment in North Carolina, the state with the second-largest capacity of utility-scale PV systems, is driven not by utility ownership or PPA’s with utilities but by PURPA regulations that require utilities to purchase energy from qualifying facilities (QFs) at a utility’s “avoided cost.”
– Avoided cost is the cost a utility would incur if it chooses either to provide the energy itself (by building new capacity) or to purchase the energy from non-qualifying facilities.
• Individual states determine how avoided cost is calculated and minimum capacity thresholds. NC requires utilities to establish up to a 15-year fixed-avoided cost contract for eligible PV facilities less than 5 MW.
– Other states, such as AZ and NV, offer shorter-term contracts or lower capacity thresholds.
Sources: 2015 Form EIA-860 Data - Schedule 3. http://www.eia.gov/todayinenergy/detail.cfm?id=27632/
0
1
2
3
4
5
6
CA NC AZ NV NJ MA TX NM GA CO UT Other
Util
ity-S
cale
PV
Capa
city
(GW
) Utility-ownedIndependent Power Produce, Non-QFIndependent Power Produce, Qualifying Facility
IPP, QF 3,758 MW 31%
IPP, Non-QF
7,638 MW 62%
Utility-owned
824 MW 7%
14
energy.gov/sunshot
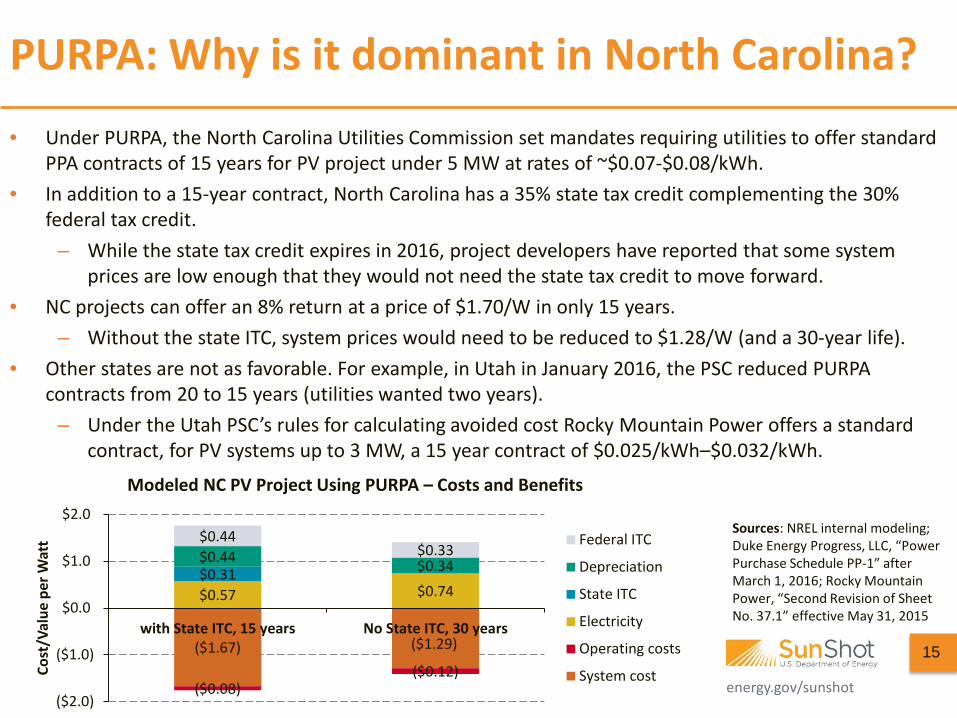
PURPA: Why is it dominant in North Carolina? • Under PURPA, the North Carolina Utilities Commission set mandates requiring utilities to offer standard
PPA contracts of 15 years for PV project under 5 MW at rates of ~$0.07-$0.08/kWh. • In addition to a 15-year contract, North Carolina has a 35% state tax credit complementing the 30%
federal tax credit. – While the state tax credit expires in 2016, project developers have reported that some system
prices are low enough that they would not need the state tax credit to move forward. • NC projects can offer an 8% return at a price of $1.70/W in only 15 years.
– Without the state ITC, system prices would need to be reduced to $1.28/W (and a 30-year life). • Other states are not as favorable. For example, in Utah in January 2016, the PSC reduced PURPA
contracts from 20 to 15 years (utilities wanted two years). – Under the Utah PSC’s rules for calculating avoided cost Rocky Mountain Power offers a standard
contract, for PV systems up to 3 MW, a 15 year contract of $0.025/kWh–$0.032/kWh.
($1.67) ($1.29)
($0.08) ($0.12)
$0.57 $0.74 $0.31 $0.44 $0.34
$0.44 $0.33
($2.0)
($1.0)
$0.0
$1.0
$2.0
with State ITC, 15 years No State ITC, 30 years
Cost
/Val
ue p
er W
att
Modeled NC PV Project Using PURPA – Costs and Benefits
Federal ITC
Depreciation
State ITC
Electricity
Operating costs
System cost15
Sources: NREL internal modeling; Duke Energy Progress, LLC, “Power Purchase Schedule PP-1” after March 1, 2016; Rocky Mountain Power, “Second Revision of Sheet No. 37.1” effective May 31, 2015
energy.gov/sunshot
PURPA and Renewable Energy Deployment More Broadly
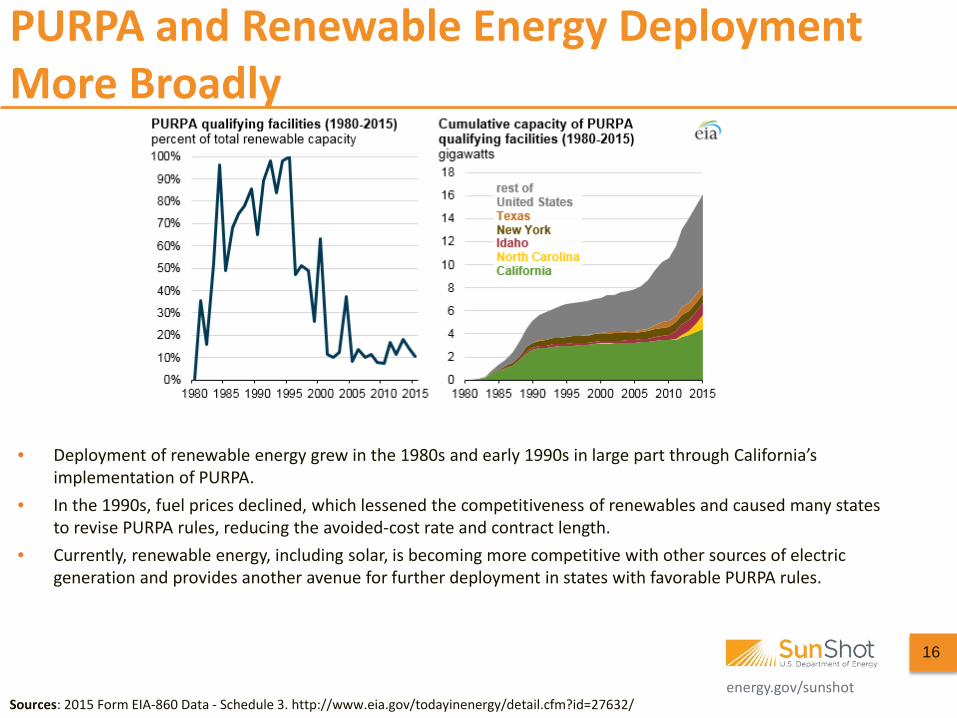
• Deployment of renewable energy grew in the 1980s and early 1990s in large part through California’s implementation of PURPA.
• In the 1990s, fuel prices declined, which lessened the competitiveness of renewables and caused many states to revise PURPA rules, reducing the avoided-cost rate and contract length.
• Currently, renewable energy, including solar, is becoming more competitive with other sources of electric generation and provides another avenue for further deployment in states with favorable PURPA rules.
16
Sources: 2015 Form EIA-860 Data - Schedule 3. http://www.eia.gov/todayinenergy/detail.cfm?id=27632/
energy.gov/sunshot
• Most electricity customers in the United States buy electricity from the same utilities that provide transmission and distribution services.
• In deregulated states, such as many parts of the Northeast, utilities are, for the most part, not permitted to own generating assets.
– Although customers have the option to procure electricity from alternative electric suppliers (such as green power options), customer typically use the default option, having their regulated utility procure energy.
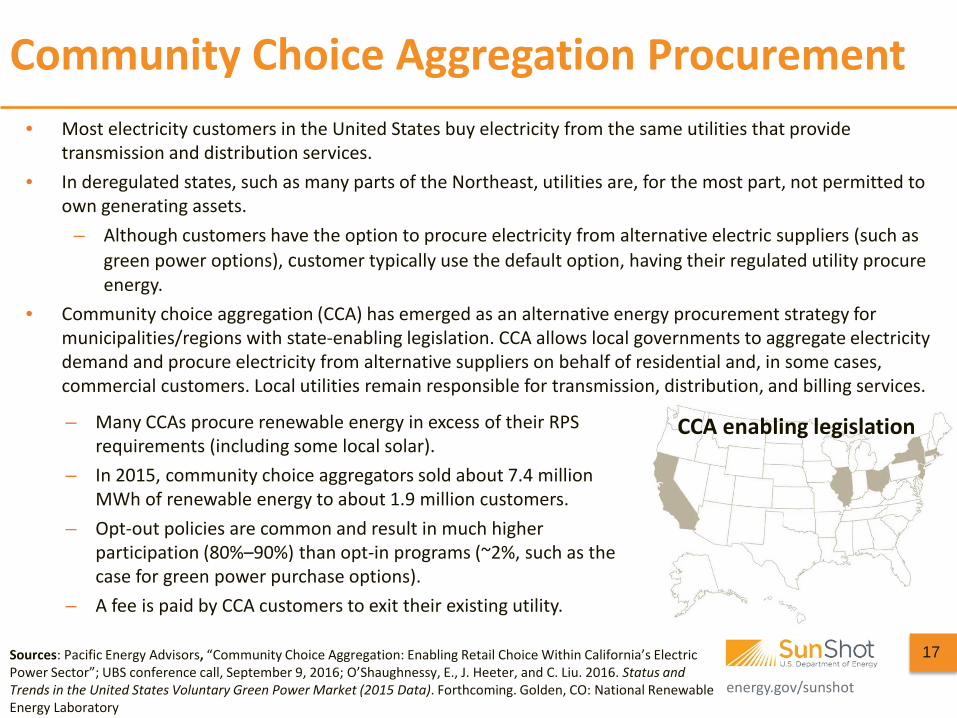
• Community choice aggregation (CCA) has emerged as an alternative energy procurement strategy for municipalities/regions with state-enabling legislation. CCA allows local governments to aggregate electricity demand and procure electricity from alternative suppliers on behalf of residential and, in some cases, commercial customers. Local utilities remain responsible for transmission, distribution, and billing services.
Community Choice Aggregation Procurement
Sources: Pacific Energy Advisors, “Community Choice Aggregation: Enabling Retail Choice Within California’s Electric Power Sector”; UBS conference call, September 9, 2016; O’Shaughnessy, E., J. Heeter, and C. Liu. 2016. Status and Trends in the United States Voluntary Green Power Market (2015 Data). Forthcoming. Golden, CO: National Renewable Energy Laboratory
– Many CCAs procure renewable energy in excess of their RPS requirements (including some local solar).
– In 2015, community choice aggregators sold about 7.4 million MWh of renewable energy to about 1.9 million customers.
– Opt-out policies are common and result in much higher participation (80%–90%) than opt-in programs (~2%, such as the case for green power purchase options).
– A fee is paid by CCA customers to exit their existing utility.
CCA enabling legislation
17
energy.gov/sunshot
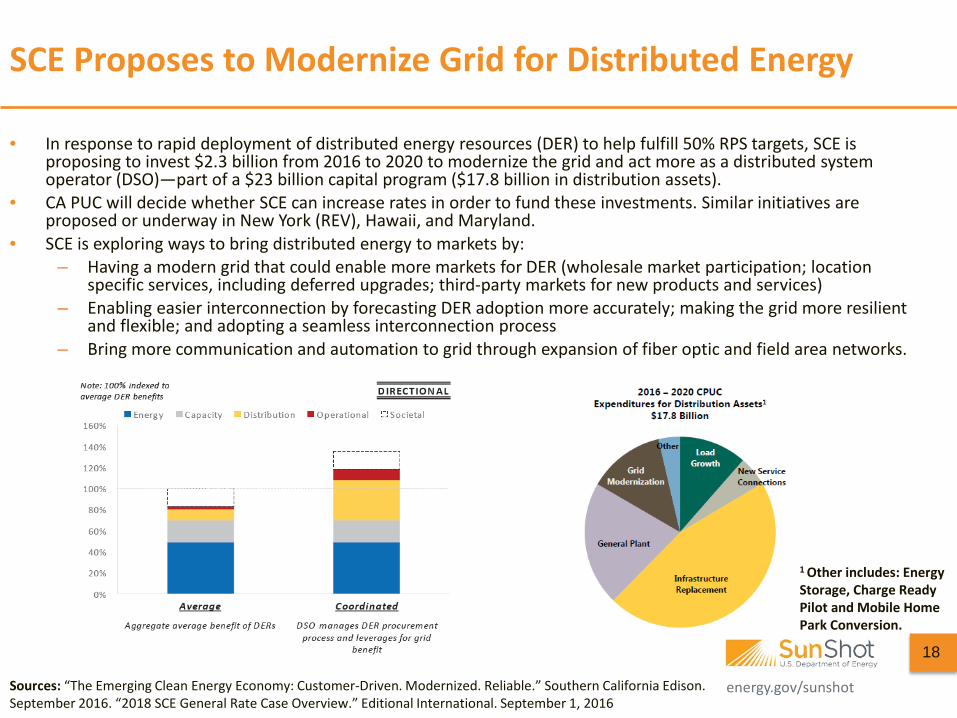
• In response to rapid deployment of distributed energy resources (DER) to help fulfill 50% RPS targets, SCE is proposing to invest $2.3 billion from 2016 to 2020 to modernize the grid and act more as a distributed system operator (DSO)—part of a $23 billion capital program ($17.8 billion in distribution assets).
• CA PUC will decide whether SCE can increase rates in order to fund these investments. Similar initiatives are proposed or underway in New York (REV), Hawaii, and Maryland.
• SCE is exploring ways to bring distributed energy to markets by: – Having a modern grid that could enable more markets for DER (wholesale market participation; location
specific services, including deferred upgrades; third-party markets for new products and services) – Enabling easier interconnection by forecasting DER adoption more accurately; making the grid more resilient
and flexible; and adopting a seamless interconnection process – Bring more communication and automation to grid through expansion of fiber optic and field area networks.
SCE Proposes to Modernize Grid for Distributed Energy
Sources: “The Emerging Clean Energy Economy: Customer-Driven. Modernized. Reliable.” Southern California Edison. September 2016. “2018 SCE General Rate Case Overview.” Editional International. September 1, 2016
18
1 Other includes: Energy Storage, Charge Ready Pilot and Mobile Home Park Conversion.
energy.gov/sunshot
Current Status
Budget Distributed Energy Market Participation
Smart Meter Upgrades
Other
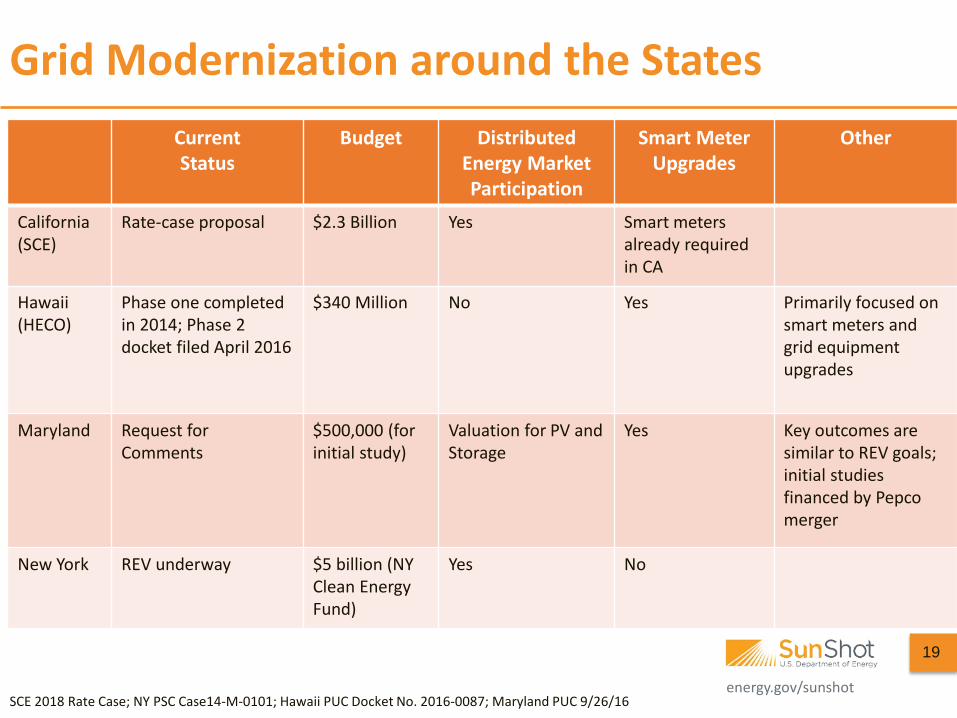
California (SCE)
Rate-case proposal $2.3 Billion Yes Smart meters already required in CA
Hawaii (HECO)
Phase one completed in 2014; Phase 2 docket filed April 2016
$340 Million No Yes Primarily focused on smart meters and grid equipment upgrades
Maryland Request for Comments
$500,000 (for initial study)
Valuation for PV and Storage
Yes Key outcomes are similar to REV goals; initial studies financed by Pepco merger
New York REV underway $5 billion (NY Clean Energy Fund)
Yes No
Grid Modernization around the States
SCE 2018 Rate Case; NY PSC Case14-M-0101; Hawaii PUC Docket No. 2016-0087; Maryland PUC 9/26/16
19
energy.gov/sunshot
U.S. Electric Storage Capacity, June 2016
0
5
10
15
20
25
0
50
100
150
200
250
300
350
400
450
CSP with storage Batteries Gas w. compressedair storage
Flywheels Hydro pumpedstorage
U.S
. Gen
erat
ing
Capa
city
, Pum
ped
Stor
age
(GW
)
U.S
. Gen
erat
ing
Capa
city
, Sto
rage
(MW
)
Source: EIA “Electric Power Monthly,” Table 6.1. Electric Generating Summer Capacity Changes (MW), May 2016 to June 2016
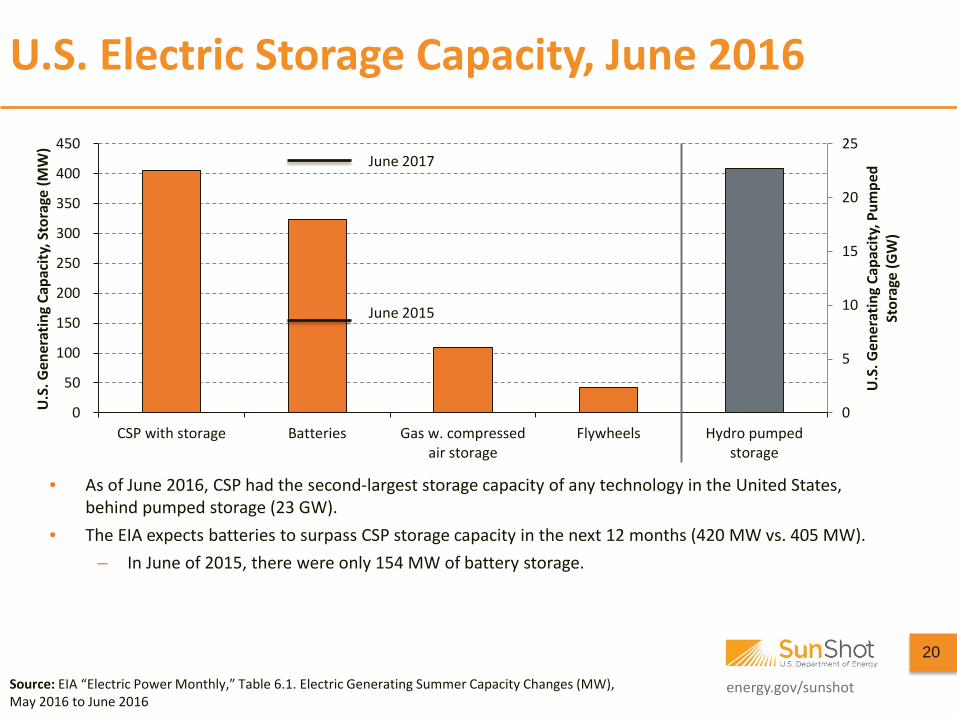
• As of June 2016, CSP had the second-largest storage capacity of any technology in the United States, behind pumped storage (23 GW).
• The EIA expects batteries to surpass CSP storage capacity in the next 12 months (420 MW vs. 405 MW). – In June of 2015, there were only 154 MW of battery storage.
June 2017
20
June 2015
energy.gov/sunshot
Agenda
21
• Global Deployment • U.S. Deployment • U.S. Pricing • Global Manufacturing • Component Pricing • Market Activity • Tax Credit Availability
energy.gov/sunshot
$-
$1
$2
$3
$4
$5
$6
$7
$8
$-
$1
$2
$3
$4
$5
$6
$7
$8
H1 '10 H2 '10 H1 '11 H2 '11 H1 '12 H2 '12 H1 '13 H2 '13 H1 '14 H2 '14 H1 '15 H2 '15 H1 '16
Aver
age
Repo
rted
Sys
tem
Pric
e ($
/W)
Median System Price 20 Percentile 80 Percentile
System Pricing from Select States 2.5 kW–10 kW
22
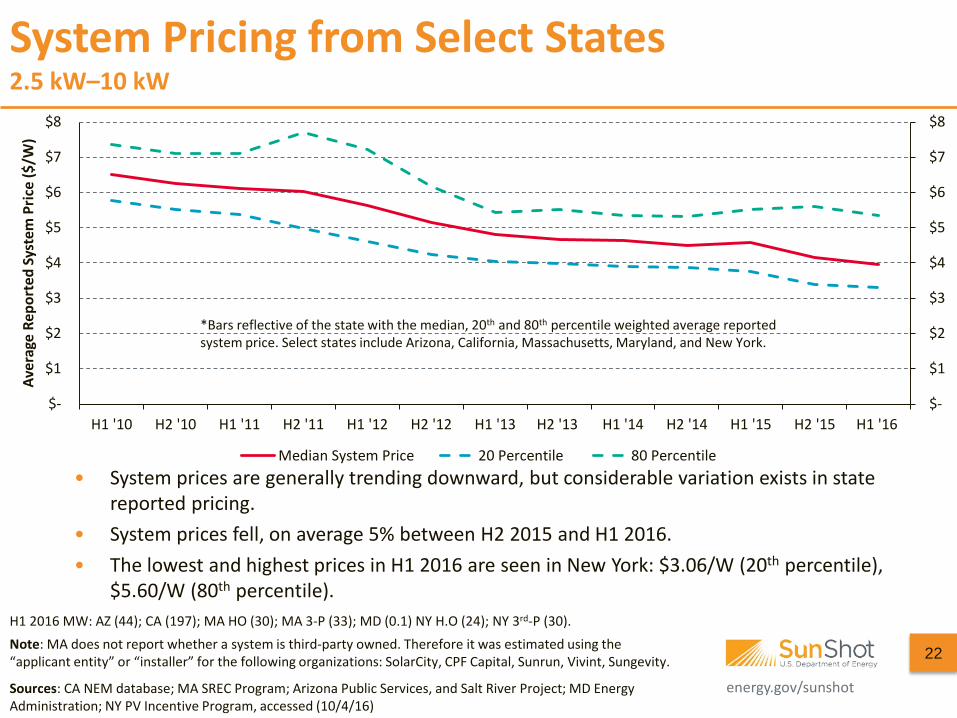
• System prices are generally trending downward, but considerable variation exists in state reported pricing.
• System prices fell, on average 5% between H2 2015 and H1 2016. • The lowest and highest prices in H1 2016 are seen in New York: $3.06/W (20th percentile),
$5.60/W (80th percentile). H1 2016 MW: AZ (44); CA (197); MA HO (30); MA 3-P (33); MD (0.1) NY H.O (24); NY 3rd-P (30). Note: MA does not report whether a system is third-party owned. Therefore it was estimated using the “applicant entity” or “installer” for the following organizations: SolarCity, CPF Capital, Sunrun, Vivint, Sungevity.
Sources: CA NEM database; MA SREC Program; Arizona Public Services, and Salt River Project; MD Energy Administration; NY PV Incentive Program, accessed (10/4/16)
*Bars reflective of the state with the median, 20th and 80th percentile weighted average reported system price. Select states include Arizona, California, Massachusetts, Maryland, and New York.
energy.gov/sunshot
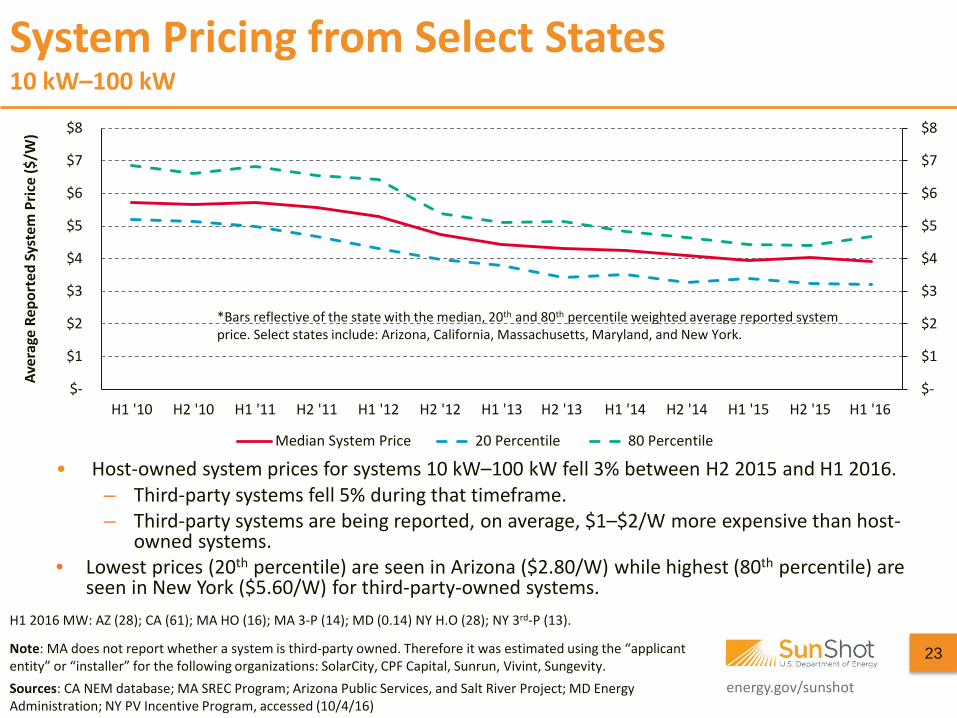
System Pricing from Select States 10 kW–100 kW
23 Note: MA does not report whether a system is third-party owned. Therefore it was estimated using the “applicant entity” or “installer” for the following organizations: SolarCity, CPF Capital, Sunrun, Vivint, Sungevity.
• Host-owned system prices for systems 10 kW–100 kW fell 3% between H2 2015 and H1 2016. – Third-party systems fell 5% during that timeframe. – Third-party systems are being reported, on average, $1–$2/W more expensive than host-
owned systems. • Lowest prices (20th percentile) are seen in Arizona ($2.80/W) while highest (80th percentile) are
seen in New York ($5.60/W) for third-party-owned systems. H1 2016 MW: AZ (28); CA (61); MA HO (16); MA 3-P (14); MD (0.14) NY H.O (28); NY 3rd-P (13).
Sources: CA NEM database; MA SREC Program; Arizona Public Services, and Salt River Project; MD Energy Administration; NY PV Incentive Program, accessed (10/4/16)
*Bars reflective of the state with the median, 20th and 80th percentile weighted average reported system price. Select states include: Arizona, California, Massachusetts, Maryland, and New York.
$-
$1
$2
$3
$4
$5
$6
$7
$8
$-
$1
$2
$3
$4
$5
$6
$7
$8
H1 '10 H2 '10 H1 '11 H2 '11 H1 '12 H2 '12 H1 '13 H2 '13 H1 '14 H2 '14 H1 '15 H2 '15 H1 '16
Aver
age
Repo
rted
Sys
tem
Pric
e ($
/W)
Median System Price 20 Percentile 80 Percentile
energy.gov/sunshot
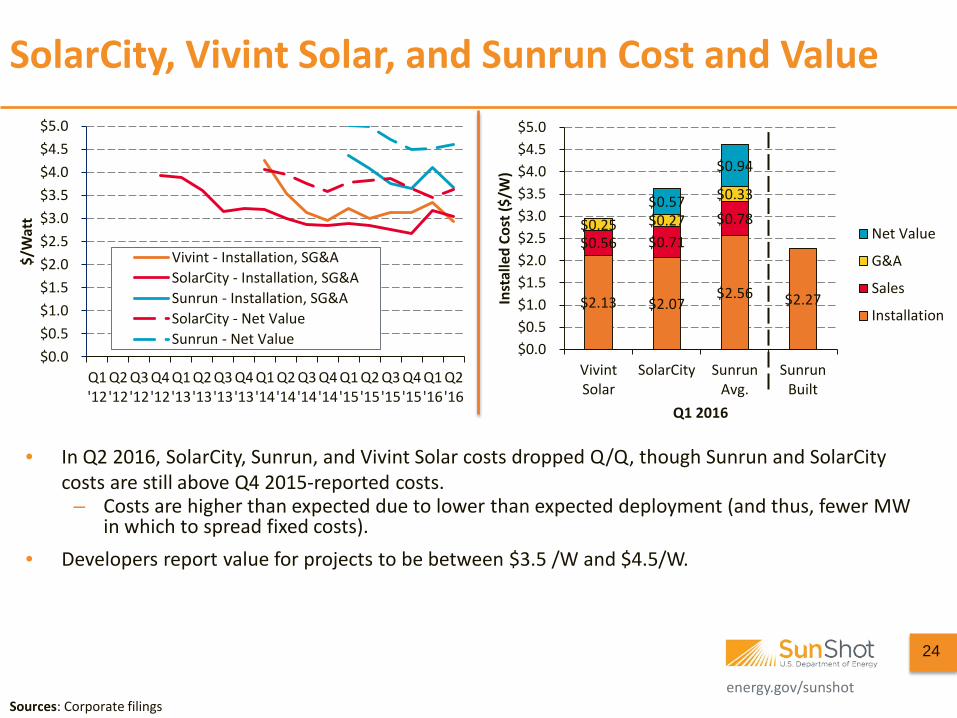
$2.13 $2.07 $2.56 $2.27
$0.56 $0.71 $0.78 $0.25 $0.27
$0.33 $0.57
$0.94
$0.0$0.5$1.0$1.5$2.0$2.5$3.0$3.5$4.0$4.5$5.0
VivintSolar
SolarCity SunrunAvg.
SunrunBuilt
Inst
alle
d Co
st ($
/W)
Q1 2016
Net Value
G&A
Sales
Installation
• In Q2 2016, SolarCity, Sunrun, and Vivint Solar costs dropped Q/Q, though Sunrun and SolarCity costs are still above Q4 2015-reported costs.
– Costs are higher than expected due to lower than expected deployment (and thus, fewer MW in which to spread fixed costs).
• Developers report value for projects to be between $3.5 /W and $4.5/W.
SolarCity, Vivint Solar, and Sunrun Cost and Value
Sources: Corporate filings
24
$0.0$0.5$1.0$1.5$2.0$2.5$3.0$3.5$4.0$4.5$5.0
Q1'12
Q2'12
Q3'12
Q4'12
Q1'13
Q2'13
Q3'13
Q4'13
Q1'14
Q2'14
Q3'14
Q4'14
Q1'15
Q2'15
Q3'15
Q4'15
Q1'16
Q2'16
$/W
att
Vivint - Installation, SG&ASolarCity - Installation, SG&ASunrun - Installation, SG&ASolarCity - Net ValueSunrun - Net Value
energy.gov/sunshot
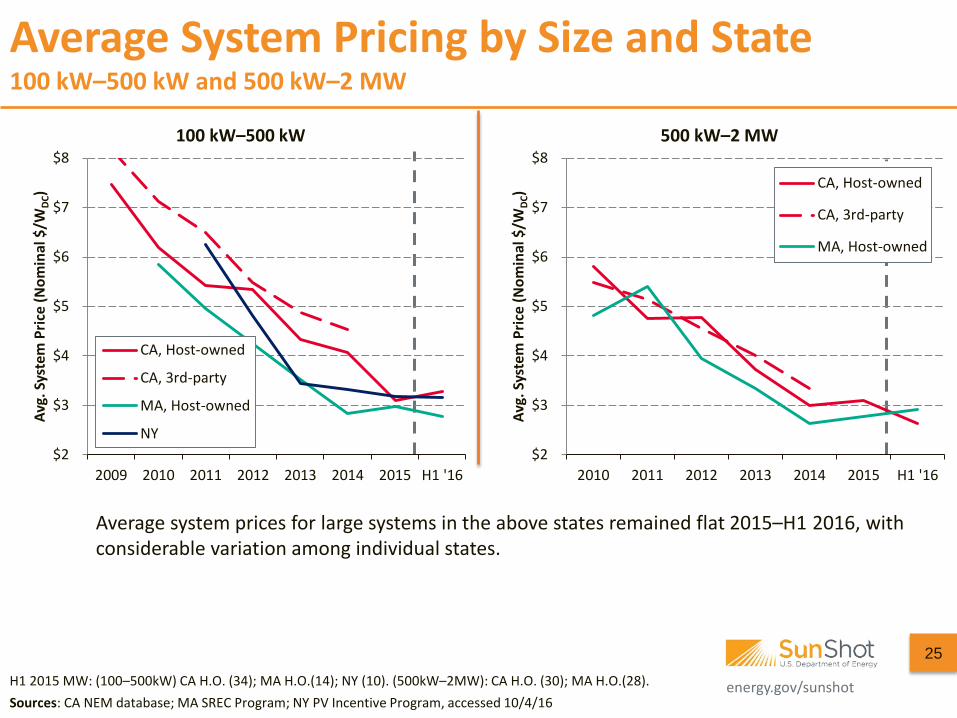
Average System Pricing by Size and State 100 kW–500 kW and 500 kW–2 MW
25
H1 2015 MW: (100–500kW) CA H.O. (34); MA H.O.(14); NY (10). (500kW–2MW): CA H.O. (30); MA H.O.(28).
Average system prices for large systems in the above states remained flat 2015–H1 2016, with considerable variation among individual states.
Sources: CA NEM database; MA SREC Program; NY PV Incentive Program, accessed 10/4/16
$2
$3
$4
$5
$6
$7
$8
2009 2010 2011 2012 2013 2014 2015 H1 '16
Avg.
Sys
tem
Pric
e (N
omin
al $
/WDC
)
100 kW–500 kW
CA, Host-owned
CA, 3rd-party
MA, Host-owned
NY$2
$3
$4
$5
$6
$7
$8
2010 2011 2012 2013 2014 2015 H1 '16
Avg.
Sys
tem
Pric
e (N
omin
al $
/WDC
)
500 kW–2 MW
CA, Host-owned
CA, 3rd-party
MA, Host-owned
energy.gov/sunshot
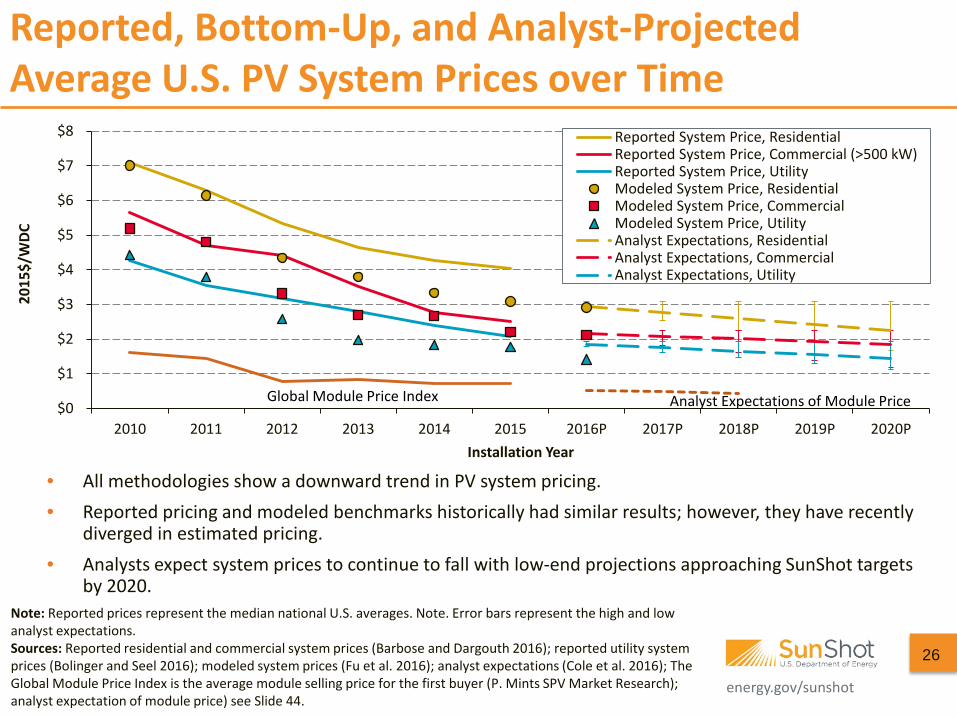
Reported, Bottom-Up, and Analyst-Projected Average U.S. PV System Prices over Time
Note: Reported prices represent the median national U.S. averages. Note. Error bars represent the high and low analyst expectations. Sources: Reported residential and commercial system prices (Barbose and Dargouth 2016); reported utility system prices (Bolinger and Seel 2016); modeled system prices (Fu et al. 2016); analyst expectations (Cole et al. 2016); The Global Module Price Index is the average module selling price for the first buyer (P. Mints SPV Market Research); analyst expectation of module price) see Slide 44.
26
• All methodologies show a downward trend in PV system pricing. • Reported pricing and modeled benchmarks historically had similar results; however, they have recently
diverged in estimated pricing. • Analysts expect system prices to continue to fall with low-end projections approaching SunShot targets
by 2020.
$0
$1
$2
$3
$4
$5
$6
$7
$8
2010 2011 2012 2013 2014 2015 2016P 2017P 2018P 2019P 2020P
2015
$/W
DC
Installation Year
Reported System Price, ResidentialReported System Price, Commercial (>500 kW)Reported System Price, UtilityModeled System Price, ResidentialModeled System Price, CommercialModeled System Price, UtilityAnalyst Expectations, ResidentialAnalyst Expectations, CommercialAnalyst Expectations, Utility
Analyst Expectations of Module Price Global Module Price Index
energy.gov/sunshot
$3.0 $3.5
$3.1 $4.1
$2.1 $2.1 $2.2 $2.5 $3.5
$3.0 $3.0
$1.6 $1.6 $1.6 $1.4 $1.8 $1.9 $2.1
$0$1$2$3$4$5$6
BNEF
GTM
/SEI
A
NRE
L
LBN
L
Ener
gySa
ge
Pet.-
Dean
BNEF
GTM
/SEI
A
NRE
L
LBN
L (>
500k
W)
LBN
L (≤
500k
W)
Ener
gySa
ge
SolS
yste
ms
(≤50
0 kW
)
SolS
yste
ms (
500
kW -
2 M
W)
BNEF
(1-A
xis)
BNEF
(Fix
ed)
GTM
/SEI
A (1
-Axi
s)
GTM
/SEI
A (F
ixed
)
NRE
L (1
-Axi
s)
NRE
L (F
ixed
)
LBN
L
Modeled Reported Quote Modeled Reported Quote Modeled Reported
Residential Non-Residential Utility-scale
Syst
em P
rice
(201
5 $/
WDC
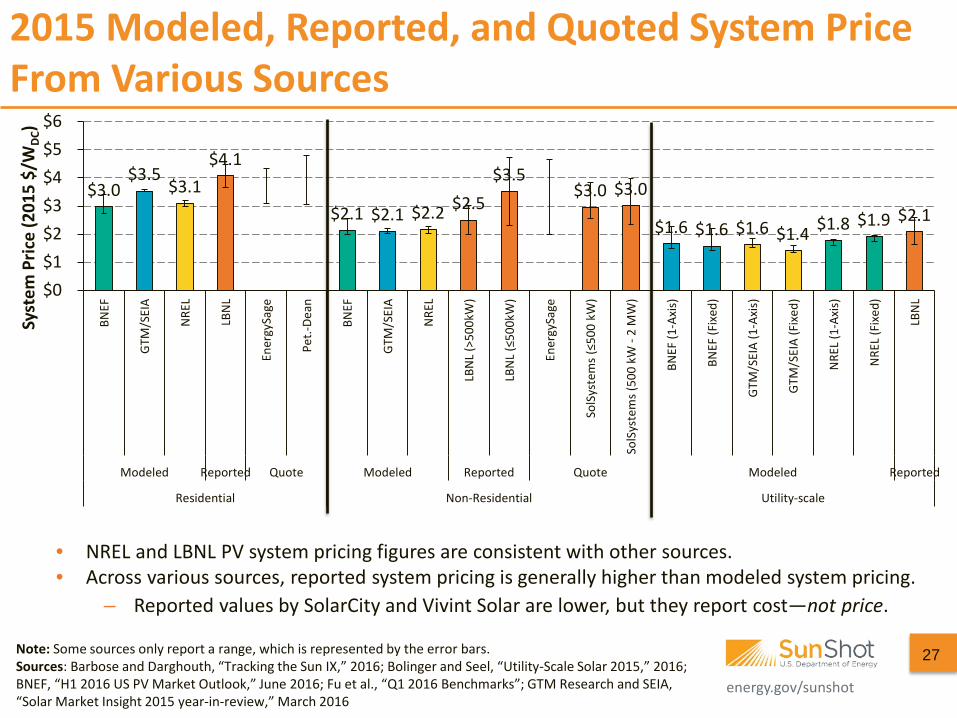
) 2015 Modeled, Reported, and Quoted System Price From Various Sources
27
• NREL and LBNL PV system pricing figures are consistent with other sources. • Across various sources, reported system pricing is generally higher than modeled system pricing.
– Reported values by SolarCity and Vivint Solar are lower, but they report cost—not price.
Note: Some sources only report a range, which is represented by the error bars. Sources: Barbose and Darghouth, “Tracking the Sun IX,” 2016; Bolinger and Seel, “Utility-Scale Solar 2015,” 2016; BNEF, “H1 2016 US PV Market Outlook,” June 2016; Fu et al., “Q1 2016 Benchmarks”; GTM Research and SEIA, “Solar Market Insight 2015 year-in-review,” March 2016
energy.gov/sunshot
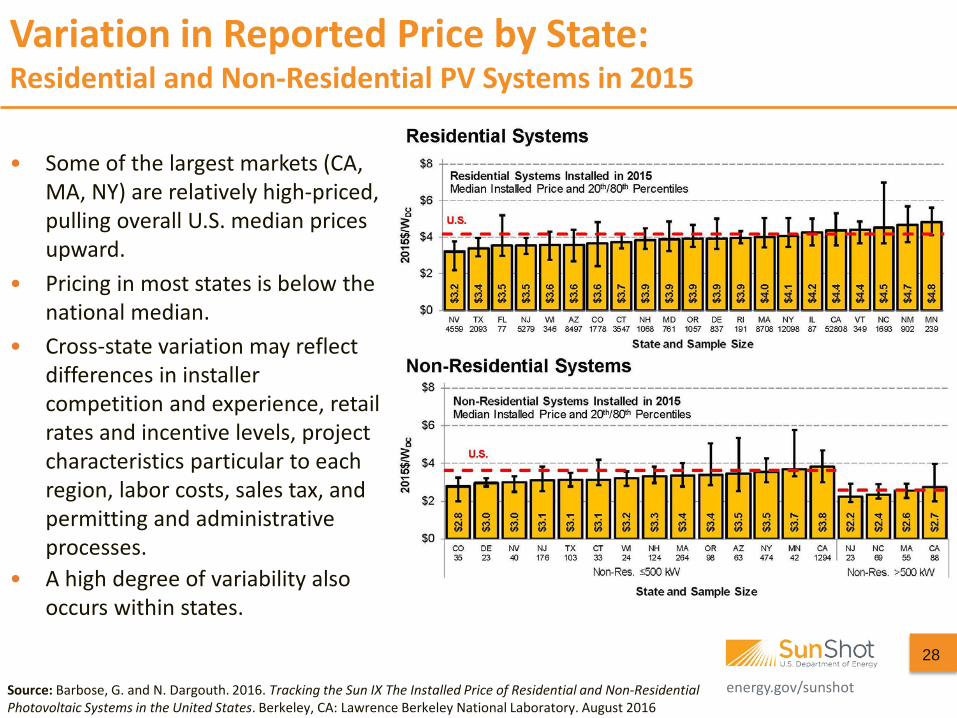
Variation in Reported Price by State: Residential and Non-Residential PV Systems in 2015
• Some of the largest markets (CA, MA, NY) are relatively high-priced, pulling overall U.S. median prices upward.
• Pricing in most states is below the national median.
• Cross-state variation may reflect differences in installer competition and experience, retail rates and incentive levels, project characteristics particular to each region, labor costs, sales tax, and permitting and administrative processes.
• A high degree of variability also occurs within states.
Source: Barbose, G. and N. Dargouth. 2016. Tracking the Sun IX The Installed Price of Residential and Non-Residential Photovoltaic Systems in the United States. Berkeley, CA: Lawrence Berkeley National Laboratory. August 2016
28
energy.gov/sunshot
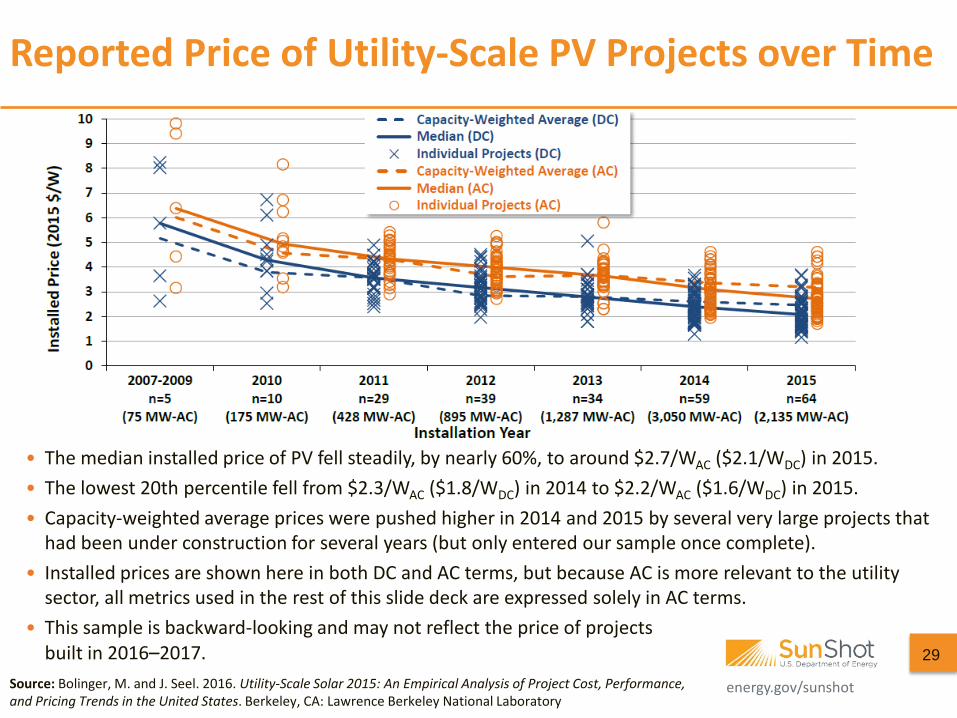
Reported Price of Utility-Scale PV Projects over Time
• The median installed price of PV fell steadily, by nearly 60%, to around $2.7/WAC ($2.1/WDC) in 2015. • The lowest 20th percentile fell from $2.3/WAC ($1.8/WDC) in 2014 to $2.2/WAC ($1.6/WDC) in 2015. • Capacity-weighted average prices were pushed higher in 2014 and 2015 by several very large projects that
had been under construction for several years (but only entered our sample once complete). • Installed prices are shown here in both DC and AC terms, but because AC is more relevant to the utility
sector, all metrics used in the rest of this slide deck are expressed solely in AC terms. • This sample is backward-looking and may not reflect the price of projects
built in 2016–2017. 29
Source: Bolinger, M. and J. Seel. 2016. Utility-Scale Solar 2015: An Empirical Analysis of Project Cost, Performance, and Pricing Trends in the United States. Berkeley, CA: Lawrence Berkeley National Laboratory
energy.gov/sunshot
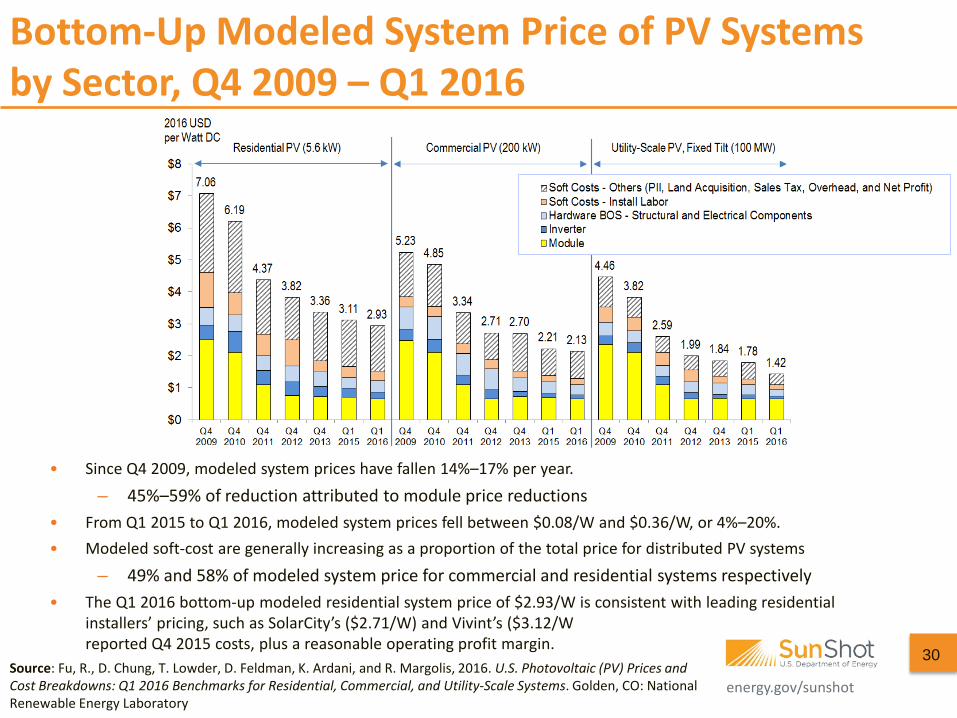
Bottom-Up Modeled System Price of PV Systems by Sector, Q4 2009 – Q1 2016
Source: Fu, R., D. Chung, T. Lowder, D. Feldman, K. Ardani, and R. Margolis, 2016. U.S. Photovoltaic (PV) Prices and Cost Breakdowns: Q1 2016 Benchmarks for Residential, Commercial, and Utility-Scale Systems. Golden, CO: National Renewable Energy Laboratory
• Since Q4 2009, modeled system prices have fallen 14%–17% per year.
– 45%–59% of reduction attributed to module price reductions • From Q1 2015 to Q1 2016, modeled system prices fell between $0.08/W and $0.36/W, or 4%–20%. • Modeled soft-cost are generally increasing as a proportion of the total price for distributed PV systems
– 49% and 58% of modeled system price for commercial and residential systems respectively • The Q1 2016 bottom-up modeled residential system price of $2.93/W is consistent with leading residential
installers’ pricing, such as SolarCity’s ($2.71/W) and Vivint’s ($3.12/W reported Q4 2015 costs, plus a reasonable operating profit margin.
30
energy.gov/sunshot
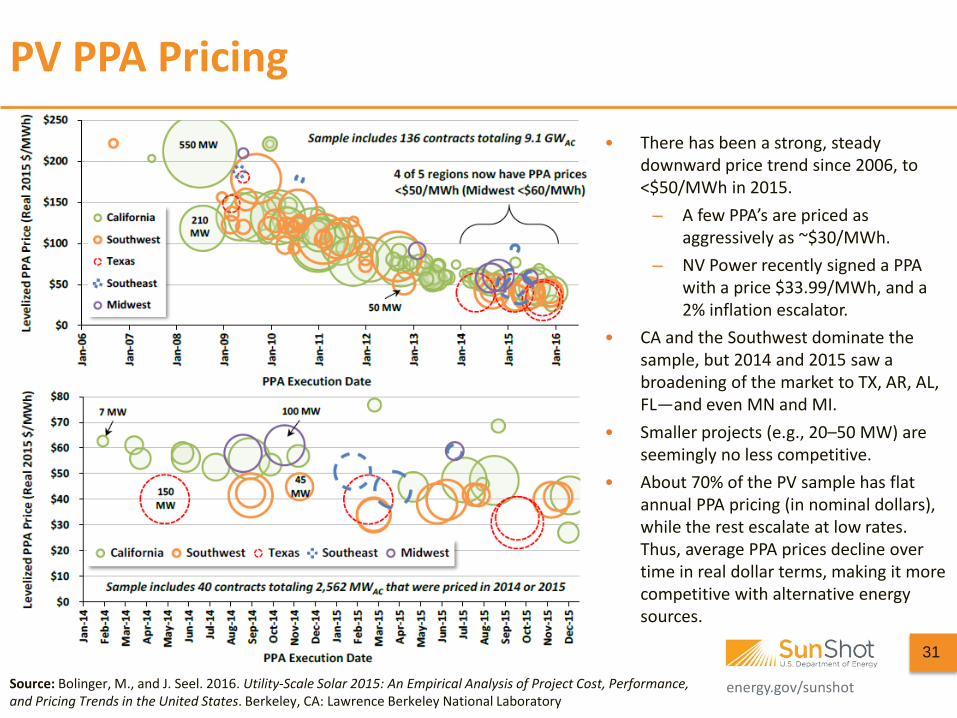
PV PPA Pricing
• There has been a strong, steady downward price trend since 2006, to <$50/MWh in 2015.
– A few PPA’s are priced as aggressively as ~$30/MWh.
– NV Power recently signed a PPA with a price $33.99/MWh, and a 2% inflation escalator.
• CA and the Southwest dominate the sample, but 2014 and 2015 saw a broadening of the market to TX, AR, AL, FL—and even MN and MI.
• Smaller projects (e.g., 20–50 MW) are seemingly no less competitive.
• About 70% of the PV sample has flat annual PPA pricing (in nominal dollars), while the rest escalate at low rates. Thus, average PPA prices decline over time in real dollar terms, making it more competitive with alternative energy sources.
Source: Bolinger, M., and J. Seel. 2016. Utility-Scale Solar 2015: An Empirical Analysis of Project Cost, Performance, and Pricing Trends in the United States. Berkeley, CA: Lawrence Berkeley National Laboratory
31
energy.gov/sunshot
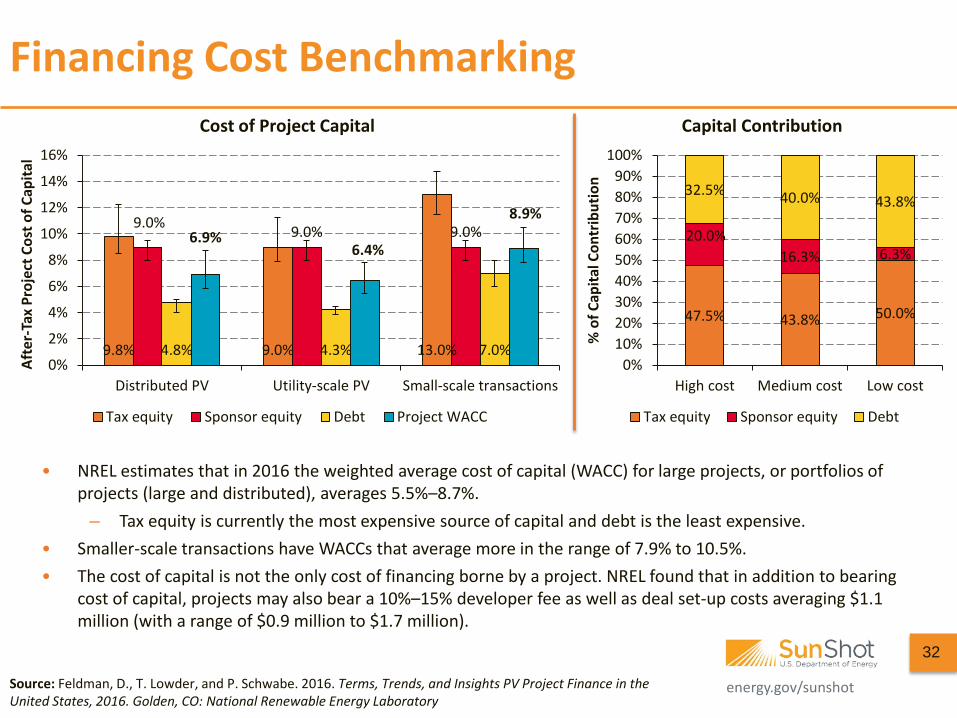
Financing Cost Benchmarking
• NREL estimates that in 2016 the weighted average cost of capital (WACC) for large projects, or portfolios of projects (large and distributed), averages 5.5%–8.7%.
– Tax equity is currently the most expensive source of capital and debt is the least expensive. • Smaller-scale transactions have WACCs that average more in the range of 7.9% to 10.5%. • The cost of capital is not the only cost of financing borne by a project. NREL found that in addition to bearing
cost of capital, projects may also bear a 10%–15% developer fee as well as deal set-up costs averaging $1.1 million (with a range of $0.9 million to $1.7 million).
Source: Feldman, D., T. Lowder, and P. Schwabe. 2016. Terms, Trends, and Insights PV Project Finance in the United States, 2016. Golden, CO: National Renewable Energy Laboratory
9.8% 9.0% 13.0%
9.0% 9.0% 9.0%
4.8% 4.3% 7.0%
6.9% 6.4%
8.9%
0%
2%
4%
6%
8%
10%
12%
14%
16%
Distributed PV Utility-scale PV Small-scale transactions
Afte
r-Ta
x Pr
ojec
t Cos
t of C
apita
l
Cost of Project Capital
Tax equity Sponsor equity Debt Project WACC
47.5% 43.8% 50.0%
20.0% 16.3% 6.3%
32.5% 40.0% 43.8%
0%10%20%30%40%50%60%70%80%90%
100%
High cost Medium cost Low cost
% o
f Cap
ital C
ontr
ibut
ion
Capital Contribution
Tax equity Sponsor equity Debt
32
energy.gov/sunshot
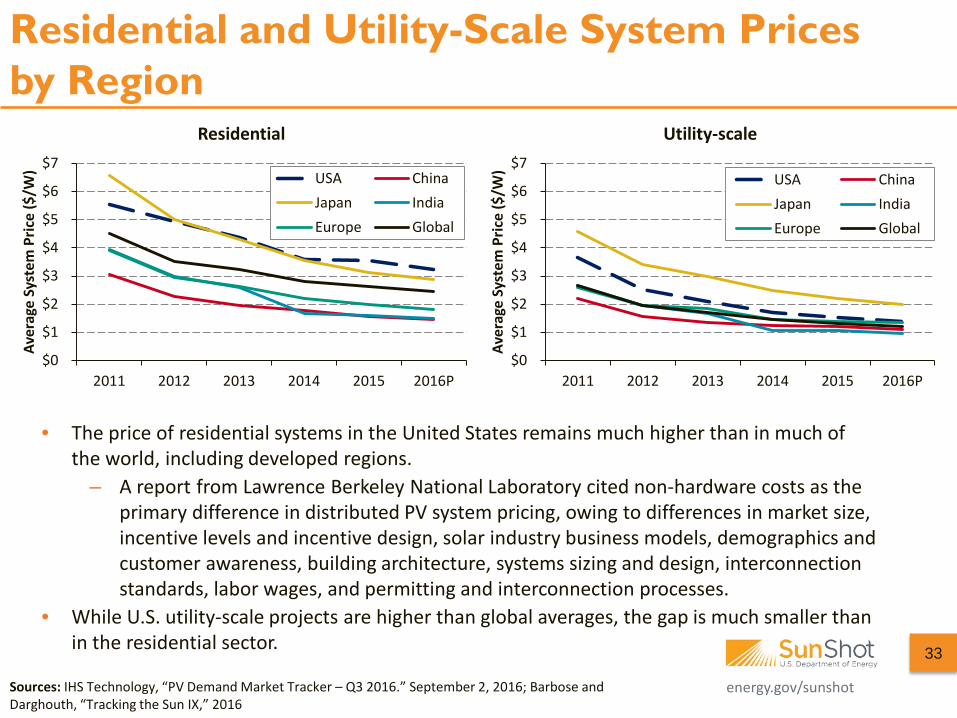
Residential and Utility-Scale System Prices by Region
33
• The price of residential systems in the United States remains much higher than in much of the world, including developed regions.
– A report from Lawrence Berkeley National Laboratory cited non-hardware costs as the primary difference in distributed PV system pricing, owing to differences in market size, incentive levels and incentive design, solar industry business models, demographics and customer awareness, building architecture, systems sizing and design, interconnection standards, labor wages, and permitting and interconnection processes.
• While U.S. utility-scale projects are higher than global averages, the gap is much smaller than in the residential sector.
Sources: IHS Technology, “PV Demand Market Tracker – Q3 2016.” September 2, 2016; Barbose and Darghouth, “Tracking the Sun IX,” 2016
$0
$1
$2
$3
$4
$5
$6
$7
2011 2012 2013 2014 2015 2016P
Aver
age
Syst
em P
rice
($/W
)
Residential
USA ChinaJapan IndiaEurope Global
$0
$1
$2
$3
$4
$5
$6
$7
2011 2012 2013 2014 2015 2016P
Aver
age
Syst
em P
rice
($/W
)
Utility-scale
USA ChinaJapan IndiaEurope Global
energy.gov/sunshot
Agenda
34
• Global Deployment • U.S. Deployment • U.S. Pricing • Global Manufacturing • Component Pricing • Market Activity • Tax Credit Availability
energy.gov/sunshot
35
Note: First Solar reports production, not shipments. Only ReneSola modules are represented. P = Projection. Sources: Company figures based on Q2 2016 (and previous) SEC filings by the respective companies
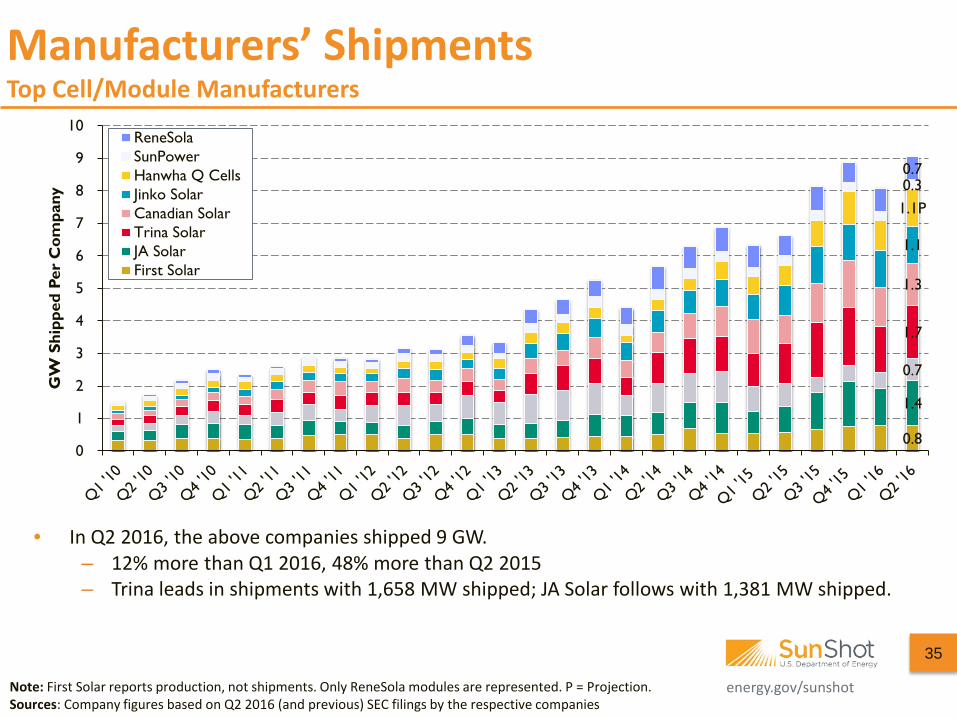
Manufacturers’ Shipments Top Cell/Module Manufacturers
• In Q2 2016, the above companies shipped 9 GW. – 12% more than Q1 2016, 48% more than Q2 2015 – Trina leads in shipments with 1,658 MW shipped; JA Solar follows with 1,381 MW shipped.
0.8
1.4
0.7
1.7
1.3
1.1
1.1P 0.3 0.7
0
1
2
3
4
5
6
7
8
9
10
GW
Shi
pped
Per
Com
pany
ReneSolaSunPowerHanwha Q CellsJinko SolarCanadian SolarTrina SolarJA SolarFirst Solar
energy.gov/sunshot energy.gov/sunshot
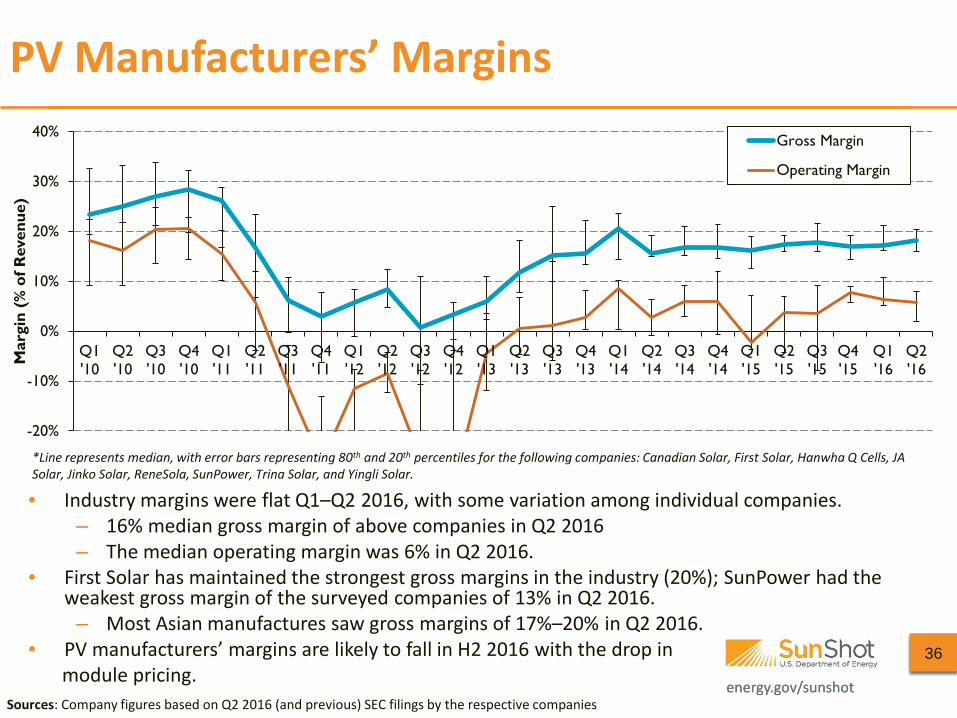
PV Manufacturers’ Margins
• Industry margins were flat Q1–Q2 2016, with some variation among individual companies. – 16% median gross margin of above companies in Q2 2016 – The median operating margin was 6% in Q2 2016.
• First Solar has maintained the strongest gross margins in the industry (20%); SunPower had the weakest gross margin of the surveyed companies of 13% in Q2 2016.
– Most Asian manufactures saw gross margins of 17%–20% in Q2 2016. • PV manufacturers’ margins are likely to fall in H2 2016 with the drop in module pricing.
36
Sources: Company figures based on Q2 2016 (and previous) SEC filings by the respective companies
*Line represents median, with error bars representing 80th and 20th percentiles for the following companies: Canadian Solar, First Solar, Hanwha Q Cells, JA Solar, Jinko Solar, ReneSola, SunPower, Trina Solar, and Yingli Solar.
-20%
-10%
0%
10%
20%
30%
40%
Q1'10
Q2'10
Q3'10
Q4'10
Q1'11
Q2'11
Q3'11
Q4'11
Q1'12
Q2'12
Q3'12
Q4'12
Q1'13
Q2'13
Q3'13
Q4'13
Q1'14
Q2'14
Q3'14
Q4'14
Q1'15
Q2'15
Q3'15
Q4'15
Q1'16
Q2'16
Mar
gin
(% o
f Rev
enue
)
Gross Margin
Operating Margin
energy.gov/sunshot energy.gov/sunshot
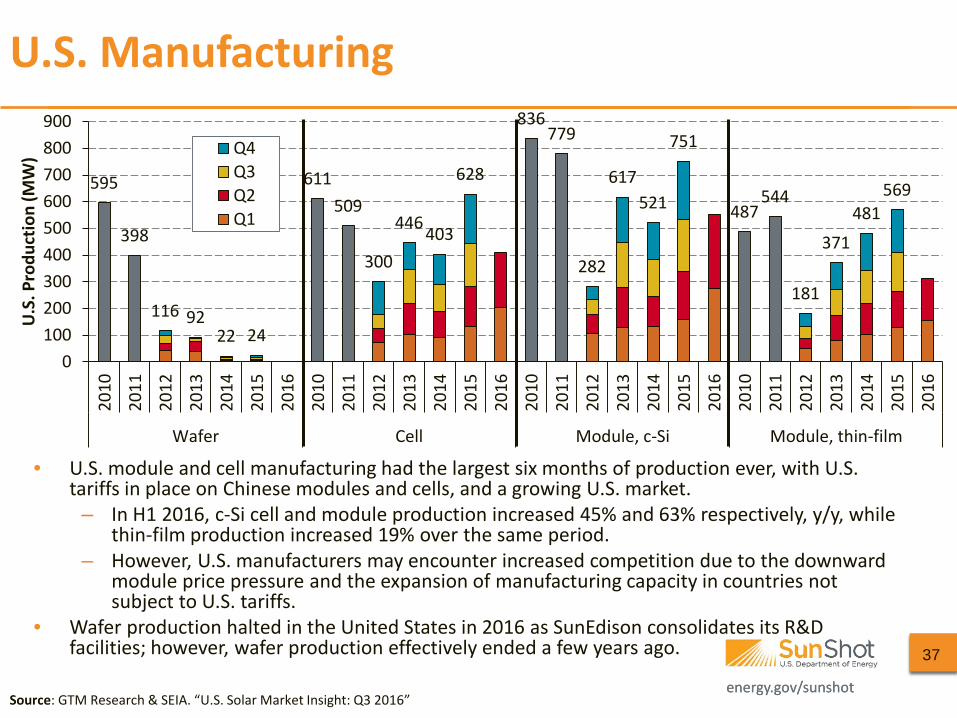
• U.S. module and cell manufacturing had the largest six months of production ever, with U.S. tariffs in place on Chinese modules and cells, and a growing U.S. market.
– In H1 2016, c-Si cell and module production increased 45% and 63% respectively, y/y, while thin-film production increased 19% over the same period.
– However, U.S. manufacturers may encounter increased competition due to the downward module price pressure and the expansion of manufacturing capacity in countries not subject to U.S. tariffs.
• Wafer production halted in the United States in 2016 as SunEdison consolidates its R&D facilities; however, wafer production effectively ended a few years ago.
U.S. Manufacturing
37
Source: GTM Research & SEIA. “U.S. Solar Market Insight: Q3 2016”
595
398
116 92 22 24
611 509
300
446 403
628
836 779
282
617 521
751
487 544
181
371 481
569
0100200300400500600700800900
2010
2011
2012
2013
2014
2015
2016
2010
2011
2012
2013
2014
2015
2016
2010
2011
2012
2013
2014
2015
2016
2010
2011
2012
2013
2014
2015
2016
Wafer Cell Module, c-Si Module, thin-film
U.S
. Pro
duct
ion
(MW
) Q4Q3Q2Q1
energy.gov/sunshot energy.gov/sunshot
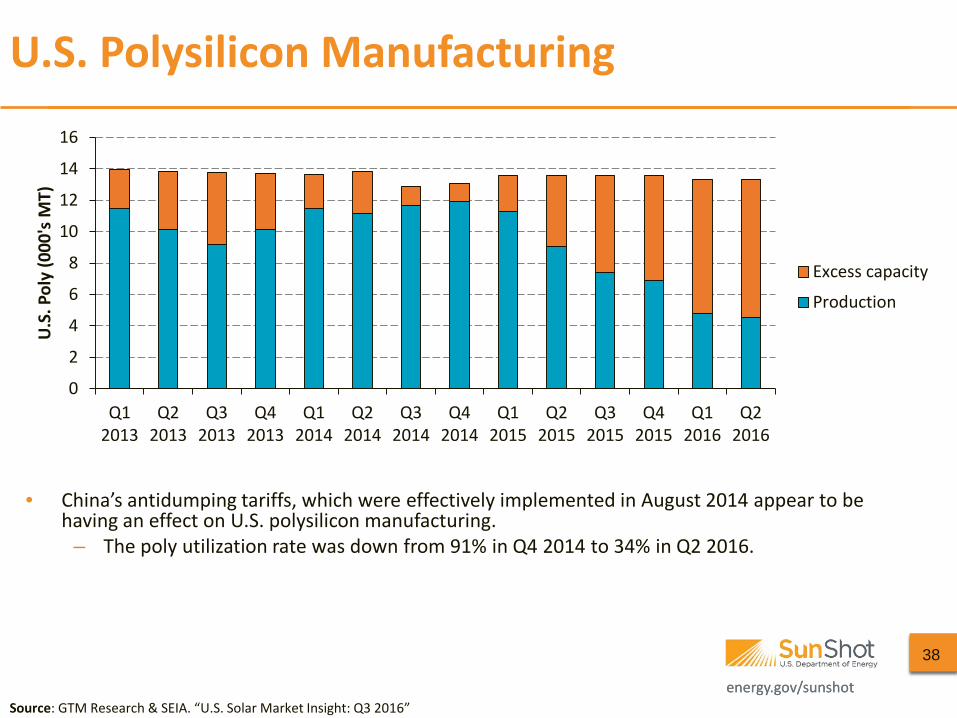
• China’s antidumping tariffs, which were effectively implemented in August 2014 appear to be having an effect on U.S. polysilicon manufacturing.
– The poly utilization rate was down from 91% in Q4 2014 to 34% in Q2 2016.
U.S. Polysilicon Manufacturing
38
Source: GTM Research & SEIA. “U.S. Solar Market Insight: Q3 2016”
0
2
4
6
8
10
12
14
16
Q12013
Q22013
Q32013
Q42013
Q12014
Q22014
Q32014
Q42014
Q12015
Q22015
Q32015
Q42015
Q12016
Q22016
U.S
. Pol
y (0
00's
MT)
Excess capacity
Production
energy.gov/sunshot
Agenda
39
• Global Deployment • U.S. Deployment • U.S. Pricing • Global Manufacturing • Component Pricing • Market Activity • Tax Credit Availability
energy.gov/sunshot energy.gov/sunshot
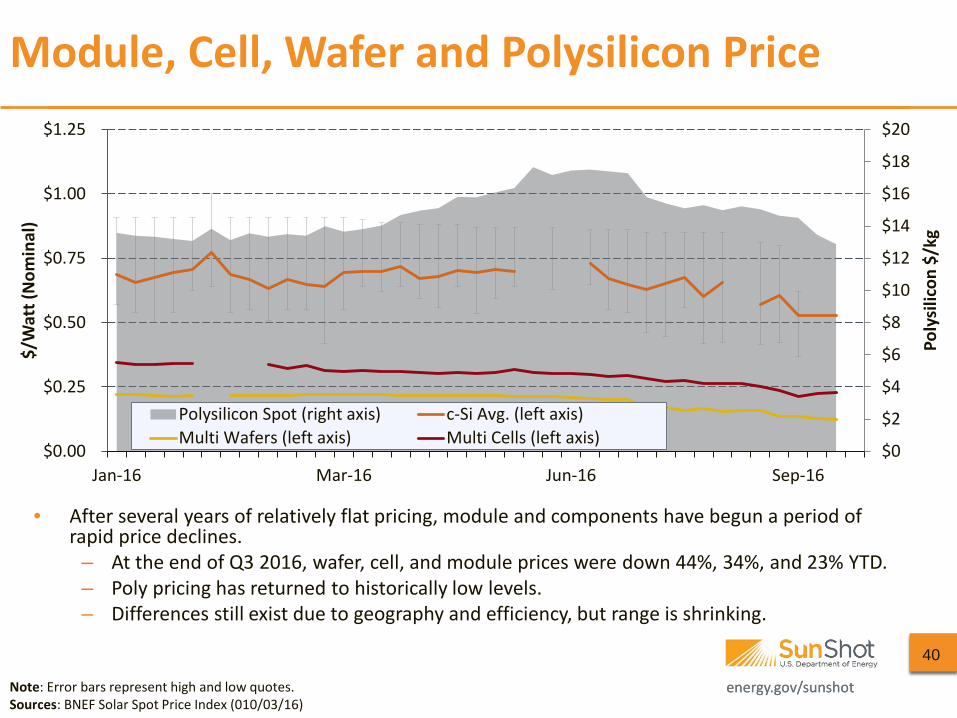
• After several years of relatively flat pricing, module and components have begun a period of rapid price declines.
– At the end of Q3 2016, wafer, cell, and module prices were down 44%, 34%, and 23% YTD. – Poly pricing has returned to historically low levels. – Differences still exist due to geography and efficiency, but range is shrinking.
Module, Cell, Wafer and Polysilicon Price
40
Note: Error bars represent high and low quotes. Sources: BNEF Solar Spot Price Index (010/03/16)
$0
$2
$4
$6
$8
$10
$12
$14
$16
$18
$20
$0.00
$0.25
$0.50
$0.75
$1.00
$1.25
Jan-16 Mar-16 Jun-16 Sep-16
Poly
silic
on $
/kg
$/W
att (
Nom
inal
)
Polysilicon Spot (right axis) c-Si Avg. (left axis)Multi Wafers (left axis) Multi Cells (left axis)
energy.gov/sunshot
-25%
-20%
-15%
-10%
-5%
0%
5%
10%
15%
20%
25%
($5)
($4)
($3)
($2)
($1)
$0
$1
$2
$3
$4
$5
Q1 '07 Q1 '08 Q1 '09 Q1 '10 Q1 '11 Q1 '12 Q1 '13 Q1 '14 Q1 '15 Q1 '16
% R
educ
tion
in m
odul
e A
SP, Q
/Q
$/W
att
(Nom
inal
)
% reduction in ASP, Q/Q
c-Si module ASP
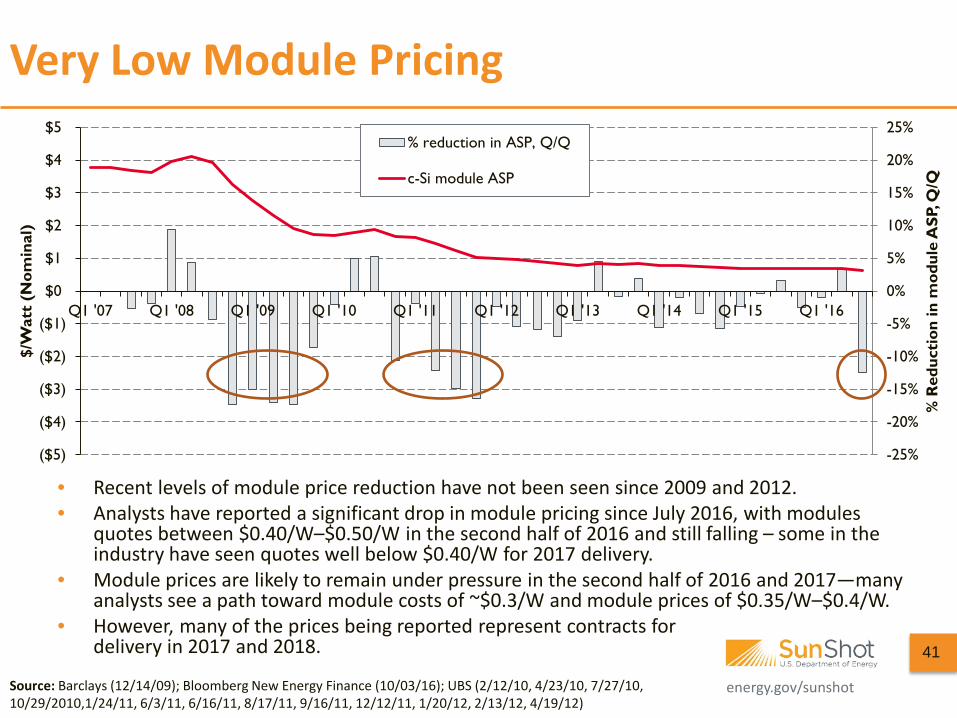
• Recent levels of module price reduction have not been seen since 2009 and 2012. • Analysts have reported a significant drop in module pricing since July 2016, with modules
quotes between $0.40/W–$0.50/W in the second half of 2016 and still falling – some in the industry have seen quotes well below $0.40/W for 2017 delivery.
• Module prices are likely to remain under pressure in the second half of 2016 and 2017—many analysts see a path toward module costs of ~$0.3/W and module prices of $0.35/W–$0.4/W.
• However, many of the prices being reported represent contracts for delivery in 2017 and 2018.
Very Low Module Pricing
Source: Barclays (12/14/09); Bloomberg New Energy Finance (10/03/16); UBS (2/12/10, 4/23/10, 7/27/10, 10/29/2010,1/24/11, 6/3/11, 6/16/11, 8/17/11, 9/16/11, 12/12/11, 1/20/12, 2/13/12, 4/19/12)
41
energy.gov/sunshot
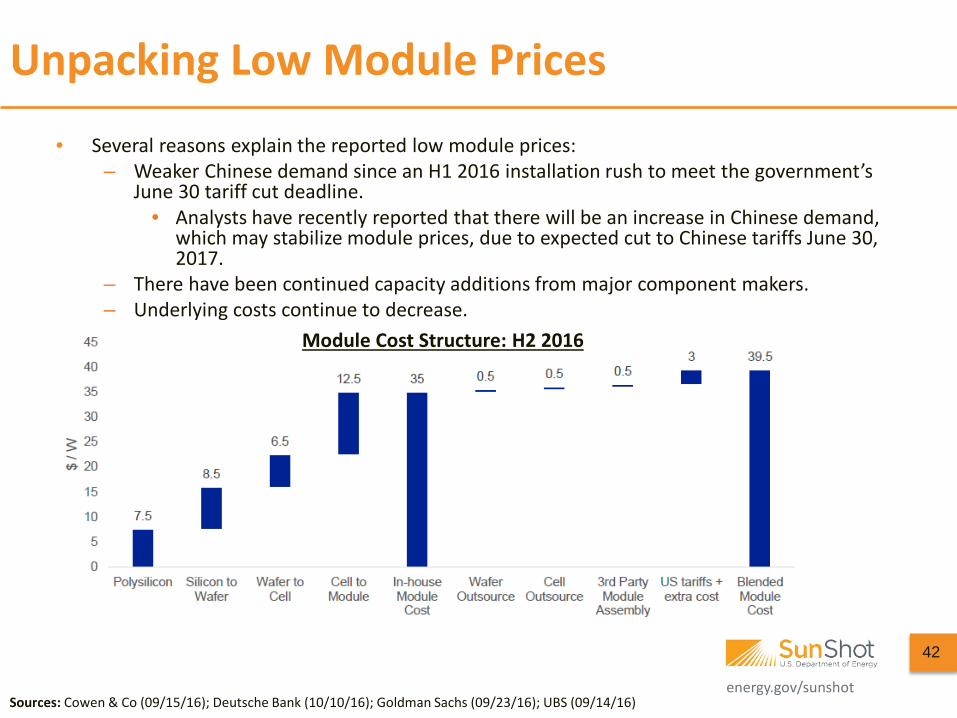
• Several reasons explain the reported low module prices: – Weaker Chinese demand since an H1 2016 installation rush to meet the government’s
June 30 tariff cut deadline. • Analysts have recently reported that there will be an increase in Chinese demand,
which may stabilize module prices, due to expected cut to Chinese tariffs June 30, 2017.
– There have been continued capacity additions from major component makers. – Underlying costs continue to decrease.
Unpacking Low Module Prices
Sources: Cowen & Co (09/15/16); Deutsche Bank (10/10/16); Goldman Sachs (09/23/16); UBS (09/14/16)
Module Cost Structure: H2 2016
42
energy.gov/sunshot
PV Manufacturers’ Cost
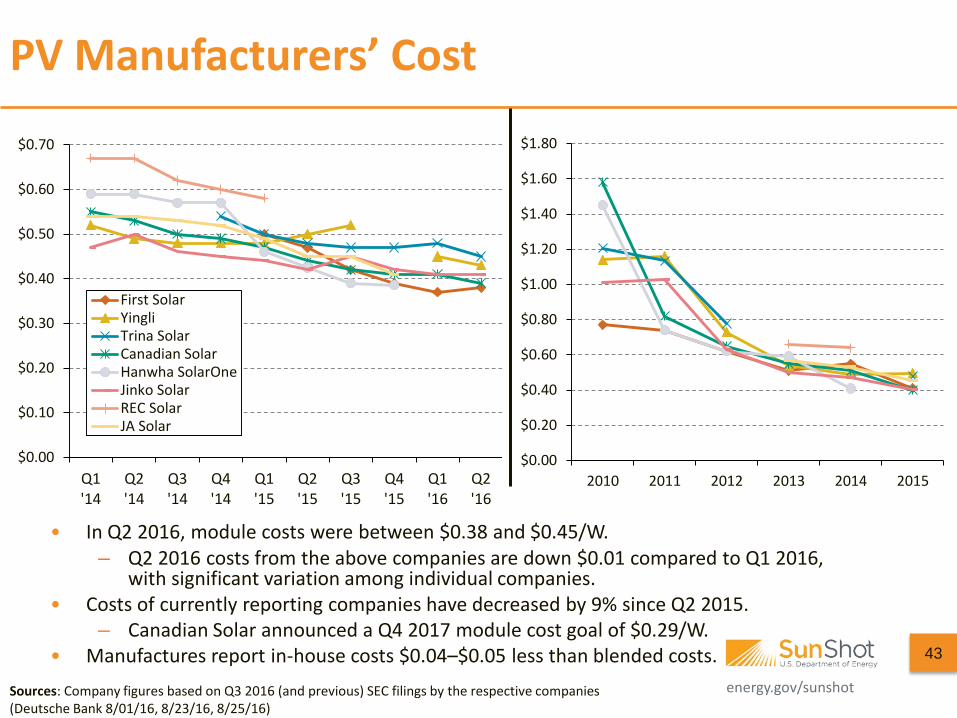
• In Q2 2016, module costs were between $0.38 and $0.45/W. – Q2 2016 costs from the above companies are down $0.01 compared to Q1 2016,
with significant variation among individual companies. • Costs of currently reporting companies have decreased by 9% since Q2 2015.
– Canadian Solar announced a Q4 2017 module cost goal of $0.29/W. • Manufactures report in-house costs $0.04–$0.05 less than blended costs. 43
Sources: Company figures based on Q3 2016 (and previous) SEC filings by the respective companies (Deutsche Bank 8/01/16, 8/23/16, 8/25/16)
$0.00
$0.20
$0.40
$0.60
$0.80
$1.00
$1.20
$1.40
$1.60
$1.80
2010 2011 2012 2013 2014 2015$0.00
$0.10
$0.20
$0.30
$0.40
$0.50
$0.60
$0.70
Q1'14
Q2'14
Q3'14
Q4'14
Q1'15
Q2'15
Q3'15
Q4'15
Q1'16
Q2'16
First SolarYingliTrina SolarCanadian SolarHanwha SolarOneJinko SolarREC SolarJA Solar
energy.gov/sunshot
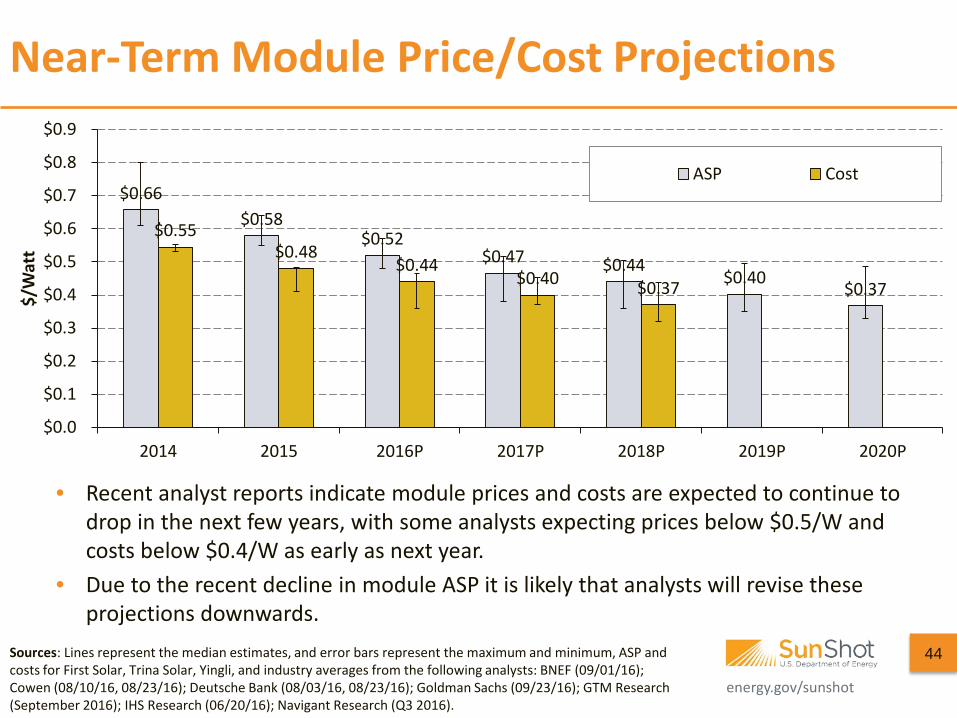
Near-Term Module Price/Cost Projections
44 Sources: Lines represent the median estimates, and error bars represent the maximum and minimum, ASP and costs for First Solar, Trina Solar, Yingli, and industry averages from the following analysts: BNEF (09/01/16); Cowen (08/10/16, 08/23/16); Deutsche Bank (08/03/16, 08/23/16); Goldman Sachs (09/23/16); GTM Research (September 2016); IHS Research (06/20/16); Navigant Research (Q3 2016).
• Recent analyst reports indicate module prices and costs are expected to continue to drop in the next few years, with some analysts expecting prices below $0.5/W and costs below $0.4/W as early as next year.
• Due to the recent decline in module ASP it is likely that analysts will revise these projections downwards.
$0.66 $0.58
$0.52 $0.47 $0.44
$0.40 $0.37
$0.55 $0.48
$0.44 $0.40 $0.37
$0.0
$0.1
$0.2
$0.3
$0.4
$0.5
$0.6
$0.7
$0.8
$0.9
2014 2015 2016P 2017P 2018P 2019P 2020P
$/W
att
ASP Cost
energy.gov/sunshot
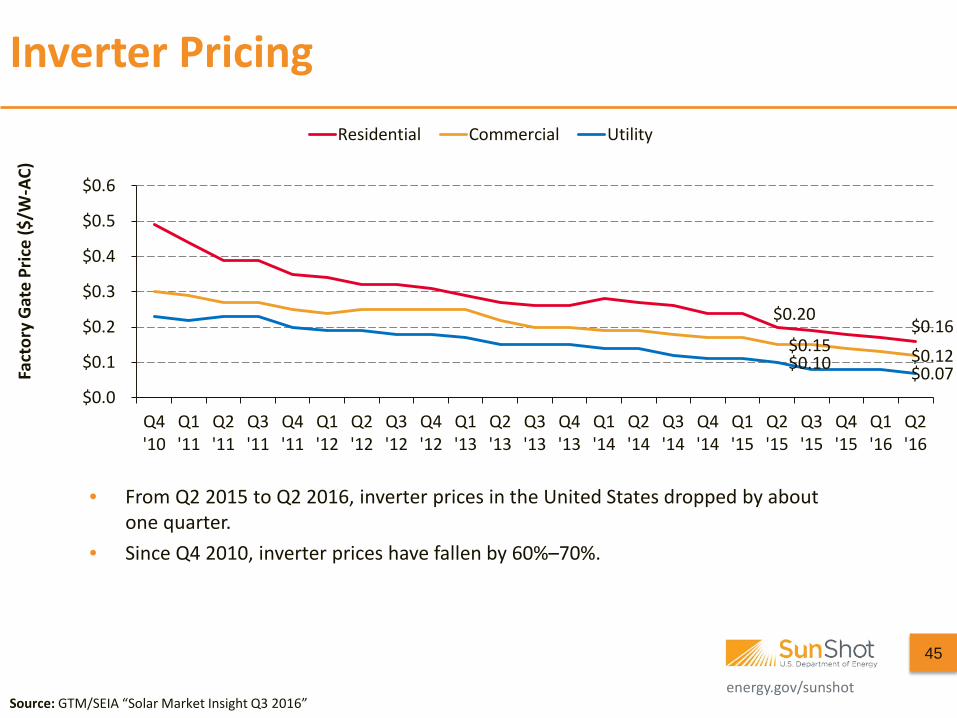
Inverter Pricing
45
Source: GTM/SEIA “Solar Market Insight Q3 2016”
• From Q2 2015 to Q2 2016, inverter prices in the United States dropped by about one quarter.
• Since Q4 2010, inverter prices have fallen by 60%–70%.
$0.20 $0.16
$0.15 $0.12 $0.10 $0.07 $0.0
$0.1
$0.2
$0.3
$0.4
$0.5
$0.6
Q4'10
Q1'11
Q2'11
Q3'11
Q4'11
Q1'12
Q2'12
Q3'12
Q4'12
Q1'13
Q2'13
Q3'13
Q4'13
Q1'14
Q2'14
Q3'14
Q4'14
Q1'15
Q2'15
Q3'15
Q4'15
Q1'16
Q2'16
Fact
ory
Gat
e Pr
ice
($/W
-AC)
Residential Commercial Utility
energy.gov/sunshot
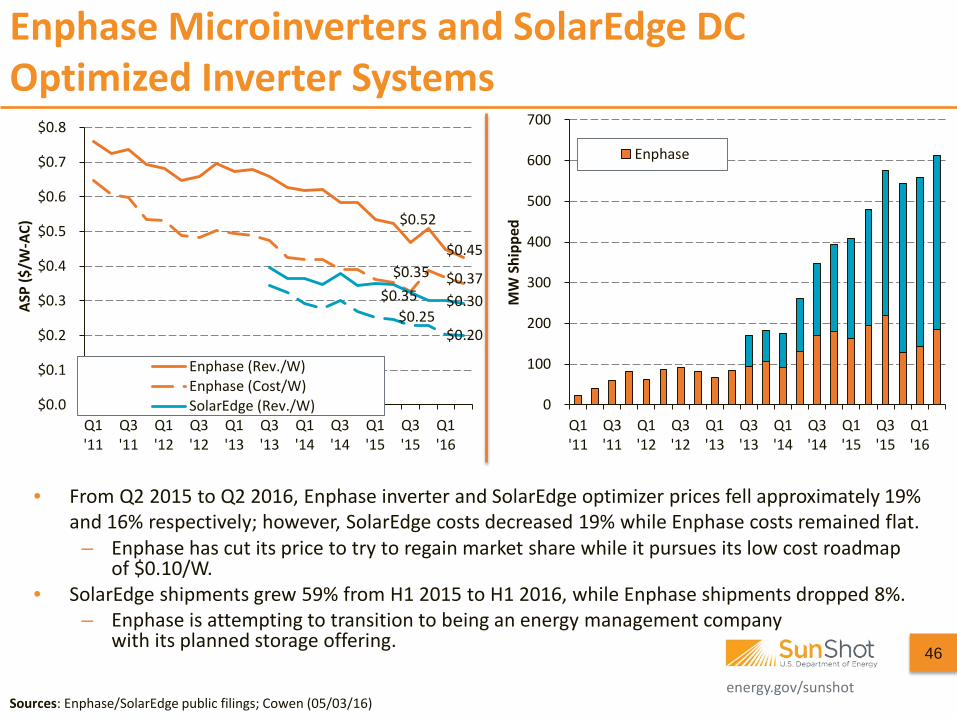
Enphase Microinverters and SolarEdge DC Optimized Inverter Systems
46
Sources: Enphase/SolarEdge public filings; Cowen (05/03/16)
• From Q2 2015 to Q2 2016, Enphase inverter and SolarEdge optimizer prices fell approximately 19% and 16% respectively; however, SolarEdge costs decreased 19% while Enphase costs remained flat.
– Enphase has cut its price to try to regain market share while it pursues its low cost roadmap of $0.10/W.
• SolarEdge shipments grew 59% from H1 2015 to H1 2016, while Enphase shipments dropped 8%. – Enphase is attempting to transition to being an energy management company
with its planned storage offering.
0
100
200
300
400
500
600
700
Q1'11
Q3'11
Q1'12
Q3'12
Q1'13
Q3'13
Q1'14
Q3'14
Q1'15
Q3'15
Q1'16
MW
Shi
pped
Enphase
$0.52
$0.45 $0.35 $0.37
$0.35 $0.30 $0.25
$0.20
$0.0
$0.1
$0.2
$0.3
$0.4
$0.5
$0.6
$0.7
$0.8
Q1'11
Q3'11
Q1'12
Q3'12
Q1'13
Q3'13
Q1'14
Q3'14
Q1'15
Q3'15
Q1'16
ASP
($/W
-AC)
Enphase (Rev./W)Enphase (Cost/W)SolarEdge (Rev./W)
energy.gov/sunshot
Agenda
47
• Global Deployment • U.S. Deployment • U.S. Pricing • Global Manufacturing • Component Pricing • Market Activity • Tax Credit Availability
energy.gov/sunshot
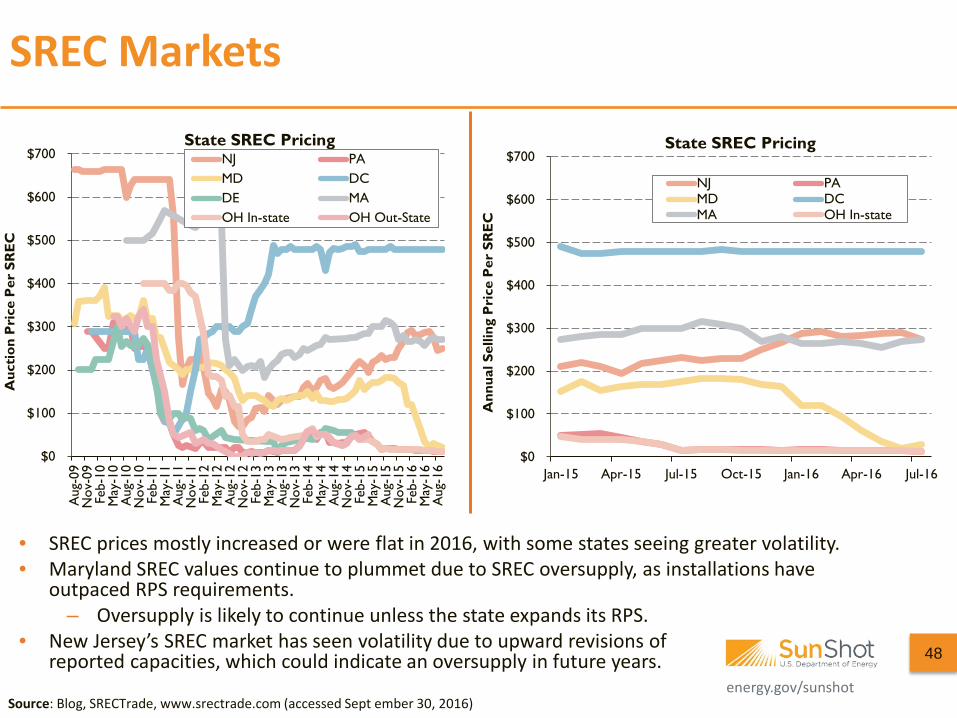
SREC Markets
Source: Blog, SRECTrade, www.srectrade.com (accessed Sept ember 30, 2016)
• SREC prices mostly increased or were flat in 2016, with some states seeing greater volatility. • Maryland SREC values continue to plummet due to SREC oversupply, as installations have
outpaced RPS requirements. – Oversupply is likely to continue unless the state expands its RPS.
• New Jersey’s SREC market has seen volatility due to upward revisions of reported capacities, which could indicate an oversupply in future years.
48
$0
$100
$200
$300
$400
$500
$600
$700
Aug
-09
Nov
-09
Feb-
10M
ay-1
0A
ug-1
0N
ov-1
0Fe
b-11
May
-11
Aug
-11
Nov
-11
Feb-
12M
ay-1
2A
ug-1
2N
ov-1
2Fe
b-13
May
-13
Aug
-13
Nov
-13
Feb-
14M
ay-1
4A
ug-1
4N
ov-1
4Fe
b-15
May
-15
Aug
-15
Nov
-15
Feb-
16M
ay-1
6A
ug-1
6
Auc
tion
Pri
ce P
er S
RE
C
State SREC Pricing NJ PAMD DCDE MAOH In-state OH Out-State
$0
$100
$200
$300
$400
$500
$600
$700
Jan-15 Apr-15 Jul-15 Oct-15 Jan-16 Apr-16 Jul-16A
nnua
l Sel
ling
Pri
ce P
er S
RE
C
State SREC Pricing
NJ PAMD DCMA OH In-state
energy.gov/sunshot
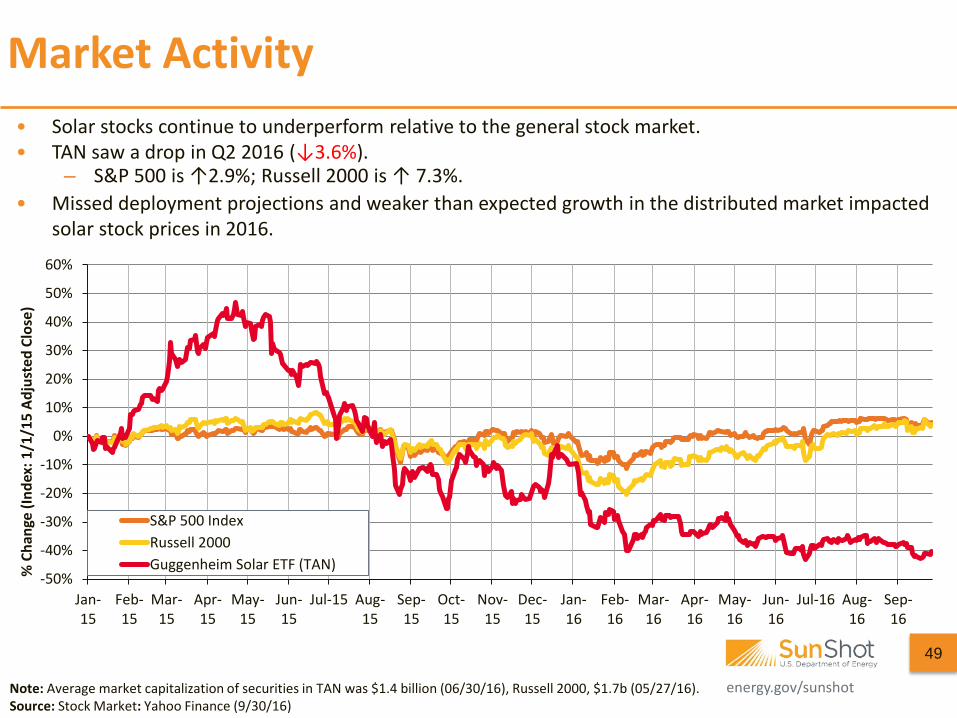
Market Activity • Solar stocks continue to underperform relative to the general stock market. • TAN saw a drop in Q2 2016 (↓3.6%).
– S&P 500 is ↑2.9%; Russell 2000 is ↑ 7.3%. • Missed deployment projections and weaker than expected growth in the distributed market impacted
solar stock prices in 2016.
Note: Average market capitalization of securities in TAN was $1.4 billion (06/30/16), Russell 2000, $1.7b (05/27/16). Source: Stock Market: Yahoo Finance (9/30/16)
49
-50%
-40%
-30%
-20%
-10%
0%
10%
20%
30%
40%
50%
60%
Jan-15
Feb-15
Mar-15
Apr-15
May-15
Jun-15
Jul-15 Aug-15
Sep-15
Oct-15
Nov-15
Dec-15
Jan-16
Feb-16
Mar-16
Apr-16
May-16
Jun-16
Jul-16 Aug-16
Sep-16
% C
hang
e (In
dex:
1/1
/15
Adju
sted
Clo
se)
S&P 500 IndexRussell 2000Guggenheim Solar ETF (TAN)
energy.gov/sunshot
Agenda
50
• Global Deployment • U.S. Deployment • U.S. Pricing • Global Manufacturing • Component Pricing • Market Activity • Tax Credit Availability
energy.gov/sunshot
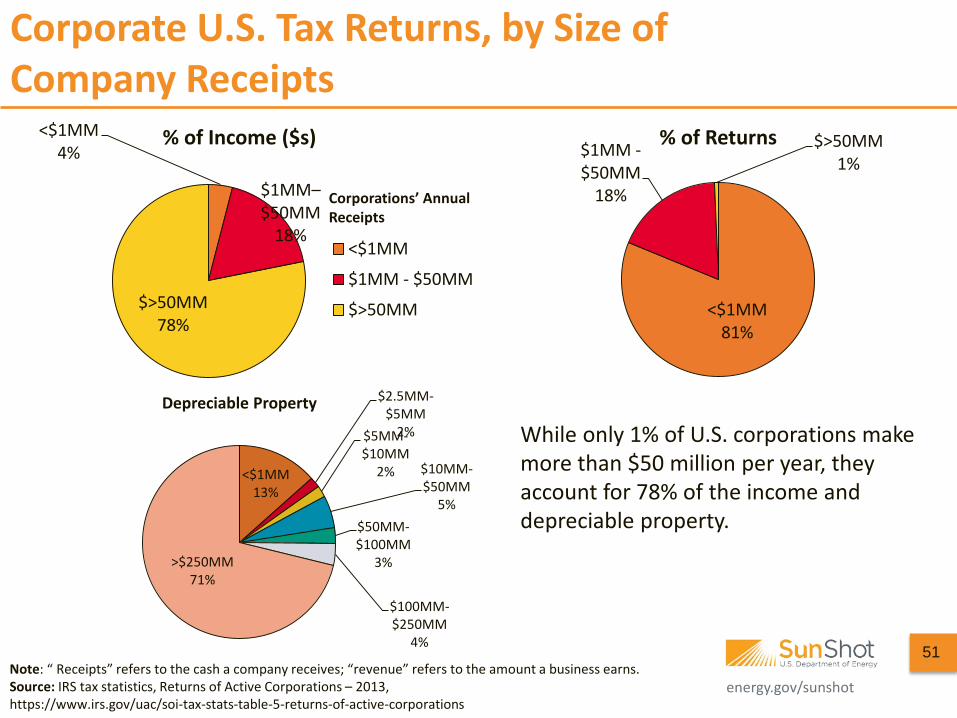
Corporate U.S. Tax Returns, by Size of Company Receipts
<$1MM 81%
$1MM - $50MM
18%
$>50MM 1%
% of Returns <$1MM 4%
$1MM–$50MM
18%
$>50MM 78%
% of Income ($s)
<$1MM
$1MM - $50MM
$>50MM
Corporations’ Annual Receipts
While only 1% of U.S. corporations make more than $50 million per year, they account for 78% of the income and depreciable property.
Note: “ Receipts” refers to the cash a company receives; “revenue” refers to the amount a business earns. Source: IRS tax statistics, Returns of Active Corporations – 2013, https://www.irs.gov/uac/soi-tax-stats-table-5-returns-of-active-corporations
<$1MM 13%
$2.5MM-$5MM
2% $5MM-$10MM
2% $10MM-$50MM
5% $50MM-$100MM
3%
$100MM-$250MM
4%
>$250MM 71%
Depreciable Property
51
energy.gov/sunshot
$1,000 $8,100 $19,000 $84,700 $377,500 $1,020,000
0%10%20%30%40%50%60%70%80%90%100%
$0$1,000,000$2,000,000$3,000,000$4,000,000$5,000,000$6,000,000$7,000,000$8,000,000$9,000,000
$10,000,000
Inco
me
Tax
Per C
ompa
ny
Company’s Annual Receipts
Average Tax Bill
% of Tax Returns
% of Depreciable Assets
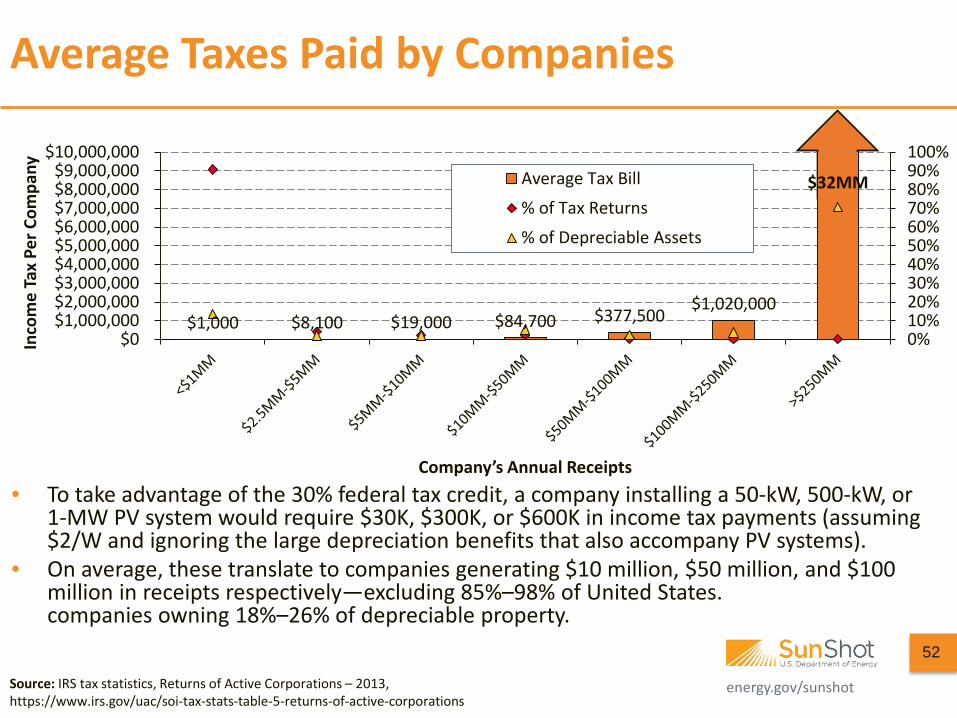
Average Taxes Paid by Companies
• To take advantage of the 30% federal tax credit, a company installing a 50-kW, 500-kW, or 1-MW PV system would require $30K, $300K, or $600K in income tax payments (assuming $2/W and ignoring the large depreciation benefits that also accompany PV systems).
• On average, these translate to companies generating $10 million, $50 million, and $100 million in receipts respectively—excluding 85%–98% of United States. companies owning 18%–26% of depreciable property.
Source: IRS tax statistics, Returns of Active Corporations – 2013, https://www.irs.gov/uac/soi-tax-stats-table-5-returns-of-active-corporations
$32MM
52
energy.gov/sunshot
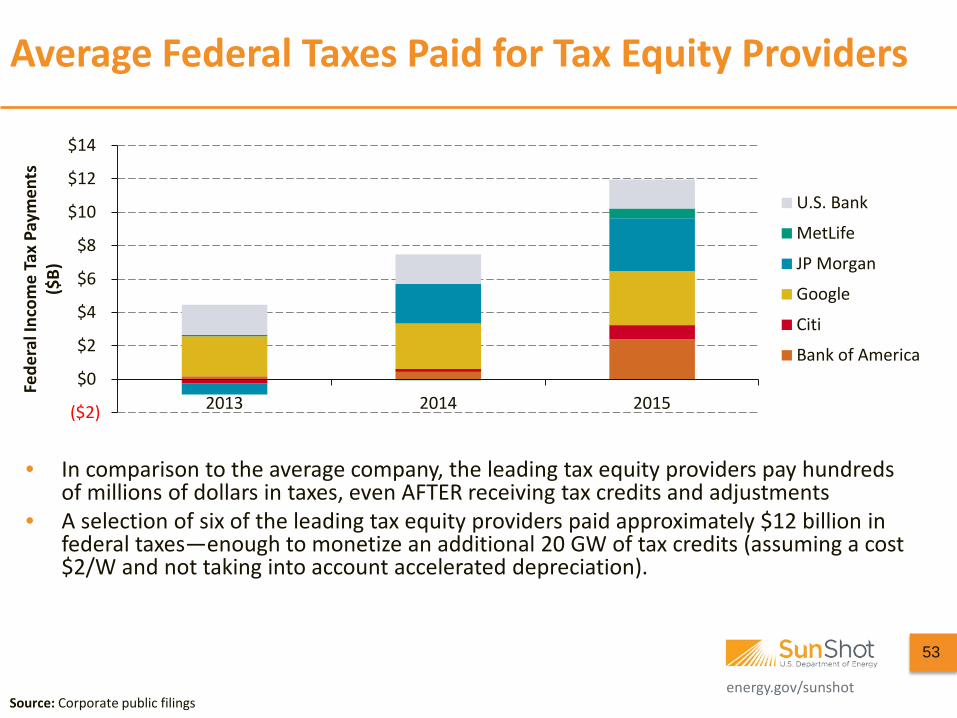
Average Federal Taxes Paid for Tax Equity Providers
• In comparison to the average company, the leading tax equity providers pay hundreds of millions of dollars in taxes, even AFTER receiving tax credits and adjustments
• A selection of six of the leading tax equity providers paid approximately $12 billion in federal taxes—enough to monetize an additional 20 GW of tax credits (assuming a cost $2/W and not taking into account accelerated depreciation).
Source: Corporate public filings
($2)
$0
$2
$4
$6
$8
$10
$12
$14
2013 2014 2015
Fede
ral I
ncom
e Ta
x Pa
ymen
ts
($B)
U.S. Bank
MetLife
JP Morgan
Citi
Bank of America
53
energy.gov/sunshot
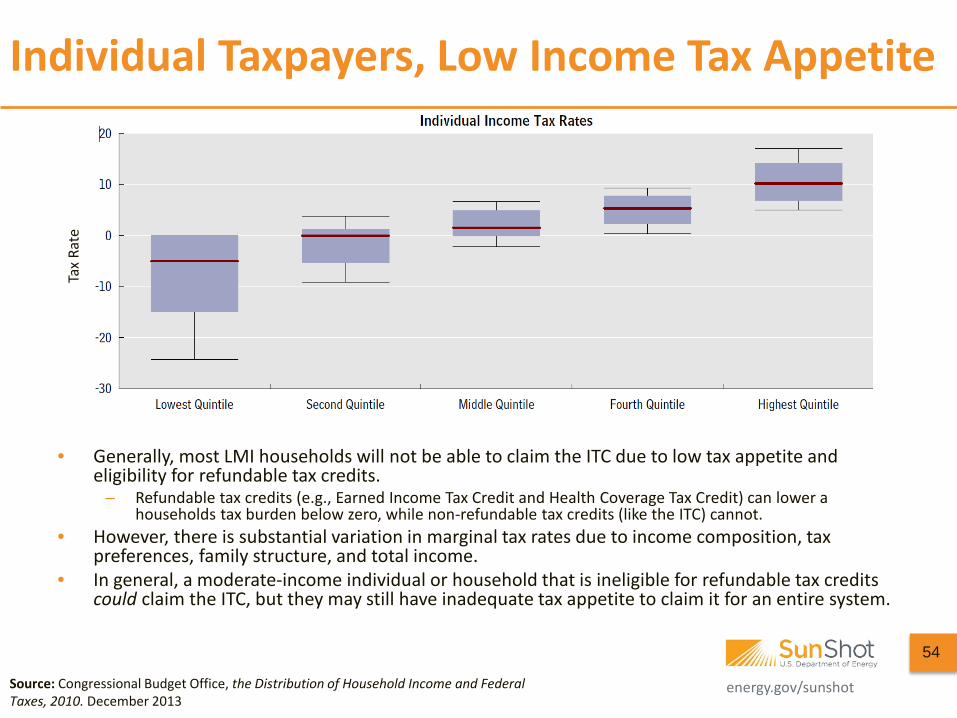
Individual Taxpayers, Low Income Tax Appetite
• Generally, most LMI households will not be able to claim the ITC due to low tax appetite and eligibility for refundable tax credits.
– Refundable tax credits (e.g., Earned Income Tax Credit and Health Coverage Tax Credit) can lower a households tax burden below zero, while non-refundable tax credits (like the ITC) cannot.
• However, there is substantial variation in marginal tax rates due to income composition, tax preferences, family structure, and total income.
• In general, a moderate-income individual or household that is ineligible for refundable tax credits could claim the ITC, but they may still have inadequate tax appetite to claim it for an entire system.
Source: Congressional Budget Office, the Distribution of Household Income and Federal Taxes, 2010. December 2013
54
Tax
Rate
energy.gov/sunshot
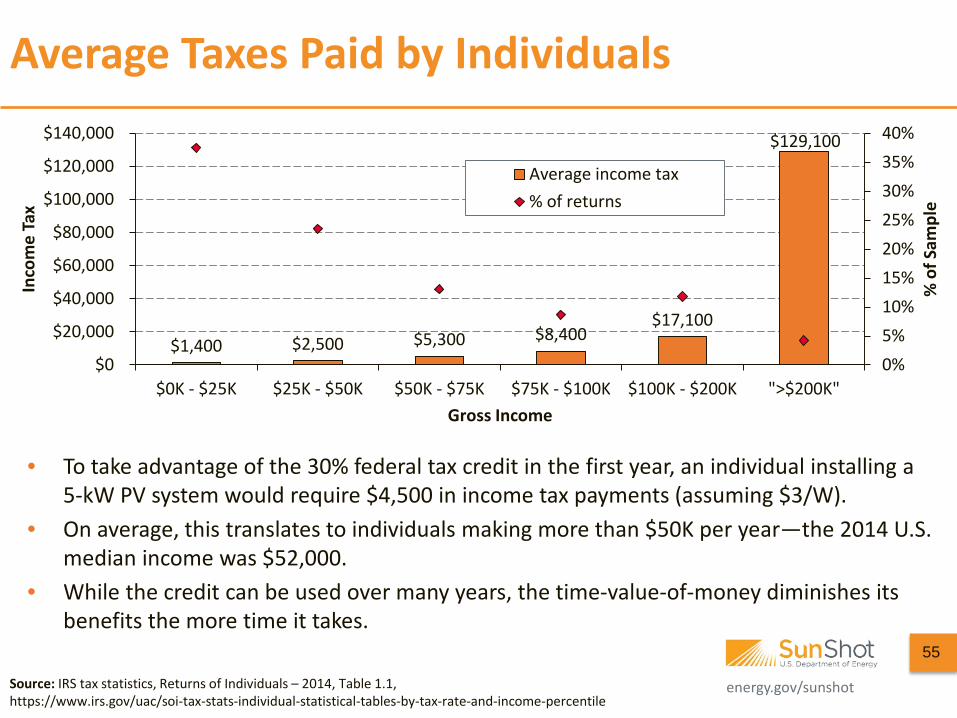
Average Taxes Paid by Individuals
• To take advantage of the 30% federal tax credit in the first year, an individual installing a 5-kW PV system would require $4,500 in income tax payments (assuming $3/W).
• On average, this translates to individuals making more than $50K per year—the 2014 U.S. median income was $52,000.
• While the credit can be used over many years, the time-value-of-money diminishes its benefits the more time it takes.
Source: IRS tax statistics, Returns of Individuals – 2014, Table 1.1, https://www.irs.gov/uac/soi-tax-stats-individual-statistical-tables-by-tax-rate-and-income-percentile
55
$1,400 $2,500 $5,300 $8,400 $17,100
$129,100
0%5%10%15%20%25%30%35%40%
$0
$20,000
$40,000
$60,000
$80,000
$100,000
$120,000
$140,000
$0K - $25K $25K - $50K $50K - $75K $75K - $100K $100K - $200K ">$200K"
% o
f Sam
ple
Inco
me
Tax
Gross Income
Average income tax% of returns
energy.gov/sunshot
David Feldman Senior Financial Analyst
National Renewable Energy Laboratory 202-488-2231
Daniel Boff Junior Energy Analyst
Contractor to the United States Department of Energy 202-287-1904
Robert Margolis Senior Analyst
National Renewable Energy Laboratory 202-488-2222
Thank You
The authors are highly indebted to the following individuals for their insights and contributions to this brief: Jenny Chase, BNEF; Jenny Heeter, NREL; Shayle Kann, GTM Research; Jeffrey Logan, NREL; Mike Meshek, NREL; David Mooney, NREL; Nathan Serota, BNEF; Edward Settle, NREL; MJ Shiao, GTM Research; Scott Stephens, NRG Energy, Inc.; Edurne Zoco, IHS
energy.gov/sunshot energy.gov/sunshot
17% 18%
-30%
-20%
-10%
0%
10%
20%
30%
40%
50%
60%
Q1'12
Q2'12
Q3'12
Q4'12
Q1'13
Q2'13
Q3'13
Q4'13
Q1'14
Q2'14
Q3'14
Q4'14
Q1'15
Q2'15
Q3'15
Q4'15
Q1'16
Q2'16
2007 2008 2009 2010 2011 2012 2013 2014 2015
First Solar RenesolaJA Solar YingliTrina Solar Canadian SolarJinko Solar Hanwha SolarOneSunPower Median
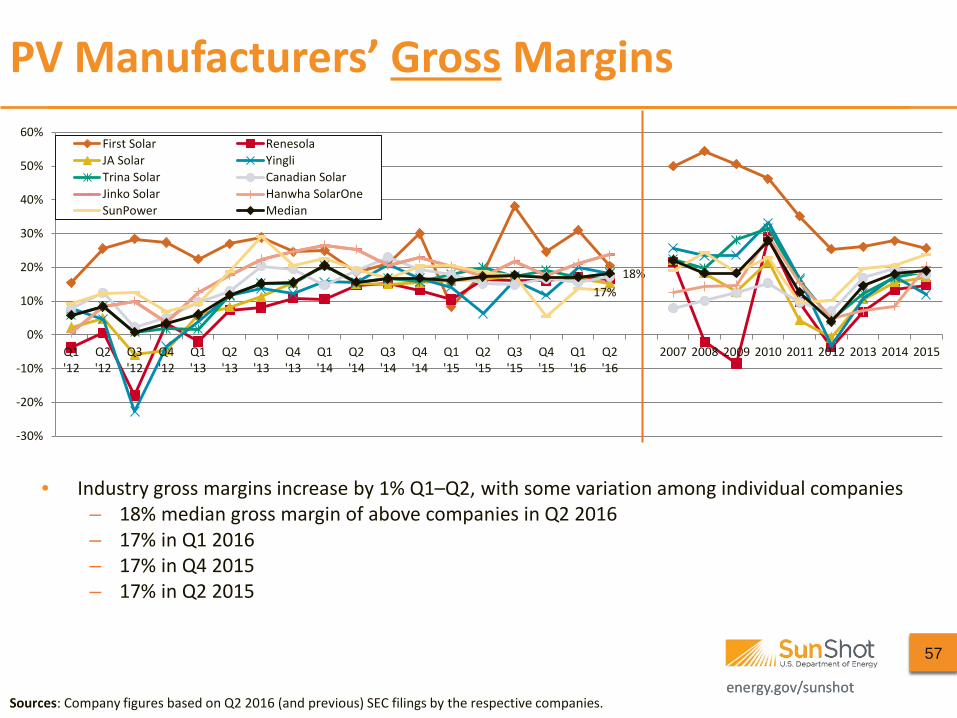
PV Manufacturers’ Gross Margins
Sources: Company figures based on Q2 2016 (and previous) SEC filings by the respective companies.
• Industry gross margins increase by 1% Q1–Q2, with some variation among individual companies – 18% median gross margin of above companies in Q2 2016 – 17% in Q1 2016 – 17% in Q4 2015 – 17% in Q2 2015
57
energy.gov/sunshot energy.gov/sunshot Sources: Company figures based on Q2 2016 (and previous) SEC filings by the surveyed companies.
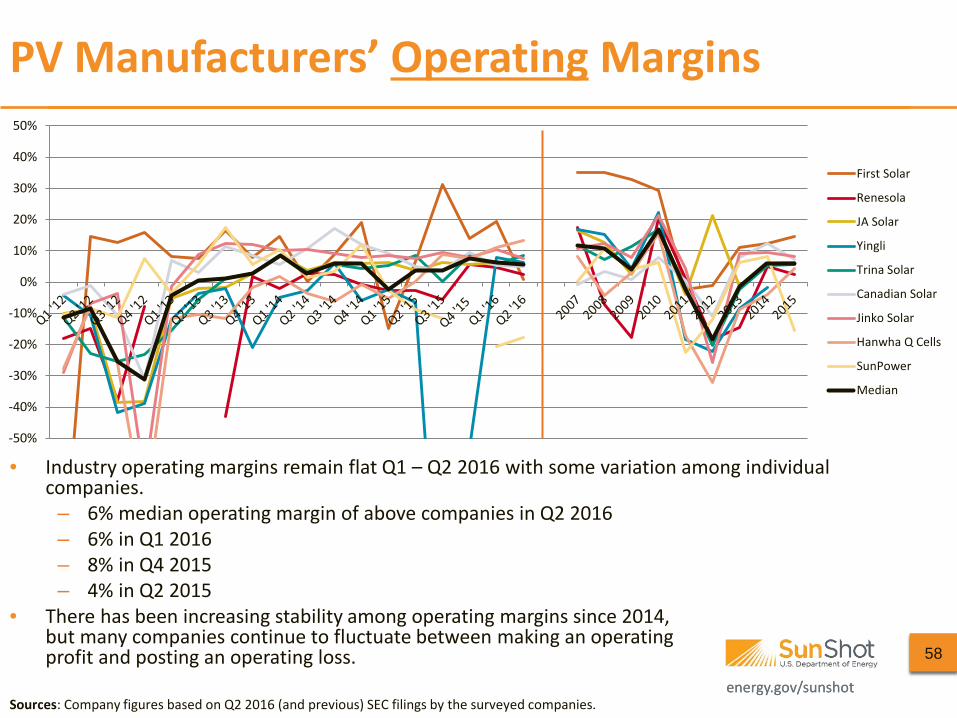
PV Manufacturers’ Operating Margins
• Industry operating margins remain flat Q1 – Q2 2016 with some variation among individual companies.
– 6% median operating margin of above companies in Q2 2016 – 6% in Q1 2016 – 8% in Q4 2015 – 4% in Q2 2015
• There has been increasing stability among operating margins since 2014, but many companies continue to fluctuate between making an operating profit and posting an operating loss. 58
-50%
-40%
-30%
-20%
-10%
0%
10%
20%
30%
40%
50%
First Solar
Renesola
JA Solar
Yingli
Trina Solar
Canadian Solar
Jinko Solar
Hanwha Q Cells
SunPower
Median
energy.gov/sunshot energy.gov/sunshot Sources: Company figures based on Q2 2016 (and previous) SEC filings by the surveyed companies.
List of Acronyms and Abbreviations
• ASP average selling price • kW kilowatt • kWh kilowatt-hour • LMI low-to-moderate income • MM million • MW megawatt • PPA power purchase agreement • PURPA Public Utility Regulatory Policies Act • Q/Q quarter over quarter • ROW rest of world • SREC solar renewable energy certificates • ToU time of use • W watt • WACC weighted average cost of capital • y/y year over year • YTD year to date
59