Embed Size (px)
Citation preview
JOURNAL OF SOFTWAREMAINTENANCE AND EVOLUTION: RESEARCH AND PRACTICEJ. Softw. Maint. Evol.: Res. Pract. 2010; 22:191–210Published online 5 February 2010 inWiley InterScience (www.interscience.wiley.com). DOI: 10.1002/smr.414
Research
Software Cartography:thematic software visualizationwith consistent layout‡
Adrian Kuhn∗,†, David Erni, Peter Loretan andOscar Nierstrasz
Software Composition Group, University of Bern, Switzerland
SUMMARY
Software visualizations can provide a concise overview of a complex software system. Unfortunately, assoftware has no physical shape, there is no ‘natural’ mapping of software to a two-dimensional space. Asa consequence most visualizations tend to use a layout in which position and distance have no meaning,and consequently layout typically diverges from one visualization to another. We propose an approachto consistent layout for software visualization, called Software Cartography, in which the position of asoftware artifact reflects its vocabulary, and distance corresponds to similarity of vocabulary. We useLatent Semantic Indexing (LSI) to map software artifacts to a vector space, and then use MultidimensionalScaling (MDS) to map this vector space down to two dimensions. The resulting consistent layout allowsus to develop a variety of thematic software maps that express very different aspects of software whilemaking it easy to compare them. The approach is especially suitable for comparing views of evolvingsoftware, as the vocabulary of software artifacts tends to be stable over time. We present a prototypeimplementation of Software Cartography, and illustrate its use with practical examples from numerousopen-source case studies. Copyright © 2010 John Wiley & Sons, Ltd.
Received 23 February 2009; Revised 2 July 2009; Accepted 20 August 2009
KEY WORDS: Software Cartography; software visualization; program comprehension; latent-semantic analysis;Multidimensional Scaling; software evolution; spatial representations of code
∗Correspondence to: Adrian Kuhn, Software Composition Group, University of Bern, Switzerland.†E-mail: [email protected], URL: http://scg.unibe.ch‡A short version of the paper was previously published in the Proceedings of 15th Working Conference on ReverseEngineering (WCRE’08), IEEE Computer Society Press, Los Alamitos CA, October 2008, pp. 209–218.
Contract/grant sponsor: Swiss National Science FoundationContract/grant sponsor: Hasler Foundation; contract/grant number: 200020-113342
Copyright 2010 John Wiley & Sons, Ltd.
192 A. KUHN ET AL.
1. INTRODUCTION
Software visualization offers an attractive means to abstract from the complexity of large softwaresystems. A single graphic can convey a great deal of information about various aspects of a complexsoftware system, such as its structure, the degree of coupling and cohesion, growth patterns, defectrates, and so on [1–4]. Unfortunately, the great wealth of different visualizations that have beendeveloped to abstract away from the complexity of software has led to yet another source ofcomplexity: it is hard to compare different visualizations of the same software system and correlatethe information they present.We can contrast this situation with that of conventional thematic maps found in an atlas. Different
phenomena, ranging from population density to industry sectors, birth rate, or even flow of trade,are all displayed and expressed using the same consistent layout. It is easy to correlate differentkinds of information concerning the same geographical entities because they are generally presentedusing the same kind of layout. This is possible because (i) there is a natural mapping of positionand distance information to a two-dimensional layout§ and (ii) because by convention North isnormally considered to be on the top¶ .Software artifacts, on the other hand, have no natural layout as they have no physical location.
Distance and orientation also have no obvious meaning for software. It is presumably for this reasonthat there are so many different and incomparable ways of visualizing software. A cursory survey ofrecent SOFTVIS and VISSOFT publications shows that the majority of the presented visualizationsfeature arbitrary layout, the most common being based on alphabetical order and arbitrary hash-keyorder. (Hash-key order is what we get in most programming languages when iterating over theelements of a Set or Dictionary collection.)Consistent layout for software would make it easier to compare visualizations of different kinds
of information. But what should be the basis for positioning representations of software artifactswithin a ‘cartographic’ software map?What we need is a semantically meaningful notion of positionand distance for software artifacts, a spatial representation of software in a multidimensional space,which can then be mapped to consistent layout on the two-dimensional visualization plane.We propose to use vocabulary as the most natural analogue of physical position for software
artifacts, and to map these positions to a two-dimensional space as a way to achieve consistentlayout for software maps. Distance between software artifacts then corresponds to distance in theirvocabulary. Drawing from previous work [6,7] we apply Latent-Semantic Indexing (LSI) [8] to thevocabulary of a system to obtain n-dimensional locations, and we use Multidimensional Scaling(MDS) [9] to obtain a consistent layout. Finally we use cartography techniques (such as digitalelevation, hill-shading and contour lines) to generate a landscape representing the frequency oftopics. We call our approach Software Cartography, and call a series of visualizations SoftwareMaps, when they all use the same consistent layout created by our approach.Why should we adopt vocabulary as distance metric, and not some structural property? First
of all, vocabulary can effectively abstract away from the technical details of source code [6] by
§Even if we consider that the Earth is not flat on a global scale, there is still a natural mapping of position and distanceto a two-dimensional layout; see the many types of cartographic projections (e.g., the Mercator projection) used duringcenturies to do that. In fact, this is true for a large class of manifolds.¶The orientation of modern world maps, that is North on the top, has not always been the prevailing convention. Ontraditional Muslim world maps, for example, South used to be in the top. Hence, if Europe would have fallen to theOttomans at the Battle of Vienna in 1683, all our maps might be drawn upside down by now [5].
Copyright 2010 John Wiley & Sons, Ltd. J. Softw. Maint. Evol.: Res. Pract. 2010; 22:191–210DOI: 10.1002/smr
SOFTWARE CARTOGRAPHY 193
capturing the key domain concepts of source code. Software entities with similar vocabulary areconceptually and topically close. Lexical similarity has proven useful to detect high-level clones[10] and cross-cutting concerns [11] in software. Furthermore, it is known that over time vocabularytends to be more stable than the structure of software [12], and tends to grow rather than to change[13]. Although refactorings may cause functionality to be renamed or moved, the overall vocabularytends not to change, except as a side-effect of growth. This suggests that vocabulary will be relativelystable in the face of change, except where significant growth occurs. As a consequence, vocabularynot only offers an intuitive notion of position that can be used to provide a consistent layout fordifferent kinds of thematic maps, but it also provides a robust and consistent layout for mappingan evolving system. System growth can be clearly positioned with respect to old and more stableparts of the same system.This paper is an extension of previous work, in which we first proposed Software Cartography for
consistent layout of software visualizations [14]. The main contributions of the current paper are:
• Improved algorithm. In our previous work we presented a technique to create software mapsgiven either as a single release, or all releases of a system at once. In this paper we proposean improved algorithm for incremental software maps that update as new changes appear.
• Visual stability. In our previous work we introduced Software Cartography as an approachto achieve consistent layouts for software visualization. In this paper, we evaluate four opensource case studies to investigate the visual stability of our approach over the evolution of asystem.
• Desiderata for spatial representation. We present a generalization of DeLine’s desiderata forspatial software navigation [15] to spatial representation in general, and complete them withthe desiderata that visual distance should have a meaningful interpretation.
The remainder of the paper is structured as follows. In Section 2 we present our technique formapping software to consistent layouts. In Section 3 we discuss the choice of vocabulary as adistance metric. In Section 4 we illustrate the use of Software Cartography with examples fromnumerous open-source case studies. In Section 5 we investigate the visual stability of SoftwareCartography over the evolution of three open-source systems. In Section 6 we discuss related work.Finally, in Section 7 we conclude with some remarks about future work.
2. SOFTWARE CARTOGRAPHY
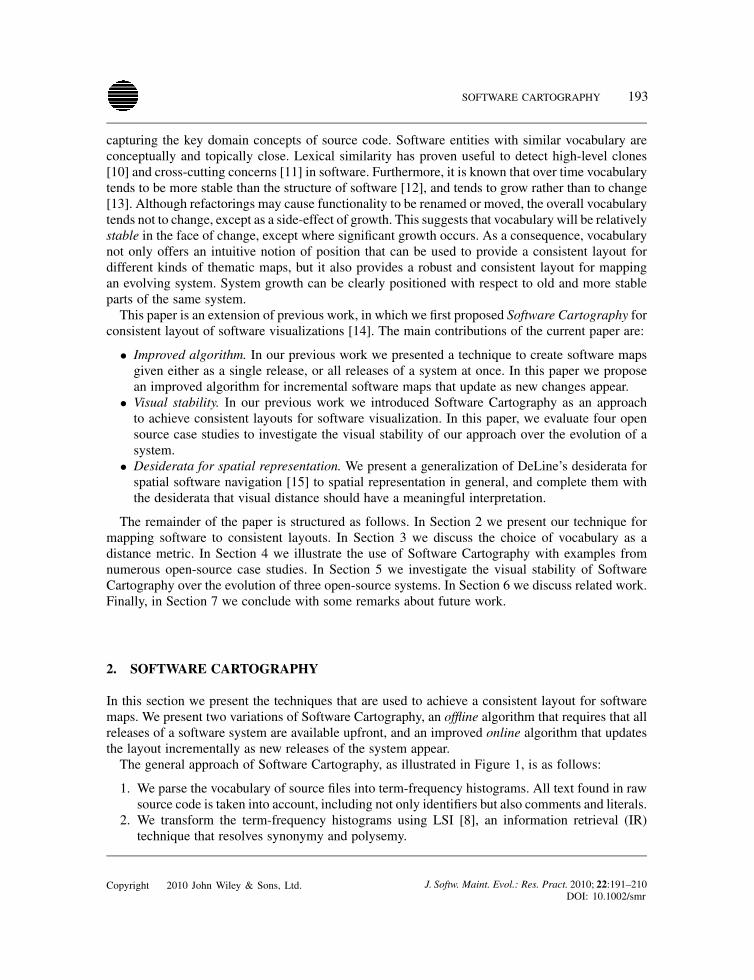
In this section we present the techniques that are used to achieve a consistent layout for softwaremaps. We present two variations of Software Cartography, an offline algorithm that requires that allreleases of a software system are available upfront, and an improved online algorithm that updatesthe layout incrementally as new releases of the system appear.The general approach of Software Cartography, as illustrated in Figure 1, is as follows:
1. We parse the vocabulary of source files into term-frequency histograms. All text found in rawsource code is taken into account, including not only identifiers but also comments and literals.
2. We transform the term-frequency histograms using LSI [8], an information retrieval (IR)technique that resolves synonymy and polysemy.
Copyright 2010 John Wiley & Sons, Ltd. J. Softw. Maint. Evol.: Res. Pract. 2010; 22:191–210DOI: 10.1002/smr
194 A. KUHN ET AL.
LSI MDS Rendering
source files term-document matrix scatter plot thematic map
Figure 1. Software Cartography in a nutshell: (left) the raw text of source files is parsed andindexed using Latent-Semantic Indexing; (center) the high-dimensional term–document matrix ismapped down to two dimensions using MDS; and (right) cartographic visualization techniques are
used to render the final map.
3. We useMDS [9] to map the term-frequency histograms onto the two-dimensional visualizationpane. This preserves the lexical correlation of source files as well as possible.
4. We use cartographic visualization techniques to render an aesthetically appealing landscape.
Possible applications of Software Cartography in the software development process are, . . .
• . . . to navigate within a software system, be it for development or analysis.• . . . to relate different metrics to each other, e.g., search results and bug prediction.• . . . to stay in touch with other developers of your team, by showing open files of other devel-opers.
• . . . to understand a systems domain upon first contact.• . . . to explore a system during reverse engineering.
We implemented a prototype of our approach, CODEMAP, which is available as an open-sourceproject. CODEMAP was originally programmed in Smalltalk, in the mean time development hasbeen moved to Java. CODEMAP is available as an Eclipse plug-in‖.
2.1. Iterative online Software Cartography
In our previous work we presented a technique to create software maps given either a single release,or all releases of a system at once [14]. In this paper we propose an improved algorithm forincremental software maps that update as new changes appear.The offline scenario processes all releases in one pass.
• The offline variation processes all releases of a software system at once, up to and until MDS.Only then the location data is grouped by release, and an separate map for each release isrendered. That is both lexical similarity as well as position on the map anticipate all futureevolvements from the first map on, as indexing and scaling take information of all releasesinto account. This scenario requires that information about all releases is available, which isgiven when performing post-mortem analysis of an existing system.
• The online variation processes the input release by release (or, when integrated into a devel-opment environment, even change by change). For each release, the current source as well asinformation carried over from the previous Software Cartography computation are used. In thefirst step, the source files of the current release and of previous releases are processed by LSI.
‖http://scg.unibe.ch/codemap.
Copyright 2010 John Wiley & Sons, Ltd. J. Softw. Maint. Evol.: Res. Pract. 2010; 22:191–210DOI: 10.1002/smr
SOFTWARE CARTOGRAPHY 195
This allows removed and added topics to be detected. In the next step, the lexical similarityof all current source files is fed into MDS—together with the positions on the previous mapas starting points, thus leading to more visual stability.
Given a series of releases both variations yield a visually stable sequence of maps. Maps generatedwith the iterative algorithm are less stable over time compared with the post-mortem approach. Theinstability of the iterative approach decreases over time, as the amount of accumulated historicaldata increases with each release. In general, the iterative algorithm is less sensitive to the additionor removal of entire topics between releases, such changes are better observed by performingpost-mortem analysis. Please refer to the evaluation in Section 5 for more details.
2.2. Lexical similarity between source files
As motivated in the introduction, the distance between software entities on the map is based on thelexical similarity of source files. Lexical similarity is an IR technique based on the vocabulary oftext files. Formally, lexical similarity is defined as the cosine between the term-frequency vectors oftwo text documents. That is, the more terms (i.e., identifiers names and operators, but also wordsin comments) two source files share, the closer they are on the map.First, the raw source files are split into terms. Then a matrix is created, which lists for each
document the occurrences of terms. Typically, the vocabulary of source code consists of 500–20 000terms. In fact, studies have shown that the relation between term count and software size follows apower law [16]. For this work, we consider all text found in raw source files as terms. This includesclass names, methods names, parameter names, local variables names, names of invoked methods,but also words found in comments and literal values. Identifiers are further preprocessed by splittingup the camel-case name convention, which is predominantly used in Java source code. Note that asour approach is based on raw text, any programming language that uses textual source files mightbe processed.In a next step, LSI [8] is applied to reduce the rank of the term–document matrix to about 50
dimensions. LSI is able to resolve issues of synonymy and polysemy without the use of predefineddictionaries. This is advantageous for the vocabulary of source code that often deviates from commonEnglish usage. For more details on LSI and lexical similarity, please refer to our previous work onsoftware clustering [6].
2.3. Multidimensional scaling
In order to visualize the lexical similarity between software entities, we must find a mapping thatplaces source files (or classes, or packages, depending on our definition of a document) on thevisualization pane. The placement should reflect the lexical similarity between source files.We use MDS in order to map from the previously established multidimensional term–document
matrix down to two dimensions. MDS tries to minimize a stress function while iteratively placingelements into a low-level space. MDS yields the best approximation of a vector space’s orientation,i.e., it preserves the distance relation between elements as best as possible. This is good for dataexploration problems.Note that MDS is not a force-based graph layout algorithm. MDS does not operate on a graph of
vertices and edges. MDSmaps elements from a high-dimensional metric space to a low-dimensional
Copyright 2010 John Wiley & Sons, Ltd. J. Softw. Maint. Evol.: Res. Pract. 2010; 22:191–210DOI: 10.1002/smr
196 A. KUHN ET AL.
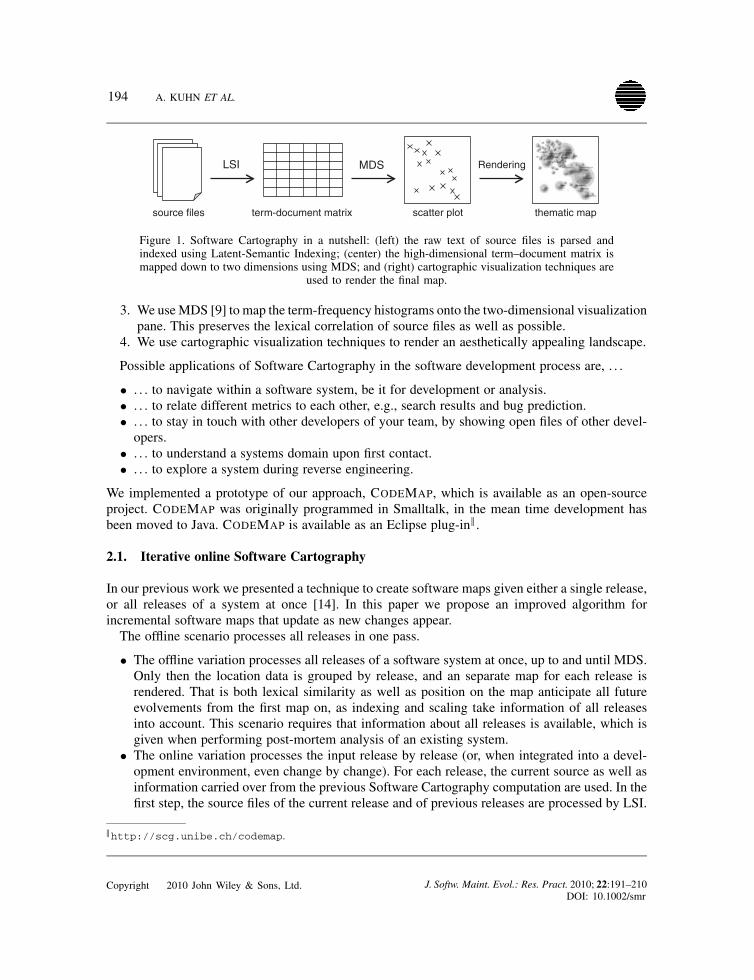
Figure 2. Construction steps: (left) MDS placement of files on the visualization pane; (middle)circles around each file’s location, based on class size in KLOC; (right) digital elevation model withhill-shading and contour lines. (Sidebox on digital elevation model) Each file contributes a Gaussianshaped basis function to the elevation model according to its KLOC size. The contributions of all
files are summed up to a digital elevation model.
metric space. In this work, the high-dimensional space is a term–document matrix using Pearson-8as metric∗∗ and the low-dimensional space a visualization pane with Euclidian metric.This work applies High-throughput MDS (Hit-MDS), which is an optimized implementation
of MDS particularly well-suited for dealing with large data sets [17]. The algorithm was origi-nally designed for clustering multiparallel gene expression probes. These data sets contain thou-sands of gene probes and the corresponding similarity matrix dimension reflects this huge dataamount. The price paid for fast computation is less accurate approximation and a simplified distancemetric.
2.4. Cartographic visualization techniques
Eventually, we use hill-shading [18] to render an aesthetically appealing landscape. Figure 2 illus-trates the final rendering steps of Software Cartography. On the final map, each source file isrendered as a hill whose height corresponds to the entity’s KLOC size.Hill-shading uses a digital elevation model (DEM) to render the illumination of a landscape. The
DEM is a two-dimensional scalar field. Each entity contributes a Gaussian-shaped basis functionto the elevation model. To avoid that closely located entities occlude each other, the contributionsof all files are summed up as shown in Figure 2.A map without labels is of little use. On a software map, all entities are labeled with their name
(class or file name). Labeling is a nontrivial problem, as an algorithm is needed to ensure that labelsdo not overlap. Also labels should not overlap important landmarks. Most labels approaching aresemi-automatic and need manual adjustment, an optimal labeling algorithm does not exist [19].For locations that are near to each other, it is difficult to place the labels so that they do not
overlap and hide each other. For software maps it is even harder due to often long class names
∗∗When computing the lexical similarity between text documents, it is important to use a cosine or Pearson distance metric.The standard Euclidian distance has no meaningful interpretation when applied to term–document vector space!
Copyright 2010 John Wiley & Sons, Ltd. J. Softw. Maint. Evol.: Res. Pract. 2010; 22:191–210DOI: 10.1002/smr
SOFTWARE CARTOGRAPHY 197
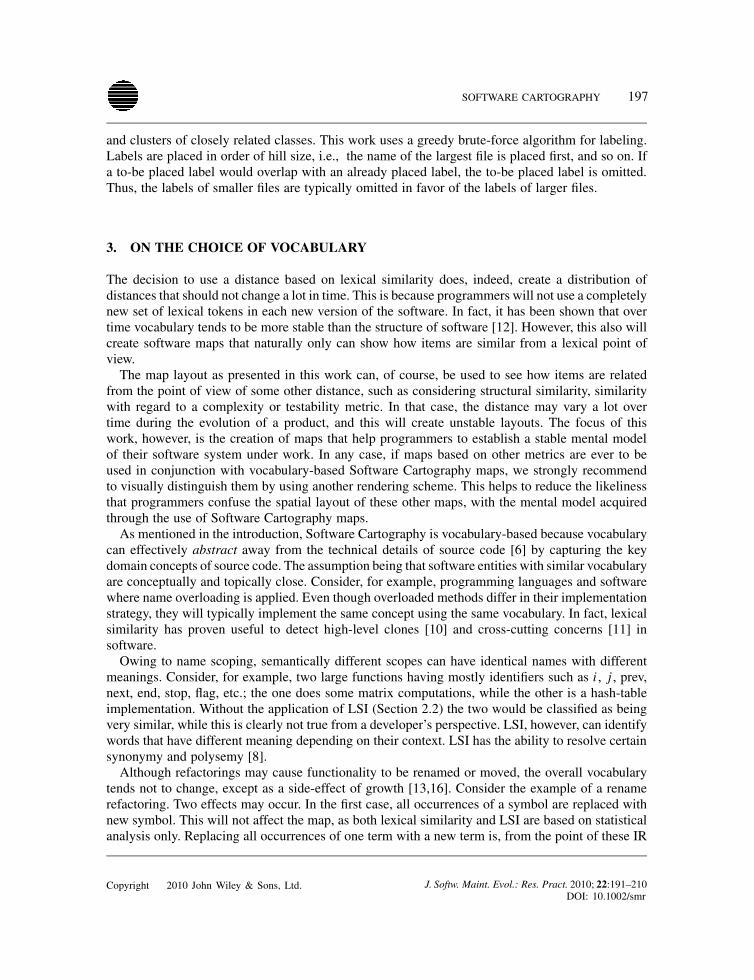
and clusters of closely related classes. This work uses a greedy brute-force algorithm for labeling.Labels are placed in order of hill size, i.e., the name of the largest file is placed first, and so on. Ifa to-be placed label would overlap with an already placed label, the to-be placed label is omitted.Thus, the labels of smaller files are typically omitted in favor of the labels of larger files.
3. ON THE CHOICE OF VOCABULARY
The decision to use a distance based on lexical similarity does, indeed, create a distribution ofdistances that should not change a lot in time. This is because programmers will not use a completelynew set of lexical tokens in each new version of the software. In fact, it has been shown that overtime vocabulary tends to be more stable than the structure of software [12]. However, this also willcreate software maps that naturally only can show how items are similar from a lexical point ofview.The map layout as presented in this work can, of course, be used to see how items are related
from the point of view of some other distance, such as considering structural similarity, similaritywith regard to a complexity or testability metric. In that case, the distance may vary a lot overtime during the evolution of a product, and this will create unstable layouts. The focus of thiswork, however, is the creation of maps that help programmers to establish a stable mental modelof their software system under work. In any case, if maps based on other metrics are ever to beused in conjunction with vocabulary-based Software Cartography maps, we strongly recommendto visually distinguish them by using another rendering scheme. This helps to reduce the likelinessthat programmers confuse the spatial layout of these other maps, with the mental model acquiredthrough the use of Software Cartography maps.As mentioned in the introduction, Software Cartography is vocabulary-based because vocabulary
can effectively abstract away from the technical details of source code [6] by capturing the keydomain concepts of source code. The assumption being that software entities with similar vocabularyare conceptually and topically close. Consider, for example, programming languages and softwarewhere name overloading is applied. Even though overloaded methods differ in their implementationstrategy, they will typically implement the same concept using the same vocabulary. In fact, lexicalsimilarity has proven useful to detect high-level clones [10] and cross-cutting concerns [11] insoftware.Owing to name scoping, semantically different scopes can have identical names with different
meanings. Consider, for example, two large functions having mostly identifiers such as i , j , prev,next, end, stop, flag, etc.; the one does some matrix computations, while the other is a hash-tableimplementation. Without the application of LSI (Section 2.2) the two would be classified as beingvery similar, while this is clearly not true from a developer’s perspective. LSI, however, can identifywords that have different meaning depending on their context. LSI has the ability to resolve certainsynonymy and polysemy [8].Although refactorings may cause functionality to be renamed or moved, the overall vocabulary
tends not to change, except as a side-effect of growth [13,16]. Consider the example of a renamerefactoring. Two effects may occur. In the first case, all occurrences of a symbol are replaced withnew symbol. This will not affect the map, as both lexical similarity and LSI are based on statisticalanalysis only. Replacing all occurrences of one term with a new term is, from the point of these IR
Copyright 2010 John Wiley & Sons, Ltd. J. Softw. Maint. Evol.: Res. Pract. 2010; 22:191–210DOI: 10.1002/smr
198 A. KUHN ET AL.
technologies, a null operation. In the second case, some occurrences of a symbol are replaced withanother symbol that is already used. This will indeed affect the layout of the map. Given that thenew name was well chosen by the programmer, the new layout constitutes a better representation ofthe system. On the other hand, if the new name is a bad choice, the new layout is flawed. However,what constitutes bad naming is not merely a matter of taste. Approaches that combine vocabularywith structural information can indeed assess the quality of naming. Please refer to Høst’s recentwork on debugging method names for further reading [20].Not considered in the present work is the relative weight of different lexical tokens. For example,
it seems reasonable to weight local identifiers differently than identifiers in top-level namespaces.Also, one may treat names coming from library functions different from the ones coming from theactual user code. Given the absence of evaluation benchmarks, we decided to use equal weightingfor all lexical token. Also, preliminary experiments with different weighting schemes indicate thatrelative weights below boost level, i.e., below a factor of 10, do often not significantly affect theoverall layout.
4. EXAMPLES
In this section we present examples of Software Cartography. The first example visualizes theevolution of a small software system. The second example shows an overview of six open-sourcesystems. As the third example, we provide two thematic overlays of the same software map.
4.1. The evolution of Ludo
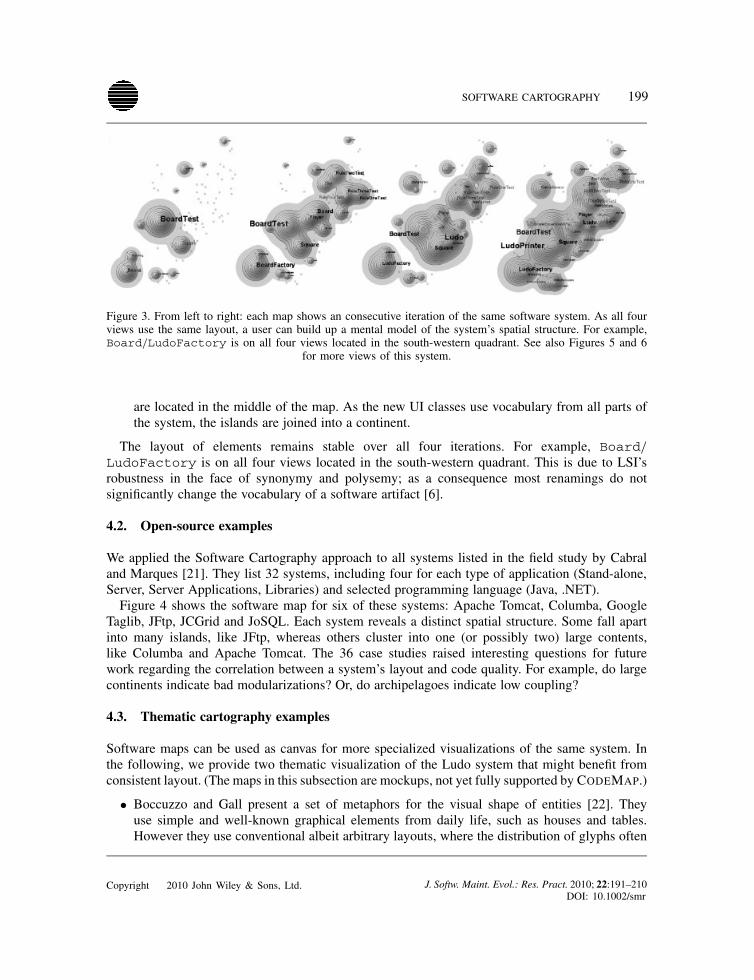
Figure 3 shows the complete history of the Ludo system, consisting of four iterations. Ludo is usedin a first year programming course to teach iterative development (please mail the first author toget the sources). The fourth iteration is the largest with 30 classes and a total size of 3–4 KLOC.We selected Ludo because in each iteration, a crucial part of the final system is added.
• The first map (Figure 3, leftmost) shows the initial prototype. This iteration implements theboard as a linked list of squares. Most classes are located in the south-western quadrant. Theremaining space is occupied by ocean, nothing else has been implemented so far.
• In the second iteration (Figure 3, second to the left) the board class is extended with a factoryclass. In order to support players and stones, a few new classes and tests for future gamerules are added. On the new map the test classes are positioned in the north-eastern quadrant,opposite to the other classes. This indicates that the newly added test classes implement a novelfeature (i.e., testing of the game’s ‘business rules’) and are thus not related to the factory’sdomain of board initialization.
• During the third iteration (Figure 3, second to the right) the actual game rules are imple-mented. Most rules are implemented in the Square and Ludo class, thus their mountainrises. In the south-west, we can notice that, although the BoardFactory has been renamedto LudoFactory, its position on the map has not changed considerably.
• The fourth map (Figure 3, rightmost) shows the last iteration. A user interface and a printerclass have been added. As both of them depend on most previous parts of the application, they
Copyright 2010 John Wiley & Sons, Ltd. J. Softw. Maint. Evol.: Res. Pract. 2010; 22:191–210DOI: 10.1002/smr
SOFTWARE CARTOGRAPHY 199
Figure 3. From left to right: each map shows an consecutive iteration of the same software system. As all fourviews use the same layout, a user can build up a mental model of the system’s spatial structure. For example,Board/LudoFactory is on all four views located in the south-western quadrant. See also Figures 5 and 6
for more views of this system.
are located in the middle of the map. As the new UI classes use vocabulary from all parts ofthe system, the islands are joined into a continent.
The layout of elements remains stable over all four iterations. For example, Board/LudoFactory is on all four views located in the south-western quadrant. This is due to LSI’srobustness in the face of synonymy and polysemy; as a consequence most renamings do notsignificantly change the vocabulary of a software artifact [6].
4.2. Open-source examples
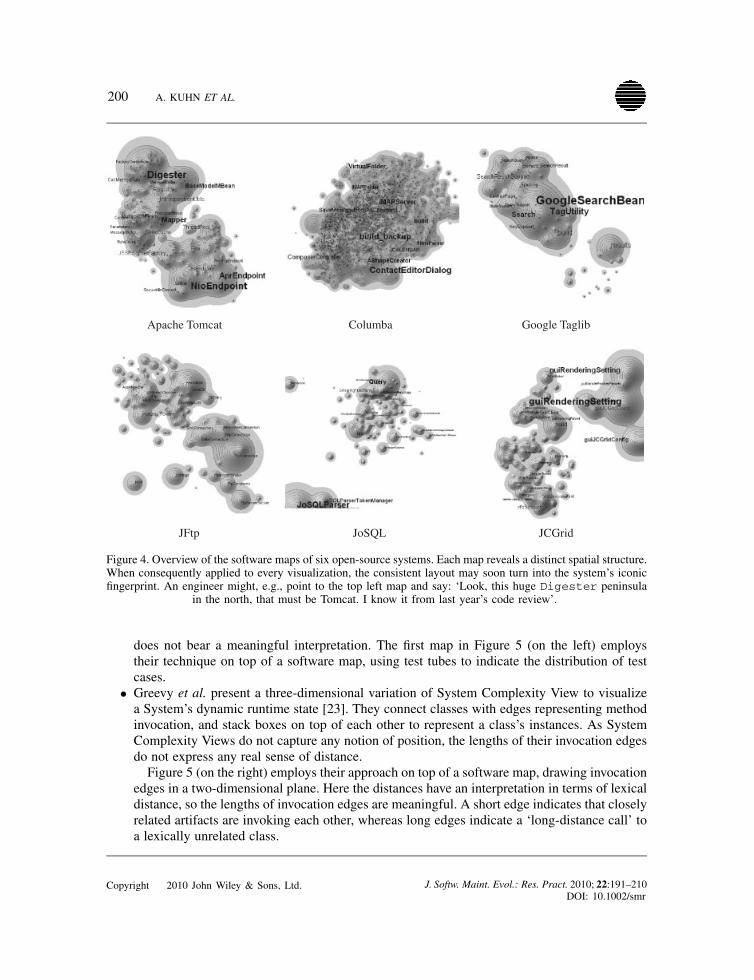
We applied the Software Cartography approach to all systems listed in the field study by Cabraland Marques [21]. They list 32 systems, including four for each type of application (Stand-alone,Server, Server Applications, Libraries) and selected programming language (Java, .NET).Figure 4 shows the software map for six of these systems: Apache Tomcat, Columba, Google
Taglib, JFtp, JCGrid and JoSQL. Each system reveals a distinct spatial structure. Some fall apartinto many islands, like JFtp, whereas others cluster into one (or possibly two) large contents,like Columba and Apache Tomcat. The 36 case studies raised interesting questions for futurework regarding the correlation between a system’s layout and code quality. For example, do largecontinents indicate bad modularizations? Or, do archipelagoes indicate low coupling?
4.3. Thematic cartography examples
Software maps can be used as canvas for more specialized visualizations of the same system. Inthe following, we provide two thematic visualization of the Ludo system that might benefit fromconsistent layout. (The maps in this subsection are mockups, not yet fully supported by CODEMAP.)
• Boccuzzo and Gall present a set of metaphors for the visual shape of entities [22]. Theyuse simple and well-known graphical elements from daily life, such as houses and tables.However they use conventional albeit arbitrary layouts, where the distribution of glyphs often
Copyright 2010 John Wiley & Sons, Ltd. J. Softw. Maint. Evol.: Res. Pract. 2010; 22:191–210DOI: 10.1002/smr
200 A. KUHN ET AL.
Apache Tomcat Columba Google Taglib
JFtp JoSQL JCGrid
Figure 4. Overview of the software maps of six open-source systems. Each map reveals a distinct spatial structure.When consequently applied to every visualization, the consistent layout may soon turn into the system’s iconicfingerprint. An engineer might, e.g., point to the top left map and say: ‘Look, this huge Digester peninsula
in the north, that must be Tomcat. I know it from last year’s code review’.
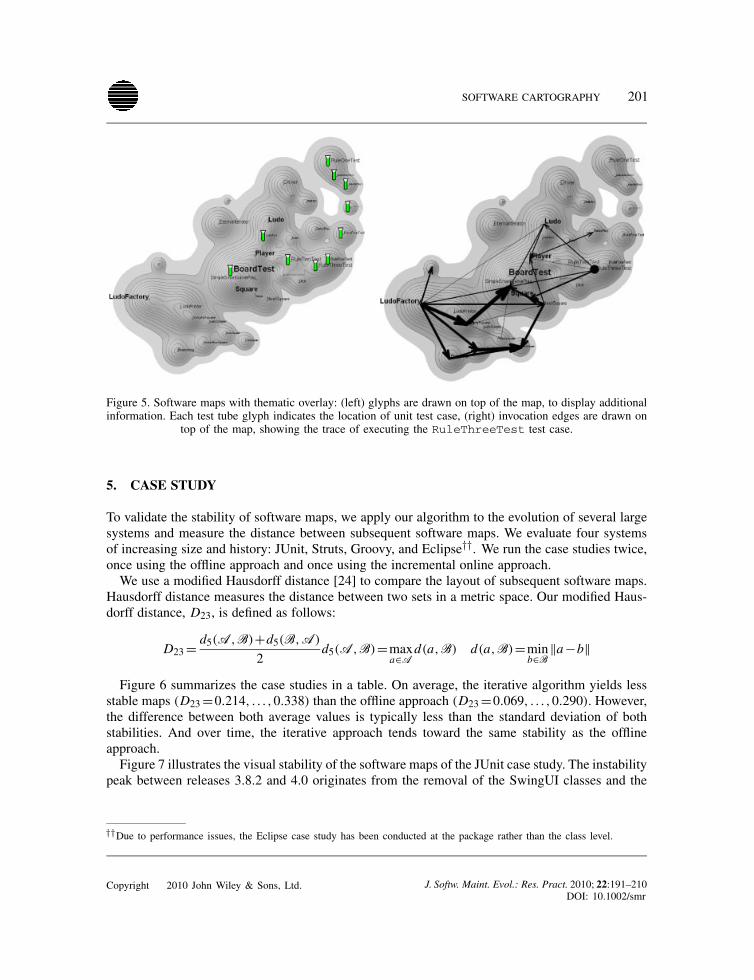
does not bear a meaningful interpretation. The first map in Figure 5 (on the left) employstheir technique on top of a software map, using test tubes to indicate the distribution of testcases.
• Greevy et al. present a three-dimensional variation of System Complexity View to visualizea System’s dynamic runtime state [23]. They connect classes with edges representing methodinvocation, and stack boxes on top of each other to represent a class’s instances. As SystemComplexity Views do not capture any notion of position, the lengths of their invocation edgesdo not express any real sense of distance.
Figure 5 (on the right) employs their approach on top of a software map, drawing invocationedges in a two-dimensional plane. Here the distances have an interpretation in terms of lexicaldistance, so the lengths of invocation edges are meaningful. A short edge indicates that closelyrelated artifacts are invoking each other, whereas long edges indicate a ‘long-distance call’ toa lexically unrelated class.
Copyright 2010 John Wiley & Sons, Ltd. J. Softw. Maint. Evol.: Res. Pract. 2010; 22:191–210DOI: 10.1002/smr
SOFTWARE CARTOGRAPHY 201
Figure 5. Software maps with thematic overlay: (left) glyphs are drawn on top of the map, to display additionalinformation. Each test tube glyph indicates the location of unit test case, (right) invocation edges are drawn on
top of the map, showing the trace of executing the RuleThreeTest test case.
5. CASE STUDY
To validate the stability of software maps, we apply our algorithm to the evolution of several largesystems and measure the distance between subsequent software maps. We evaluate four systemsof increasing size and history: JUnit, Struts, Groovy, and Eclipse††. We run the case studies twice,once using the offline approach and once using the incremental online approach.We use a modified Hausdorff distance [24] to compare the layout of subsequent software maps.
Hausdorff distance measures the distance between two sets in a metric space. Our modified Haus-dorff distance, D23, is defined as follows:
D23= d5(A,B)+d5(B,A)
2d5(A,B)=max
a∈Ad(a,B) d(a,B)=min
b∈B‖a−b‖
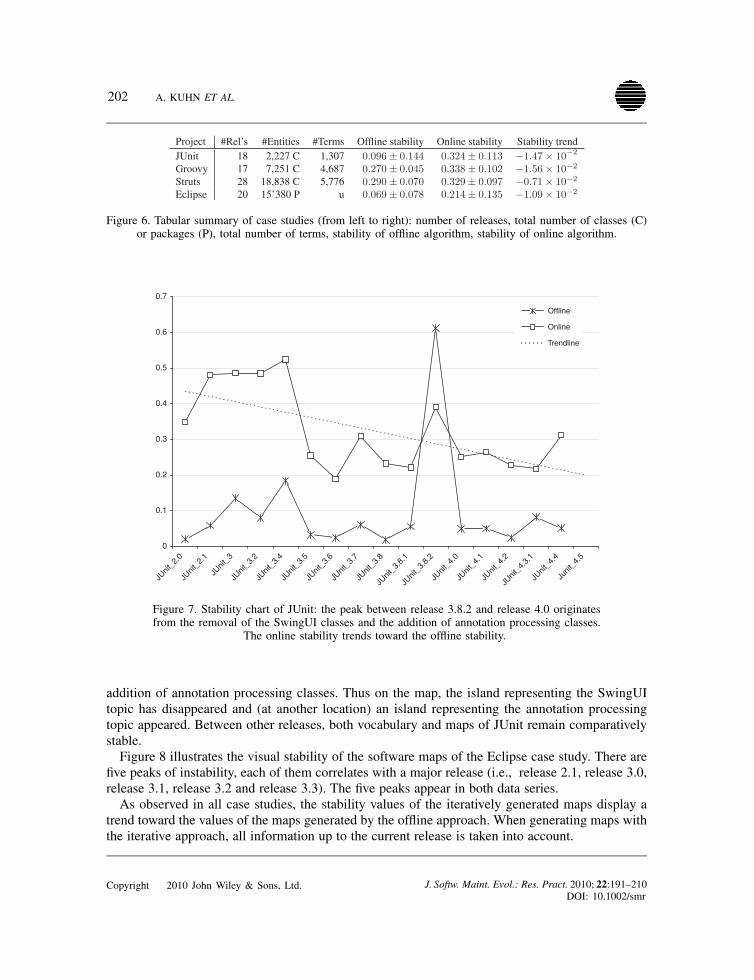
Figure 6 summarizes the case studies in a table. On average, the iterative algorithm yields lessstable maps (D23=0.214, . . . ,0.338) than the offline approach (D23=0.069, . . . ,0.290). However,the difference between both average values is typically less than the standard deviation of bothstabilities. And over time, the iterative approach tends toward the same stability as the offlineapproach.Figure 7 illustrates the visual stability of the software maps of the JUnit case study. The instability
peak between releases 3.8.2 and 4.0 originates from the removal of the SwingUI classes and the
††Due to performance issues, the Eclipse case study has been conducted at the package rather than the class level.
Copyright 2010 John Wiley & Sons, Ltd. J. Softw. Maint. Evol.: Res. Pract. 2010; 22:191–210DOI: 10.1002/smr
202 A. KUHN ET AL.
Figure 6. Tabular summary of case studies (from left to right): number of releases, total number of classes (C)or packages (P), total number of terms, stability of offline algorithm, stability of online algorithm.
0
0.1
0.2
0.3
0.4
0.5
0.6
0.7
JUnit
_2.0
JUnit
_2.1
JUnit
_3
JUnit
_3.2
JUnit
_3.4
JUnit
_3.5
JUnit
_3.6
JUnit
_3.7
JUnit
_3.8
JUnit
_3.8.
1
JUnit
_3.8.
2
JUnit
_4.0
JUnit
_4.1
JUnit
_4.2
JUnit
_4.3.
1
JUnit
_4.4
Junit
_4.5
Offline
Online
Trendline
Figure 7. Stability chart of JUnit: the peak between release 3.8.2 and release 4.0 originatesfrom the removal of the SwingUI classes and the addition of annotation processing classes.
The online stability trends toward the offline stability.
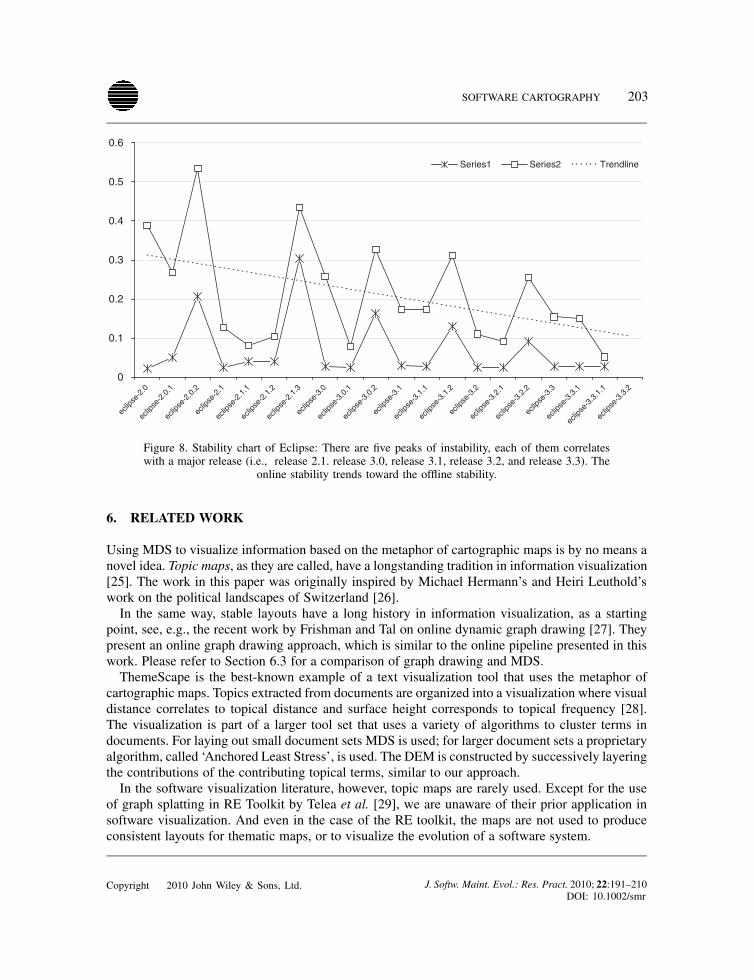
addition of annotation processing classes. Thus on the map, the island representing the SwingUItopic has disappeared and (at another location) an island representing the annotation processingtopic appeared. Between other releases, both vocabulary and maps of JUnit remain comparativelystable.Figure 8 illustrates the visual stability of the software maps of the Eclipse case study. There are
five peaks of instability, each of them correlates with a major release (i.e., release 2.1, release 3.0,release 3.1, release 3.2 and release 3.3). The five peaks appear in both data series.As observed in all case studies, the stability values of the iteratively generated maps display a
trend toward the values of the maps generated by the offline approach. When generating maps withthe iterative approach, all information up to the current release is taken into account.
Copyright 2010 John Wiley & Sons, Ltd. J. Softw. Maint. Evol.: Res. Pract. 2010; 22:191–210DOI: 10.1002/smr
SOFTWARE CARTOGRAPHY 203
0
0.1
0.2
0.3
0.4
0.5
0.6
eclip
se-2
.0
eclip
se-2
.0.1
eclip
se-2
.0.2
eclip
se-2
.1
eclip
se-2
.1.1
eclip
se-2
.1.2
eclip
se-2
.1.3
eclip
se-3
.0
eclip
se-3
.0.1
eclip
se-3
.0.2
eclip
se-3
.1
eclip
se-3
.1.1
eclip
se-3
.1.2
eclip
se-3
.2
eclip
se-3
.2.1
eclip
se-3
.2.2
eclip
se-3
.3
eclip
se-3
.3.1
eclip
se-3
.3.1.1
eclip
se-3
.3.2
Series1 Series2 Trendline
Figure 8. Stability chart of Eclipse: There are five peaks of instability, each of them correlateswith a major release (i.e., release 2.1. release 3.0, release 3.1, release 3.2, and release 3.3). The
online stability trends toward the offline stability.
6. RELATED WORK
Using MDS to visualize information based on the metaphor of cartographic maps is by no means anovel idea. Topic maps, as they are called, have a longstanding tradition in information visualization[25]. The work in this paper was originally inspired by Michael Hermann’s and Heiri Leuthold’swork on the political landscapes of Switzerland [26].In the same way, stable layouts have a long history in information visualization, as a starting
point, see, e.g., the recent work by Frishman and Tal on online dynamic graph drawing [27]. Theypresent an online graph drawing approach, which is similar to the online pipeline presented in thiswork. Please refer to Section 6.3 for a comparison of graph drawing and MDS.ThemeScape is the best-known example of a text visualization tool that uses the metaphor of
cartographic maps. Topics extracted from documents are organized into a visualization where visualdistance correlates to topical distance and surface height corresponds to topical frequency [28].The visualization is part of a larger tool set that uses a variety of algorithms to cluster terms indocuments. For laying out small document sets MDS is used; for larger document sets a proprietaryalgorithm, called ‘Anchored Least Stress’, is used. The DEM is constructed by successively layeringthe contributions of the contributing topical terms, similar to our approach.In the software visualization literature, however, topic maps are rarely used. Except for the use
of graph splatting in RE Toolkit by Telea et al. [29], we are unaware of their prior application insoftware visualization. And even in the case of the RE toolkit, the maps are not used to produceconsistent layouts for thematic maps, or to visualize the evolution of a software system.
Copyright 2010 John Wiley & Sons, Ltd. J. Softw. Maint. Evol.: Res. Pract. 2010; 22:191–210DOI: 10.1002/smr
204 A. KUHN ET AL.
6.1. Desiderata for spatial representation of software
Robert DeLine’s work on software navigation [15,30] closely relates to Software Cartography. Hiswork is based on the observation that developers are consistently lost in code [31] and that usingtextual landmarks only places a large burden on cognitive memory. He concludes the need for newvisualization techniques that allow developers to use their spatial memory while navigating sourcecode.DeLine proposes four desiderata [15] that should be satisfied by spatial software navigation: (1)
the display should show the entire program and be continuous, (2) the display should contain visuallandmarks such that developers can find parts of the program perceptually rather than relying onnames, (3) the display should remain visually stable during navigation (and evolution) and (4) thedisplay should be capable of showing global program information overlays other than navigation.An ad hoc algorithm that satisfies the first and fourth properties is presented in the same work.
As distance metric between software entities (here, methods) an arbitrary chosen score is used.Our work satisfies all above desiderata, and completes them with a fifth desideratum that visual
distance should have a meaningful interpretation. The scope of Software Cartography is broaderthan just navigation, it is also intended for reverse engineering and code comprehension in general.We can thus generalize the five desiderata for spatial representation of software as follows:
1. The visualization should show the entire program and be continuous.2. The visualization should contain visualization landmarks that allow the developers to find
parts of the system perceptually, rather than relying on name or other cognitive causes.3. The visualization should remain visually stable as the system evolves.4. The visualization should be capable of showing global information overlays.5. On the visualization, distance should have a meaningful interpretation.
6.2. Other layout approaches used in software visualization
Most software visualization layouts are based on one or multiple of the following approaches: UMLdiagrams, force-based graph drawing, tree-map layouts and polymetric views.UML diagrams generally employ no particular layout and do not continuously use the visualiza-
tion pane. The UML standard itself does not cover the layout of diagrams. Typically a UML toolwill apply an unstable graph drawing layout (e.g., based on visual optimization such as reducingthe number of edge crossings) when asked to automatically layout a diagram. However, this doesnot imply that the layout of UML diagrams is meaningless. UML diagrams are carefully created byarchitects, at least those made during the design process, so their layout do have a lot of meaning.If you change such a diagram and reshow it to its owner, the owner will almost suddenly complain,as he invested time in drawing the diagram a certain way. Alas! this layout process requires manualeffort.Gudenberg et al. have proposed an evolutionary approach to layout UML diagrams in which
a fitness function is used to optimize various metrics (such as number of edge crossings) [32].Although the resulting layout does not reflect a distance metric, in principle the technique could beadapted to do so. Andriyevksa et al. have conducted user studies to assess the effect that differentUML layout schemes have on software comprehension [33]. They report that the layout scheme
Copyright 2010 John Wiley & Sons, Ltd. J. Softw. Maint. Evol.: Res. Pract. 2010; 22:191–210DOI: 10.1002/smr
SOFTWARE CARTOGRAPHY 205
that groups architecturally related classes together yields best results. They conclude that it ismore important that a layout scheme convey a meaningful grouping of entities, rather than beingaesthetically appealing. Byelas and Telea highlight related elements in a UML diagram using acustom ‘area of interest’ algorithm that connects all related elements with a blob of the same color,taking special care to minimize the number of crossings [34]. The impact of layout on their approachis not discussed.Graph drawing refers to a number of techniques to layout two- and three-dimensional graphs
for the purpose of information visualization [25,35]. Noack et al. offer a good starting point forapplying graph drawing to software visualization [36]. Jucknath–John et al. present a technique toachieve stable graph layouts over the evolution of the displayed software system [37], thus achievingconsistent layout, while sidestepping the issue of reflecting meaningful position or distance metrics.Unlike MDS, graph drawing does not map an n-dimensional space to two dimensions, rather it
is concerned with the placement of vertices and edges such that visual properties of the output areoptimized. For example, algorithms minimize the number of edge crossings or try to avoid thatnodes overlap each other. Even though, the standard force-based layouts can consider edge weights(which can be seen as a distance metric), edges with the same weight may have different length onthe visualization pane depending on the connectedness of the graph at that position. Furthermore,the resulting placement is not continuous. The void between vertices is not continuous spectrum ofmetric locations, as is the case with an MDS layout.Graph splatting is a variation of graph drawing, which produced visualizations that are very
similar to thematic maps [38]. Graph splatting represents the layout of graph drawing algorithms asa continuous scalar field. Graph splatting combines the layout of graph drawing with the renderingof thematic maps. Each vertex contributes to the field with a Gaussian-shaped basis function. Theelevation of the field, thus, represents the density of the graph layout at that position. Telea et al.apply Graph splatting in their RE toolkit to visualize software systems [29]. However, they are notconcerned with stable layouts. Each run of their tool may yield a different layout.Treemaps represent tree-structured information using nested rectangles [25]. Though treemaps
make continuous use of the visualization pane, the interpretation of position and distance is imple-mentation dependent. Classical treemap implementations are known to produce very narrow andthus distorted rectangles. Balzer et al. proposed a modification of the classical treemap layout usingVoronoi tessellation [39]. Their approach creates aesthetically more appealing treemaps, reducingthe number of narrow tessels. There are some treemap variations (e.g., the strip layout or thesquarified layout) that can, and do, order the nodes depending on a metric. However, nodes aretypically ordered on a local level only, not taking into account the global colocation of borderingleaf nodes contained in nodes that touch at a higher level. Many treemaps found in software visual-ization literature are even applied with arbitrary order of nodes, such as alphanumeric order of classnames.Polymetric views visualize software systems by mapping different software metrics on the visual
properties of box-and-arrow diagrams [40,41]. Many polymetric views are ordered by the valueof a given software metric, so that relevant items appear first (whatever first means, given thelayout). Such an order is more meaningful than alphabetic (or worse, hash-key ordering), but onthe other hand only as stable as the used metric. The System Complexity view is by far the mostpopular polymetric view, and is often used as a base layout where our requirements for stabilityand consistence apply (see, e.g., [42]). The layout of System Complexity uses graph drawing on
Copyright 2010 John Wiley & Sons, Ltd. J. Softw. Maint. Evol.: Res. Pract. 2010; 22:191–210DOI: 10.1002/smr
206 A. KUHN ET AL.
inheritance relations, and orders the top-level classes as well as each layer of subclasses by classnames. Such a layout does not meet our desiderate for a stable and consistent layout.
6.3. More cartography metaphors in software visualization
A number of tools have adopted metaphors from cartography in recent years to visualize soft-ware. Usually these approaches are integrated in a tool with in an interactive, explorative interfaceand often feature three-dimensional visualizations. None of these approaches satisfies DeLine’sdesiderata.MetricView is an exploratory environment featuring UML diagram visualizations [43]. The third
dimension is used to extend UML with polymetric views [40]. The diagrams use arbitrary layout,so do not reflect meaningful distance or position.White Coats is an explorative environment also based on the notion of polymetric views [44]. The
visualizations are three-dimensional with position and visual distance of entities given by selectedmetrics. However they do not incorporate the notion of a consistent layout.CGA Call Graph Analyser is an explorative environment that visualizes a combination of function
call graph and nestedmodules structure [45]. The tool employs a two and half-dimensional approach.To our best knowledge, their visualizations use an arbitrary layout.CodeCity is an explorative environment building on the city metaphor [46]. CodeCity employs
the nesting level of packages for their city’s elevation model, and uses a modified tree layout toposition the entities, i.e., packages and classes. Within a package, elements are ordered by sizeof the element’s visual representation. Hence, when changing the metrics mapped on width andheight, the overall layout of the city changes, and thus, the consistent layout breaks.VERSO is an explorative environment that is also based on the city metaphor [47]. Similar to
CodeCity, VERSO employs a treemap layout to position their elements. Within a package, elementsare either ordered by their color or by first appearance in the system’s history. As the leaf elementshave all the same base size, changing this setting does not change the overall layout. Hence, theyprovide consistent layout, however within the spatial limitations of the classical treemap layout.
7. CONCLUSION
This paper presents Software Cartography, a spatial representation of software. Our approach visu-alizes software entities using a consistent layout. Software maps present the entire program andare continuous. Software maps contain visual landmarks that allow developers to find parts of thesystem perceptually rather than relying on conceptual clues, e.g., names. As all software maps ofa system use the same layout, maps with thematic overlays can be compared with each other.The layout of software maps is based on the lexical similarity of software entities. Our algorithm
uses LSI to position software entities in a multidimensional space, and MDS to map these positionson a two-dimensional display. Software maps can be generated to depict evolution of a softwaresystem over time. We evaluated the visual stability of iteratively generated maps considering fouropen-source case studies.In spite of the aesthetic appeal of hill shading and contour lines, the main contribution of this
paper is not the cartographic look of software maps. The main contribution of Software Cartography
Copyright 2010 John Wiley & Sons, Ltd. J. Softw. Maint. Evol.: Res. Pract. 2010; 22:191–210DOI: 10.1002/smr
SOFTWARE CARTOGRAPHY 207
is (i) that cartographic position reflects topical distance of software entities and (ii) that consistentlayout allows different software maps to be easily compared. In this way, software maps reflectworld maps in an atlas that exploit the same consistent layout to depict various kinds of thematicinformation about geographical sites.We have presented several examples to illustrate the usefulness of software maps to depict the
evolution of software systems, and to serve as a background for thematic visualizations. The exam-ples have been produced using CODEMAP, a proof-of-concept tool that implements our technique.As future work, we can identify the following promising directions:
• Software maps at present are largely static. We envision a more interactive environment inwhich the user can ‘zoom and pan’ through the landscape to see features in closer detail, ornavigate to other views of the software.
• Selectively displaying features would make the environment more attractive for navigation.Instead of generating all the labels and thematic widgets up-front, users can annotate the map,adding comments and waymarks as they perform their tasks.
• Orientation and layout are presently consistent for a single project only. We would like toinvestigate the usefulness of conventions for establishing consistent layout and orientation (i.e.,‘testing’ is North-East) that will work across multiple projects, possibly within a reasonablywell-defined domain.
• We plan to perform an empirical user study to evaluate the application of Software Cartographyfor software comprehension and reverse engineering, but also for source code navigation indevelopment environments.
ACKNOWLEDGEMENTS
We are very grateful to the anonymous reviewer whose comments considerably contributed to this paper. Wethank both the research group of Michele Lanza and the research group of Harald Gall, who provided greatfeedback during our visits; in particular Emanuel Giger for his awesome suggestions regarding multiuser maps.We thank Elias Hodel for his help with the hill-shading and contour line algorithms. We thank Rajesh Vasa forhis kind assistance in identifying suitable case studies. The first author would also like to thank David and Peterfor their work on CODEMAP and the many night-shifts before presentations and demo camps.
REFERENCES
1. Diehl S. Software Visualization. Springer: Berlin, Heidelberg, 2007.2. Kienle HM, Muller HA. Requirements of software visualization tools: A literature survey. VISSOFT 2007. Fourth IEEE
International Workshop on Visualizing Software for Understanding and Analysis, 2007; 2–9.3. Reiss SP. The paradox of software visualization. VISSOFT’05: Proceedings of the 3rd IEEE International Workshop on
Visualizing Software for Understanding and Analysis. IEEE Computer Society: Washington DC, U.S.A., 2005; 19.4. Storey M-AD, Cubranic D, German DM. On the use of visualization to support awareness of human activities in
software development: A survey and a framework. SoftVis’05: Proceedings of the 2005 ACM Symposium on SoftwareVisualization. ACM Press: New York, 2005; 193–202.
5. Hite K, Neumeier C, Schiffer MS. GURPS Alternate Earths, vol. 2. Steve Jackson Games: Austin, TX, 1999.6. Kuhn A, Ducasse S, Gırba T. Semantic clustering: Identifying topics in source code. Information and Software Technology
2007; 49(3):230–243.7. Ducasse S, Gırba T, Kuhn A. Distribution map. Proceedings of 22nd IEEE International Conference on Software
Maintenance (ICSM ’06). IEEE Computer Society: Los Alamitos CA, 2006; 203–212.
Copyright 2010 John Wiley & Sons, Ltd. J. Softw. Maint. Evol.: Res. Pract. 2010; 22:191–210DOI: 10.1002/smr
208 A. KUHN ET AL.
8. Deerwester SC, Dumais ST, Landauer TK, Furnas GW, Harshman RA. Indexing by latent semantic analysis. Journal ofthe American Society of Information Science 1990; 41(6):391–407.
9. Borg I, Groenen PJF. Modern Multidimensional Scaling: Theory and Applications. Springer: Berlin, 2005.10. Marcus A, Maletic JI. Identification of high-level concept clones in source code. ASE’01: Proceedings of the 16th
International Conference on Automated Software Engineering. IEEE Computer Society: Washington DC, U.S.A.,November 2001; 107–114.
11. Baldi PF, Lopes CV, Linstead EJ, Bajracharya SK. A theory of aspects as latent topics. OOPSLA ’08: Proceedingsof the 23rd ACM SIGPLAN Conference on Object-oriented Programming Systems Languages and Applications. ACM:New York NY, U.S.A., 2008; 543–562.
12. Antoniol G, Gueheneuc Y-G, Merlo E, Tonella P. Mining the lexicon used by programmers during software evolution.ICSM 2007: IEEE International Conference on Software Maintenance, October 2007; 14–23.
13. Vasa R, Schneider J-G, Nierstrasz O. The inevitable stability of software change. Proceedings of the 23rd IEEEInternational Conference on Software Maintenance (ICSM ’07). IEEE Computer Society: Los Alamitos CA, 2007; 4–13.
14. Kuhn A, Loretan P, Nierstrasz O. Consistent layout for thematic software maps. Proceedings of 15th Working Conferenceon Reverse Engineering (WCRE’08). IEEE Computer Society Press: Los Alamitos CA, 2008; 209–218.
15. DeLine R. Staying oriented with software terrain maps. DMS, Guercio A, Arndt T (eds.). Knowledge Systems Institute,2005; 309–314.
16. Zhang H. Exploring regularity in source code: Software science and Zipf’s law. WCRE’08: Proceedings of the 200815th Working Conference on Reverse Engineering. IEEE Computer Society: Washington DC, U.S.A., 2008; 101–110.
17. Strickert M, Teichmann S, Sreenivasulu N, Seiffert U. High-throughput multi-dimensional scaling (HiT-MDS) for cDNA-Array expression data. ICANN (Lecture Notes in Computer Science, vol. 3696), Duch W, Kacprzyk J, Oja E, ZadroznyS (eds.). Springer: Berlin, 2005; 625–633.
18. Burrough PA, McDonell RA. Principles of Geographical Information Systems. Oxford University Press: New York,1998.
19. Slocum TA, McMaster RB, Kessler FC, Howard HH. Thematic Carthography and Geographic Visualization. PearsonPrentice-Hall: Upper Saddle River NJ, 2005.
20. Hoest EW, OEstvold BM. Debugging method names. Proceedings of the 23rd European Conference on Object-orientedProgramming (ECOOP’09) (Lecture Notes in Computer Science). Springer: Berlin, 2009.
21. Cabral B, Marques P. Exception handling: A field study in Java and .NET. Proceedings of the European Conferenceon Object-oriented Programming (ECOOP’07) (Lecture Notes in Computer Science, vol. 4609). Springer: Berlin, 2007;151–175.
22. Boccuzzo S, Gall HC. CocoViz with ambient audio software exploration. ISCE’09: Proceedings of the 2009 IEEE 31stInternational Conference on Software Engineering. IEEE Computer Society: Washington DC, U.S.A., 2009; 571–574.
23. Greevy O, Lanza M, Wysseier C. Visualizing feature interaction in 3-D. VISSOFT’05: Proceedings of the 3rd IEEEInternational Workshop on Visualizing Software for Understanding and Analysis. IEEE Computer Society: WashingtonDC, U.S.A., 2005; 30.
24. Dubuisson M-P, Jain AK. A modified hausdorff distance for object matching. Proceedings of the 12th IAPR InternationalConference on Pattern Recognition, 1994. Volume 1—Conference A: Computer Vision & Image Processing, Jerusalem,Israel, vol. 1, 9–13 October 1994; 566–568.
25. Ware C. Information Visualisation. Elsevier: San Fransico, 2004.26. Hermann M, Leuthold H. Atlas der politischen Landschaften. vdf Hochschlverlag AG, ETH Zurich, 2003.27. Frishman Y, Tal A. Online dynamic graph drawing. IEEE Transactions on Visualization and Computer Graphics 2008;
14(4):727–740.28. Wise JA, Thomas JJ, Pennock K, Lantrip D, Pottier M, Schur A, Crow V. Visualizing the non-visual: Spatial analysis and
interaction with information for text documents. Readings in Information Visualization: Using Vision to Think. MorganKaufmann Publishers Inc.: San Francisco CA, U.S.A., 1999; 442–450.
29. Telea A, Maccari A, Riva C. An open toolkit for prototyping reverse engineering visualizations. VISSYM ’02: Proceedingsof the Symposium on Data Visualisation 2002, Eurographics Association, Aire-la-Ville, Switzerland, Switzerland, 2002;241ff.
30. DeLine R, Czerwinski M, Meyers B, Venolia G, Drucker SM, Robertson GG. Code thumbnails: Using spatial memoryto navigate source code. VL/HCC. IEEE Computer Society: Silver Spring MD, 2006; 11–18.
31. DeLine R, Khella A, Czerwinski M, Robertson GG. Towards understanding programs through wear-based filtering.SOFTVIS, Naps TL, De Pauw W (eds.). ACM: New York, 2005; 183–192.
32. Gudenberg JWV, Niederle A, Ebner M, Eichelberger H. Evolutionary layout of uml class diagrams. SoftVis ’06:Proceedings of the 2006 ACM Symposium on Software Visualization. ACM: New York NY, U.S.A., 2006; 163–164.
33. Andriyevska O, Dragan N, Simoes B, Maletic JI. Evaluating UML class diagram layout based on architectural importance.VISSOFT’05: Proceedings of the 3rd IEEE International Workshop on Visualizing Software for Understanding andAnalysis. IEEE Computer Society: Washington DC, U.S.A., 2005; 9.
34. Byelas H, Telea AC. Visualization of areas of interest in software architecture diagrams. SoftVis ’06: Proceedings of the2006 ACM Symposium on Software Visualization. ACM: New York NY, U.S.A., 2006; 105–114.
Copyright 2010 John Wiley & Sons, Ltd. J. Softw. Maint. Evol.: Res. Pract. 2010; 22:191–210DOI: 10.1002/smr
SOFTWARE CARTOGRAPHY 209
35. Kaufmann M, Wagner D. Drawing Graphs. Springer: Berlin, Heidelberg, 2001.36. Noack A, Lewerentz C. A space of layout styles for hierarchical graph models of software systems. SoftVis ’05:
Proceedings of the 2005 ACM Symposium on Software Visualization. ACM: New York NY, U.S.A., 2005; 155–164.37. Jucknath-John S, Graf D. Icon graphs: Visualizing the evolution of large class models. SoftVis ’06: Proceedings of the
2006 ACM Symposium on Software Visualization. ACM: New York NY, U.S.A., 2006; 167–168.38. van Liere R, de Leeuw W. Graphsplatting: Visualizing graphs as continuous fields. IEEE Transactions on Visualization
and Computer Graphics 2003; 9(2):206–212.39. Balzer M, Deussen O, Lewerentz C. Voronoi treemaps for the visualization of software metrics. SoftVis ’05: Proceedings
of the 2005 ACM Symposium on Software Visualization. ACM: New York NY, U.S.A., 2005; 165–172.40. Lanza M, Ducasse S. Polymetric views—a lightweight visual approach to reverse engineering. Transactions on Software
Engineering (TSE) 2003; 29(9):782–795.41. Lanza M, Marinescu R. Object-oriented Metrics in Practice. Springer: Berlin, 2006.42. Greevy O, Lanza M, Wysseier C. Visualizing live software systems in 3D. SoftVis’06: Proceedings of the 2006 ACM
Symposium on Software Visualization, Brighton, U.K. ACM: New York NY, U.S.A., 2006; 47–56.43. Termeer M, Lange CFJ, Telea A, Chaudron MRV. Visual exploration of combined architectural and metric information.
VISSOFT’05: Proceedings of the 3rd IEEE International Workshop on Visualizing Software for Understanding andAnalysis. IEEE Computer Society: Washington DC, U.S.A., 2005; 11.
44. Mesnage C, Lanza M. White Coats: Web-visualization of evolving software in 3D. VISSOFT’05: Proceedings of the3rd IEEE International Workshop on Visualizing Software for Understanding and Analysis. IEEE Computer Society:Washington DC, U.S.A., 2005; 15.
45. Bohnet J, Dollner J. Analyzing dynamic call graphs enhanced with program state information for feature location andunderstanding. ISCE Companion’08: Companion of the 30th International Conference on Software Engineering, Leipzig,Germany. ACM: New York, NY, U.S.A., 2008; 915–916.
46. Wettel R, Lanza M. CodeCity: 3D Visualization of large-scale software. ISCE Companion’08: Companion of the 30thInternational Conference on Software Engineering, Leipzig, Germany. ACM: New York NY, U.S.A., 2008; 921–922.
47. Langelier G, Sahraoui H, Poulin P. Visualization-based analysis of quality for large-scale software systems. ASE ’05:Proceedings of the 20th IEEE/ACM International Conference on Automated Software Engineering. ACM: New YorkNY, U.S.A., 2005; 214–223.
AUTHORS’ BIOGRAPHIES
Adrian Kuhn is a PhD student of Computer Science at the Institute of Computer Science(IAM) of the University of Bern.
David Erni is a Master’s student of Computer Science at the Institute of ComputerScience (IAM) of the University of Bern.
Copyright 2010 John Wiley & Sons, Ltd. J. Softw. Maint. Evol.: Res. Pract. 2010; 22:191–210DOI: 10.1002/smr
210 A. KUHN ET AL.
Peter Loretan is a Master’s student of Computer Science at the Institute of ComputerScience (IAM) of the University of Bern.
Oscar Nierstrasz is a Professor of Computer Science at the Institute of Computer Science(IAM) of the University of Bern, where he founded the Software Composition Group in1994. Prof. Nierstrasz is the author of over a hundred publications and coauthor of thebooks Object-Oriented Reengineering Patterns and Squeak by Example.
Copyright 2010 John Wiley & Sons, Ltd. J. Softw. Maint. Evol.: Res. Pract. 2010; 22:191–210DOI: 10.1002/smr