Embed Size (px)
Citation preview
Foundation Quarterly Report | Q2 2017
SMART COLUMBUS ELECTRIFICATION PROGRAM QUARTERLY
ACTIVITY REPORT
Created for Paul G. Allen Family Foundation (Foundation) April – June 2017
Contents EXECUTIVE SUMMARY 2
Section 1: QUARTER IN REVIEW 4
1.1 Progress/Successes 6
1.2 Select External Events / Speaking Engagements 17
1.3 Key Meetings / Visits 19
1.4 Contracts and Partner Agreement Status 20
Completed: 20
In Progress: 20
1.5 Important Updates / Milestones / Deliverables 20
1.6 Budget 26
1.7 Media Relations 27
1.8 Public Policy 28
Section 2: INDICATOR STATUS TABLES 30
2.1 Priority 1, De-carbonization and Grid Modernization 30
2.2 Priority 2 – Fleet Adoption 32
2.3 Priority 4 – Consumer Adoption 33
2.4 Priority 5 – Charging Infrastructure 38
Section 3: RISK REGISTER 39
Section 4: PERFORMANCE METRICS PLAN 42
Section 5: GREEN POWER MARKETING PLAN 85
EXECUTIVE SUMMARY
Introduction
Through the months of April, May and June, the Smart Columbus Program continues to
actively move toward the city’s electrification goals. We achieved several significant and
legally required milestones that will position our team to move into execution of the
electrification plan. On May 22, Columbus City Council approved legislation to enter into
agreement with the Paul G. Allen Family Foundation to initiate the first year of the program.
On June 5, Columbus City Council authorized legislation for the GPD Group proposal and a
sub recipient agreement with The Columbus Partnership.
Setting up for Sustained Success
The Smart Columbus Team has taken proactive steps and measures to ensure the success
of the program and ensure that are organized for sustained success.
The first step toward this objective was to bring the Smart Columbus Team together
under one roof to foster a cooperative environment to discuss and share ideas. The
team has relocated to the Columbus Idea Foundry, where The Columbus
Partnership, AEP and OSU have been working alongside the Program Management
Office, continues to be an innovative and collaborative workspace.
The Smart Columbus team welcomed Mandy Bishop as the Program Manager on July
10, 2017. Mandy has significant program management experience and is a results
driven professional who knows how to meet program goals while building consensus
with stakeholders. Mandy is a leader with a record of successfully delivering complex
projects, and has been involved with Smart Columbus in her current role as a Senior
Project Manager with the GPD Group. She also has experience working with USDOT
during her time as Deputy Director with the Ohio Department of Transportation.
Select representatives of the Smart Columbus Team, including members of the City
of Columbus, The Columbus Partnership and AEP attended the EV Roadmap 10
conference in Portland, Oregon. The team members learned a great deal in the
formal sessions and make strong connections for future information and best
practices sharing.
After winning the Smart City challenge and the Paul G. Allen (Vulcan) Foundation grant,
Smart Columbus undertook a rebranding effort paid for by The Columbus Partnership’s
Acceleration Fund to create a distinctive identity and improve the messaging for this
critical initiative. The new brand has been met with excitement by the community.
In an effort to raise public awareness for Smart Columbus and better communicate to
others the details of the program, we have developed and launched “Smart Columbus
Live”, a weekly series of two-hour educational experiences that are held at the
Columbus Idea Foundry.
With the new brand and improved messaging, collateral pieces have been
developed including an Electric Vehicle purchase guide that has been sent to all
members of the Columbus Partnership to continue to push the executive vehicle
purchase program. Five CEO’s have purchased electric vehicles, including
Columbus Partnership’s Chairman, Les Wexner the Chairman of L Brands, Inc.
In order to advance the electrification goals of the Smart City Grant, the Smart
Columbus Team hosted an Electric Vehicle Charging Station Expo. This event was
held to connect electric vehicle charging companies and industry leaders with
organizations, companies and governments who are interested in learning more
about electric vehicle infrastructure and relevant policies and procedures.
Smart Columbus Partner Agreements
Smart Columbus entered into agreement with Honda and INRIX in June 2017:
The Honda agreement includes a commitment from Honda to bring the Clarity PHEV model to the central Ohio market. In addition, Honda commits to providing used FitEVs for fleet and consumer leasing, participation in all program advisory working groups.
The INRIX agreement includes a commitment from INRIX to provide traffic data and the ParkMe smartphone app. The ParkMe app will provide to the user information on parking availability in downtown Columbus, including locations and availability of EV charging.
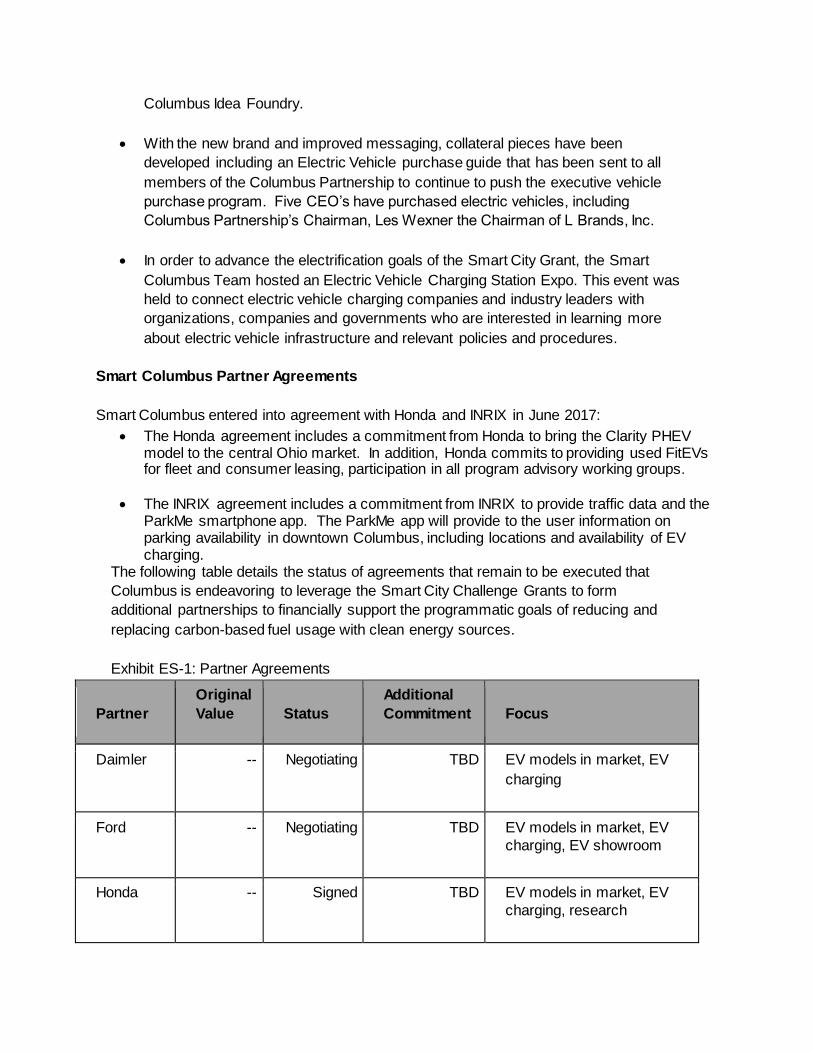
The following table details the status of agreements that remain to be executed that
Columbus is endeavoring to leverage the Smart City Challenge Grants to form
additional partnerships to financially support the programmatic goals of reducing and
replacing carbon-based fuel usage with clean energy sources.
Exhibit ES-1: Partner Agreements
Partner
Original
Value
Status
Additional
Commitment
Focus
Daimler -- Negotiating TBD EV models in market, EV
charging
Ford -- Negotiating TBD EV models in market, EV
charging, EV showroom
Honda -- Signed TBD EV models in market, EV
charging, research
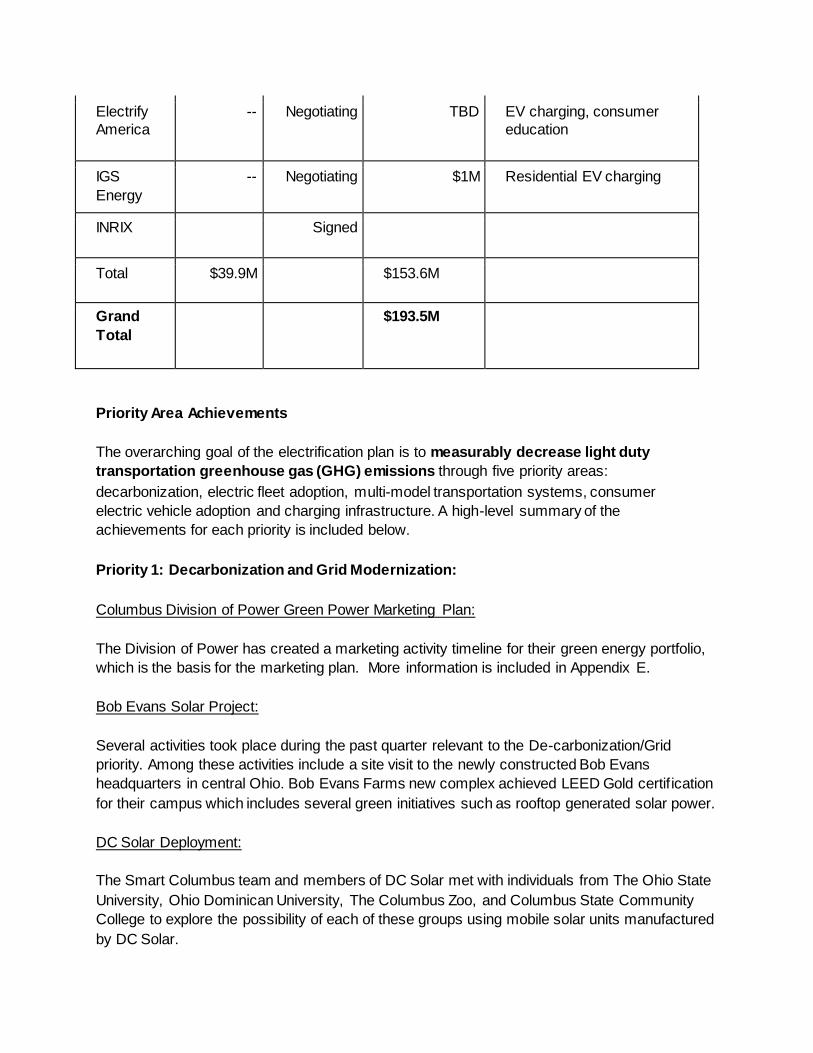
Electrify
America
-- Negotiating TBD EV charging, consumer
education
IGS
Energy
-- Negotiating $1M Residential EV charging
INRIX Signed
Total $39.9M $153.6M
Grand
Total
$193.5M
Priority Area Achievements
The overarching goal of the electrification plan is to measurably decrease light duty
transportation greenhouse gas (GHG) emissions through five priority areas:
decarbonization, electric fleet adoption, multi-model transportation systems, consumer
electric vehicle adoption and charging infrastructure. A high-level summary of the
achievements for each priority is included below.
Priority 1: Decarbonization and Grid Modernization:
Columbus Division of Power Green Power Marketing Plan:
The Division of Power has created a marketing activity timeline for their green energy portfolio,
which is the basis for the marketing plan. More information is included in Appendix E.
Bob Evans Solar Project:
Several activities took place during the past quarter relevant to the De-carbonization/Grid
priority. Among these activities include a site visit to the newly constructed Bob Evans
headquarters in central Ohio. Bob Evans Farms new complex achieved LEED Gold certification
for their campus which includes several green initiatives such as rooftop generated solar power.
DC Solar Deployment:
The Smart Columbus team and members of DC Solar met with individuals from The Ohio State
University, Ohio Dominican University, The Columbus Zoo, and Columbus State Community
College to explore the possibility of each of these groups using mobile solar units manufactured
by DC Solar.
Priority 2: Fleet Electric Vehicle Adoption:
Fleet EV Bid Status:
EV acquisition plans for the City of Columbus, The Ohio State University (OSU), Franklin
County, City of Dublin and AEP have been advanced. The City of Columbus solicited a bid
in May and received six quotes, which are currently being reviewed. Purchasing and Fleet are
currently meeting with one bidder to better understand lease vs. purchase and contract
language.
The City of Dublin recently programmed the purchase of 10 EVs into their 2018 through 2022
plan, with purchases planned in 2018, 2019 and 2020.
Fleet EV Progress indicator update:
By contacting 15 local public fleets, Clean Fuels Ohio helped the Smart City program office
surpass one of its progress indicators this quarter. CFO focused on updating fleet managers
about the options and opportunities that fleets have for reducing operational costs, improving
efficiency, and minimizing environmental impacts by implementing electric vehicle technologies.
Though the presentation was framed in overall fuel neutral capacity, particular focus was given
to the cost effective and easily implementable electric vehicle options.
1. Ohio State University Transportation
and Traffic Management, and
CampusParc LP
2. Delaware Public Transit
3. Delaware City Schools
4. City of Marysville
5. Union County Public Transit
6. Marysville City Schools
7. Franklin County
8. Grove City
9. Southwestern City Schools
10. Jefferson Township
11. City of Hilliard
12. Hilliard City Schools
13. Norwich Township
14. Columbus Public Schools
15. Big Walnut School District
Non-binding letters of intent signed between AEP and Clean Fuels Ohio and Workhorse to procure up to 500 EV Trucks over a two year period. An XL Hybrid Ride and Drive event was held on June 19th
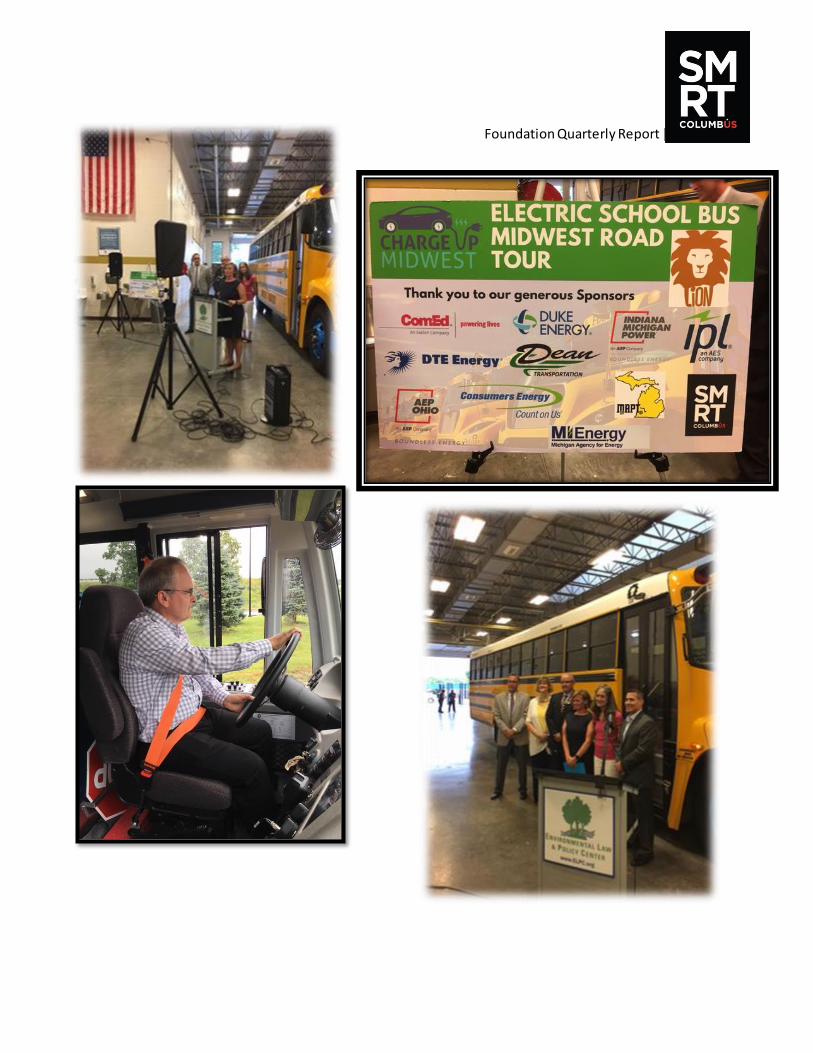
Electric School Bus:
In an initiative to encourage local school districts to consider adopting electric buses, the Smart
Columbus team and the Columbus Public Schools worked with Charge-up Midwest to host a
press event and showcase an electric school bus built by the Lion Corporation. Representatives
from the City of Columbus Smart Columbus Program Office, Columbus Public Schools and the
City of Columbus Health Department spoke about the benefits of electric vehicles and the
importance of emissions reduction for not only environmental reasons but also increasing health
Foundation Quarterly Report | Q2 2017
concerns related to poor air quality.
Fleet Training:
The Fleet subgroup has been working on preparations for Strategy 2.1.1, Training and
Technical Assistance Workshops; which will consist of an EV Intro Class, Safety,
Maintenance and Repairs.
Priority 3: Transit, Autonomous and Multi-Modal Systems:
This priority is a part of the Smart Columbus program driven by the USDOT grant. The city
also remains committed to other modes of travel such as bicycles. Bicycle infrastructure
remains a top priority of the city. Current design has arranged for approximately 30 street
segments expected to be under construction in 2017 that will involve bikeways work.
Projects expected to be completed in 2017 will add:
3.6 miles of bike lanes
3.5 miles of shared-use path
0.8 miles of sharrows
So far this year, the City has installed:
1.2 miles of bike lanes 1.2 miles of shared-use path 0 miles of sharrows
Priority 4: Consumer Adoption:
The Program Management Office (PMO) and Columbus Partnership are in detailed
discussions with automakers Daimler and Ford about their desired commitments to the
program on several initiatives, including:
Providing more EV models and number of EVs (used and new) to the seven-
county central Ohio region over the next three years
Providing more robust dealer training and engagement on EV sales
Increasing advertising and assisting with customer education efforts of EVs
to help educate consumers and reduce range anxiety
Coordinating with the program’s EV showcase, an initiative that will be
established to educate and inform local residents, visitors, stakeholders, and
other cities and leadership delegations from around the world about how
Columbus is becoming a Smart City
Foundation Quarterly Report | Q2 2017
Coordinating with the ride and drive initiatives
Coordinating and collaborating on EV charging initiatives and incentives
The source of data supporting the Smart Columbus tracking of consumer EV adoption is
National Renewable Energy Lab (NREL) and HIS Polk. Data reporting compares EV and PHEV
new vehicle registrations compared to all vehicle fuel type new vehicle registrations during the
same period. The geographical area covered by the reported data is comprised of the seven
Central Ohio counties of Delaware, Fairfield, Franklin, Licking, Madison, Pickaway, and Union.
As the program progresses, the Program Management Office will continue to seek
out additional automakers as partners.
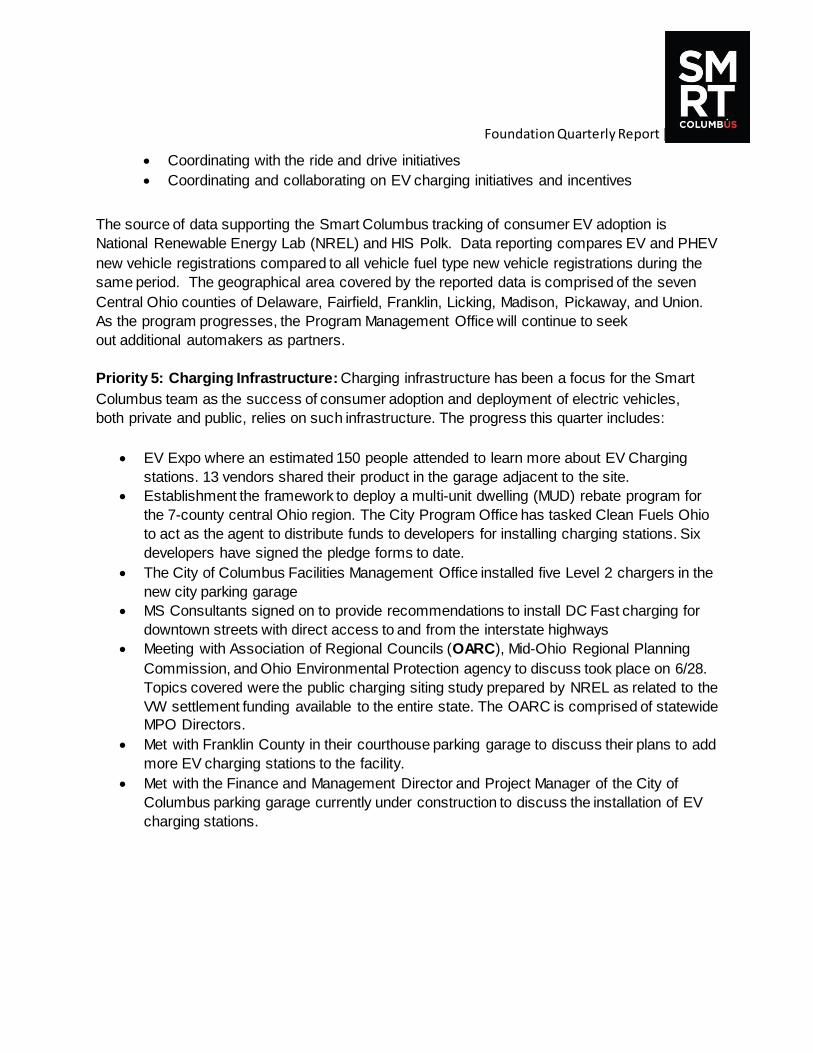
Priority 5: Charging Infrastructure: Charging infrastructure has been a focus for the Smart
Columbus team as the success of consumer adoption and deployment of electric vehicles,
both private and public, relies on such infrastructure. The progress this quarter includes:
EV Expo where an estimated 150 people attended to learn more about EV Charging
stations. 13 vendors shared their product in the garage adjacent to the site.
Establishment the framework to deploy a multi-unit dwelling (MUD) rebate program for
the 7-county central Ohio region. The City Program Office has tasked Clean Fuels Ohio
to act as the agent to distribute funds to developers for installing charging stations. Six
developers have signed the pledge forms to date.
The City of Columbus Facilities Management Office installed five Level 2 chargers in the
new city parking garage
MS Consultants signed on to provide recommendations to install DC Fast charging for
downtown streets with direct access to and from the interstate highways
Meeting with Association of Regional Councils (OARC), Mid-Ohio Regional Planning
Commission, and Ohio Environmental Protection agency to discuss took place on 6/28.
Topics covered were the public charging siting study prepared by NREL as related to the
VW settlement funding available to the entire state. The OARC is comprised of statewide
MPO Directors.
Met with Franklin County in their courthouse parking garage to discuss their plans to add
more EV charging stations to the facility.
Met with the Finance and Management Director and Project Manager of the City of
Columbus parking garage currently under construction to discuss the installation of EV
charging stations.
Foundation Quarterly Report | Q2 2017
Conclusion
The City of Columbus is committed to being a strong partner of the Paul G. Allen Family
Foundation. This quarterly report serves as a crucial communication tool to share
successes and challenges along with progress made through use of data and narratives.
Below are several highlights from the program during April through June, 2017:
Section 1: QUARTER IN REVIEW PRIORITY HIGHLIGHTS
Priorities Highlights
Priority 1 - De-
carbonization/Grid Modernization
● Conversation with Bob Evans about their recent rooftop solar installations
● DC Solar selected Ohio Dominican University as first solar charging station deployment of 30 mobile units.
● DC Solar deployment opportunity discussions/site visits set up with the Columbus Zoo, OSU, and Columbus State
● Work is being done to source funds and accelerate repairs for the O’Shaughnessy hydroelectric power generator. This will help us achieve the goals of generating 10,000 MWh per year as early as 2019
Priority 2 - Fleet Adoption
● Proterra Electric Bus Demoed their electric bus for the Smart Columbus Team
● Finalized Comments on Electrification Coalition EV Suitability Analysis
● Contract has been signed for Fleet charging station design
● Bid specs finalized. 6 Bids have been received ● CFO and MEMA are hosting Midwest Green Fleets
Forum & Expo August 2nd -4th with EV showcase including training and information on buying EVs and charging infrastructure
● EV Hybrid Info Class with Safety Services and Maintenance training scheduled for September 25th. NAPA
● Progress Indicator #1 completed: Contact has been made with over 5 other governments and institutions (15 total)
Priority 4 - Consumer ● The Columbus Partnership (TCP) board met at the Idea
Foundation Quarterly Report | Q2 2017
Adoption Foundry on May 16: good turn out from young CEO’s and overall follow up interest
● Over 80 applicants for TCP new positions – Interviews conducted, but search still ongoing.
● Legislation for Columbus Partnership as a sub recipient to lead consumer adoption, private fleet, and workplace charging passed Council
● New Smart Columbus Branding finalized and rolled out to the community
● OSU EEDS Team Completed an EV Market Analysis ● Continued OEM Engagement with Daimler, GM, Ford
and Honda ● Executed Honda agreement ● Very positive and engaging relationship development
with Tesla – Tesla team visited Columbus and Smart Columbus traveled to San Francisco to meet with their leadership.
● NREL reported that EV and PHEV adoption in the seven-county region increased to 0.66% for 2016.
● Making progress with NREL on obtaining monthly EV and PHEV sales metrics
● AEP released the Nissan Leaf rebate that was extended to all AEP staff as well as all 1.6 million AEP customers
● Gallery walks have been rebranded as Smart Columbus Live – Walkthroughs to be held every Tuesday, July through December, for the general public.
● Look book of available electric vehicles developed and distributed to corporate CEOs.
● Five CEOs now driving electric vehicles.
Priority 5 - Charging
Infrastructure
● Positive feedback from EV expo survey ● Working to put together another vendor engagement day ● Public siting subgroup working to refine charging location
study ● Public siting subgroup meeting with ODOT to consider
inclusion of DC Fast chargers at downtown location ● Discussing site plan requirements with Building and
Zoning and AEP ● The City of Columbus and MS Consultants are finalizing
power source locations and necessary infrastructure to be installed for electric vehicle quick charging stations on Mound Street and Fulton Street
Foundation Quarterly Report | Q2 2017
1.1 Progress/Successes
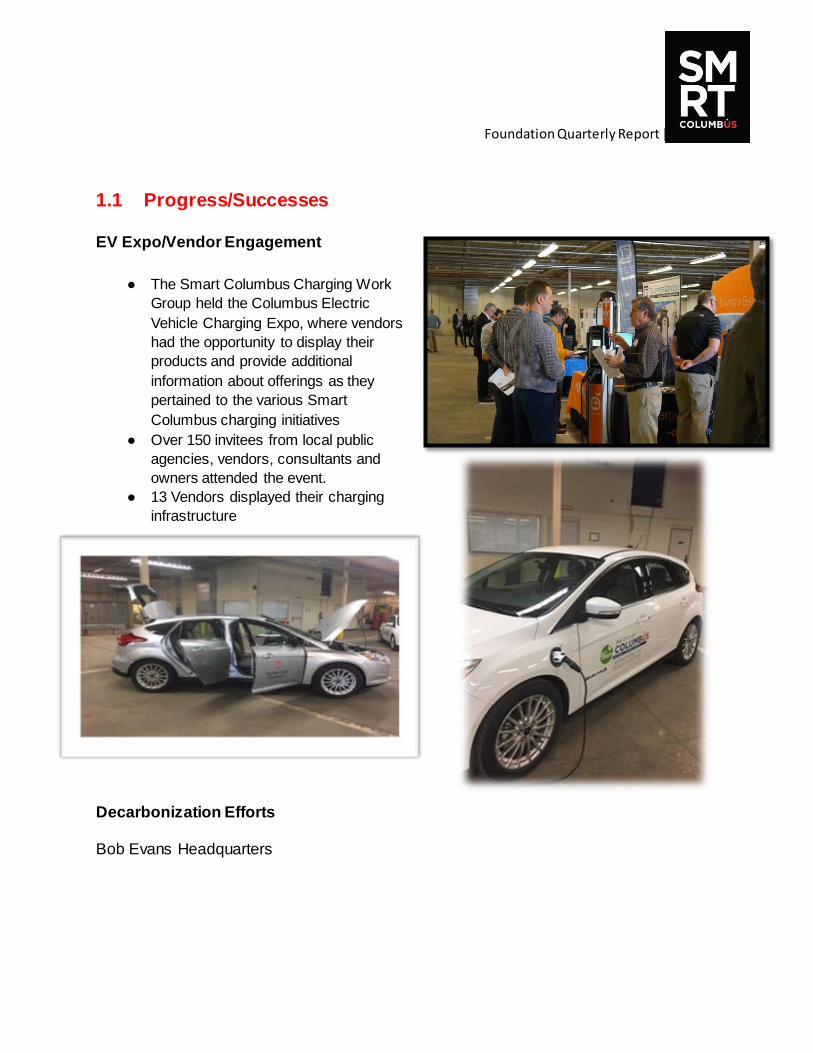
EV Expo/Vendor Engagement
● The Smart Columbus Charging Work
Group held the Columbus Electric
Vehicle Charging Expo, where vendors
had the opportunity to display their
products and provide additional
information about offerings as they
pertained to the various Smart
Columbus charging initiatives
● Over 150 invitees from local public
agencies, vendors, consultants and
owners attended the event.
● 13 Vendors displayed their charging
infrastructure
Decarbonization Efforts
Bob Evans Headquarters
Foundation Quarterly Report | Q2 2017
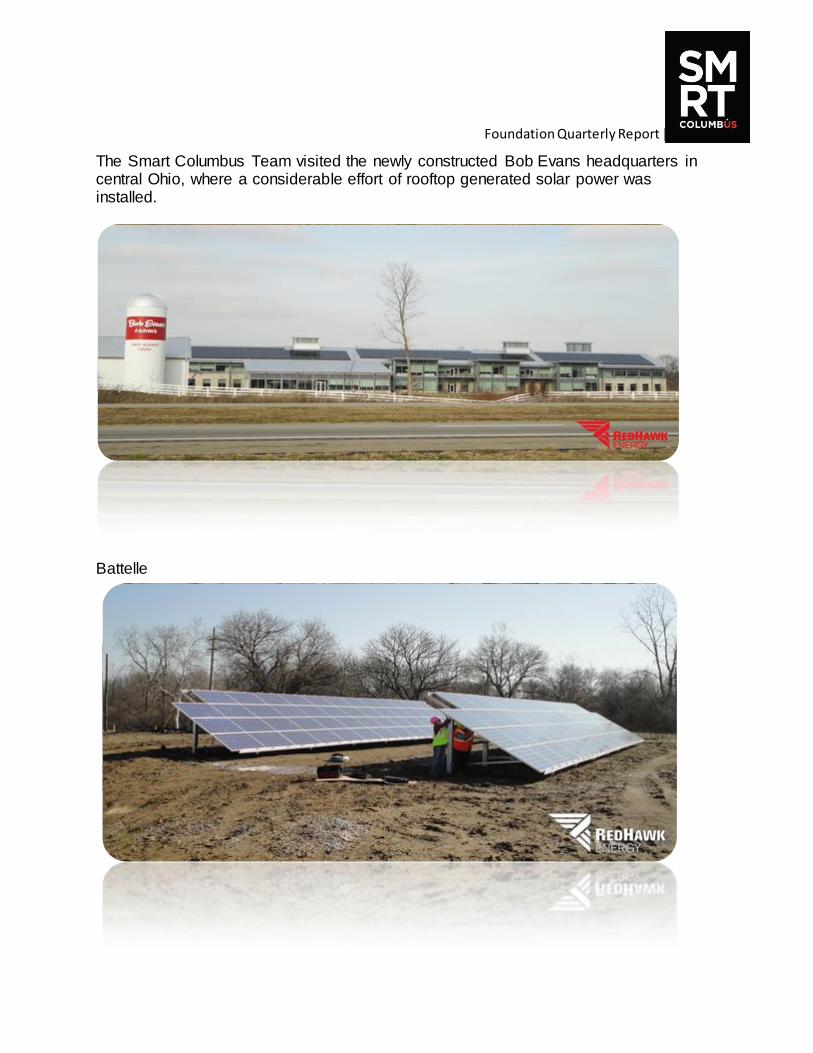
The Smart Columbus Team visited the newly constructed Bob Evans headquarters in central Ohio, where a considerable effort of rooftop generated solar power was installed.
Battelle
Foundation Quarterly Report | Q2 2017
Franklin Co
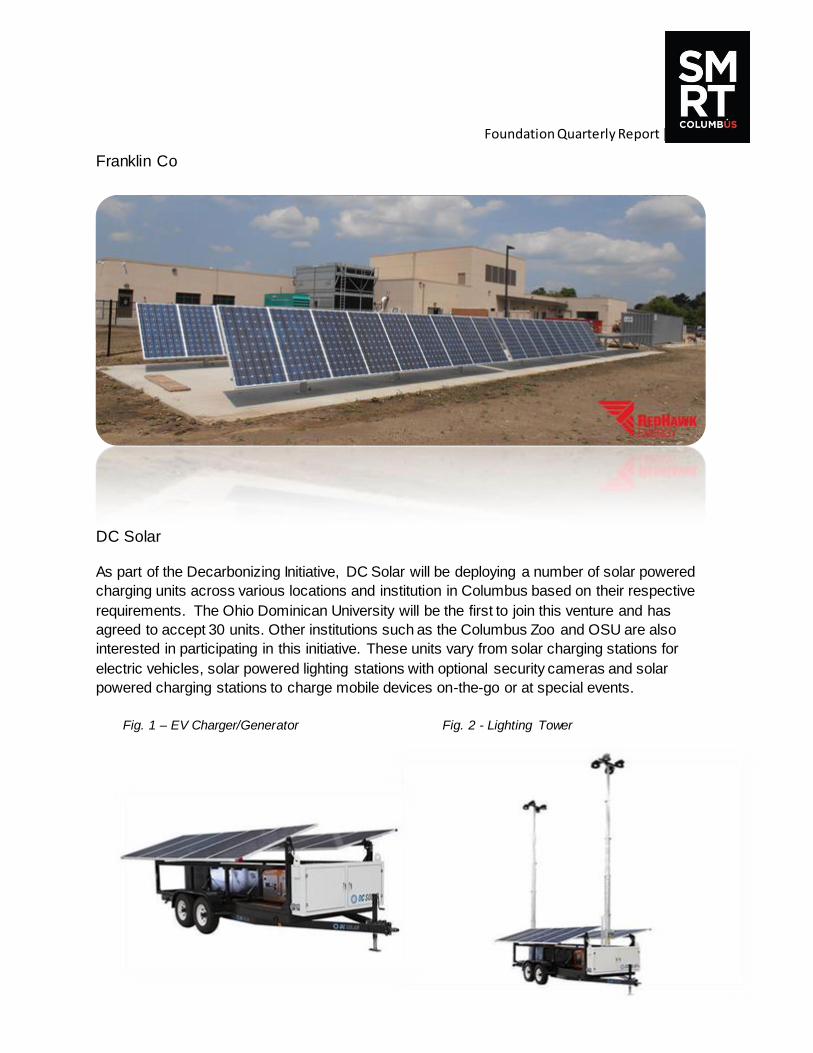
DC Solar As part of the Decarbonizing Initiative, DC Solar will be deploying a number of solar powered
charging units across various locations and institution in Columbus based on their respective
requirements. The Ohio Dominican University will be the first to join this venture and has
agreed to accept 30 units. Other institutions such as the Columbus Zoo and OSU are also
interested in participating in this initiative. These units vary from solar charging stations for
electric vehicles, solar powered lighting stations with optional security cameras and solar
powered charging stations to charge mobile devices on-the-go or at special events.
Fig. 1 – EV Charger/Generator Fig. 2 - Lighting Tower
Foundation Quarterly Report | Q2 2017
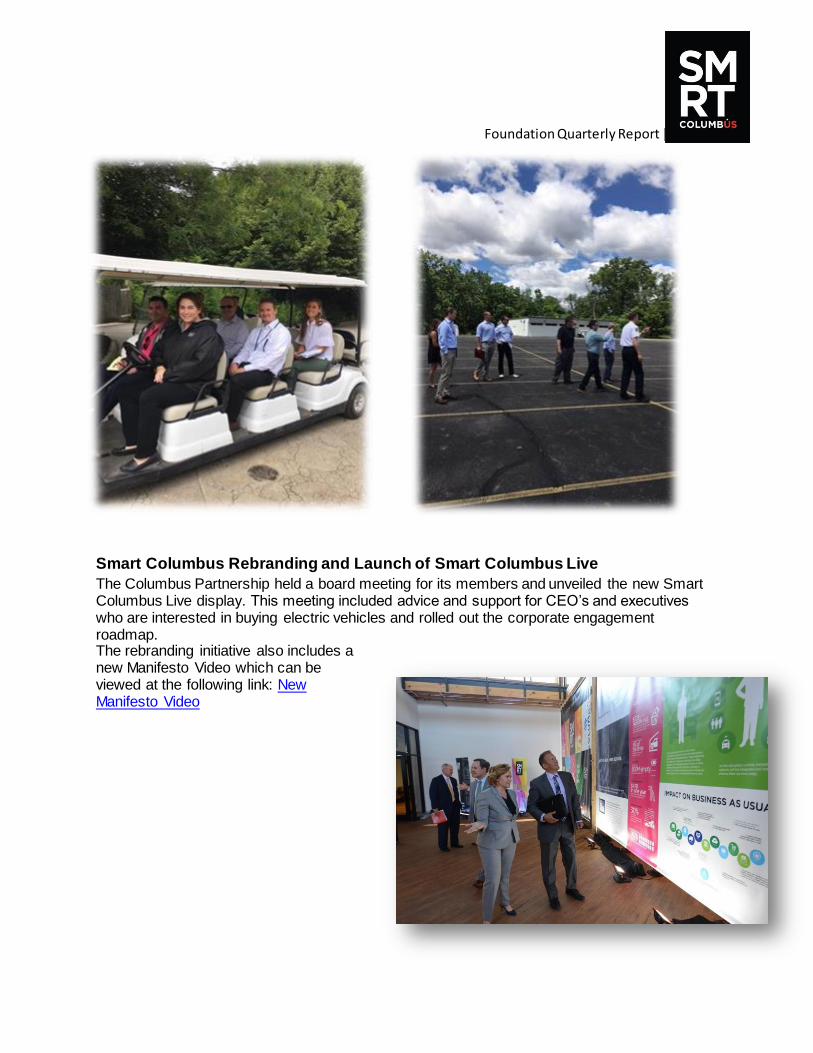
Smart Columbus Rebranding and Launch of Smart Columbus Live
The Columbus Partnership held a board meeting for its members and unveiled the new Smart Columbus Live display. This meeting included advice and support for CEO’s and executives who are interested in buying electric vehicles and rolled out the corporate engagement roadmap. The rebranding initiative also includes a new Manifesto Video which can be viewed at the following link: New Manifesto Video
Foundation Quarterly Report | Q2 2017
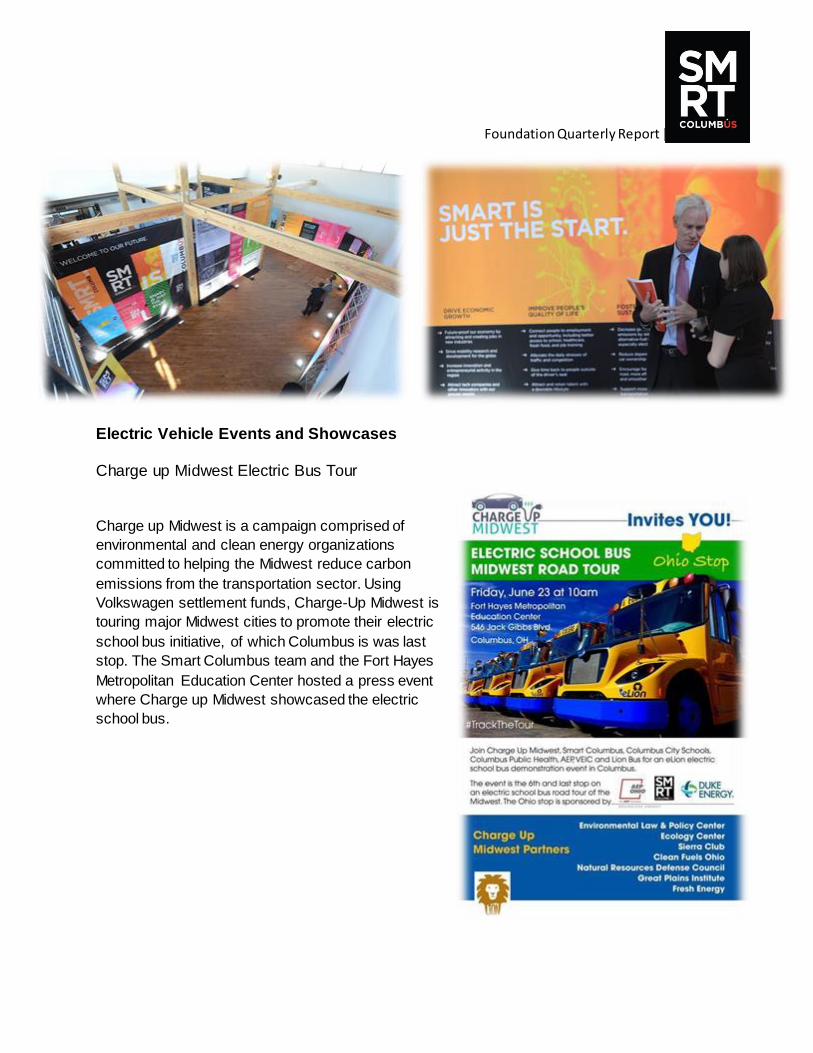
Electric Vehicle Events and Showcases
Charge up Midwest Electric Bus Tour
Charge up Midwest is a campaign comprised of
environmental and clean energy organizations
committed to helping the Midwest reduce carbon
emissions from the transportation sector. Using
Volkswagen settlement funds, Charge-Up Midwest is
touring major Midwest cities to promote their electric
school bus initiative, of which Columbus is was last
stop. The Smart Columbus team and the Fort Hayes
Metropolitan Education Center hosted a press event
where Charge up Midwest showcased the electric
school bus.
Foundation Quarterly Report | Q2 2017
Foundation Quarterly Report | Q2 2017
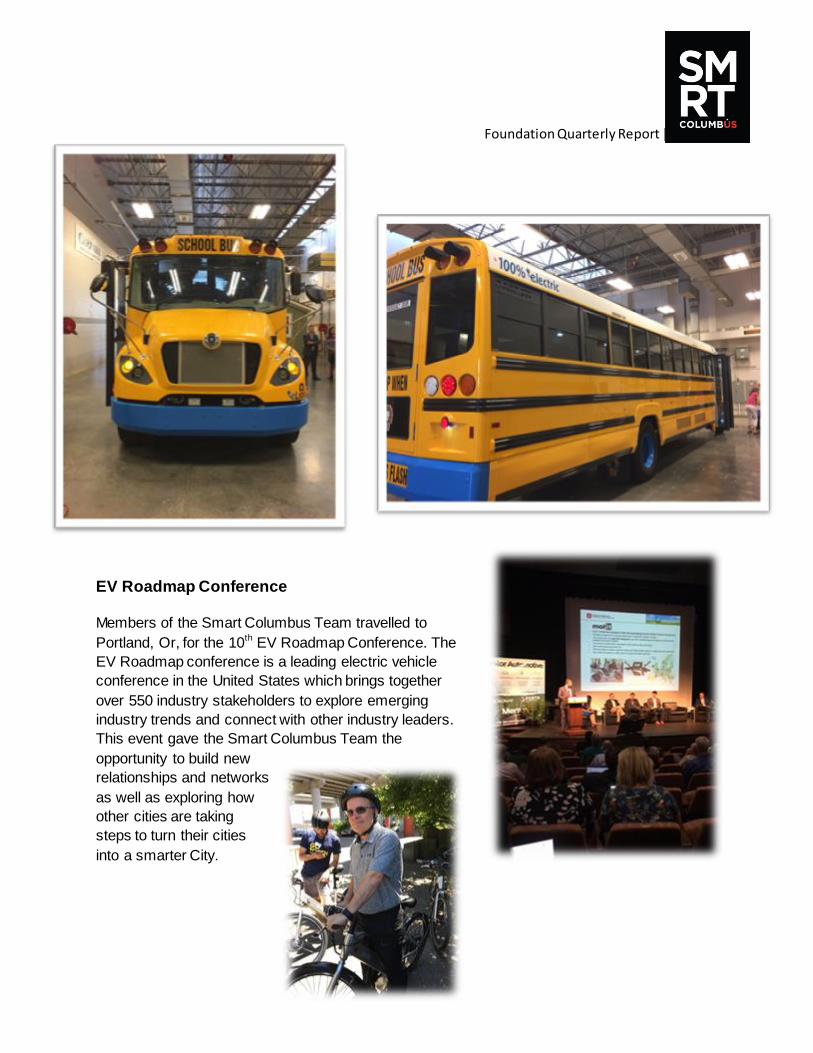
EV Roadmap Conference
Members of the Smart Columbus Team travelled to
Portland, Or, for the 10th EV Roadmap Conference. The
EV Roadmap conference is a leading electric vehicle
conference in the United States which brings together
over 550 industry stakeholders to explore emerging
industry trends and connect with other industry leaders.
This event gave the Smart Columbus Team the
opportunity to build new
relationships and networks
as well as exploring how
other cities are taking
steps to turn their cities
into a smarter City.
Foundation Quarterly Report | Q2 2017
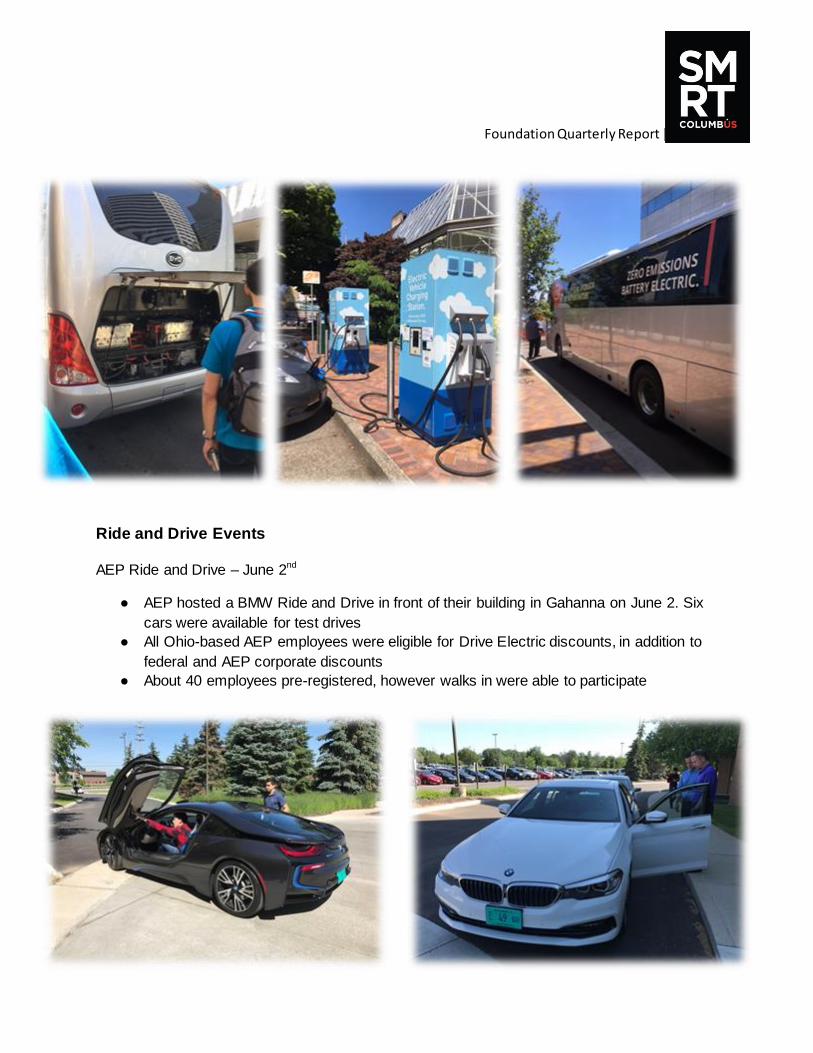
Ride and Drive Events
AEP Ride and Drive – June 2nd
● AEP hosted a BMW Ride and Drive in front of their building in Gahanna on June 2. Six
cars were available for test drives
● All Ohio-based AEP employees were eligible for Drive Electric discounts, in addition to
federal and AEP corporate discounts
● About 40 employees pre-registered, however walks in were able to participate
Foundation Quarterly Report | Q2 2017
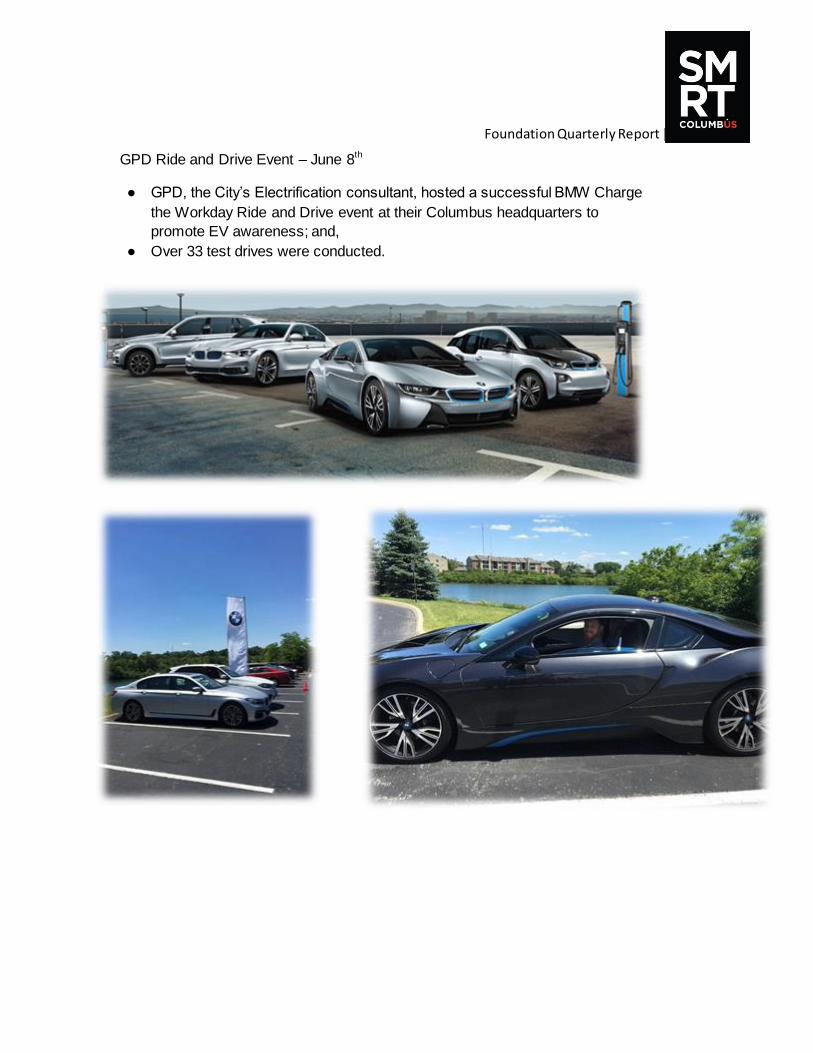
GPD Ride and Drive Event – June 8th
● GPD, the City’s Electrification consultant, hosted a successful BMW Charge
the Workday Ride and Drive event at their Columbus headquarters to
promote EV awareness; and,
● Over 33 test drives were conducted.
Foundation Quarterly Report | Q2 2017
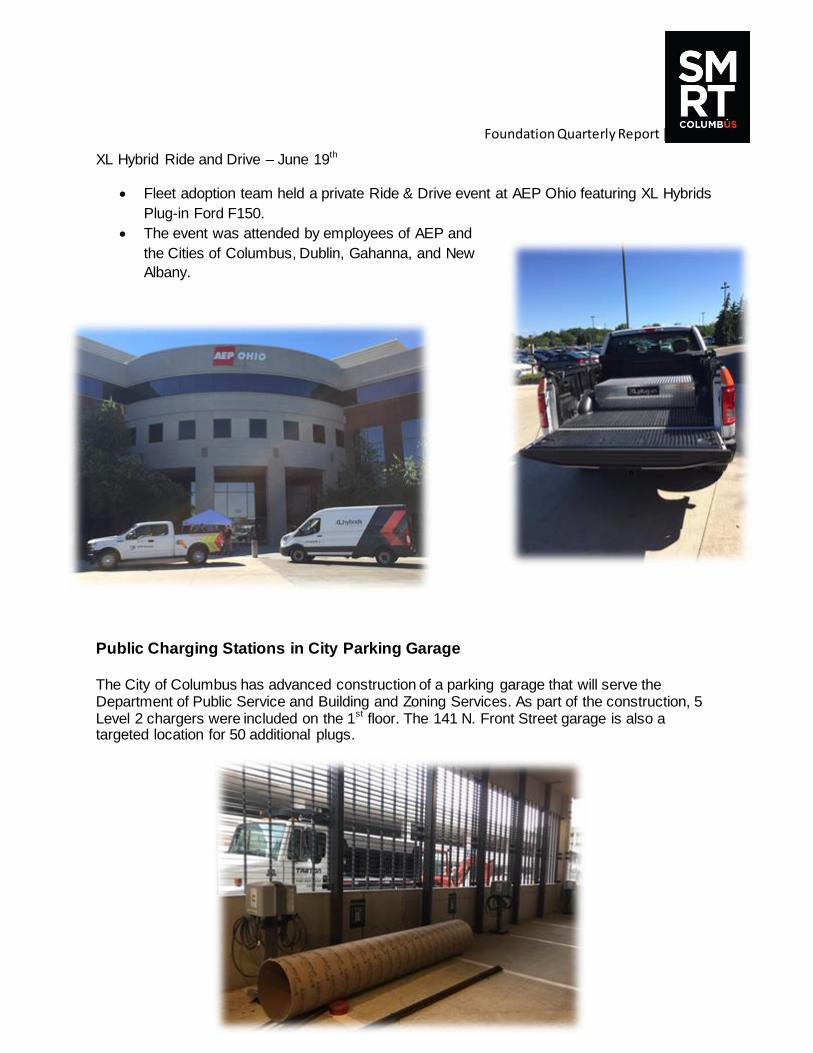
XL Hybrid Ride and Drive – June 19th
Fleet adoption team held a private Ride & Drive event at AEP Ohio featuring XL Hybrids
Plug-in Ford F150.
The event was attended by employees of AEP and
the Cities of Columbus, Dublin, Gahanna, and New
Albany.
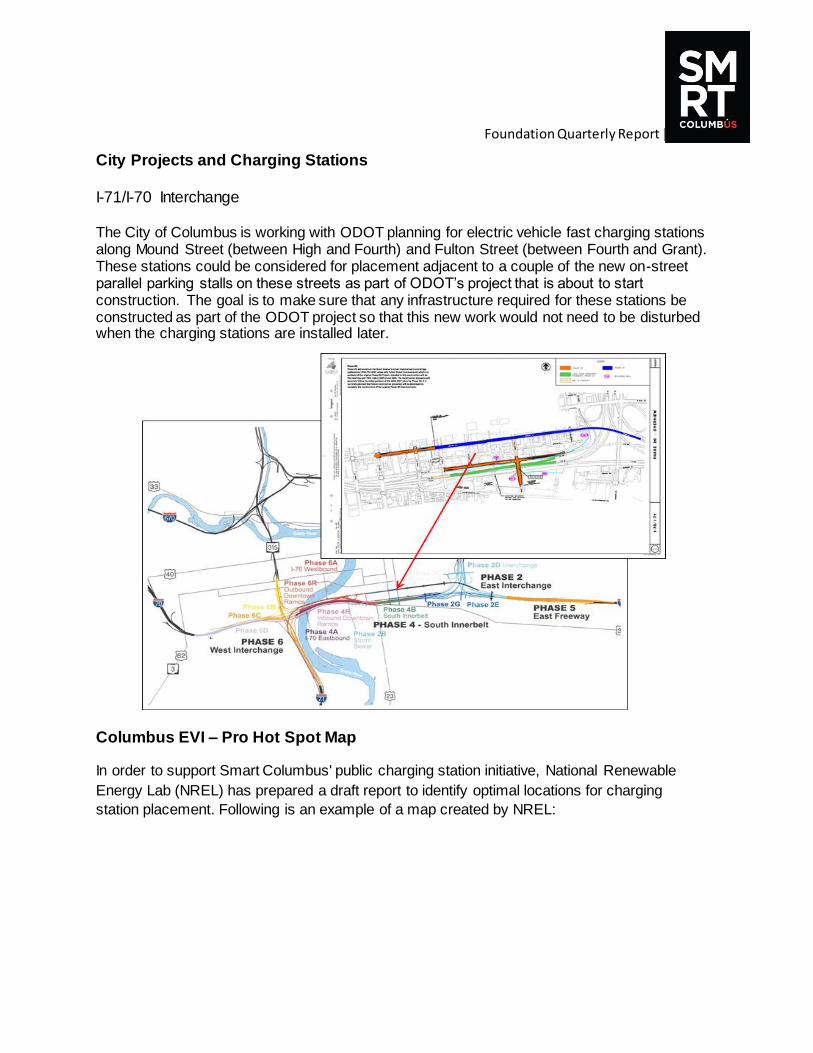
Public Charging Stations in City Parking Garage The City of Columbus has advanced construction of a parking garage that will serve the Department of Public Service and Building and Zoning Services. As part of the construction, 5 Level 2 chargers were included on the 1
st floor. The 141 N. Front Street garage is also a
targeted location for 50 additional plugs.
Foundation Quarterly Report | Q2 2017
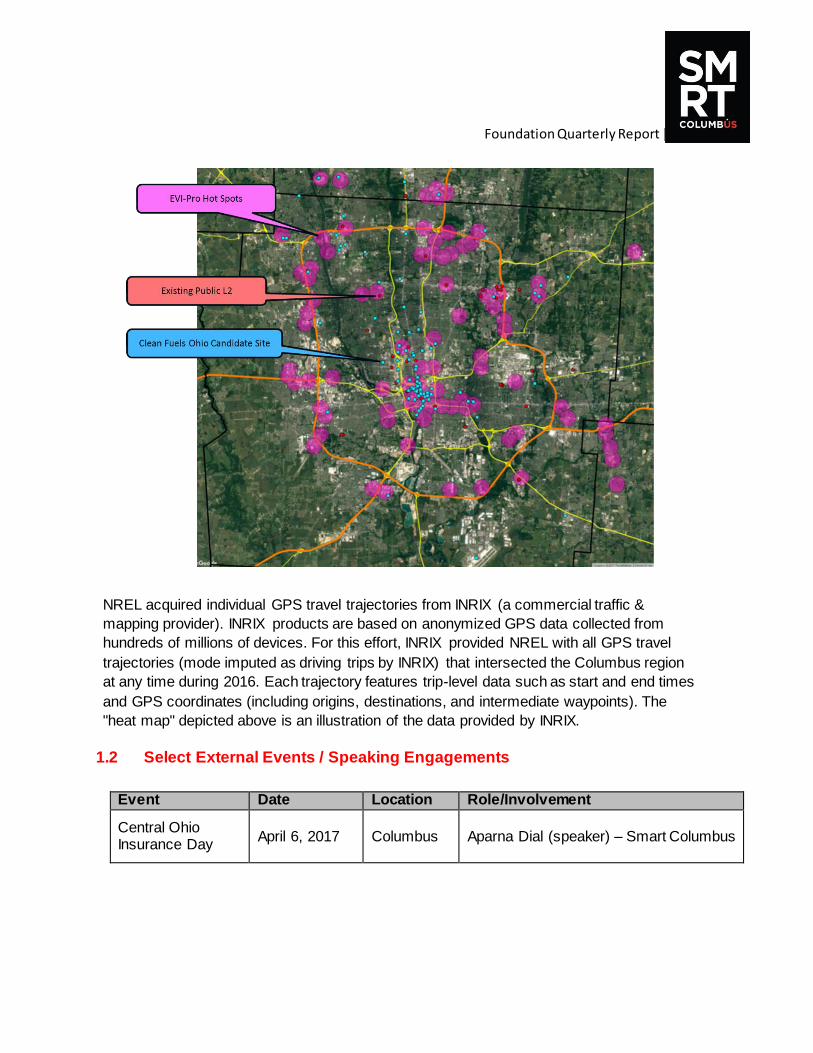
City Projects and Charging Stations
I-71/I-70 Interchange
The City of Columbus is working with ODOT planning for electric vehicle fast charging stations along Mound Street (between High and Fourth) and Fulton Street (between Fourth and Grant). These stations could be considered for placement adjacent to a couple of the new on-street parallel parking stalls on these streets as part of ODOT’s project that is about to start construction. The goal is to make sure that any infrastructure required for these stations be constructed as part of the ODOT project so that this new work would not need to be disturbed when the charging stations are installed later.
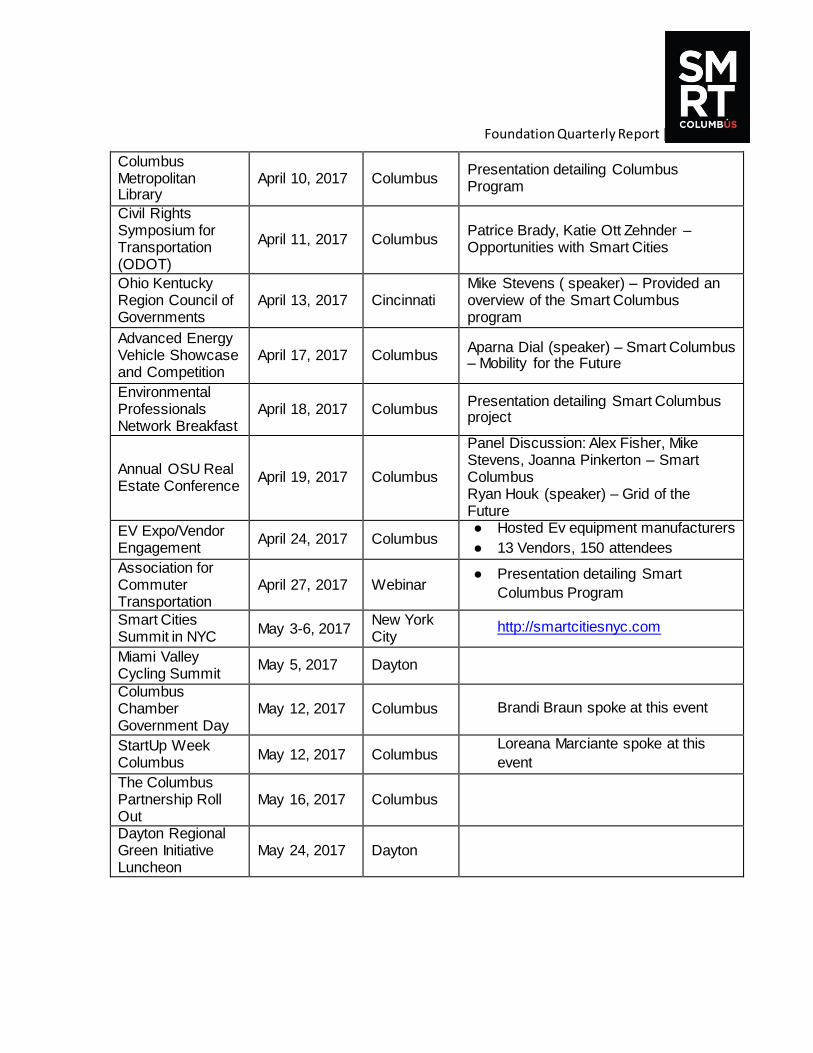
Columbus EVI – Pro Hot Spot Map
In order to support Smart Columbus' public charging station initiative, National Renewable
Energy Lab (NREL) has prepared a draft report to identify optimal locations for charging
station placement. Following is an example of a map created by NREL:
Foundation Quarterly Report | Q2 2017
NREL acquired individual GPS travel trajectories from INRIX (a commercial traffic &
mapping provider). INRIX products are based on anonymized GPS data collected from
hundreds of millions of devices. For this effort, INRIX provided NREL with all GPS travel
trajectories (mode imputed as driving trips by INRIX) that intersected the Columbus region
at any time during 2016. Each trajectory features trip-level data such as start and end times
and GPS coordinates (including origins, destinations, and intermediate waypoints). The
"heat map" depicted above is an illustration of the data provided by INRIX.
1.2 Select External Events / Speaking Engagements
Event Date Location Role/Involvement
Central Ohio Insurance Day
April 6, 2017 Columbus Aparna Dial (speaker) – Smart Columbus
Foundation Quarterly Report | Q2 2017
Columbus Metropolitan Library
April 10, 2017 Columbus Presentation detailing Columbus Program
Civil Rights Symposium for Transportation (ODOT)
April 11, 2017 Columbus Patrice Brady, Katie Ott Zehnder – Opportunities with Smart Cities
Ohio Kentucky Region Council of Governments
April 13, 2017 Cincinnati Mike Stevens ( speaker) – Provided an overview of the Smart Columbus program
Advanced Energy Vehicle Showcase and Competition
April 17, 2017 Columbus Aparna Dial (speaker) – Smart Columbus – Mobility for the Future
Environmental Professionals Network Breakfast
April 18, 2017 Columbus Presentation detailing Smart Columbus project
Annual OSU Real Estate Conference
April 19, 2017 Columbus
Panel Discussion: Alex Fisher, Mike Stevens, Joanna Pinkerton – Smart Columbus Ryan Houk (speaker) – Grid of the Future
EV Expo/Vendor Engagement
April 24, 2017 Columbus ● Hosted Ev equipment manufacturers
● 13 Vendors, 150 attendees
Association for Commuter Transportation
April 27, 2017 Webinar ● Presentation detailing Smart
Columbus Program
Smart Cities Summit in NYC
May 3-6, 2017 New York City
http://smartcitiesnyc.com
Miami Valley Cycling Summit
May 5, 2017 Dayton
Columbus Chamber Government Day
May 12, 2017 Columbus Brandi Braun spoke at this event
StartUp Week Columbus
May 12, 2017 Columbus Loreana Marciante spoke at this
event
The Columbus Partnership Roll Out
May 16, 2017 Columbus
Dayton Regional Green Initiative Luncheon
May 24, 2017 Dayton
Foundation Quarterly Report | Q2 2017
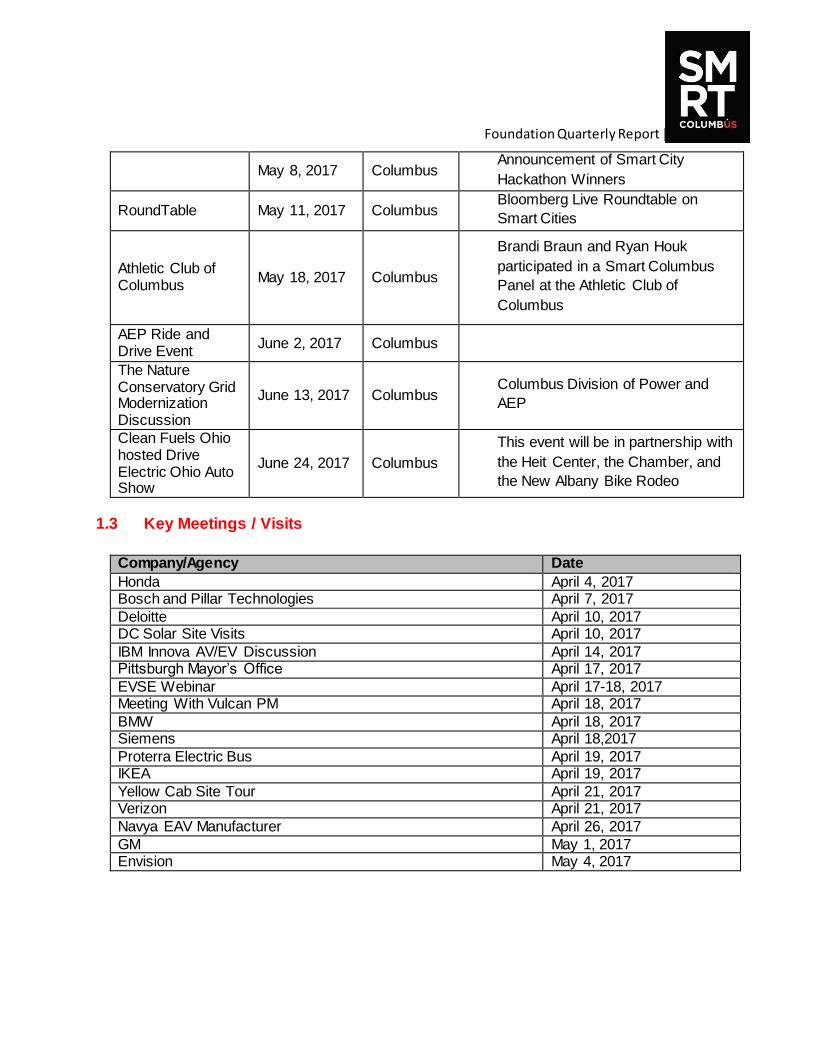
May 8, 2017 Columbus Announcement of Smart City
Hackathon Winners
RoundTable May 11, 2017 Columbus Bloomberg Live Roundtable on
Smart Cities
Athletic Club of Columbus
May 18, 2017 Columbus
Brandi Braun and Ryan Houk
participated in a Smart Columbus
Panel at the Athletic Club of
Columbus
AEP Ride and Drive Event
June 2, 2017 Columbus
The Nature Conservatory Grid Modernization Discussion
June 13, 2017 Columbus Columbus Division of Power and
AEP
Clean Fuels Ohio hosted Drive Electric Ohio Auto Show
June 24, 2017 Columbus
This event will be in partnership with
the Heit Center, the Chamber, and
the New Albany Bike Rodeo
1.3 Key Meetings / Visits
Company/Agency Date
Honda April 4, 2017 Bosch and Pillar Technologies April 7, 2017
Deloitte April 10, 2017 DC Solar Site Visits April 10, 2017
IBM Innova AV/EV Discussion April 14, 2017 Pittsburgh Mayor’s Office April 17, 2017
EVSE Webinar April 17-18, 2017 Meeting With Vulcan PM April 18, 2017
BMW April 18, 2017 Siemens April 18,2017
Proterra Electric Bus April 19, 2017 IKEA April 19, 2017
Yellow Cab Site Tour April 21, 2017 Verizon April 21, 2017
Navya EAV Manufacturer April 26, 2017
GM May 1, 2017 Envision May 4, 2017
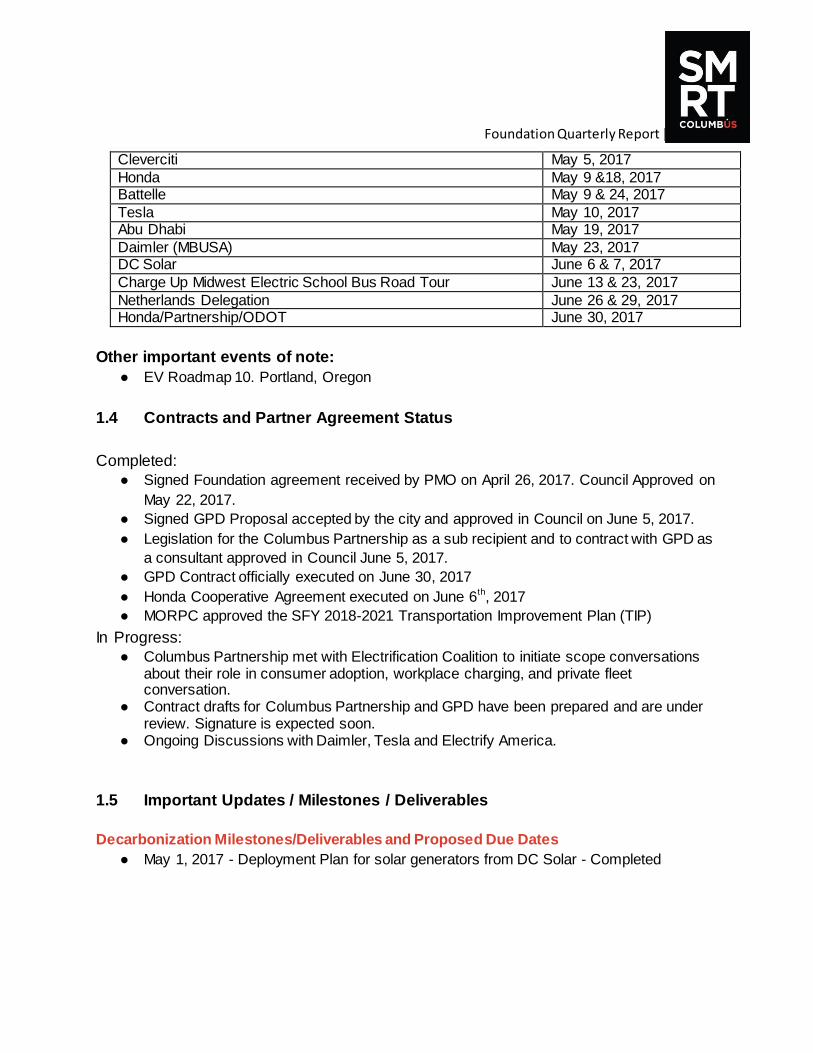
Foundation Quarterly Report | Q2 2017
Cleverciti May 5, 2017
Honda May 9 &18, 2017 Battelle May 9 & 24, 2017
Tesla May 10, 2017 Abu Dhabi May 19, 2017
Daimler (MBUSA) May 23, 2017 DC Solar June 6 & 7, 2017
Charge Up Midwest Electric School Bus Road Tour June 13 & 23, 2017
Netherlands Delegation June 26 & 29, 2017 Honda/Partnership/ODOT June 30, 2017
Other important events of note:
● EV Roadmap 10. Portland, Oregon
1.4 Contracts and Partner Agreement Status
Completed:
● Signed Foundation agreement received by PMO on April 26, 2017. Council Approved on
May 22, 2017.
● Signed GPD Proposal accepted by the city and approved in Council on June 5, 2017.
● Legislation for the Columbus Partnership as a sub recipient and to contract with GPD as
a consultant approved in Council June 5, 2017.
● GPD Contract officially executed on June 30, 2017
● Honda Cooperative Agreement executed on June 6th, 2017
● MORPC approved the SFY 2018-2021 Transportation Improvement Plan (TIP)
In Progress:
● Columbus Partnership met with Electrification Coalition to initiate scope conversations about their role in consumer adoption, workplace charging, and private fleet conversation.
● Contract drafts for Columbus Partnership and GPD have been prepared and are under review. Signature is expected soon.
● Ongoing Discussions with Daimler, Tesla and Electrify America.
1.5 Important Updates / Milestones / Deliverables
Decarbonization Milestones/Deliverables and Proposed Due Dates
● May 1, 2017 - Deployment Plan for solar generators from DC Solar - Completed
Foundation Quarterly Report | Q2 2017
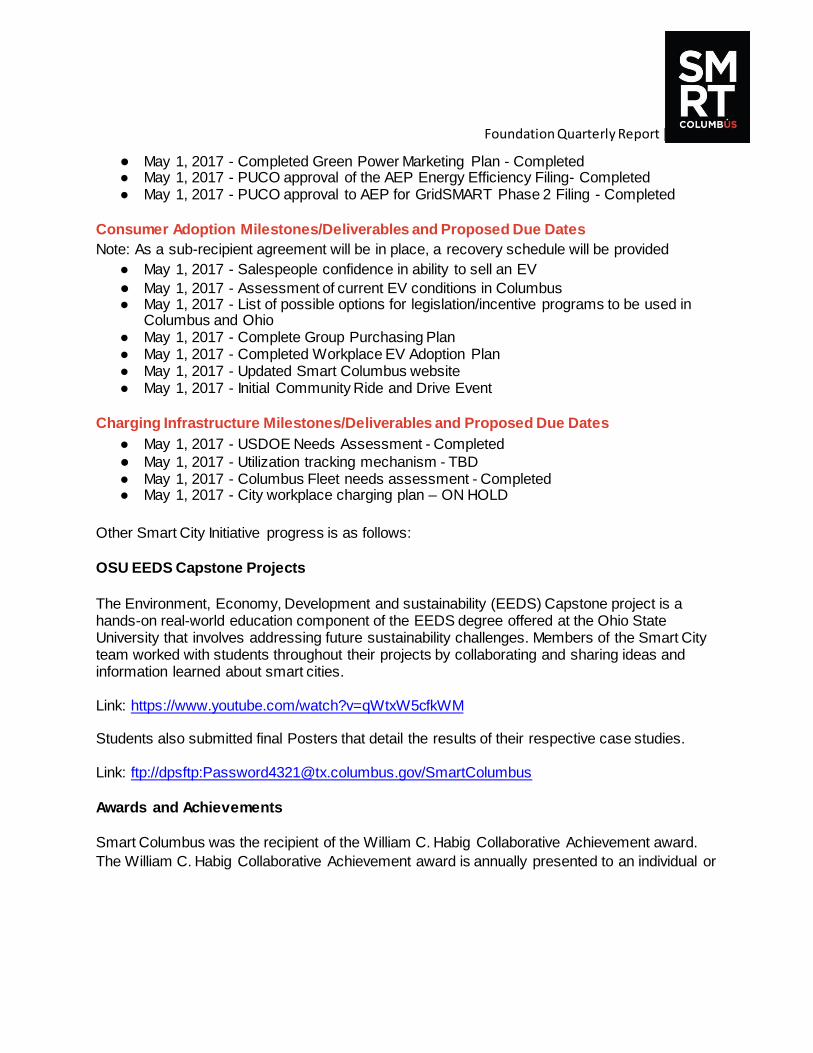
● May 1, 2017 - Completed Green Power Marketing Plan - Completed ● May 1, 2017 - PUCO approval of the AEP Energy Efficiency Filing- Completed ● May 1, 2017 - PUCO approval to AEP for GridSMART Phase 2 Filing - Completed
Consumer Adoption Milestones/Deliverables and Proposed Due Dates
Note: As a sub-recipient agreement will be in place, a recovery schedule will be provided
● May 1, 2017 - Salespeople confidence in ability to sell an EV
● May 1, 2017 - Assessment of current EV conditions in Columbus ● May 1, 2017 - List of possible options for legislation/incentive programs to be used in
Columbus and Ohio ● May 1, 2017 - Complete Group Purchasing Plan ● May 1, 2017 - Completed Workplace EV Adoption Plan ● May 1, 2017 - Updated Smart Columbus website ● May 1, 2017 - Initial Community Ride and Drive Event
Charging Infrastructure Milestones/Deliverables and Proposed Due Dates
● May 1, 2017 - USDOE Needs Assessment - Completed
● May 1, 2017 - Utilization tracking mechanism - TBD ● May 1, 2017 - Columbus Fleet needs assessment - Completed ● May 1, 2017 - City workplace charging plan – ON HOLD
Other Smart City Initiative progress is as follows:
OSU EEDS Capstone Projects
The Environment, Economy, Development and sustainability (EEDS) Capstone project is a hands-on real-world education component of the EEDS degree offered at the Ohio State University that involves addressing future sustainability challenges. Members of the Smart City team worked with students throughout their projects by collaborating and sharing ideas and information learned about smart cities. Link: https://www.youtube.com/watch?v=qWtxW5cfkWM Students also submitted final Posters that detail the results of their respective case studies. Link: ftp://dpsftp:[email protected]/SmartColumbus Awards and Achievements
Smart Columbus was the recipient of the William C. Habig Collaborative Achievement award.
The William C. Habig Collaborative Achievement award is annually presented to an individual or
Foundation Quarterly Report | Q2 2017
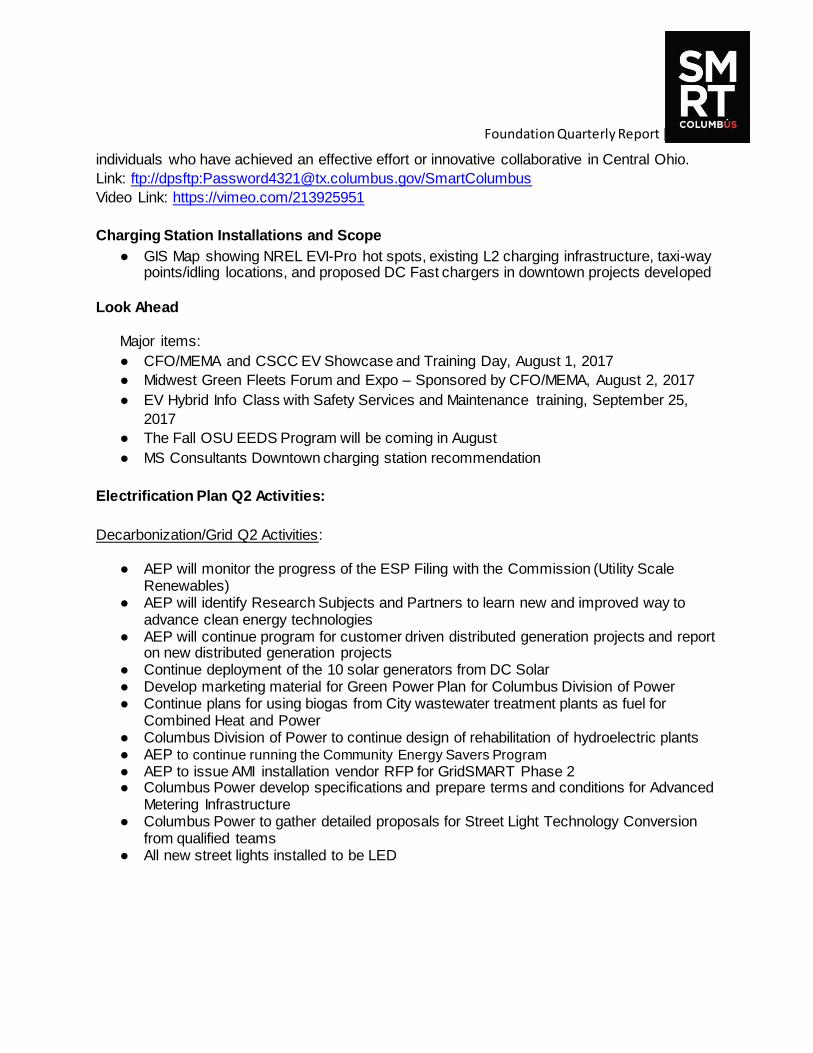
individuals who have achieved an effective effort or innovative collaborative in Central Ohio.
Link: ftp://dpsftp:[email protected]/SmartColumbus
Video Link: https://vimeo.com/213925951
Charging Station Installations and Scope
● GIS Map showing NREL EVI-Pro hot spots, existing L2 charging infrastructure, taxi-way points/idling locations, and proposed DC Fast chargers in downtown projects developed
Look Ahead
Major items:
● CFO/MEMA and CSCC EV Showcase and Training Day, August 1, 2017
● Midwest Green Fleets Forum and Expo – Sponsored by CFO/MEMA, August 2, 2017
● EV Hybrid Info Class with Safety Services and Maintenance training, September 25,
2017
● The Fall OSU EEDS Program will be coming in August
● MS Consultants Downtown charging station recommendation
Electrification Plan Q2 Activities:
Decarbonization/Grid Q2 Activities:
● AEP will monitor the progress of the ESP Filing with the Commission (Utility Scale Renewables)
● AEP will identify Research Subjects and Partners to learn new and improved way to advance clean energy technologies
● AEP will continue program for customer driven distributed generation projects and report on new distributed generation projects
● Continue deployment of the 10 solar generators from DC Solar ● Develop marketing material for Green Power Plan for Columbus Division of Power ● Continue plans for using biogas from City wastewater treatment plants as fuel for
Combined Heat and Power ● Columbus Division of Power to continue design of rehabilitation of hydroelectric plants ● AEP to continue running the Community Energy Savers Program ● AEP to issue AMI installation vendor RFP for GridSMART Phase 2 ● Columbus Power develop specifications and prepare terms and conditions for Advanced
Metering Infrastructure ● Columbus Power to gather detailed proposals for Street Light Technology Conversion
from qualified teams ● All new street lights installed to be LED
Foundation Quarterly Report | Q2 2017
Fleet Q2 Activities:
● Complete contract with consultant to assist with fleet adoption ● Continue work with other regional governments/institutions to identify electric fleet
acquisition opportunities ● Complete contract with consultant to assist with fleet adoption ● Assist private entities with installing charging infrastructure ● Continue making contact with private fleet managers ● Assist private fleet managers with EV technical and safety training ● Assist private fleet managers with procurement specifications ● Complete contract with consultant to assist with fleet adoption ● Conduct existing market assessment and identify pertinent TSP contacts to conduct
informational meetings informing of potential options Consumer Adoption Q2 Activities (These activities are under consideration and will be updated once the recovery schedule is available).
● Conduct a literature review and/or landscape assessment as a baseline for the three strategies
● Determine and define appropriate inventory for the region to meet demand ● Determine goals for product availability ● Determine framework for consumer perception measurement throughout the program ● Identify key indicators, milestones and methods of measurement and tracking ● Develop an OEM/Dealership/Partner relationship map ● Assess the current availability of OEM models ● Conduct baseline consumer perception research ● Get dealership agreement for performance measurement of EV sales ● Publish report on baseline consumer perception in Columbus region ● Conduct audit on product availability in market ● Research best practices from other cities for used electric vehicles ● Cultivate pledges/partnerships with local dealership owners and OEM leadership ● Study best practices for dealer training; conduct landscape assessment ● Facilitate ongoing collaboration, commitment, and engagement among dealerships and
OEMs ● Negotiate group purchase rates for fleet and consumer purchases of new and used
vehicles ● Develop dealer recognition program to incentivize participation ● Cultivate pledges/partnerships with local dealership owners and OEM leadership ● Create a Communications/Outreach Plan and Communications Toolkit with Adoption
Team/OEM/Dealerships for new and used EVs ● Develop curriculum and training experience ● Determine how to assess and track success of Dealer Training Program
Foundation Quarterly Report | Q2 2017
● Speak to company executive leadership teams ● Identify employer representatives responsible for their workplace adoption campaigns ● Cultivate workplace pledges ● Expose Partnership Members to EVs at May Board Meeting ● Conduct strategy and do fabrication for Ride and Drive Roadshow ● Schedule dates for Ride and Drives for Q2 ● Create EV education component to Smart Columbus website ● Be opportunistic about integrating EV promotion into large scale events throughout City ● Continue discussions on Smart Columbus showroom ● Continue speaking to company executive leadership teams ● Continue identifying employer representatives responsible for their workplace adoption
campaigns ● Continue cultivating workplace pledges ● Give extended test drives to Columbus Partnership members ● Execute Ride and Drive Roadshow ● Schedule dates for Ride and Drives for Q3 ● Be opportunistic about integrating EV promotion into large scale events throughout City ● Launch pilot showroom in the form of gallery walks ● Continue discussions on Smart Columbus showroom ● Develop and distribute communications Toolkit materials to employer representatives ● Determine details and location of a Smart Columbus Showroom ● Determine feasibility of a free car give away campaign
Charging Q2 Activities:
● Continue recruiting developers/management companies for future installation sites ● Determine long term plan for MUD charging ● Develop marketing and outreach strategy to help developers engage and educate
tenants ● Develop appropriate signage templates and recommendations ● Continue development of partnerships with site hosts and secure commitments ● Complete legislation for changes needed for inclusion of EV charging infrastructure ● Finalize model site plans and specifications ● Develop clear and specific implementation plan ● Assure City processes and permits allow for workplace inclusion of EV charging
infrastructure ● Begin discussions with potential site hosts and identify workplace employee
representatives ● Develop clear and specific implementation plan for private workplace charging ports ● Assist private entities with site plans, charging specifications and construction ● Begin installation of charging ports ● Continue discussions with potential site hosts and secure commitments ● Provide facility managers with any needed training and assistance
Foundation Quarterly Report | Q2 2017
● Provide education materials and communications assistance to support efforts with employees
● Determine long term plan for workplace charging ● Continue developing plan for charging station installation for Columbus fleet ● Determine permits that will be required and process for homeowners ● Determine any zoning and parking code changes that may be needed ● Develop model site plan and specifications for installation of charging ports ● Develop City process for review and adoption of changes in building and zoning codes,
including legislative review
Weekly Reporting Record
Documents for the Foundation program were formally submitted on the following dates:
● April 6, 13 & 20
● May 4, 11, 18 & 25
● June 1, 8, 15, 22 & 29
Program Risk Related Activities
● The current Risk Register is located at section 3 of this document
Playbook Development Progress
The intent of the playbook is to identify processes and lessons learned to assist with knowledge
transfer across all priorities. A Playbook will be provided for the Quarter 2 report per the
agreement; however a draft is being provided this quarter for comment.
Click the link below to view the Look Book examples:
Smart City Electrification Playbook
Vulcan Playbook Resources:
https://www.columbus.gov/SmartColumbus/VulcanPlaybookResources
Foundation Quarterly Report | Q2 2017
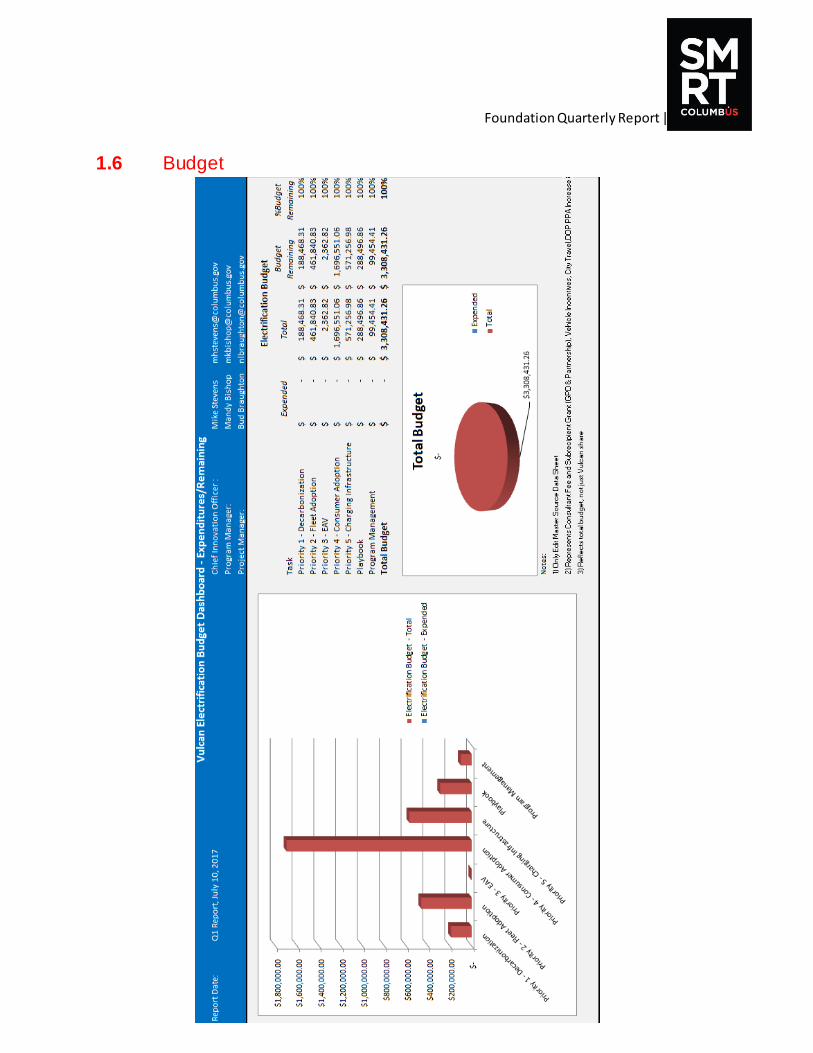
1.6 Budget
Foundation Quarterly Report | Q2 2017
1.7 Media Relations
Smart Columbus Electric Vehicle Charging Expo
Link: http://www.bizjournals.com/columbus/news/2017/04/13/columbus-holding-electric-vehicle-
charging-expo-as.html
AEP to provide $10,000 discount for a Nissan Leaf for customers in AEP Ohio territory
Link: http://www.bizjournals.com/columbus/news/2017/05/24/customers-in-aep-ohio-territory-
can-get-10-000-off.html
City Council has approved spending $3.3 million to implement the Smart Columbus Electrification Plan Link: http://www.dispatch.com/news/20170522/council-funds-police-video-storage-and-smart-columbus-electrification Columbus CEO about Smart Columbus:
Link: Smart Columbus: Who’s Making it Happen and How?
Link: Smart Columbus: How Can Your Business Get Involved?
Link: Smart Columbus: What Does it Mean for Mobility?
Electric School Bus Tour with Charged Up Midwest
Link: http://www.dispatch.com/news/20170623/all-electric-bus-touted-as-healthier-for-kids-
better-for-environment
Ohio State senior projects support Smart Columbus mission
Link: https://news.osu.edu/news/2017/04/19/ohio-state-senior-projects-support-smart-columbus-
mission/
Foundation Quarterly Report | Q2 2017
All Electric Hopper Carts Start Offering Free Rides
Link: http://radio.wosu.org/post/all-electric-hopper-carts-start-offering-free-rides-short-north
Honda plans cars with increasing levels of self-driving capabilities
Link: http://www.dispatch.com/news/20170608/honda-plans-cars-with-increasing-levels-of-self-
driving-capability
Smart Columbus: How Can your Business Get Involved?
Link: http://www.columbusceo.com/business/20170602/smart-columbus-how-can-your-
business-get-involved
Columbus’ Smart City initiative has entrepreneurs knocking on the door looking to make their
mark
Link: https://www.bizjournals.com/columbus/news/2017/06/09/columbus-smart-city-initiative-
has-entrepreneurs.html?ana=RSS%26s=article_search
Ohio to play key role in driverless cars
Link: http://www.springfieldnewssun.com/business/economy/ohio-play-key-role-driverless-cars-
transportation-research/ADzMvH2BdkoFeQjPJfyg4O/
1.8 Public Policy
The Columbus Partnership has worked closely with the Governor’s office, the administration
and legislature and provided updates on progress made.
The Partnership hosted an economic development briefing in March where 17 members
of the central Ohio legislative delegation came together to discuss economic
development in the region with Smart Columbus as a featured topic.
Foundation Quarterly Report | Q2 2017
Governor Kasich mentioned Smart Columbus in his State of the State Address on April
4th.
Vital input on certain policies was provided to retain inclusion of Smart Columbus related
initiatives in the state’s transportation budget. Those considerations include:
An amendment to allocate $30 million of Volkswagen settlement dollars for public transit,
which would have hampered our ability to obtain funding in the first two years of the
project to deploy required charging infrastructure.
Discussions by local and county leaders to generate revenue by taxing CNG and electric
vehicles. Discussion involved a highway funding and study committee, which will be
handled by the Ways and Means committee in the Senate. The smart Columbus policy
team is working to provide input about the early stage market EVs are in and how they
can use the study committee to look at creating thresholds as the markets grow.
With advisement from the Smart Columbus policy team, Governor Kasich vetoed a bill
on March 31, 2017, that would have slowed down funding efforts for the project.
Creation and activation of a Smart Columbus Policy Committee
Four meetings have been held with policy committee members including City, County,
Partnership, OSU, Nationwide, AEP and Columbus chamber of Commerce
representatives. Joining upcoming Committee meetings will be the Mid-Ohio Regional
Planning Commission (MORPC) and Clean Fuels Ohio.
It is important to engage elected officials and policy makers in conversation about electric
vehicles and smart mobility in order to ensure the legislators make informed policy decisions
that support the Smart Columbus program. Federal support of Smart Columbus initiatives from
the Ohio Delegation has been encouraging.
Articles addressing Ohio policy updates
John Kasich Signs Transportation Budget:
http://governor.ohio.gov/MediaRoom/PressReleases
Sherrod Brown introduced legislation to help Ohio Employers Provide Next-Generation
Transportation Benefits for Employees Driving EVs:
https://www.brown.senate.gov/newsroom/press/release/brown
The Partnership hosted a dozen senior staff members from the PUCO for a private briefing,
Foundation Quarterly Report | Q2 2017
Smart Columbus Live session where we discussed the future of electric mobility and the role of
charging infrastructure and grid modernization in supporting the rapid growth of this technology.
Section 2: INDICATOR STATUS TABLES
This section includes activities scheduled to take place during Quarter 1, April to June 2017,
but some activities have already been initiated by the Smart Columbus Program.
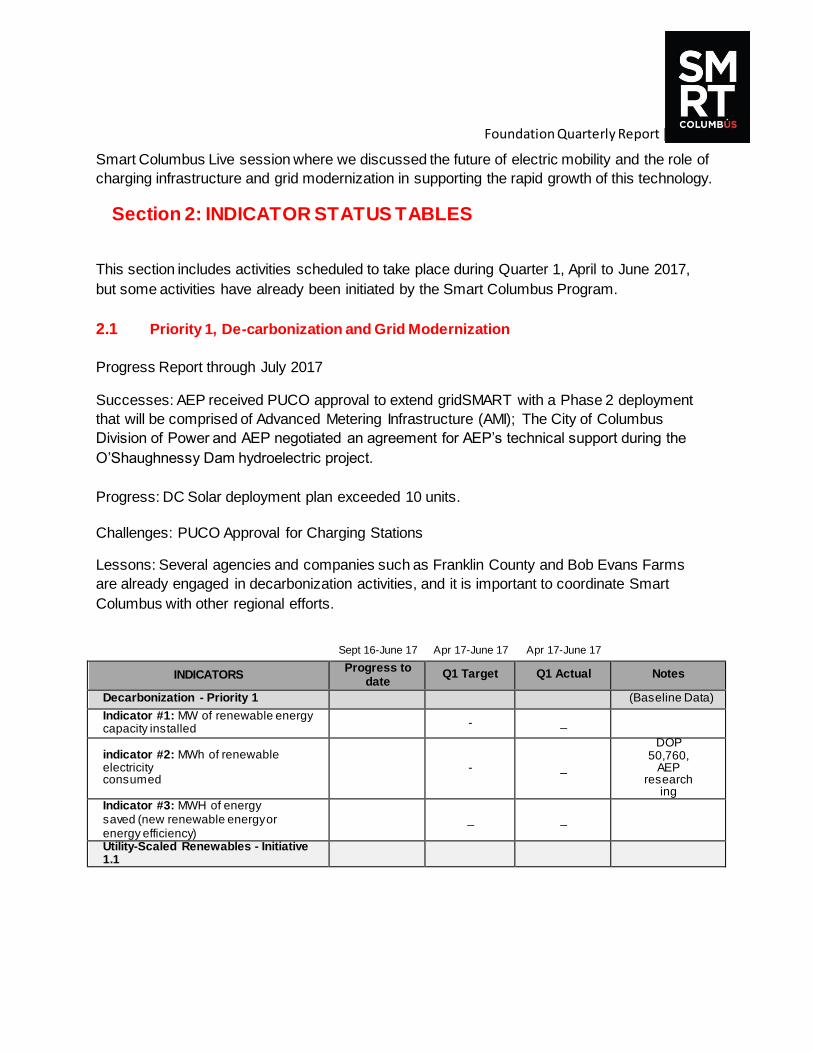
2.1 Priority 1, De-carbonization and Grid Modernization
Progress Report through July 2017
Successes: AEP received PUCO approval to extend gridSMART with a Phase 2 deployment
that will be comprised of Advanced Metering Infrastructure (AMI); The City of Columbus
Division of Power and AEP negotiated an agreement for AEP’s technical support during the
O’Shaughnessy Dam hydroelectric project.
Progress: DC Solar deployment plan exceeded 10 units.
Challenges: PUCO Approval for Charging Stations
Lessons: Several agencies and companies such as Franklin County and Bob Evans Farms
are already engaged in decarbonization activities, and it is important to coordinate Smart
Columbus with other regional efforts.
Sept 16-June 17 Apr 17-June 17 Apr 17-June 17
INDICATORS Progress to
date Q1 Target Q1 Actual Notes
Decarbonization - Priority 1 (Baseline Data)
Indicator #1: MW of renewable energy capacity installed
- _
indicator #2: MWh of renewable electricity consumed
- _
DOP 50,760,
AEP research
ing Indicator #3: MWH of energy saved (new renewable energy or energy efficiency)
_ _
Utility-Scaled Renewables - Initiative 1.1
Foundation Quarterly Report | Q2 2017
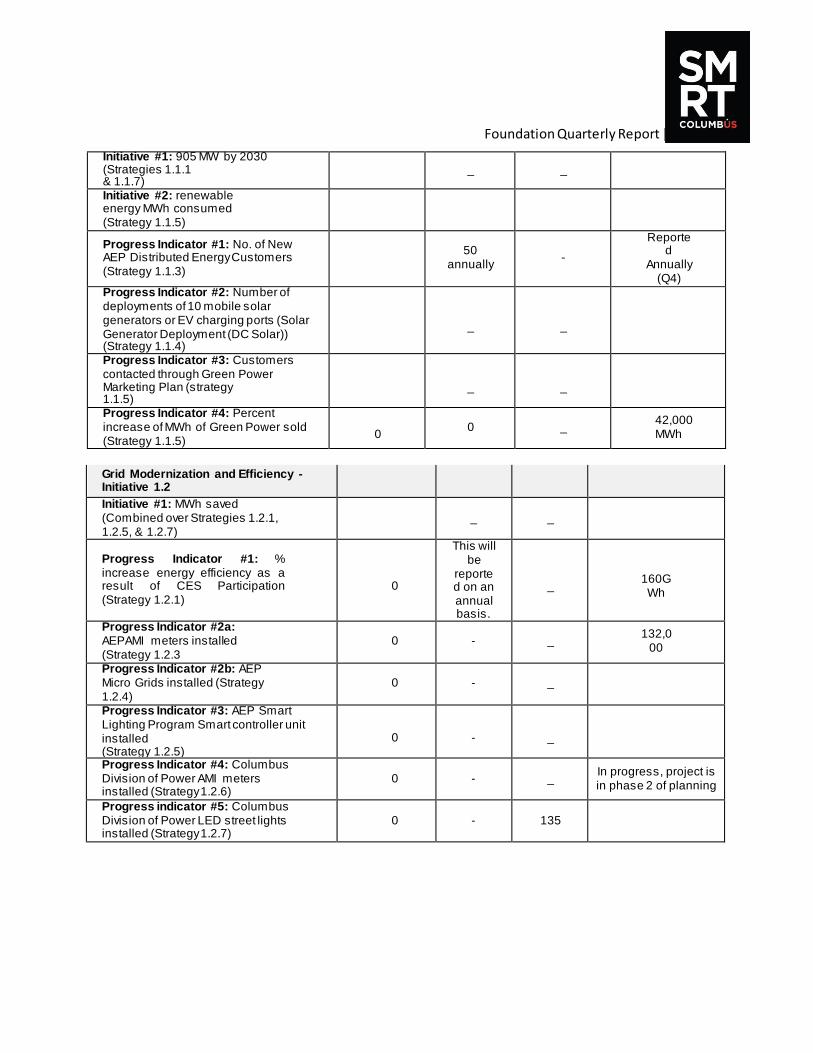
Initiative #1: 905 MW by 2030 (Strategies 1.1.1 & 1.1.7)
_ _
Initiative #2: renewable energy MWh consumed (Strategy 1.1.5)
Progress Indicator #1: No. of New AEP Distributed Energy Customers (Strategy 1.1.3)
50
annually -
Reported
Annually (Q4)
Progress Indicator #2: Number of deployments of 10 mobile solar generators or EV charging ports (Solar Generator Deployment (DC Solar)) (Strategy 1.1.4)
_
_
Progress Indicator #3: Customers contacted through Green Power Marketing Plan (strategy 1.1.5)
_
_
Progress Indicator #4: Percent increase of MWh of Green Power sold (Strategy 1.1.5)
0
0 _ 42,000 MWh
Grid Modernization and Efficiency - Initiative 1.2
Initiative #1: MWh saved (Combined over Strategies 1.2.1, 1.2.5, & 1.2.7)
_ _
Progress Indicator #1: % increase energy efficiency as a result of CES Participation (Strategy 1.2.1)
0
This will be
reported on an annual basis.
_
160GWh
Progress Indicator #2a: AEPAMI meters installed (Strategy 1.2.3
0 - _ 132,0
00
Progress Indicator #2b: AEP Micro Grids installed (Strategy 1.2.4)
0 - _
Progress Indicator #3: AEP Smart Lighting Program Smart controller unit installed (Strategy 1.2.5)
0
-
_
Progress Indicator #4: Columbus Division of Power AMI meters installed (Strategy 1.2.6)
0 - _ In progress, project is in phase 2 of planning
Progress indicator #5: Columbus Division of Power LED street lights installed (Strategy 1.2.7)
0 - 135
Foundation Quarterly Report | Q2 2017
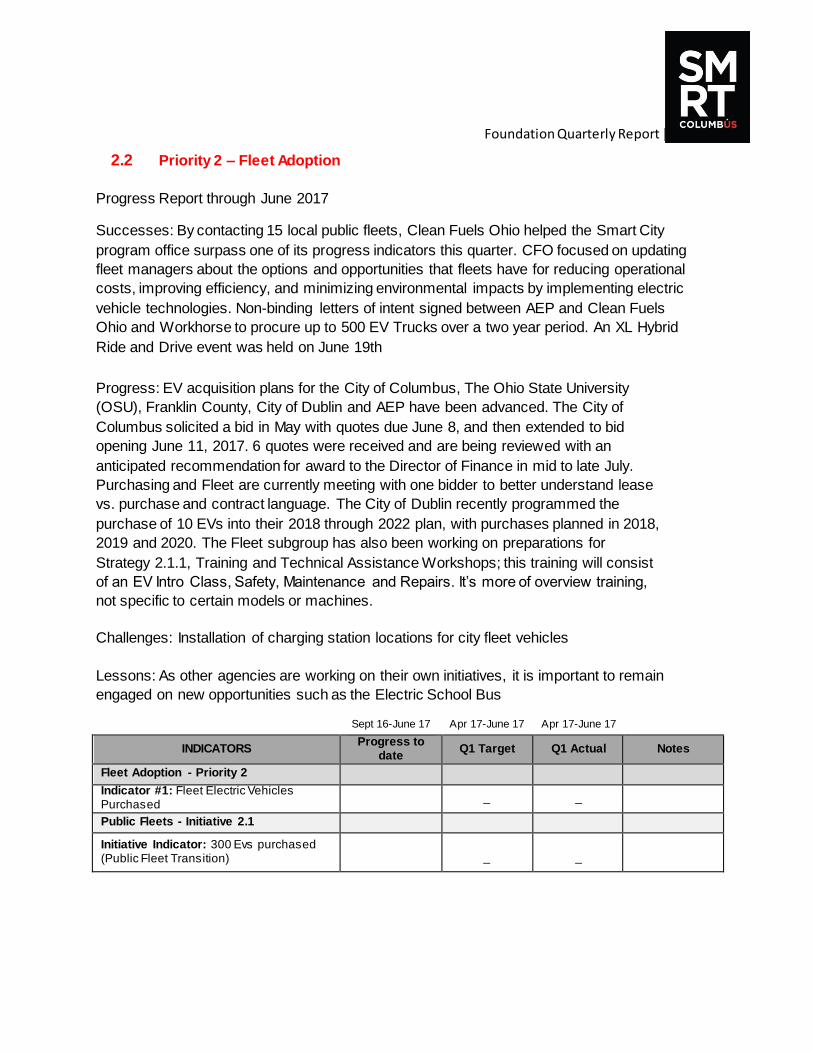
2.2 Priority 2 – Fleet Adoption
Progress Report through June 2017
Successes: By contacting 15 local public fleets, Clean Fuels Ohio helped the Smart City
program office surpass one of its progress indicators this quarter. CFO focused on updating
fleet managers about the options and opportunities that fleets have for reducing operational
costs, improving efficiency, and minimizing environmental impacts by implementing electric
vehicle technologies. Non-binding letters of intent signed between AEP and Clean Fuels
Ohio and Workhorse to procure up to 500 EV Trucks over a two year period. An XL Hybrid
Ride and Drive event was held on June 19th
Progress: EV acquisition plans for the City of Columbus, The Ohio State University
(OSU), Franklin County, City of Dublin and AEP have been advanced. The City of
Columbus solicited a bid in May with quotes due June 8, and then extended to bid
opening June 11, 2017. 6 quotes were received and are being reviewed with an
anticipated recommendation for award to the Director of Finance in mid to late July.
Purchasing and Fleet are currently meeting with one bidder to better understand lease
vs. purchase and contract language. The City of Dublin recently programmed the
purchase of 10 EVs into their 2018 through 2022 plan, with purchases planned in 2018,
2019 and 2020. The Fleet subgroup has also been working on preparations for
Strategy 2.1.1, Training and Technical Assistance Workshops; this training will consist
of an EV Intro Class, Safety, Maintenance and Repairs. It’s more of overview training,
not specific to certain models or machines.
Challenges: Installation of charging station locations for city fleet vehicles
Lessons: As other agencies are working on their own initiatives, it is important to remain
engaged on new opportunities such as the Electric School Bus
Sept 16-June 17 Apr 17-June 17 Apr 17-June 17
INDICATORS Progress to
date Q1 Target Q1 Actual Notes
Fleet Adoption - Priority 2
Indicator #1: Fleet Electric Vehicles Purchased _ _
Public Fleets - Initiative 2.1
Initiative Indicator: 300 Evs purchased (Public Fleet Transition)
_
_
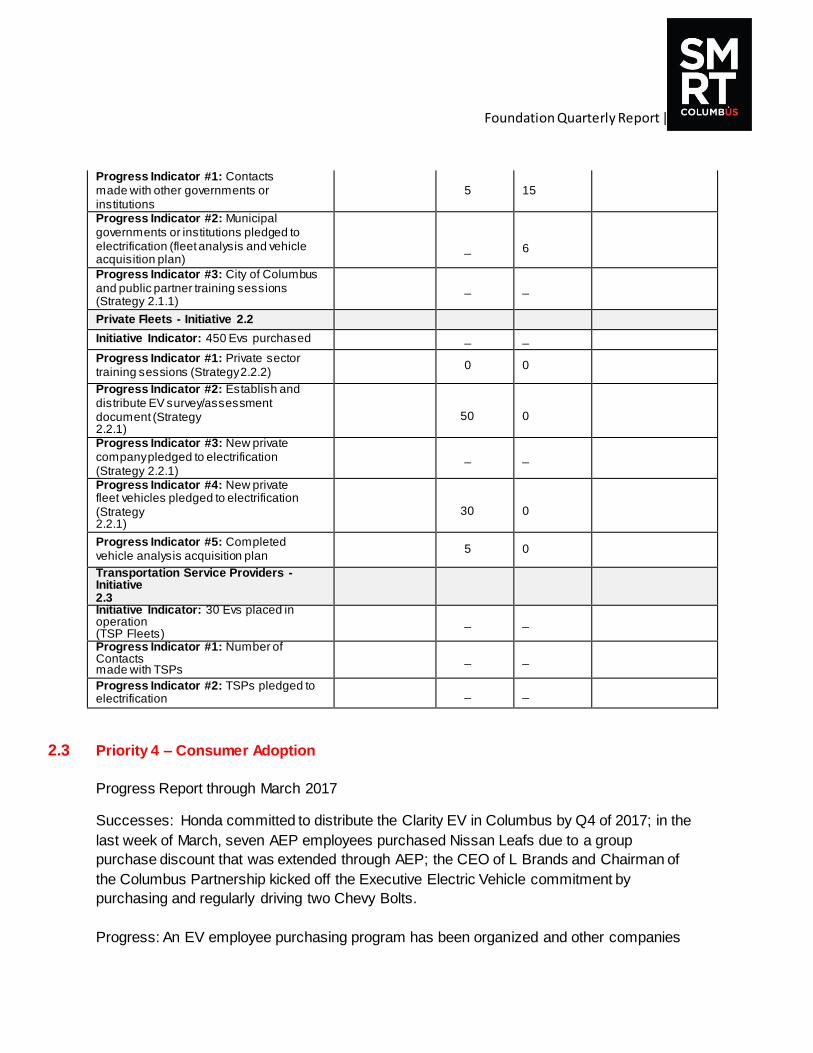
Foundation Quarterly Report | Q2 2017
Progress Indicator #1: Contacts made with other governments or institutions
5 15
Progress Indicator #2: Municipal governments or institutions pledged to electrification (fleet analysis and vehicle acquisition plan)
_
6
Progress Indicator #3: City of Columbus and public partner training sessions (Strategy 2.1.1)
_ _
Private Fleets - Initiative 2.2
Initiative Indicator: 450 Evs purchased _ _
Progress Indicator #1: Private sector training sessions (Strategy 2.2.2)
0 0
Progress Indicator #2: Establish and distribute EV survey/assessment document (Strategy 2.2.1)
50 0
Progress Indicator #3: New private company pledged to electrification (Strategy 2.2.1)
_ _
Progress Indicator #4: New private fleet vehicles pledged to electrification (Strategy 2.2.1)
30 0
Progress Indicator #5: Completed vehicle analysis acquisition plan
5 0
Transportation Service Providers - Initiative 2.3
Initiative Indicator: 30 Evs placed in operation (TSP Fleets)
_ _
Progress Indicator #1: Number of Contacts made with TSPs
_ _
Progress Indicator #2: TSPs pledged to electrification
_ _
2.3 Priority 4 – Consumer Adoption
Progress Report through March 2017
Successes: Honda committed to distribute the Clarity EV in Columbus by Q4 of 2017; in the
last week of March, seven AEP employees purchased Nissan Leafs due to a group
purchase discount that was extended through AEP; the CEO of L Brands and Chairman of
the Columbus Partnership kicked off the Executive Electric Vehicle commitment by
purchasing and regularly driving two Chevy Bolts.
Progress: An EV employee purchasing program has been organized and other companies
Foundation Quarterly Report | Q2 2017
will be challenged to do the same; three automakers are being actively engaged for deep
commitments to the program, including Honda, Ford and Daimler.
Challenges: Fully executed agreements not yet in place
Lessons: Partnerships with OEMs, local dealers, and utility companies require time and
attention to nurture and secure; Companies and employers are eager to engage with Smart
Columbus; there are key areas where charging is needed throughout the community and
there might be a need for additional trained electricians to install residential charging
stations.
EV Adoption According to Vehicle Registration Records
Columbus region registration data is reflected in the tables below from the periods beginning in
2014 through April 2017.
2014 and 2015 registration data was obtained through summary information from IIHS Polk
aggregated at the National Renewable Energy Lab based on Polk Subscription data.
2016 vehicle registration data was also obtained through IIHS Polk, but the base data set were
more detailed, quarterly statistics were aggregated from monthly queries of fuel type and model
years.
2017 vehicle registration data (Jan through April) was obtained through specific Polk data
acquisition by Smart Columbus, aggregated into monthly totals for PHEV and BEV against all
registrations.
The data shared in the table below is the percent of new vehicle sales (meaning ‘new vehicles’
entering the overall fleet) based on registration data.
Foundation Quarterly Report | Q2 2017
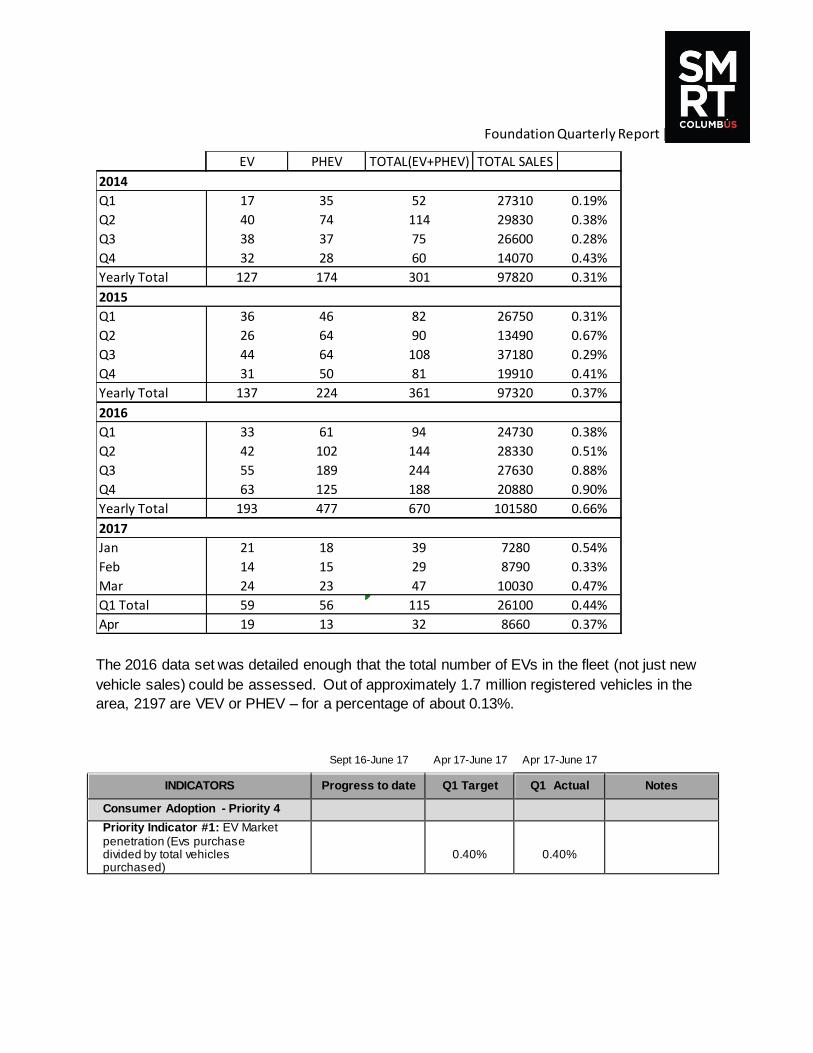
The 2016 data set was detailed enough that the total number of EVs in the fleet (not just new
vehicle sales) could be assessed. Out of approximately 1.7 million registered vehicles in the
area, 2197 are VEV or PHEV – for a percentage of about 0.13%.
Sept 16-June 17 Apr 17-June 17 Apr 17-June 17
INDICATORS Progress to date Q1 Target Q1 Actual Notes
Consumer Adoption - Priority 4
Priority Indicator #1: EV Market penetration (Evs purchase divided by total vehicles purchased)
0.40%
0.40%
EV PHEV TOTAL(EV+PHEV) TOTAL SALES
2014
Q1 17 35 52 27310 0.19%
Q2 40 74 114 29830 0.38%
Q3 38 37 75 26600 0.28%
Q4 32 28 60 14070 0.43%
Yearly Total 127 174 301 97820 0.31%
2015
Q1 36 46 82 26750 0.31%
Q2 26 64 90 13490 0.67%
Q3 44 64 108 37180 0.29%
Q4 31 50 81 19910 0.41%
Yearly Total 137 224 361 97320 0.37%
2016
Q1 33 61 94 24730 0.38%
Q2 42 102 144 28330 0.51%
Q3 55 189 244 27630 0.88%
Q4 63 125 188 20880 0.90%
Yearly Total 193 477 670 101580 0.66%
2017
Jan 21 18 39 7280 0.54%
Feb 14 15 29 8790 0.33%
Mar 24 23 47 10030 0.47%
Q1 Total 59 56 115 26100 0.44%
Apr 19 13 32 8660 0.37%
Foundation Quarterly Report | Q2 2017
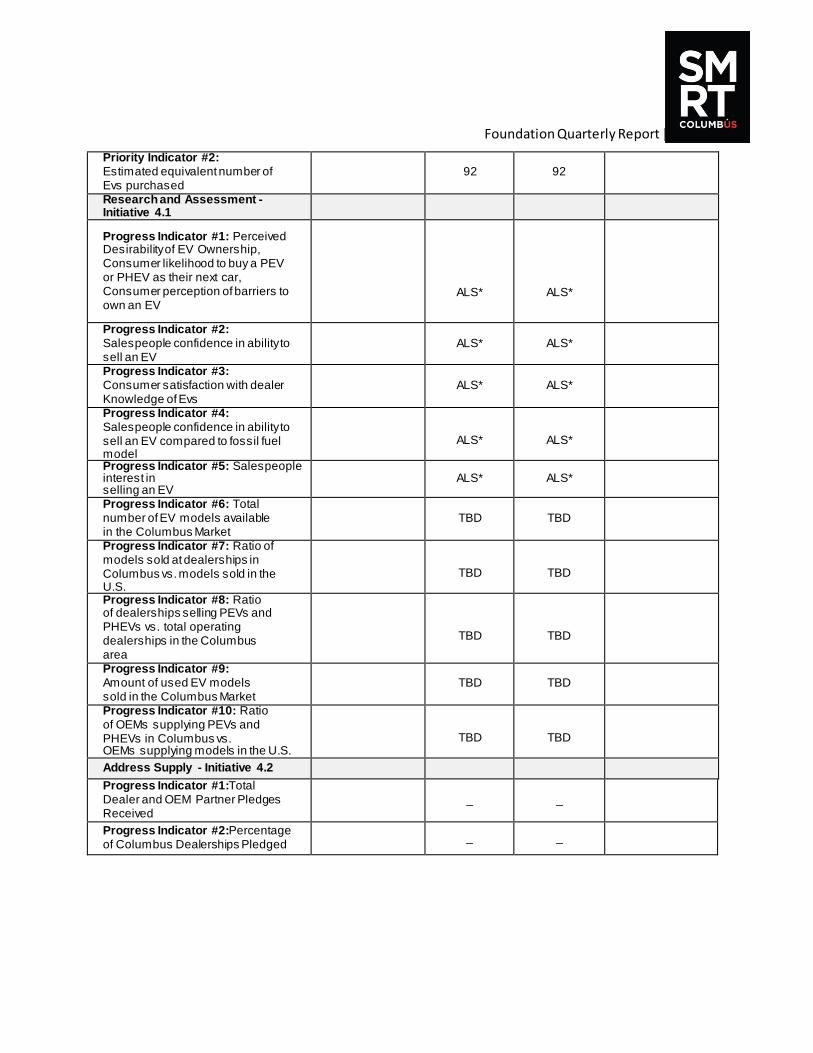
Priority Indicator #2: Estimated equivalent number of Evs purchased
92 92
Research and Assessment - Initiative 4.1
Progress Indicator #1: Perceived Desirability of EV Ownership, Consumer likelihood to buy a PEV or PHEV as their next car, Consumer perception of barriers to own an EV
ALS*
ALS*
Progress Indicator #2: Salespeople confidence in ability to sell an EV
ALS* ALS*
Progress Indicator #3: Consumer satisfaction with dealer Knowledge of Evs
ALS* ALS*
Progress Indicator #4: Salespeople confidence in ability to sell an EV compared to fossil fuel model
ALS*
ALS*
Progress Indicator #5: Salespeople interest in selling an EV
ALS* ALS*
Progress Indicator #6: Total number of EV models available in the Columbus Market
TBD TBD
Progress Indicator #7: Ratio of models sold at dealerships in Columbus vs. models sold in the U.S.
TBD
TBD
Progress Indicator #8: Ratio of dealerships selling PEVs and PHEVs vs. total operating dealerships in the Columbus area
TBD
TBD
Progress Indicator #9: Amount of used EV models sold in the Columbus Market
TBD TBD
Progress Indicator #10: Ratio of OEMs supplying PEVs and PHEVs in Columbus vs. OEMs supplying models in the U.S.
TBD
TBD
Address Supply - Initiative 4.2
Progress Indicator #1:Total Dealer and OEM Partner Pledges Received
_ _
Progress Indicator #2:Percentage of Columbus Dealerships Pledged
_ _
Foundation Quarterly Report | Q2 2017
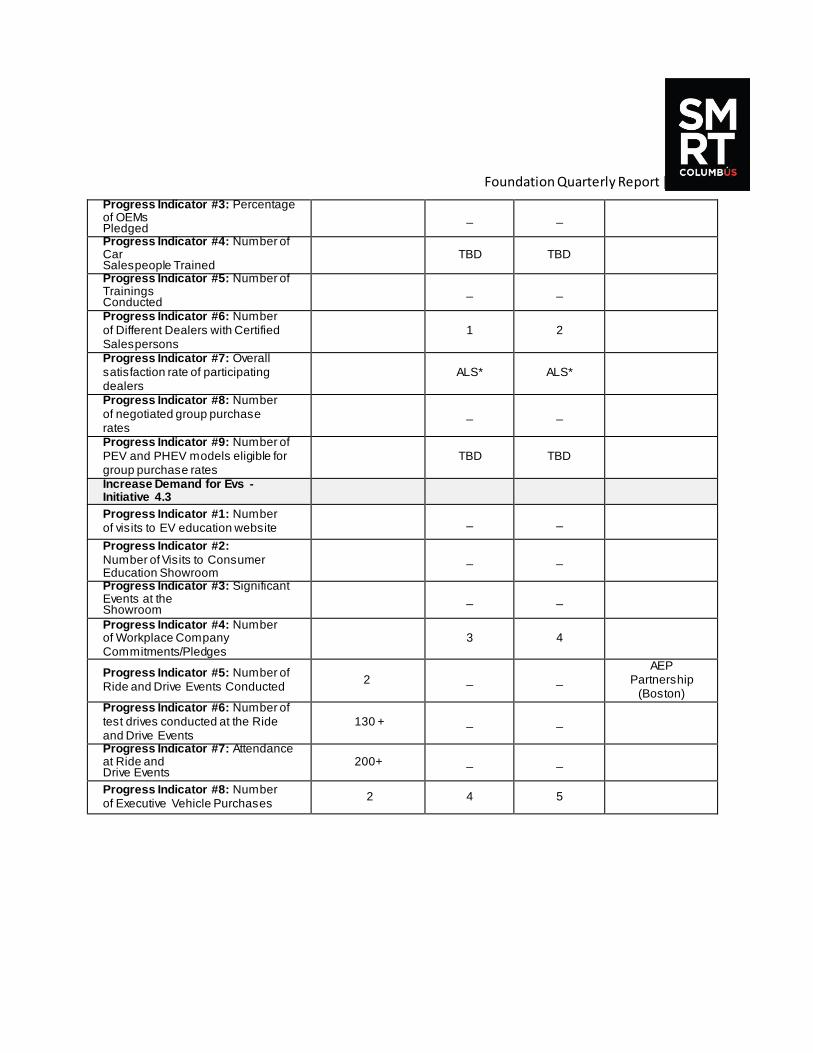
Progress Indicator #3: Percentage of OEMs Pledged
_ _
Progress Indicator #4: Number of Car Salespeople Trained
TBD TBD
Progress Indicator #5: Number of Trainings Conducted
_ _
Progress Indicator #6: Number of Different Dealers with Certified Salespersons
1 2
Progress Indicator #7: Overall satisfaction rate of participating dealers
ALS* ALS*
Progress Indicator #8: Number of negotiated group purchase rates
_ _
Progress Indicator #9: Number of PEV and PHEV models eligible for group purchase rates
TBD TBD
Increase Demand for Evs - Initiative 4.3
Progress Indicator #1: Number of visits to EV education website
_ _
Progress Indicator #2: Number of Visits to Consumer Education Showroom
_ _
Progress Indicator #3: Significant Events at the Showroom
_ _
Progress Indicator #4: Number of Workplace Company Commitments/Pledges
3 4
Progress Indicator #5: Number of Ride and Drive Events Conducted
2 _ _ AEP
Partnership (Boston)
Progress Indicator #6: Number of test drives conducted at the Ride and Drive Events
130 + _ _
Progress Indicator #7: Attendance at Ride and Drive Events
200+ _ _
Progress Indicator #8: Number of Executive Vehicle Purchases
2 4 5
Foundation Quarterly Report | Q2 2017
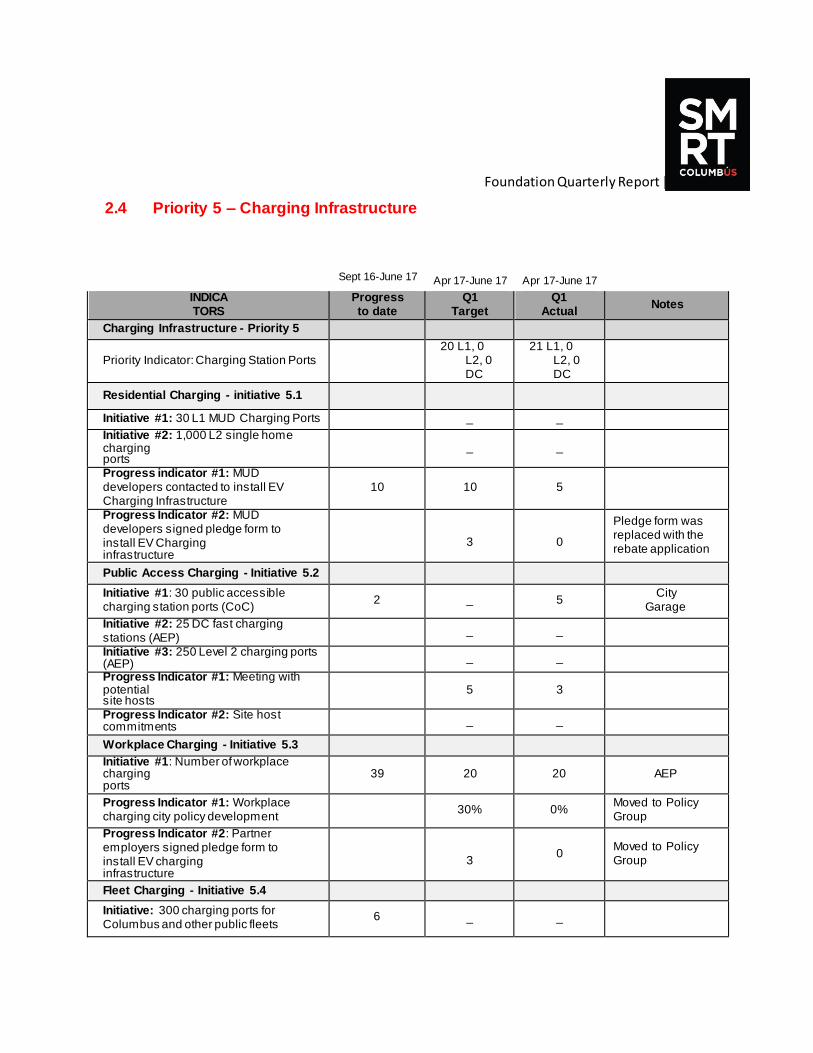
2.4 Priority 5 – Charging Infrastructure
Sept 16-June 17 Apr 17-June 17 Apr 17-June 17
INDICATORS
Progress to date
Q1 Target
Q1 Actual
Notes
Charging Infrastructure - Priority 5
Priority Indicator: Charging Station Ports 20 L1, 0
L2, 0 DC
21 L1, 0 L2, 0 DC
Residential Charging - initiative 5.1
Initiative #1: 30 L1 MUD Charging Ports _ _
Initiative #2: 1,000 L2 single home charging ports
_ _
Progress indicator #1: MUD developers contacted to install EV Charging Infrastructure
10 10 5
Progress Indicator #2: MUD developers signed pledge form to install EV Charging infrastructure
3
0
Pledge form was replaced with the rebate application
Public Access Charging - Initiative 5.2
Initiative #1: 30 public accessible charging station ports (CoC)
2 _ 5 City
Garage
Initiative #2: 25 DC fast charging stations (AEP)
_ _
Initiative #3: 250 Level 2 charging ports (AEP)
_ _
Progress Indicator #1: Meeting with potential site hosts
5 3
Progress Indicator #2: Site host commitments
_ _
Workplace Charging - Initiative 5.3
Initiative #1: Number of workplace charging ports
39 20 20 AEP
Progress Indicator #1: Workplace charging city policy development
30% 0% Moved to Policy Group
Progress Indicator #2: Partner employers signed pledge form to install EV charging infrastructure
3 0
Moved to Policy Group
Fleet Charging - Initiative 5.4
Initiative: 300 charging ports for Columbus and other public fleets
6 _ _
Foundation Quarterly Report | Q2 2017
Building and Zoning Changes to Support EV Charging - Initiative 5.5
Progress Indicator: Site plan cases submitted for permit
3 1 AEP
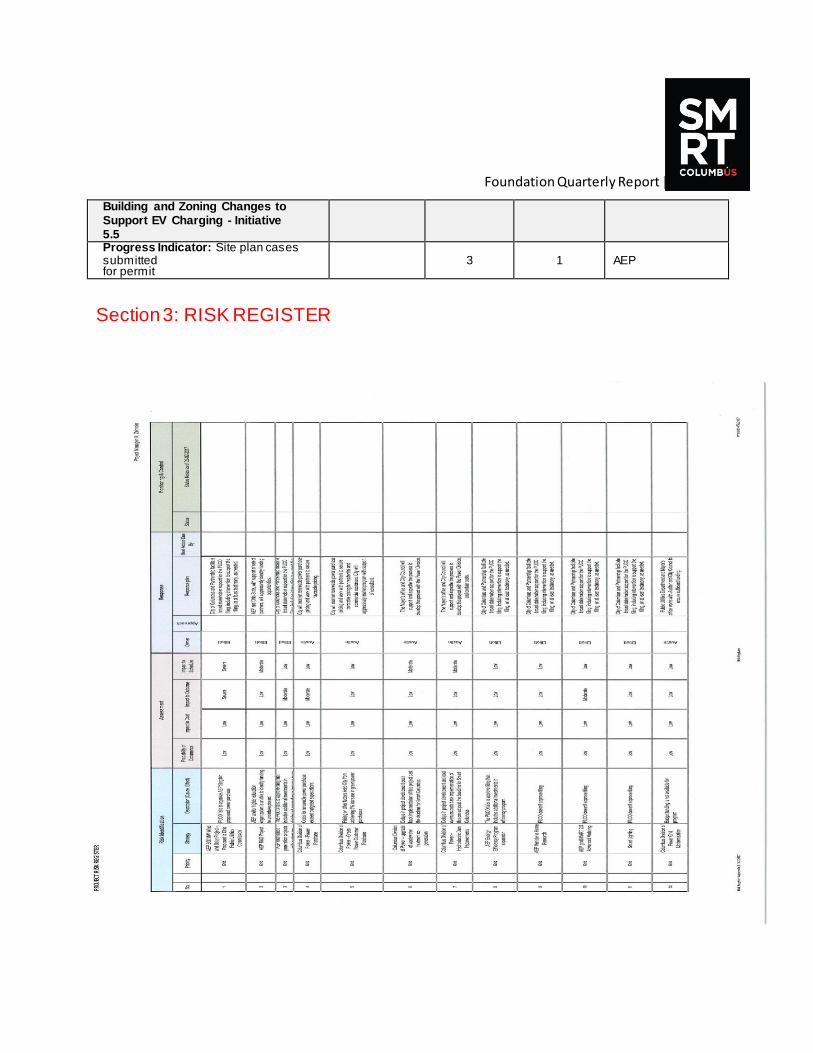
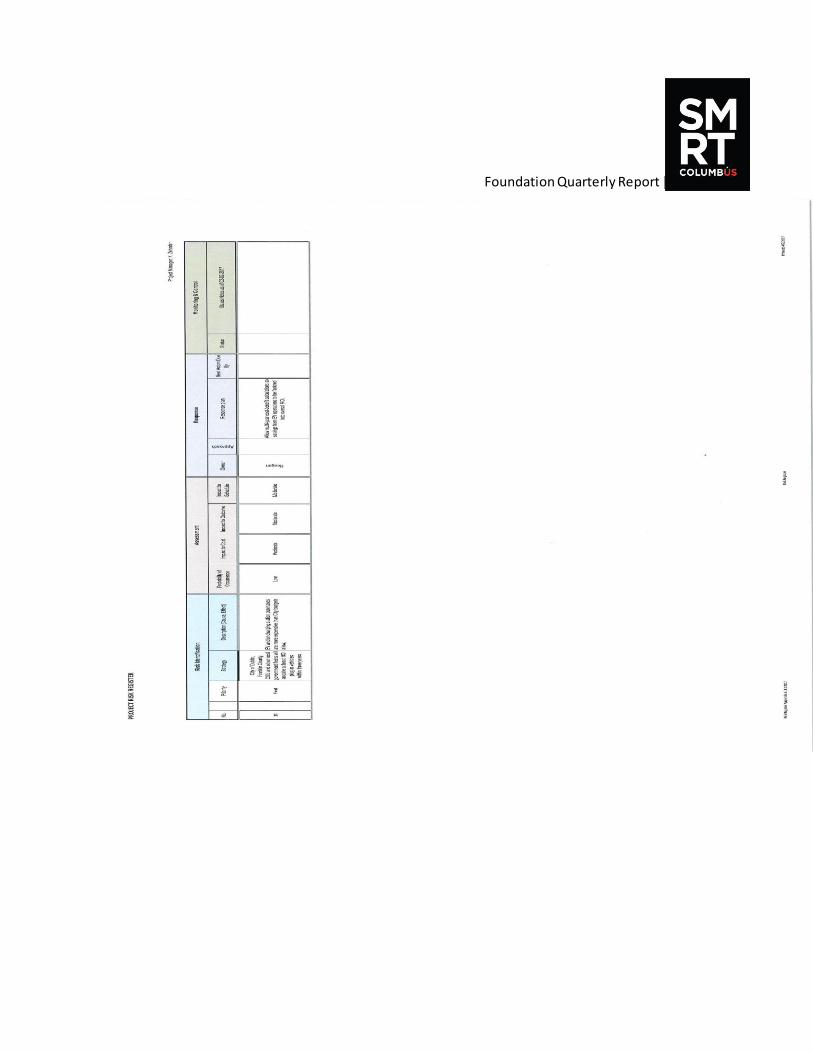
Section 3: RISK REGISTER

Foundation Quarterly Report | Q2 2017
Foundation Quarterly Report | Q2 2017
Foundation Quarterly Report | Q2 2017
Section 4: PERFORMANCE METRICS PLAN
PERFORMANCE METRICS PLAN - Version 1.2 July 10, 2017 This performance metrics plan (PMP) supports the Smart Columbus Electrification Project
(SCEP), providing traceability, verification, and responsibility of the targeted goals that support
the implementation of the SCEP initiatives. This includes overall project goals, performance
indicators for projects, priorities and initiatives, and other indicators of progress along the way.
As the ultimate goal of the SCEP enabled by the Vulcan grant is de-carbonization, wherever
feasible the indicators are further extended to estimates of green-house-gas (GHG) reduction at
the overall project level. This PMP is organized consistent with the five primary project priorities
and their related initiatives as conveyed by the SCEP agreement with Vulcan.
Overall Performance Metrics Plan Objectives, Principles, and Organization
1.0 Objectives
The objective of this performance metrics plan (PMP) is to layout a framework for the reporting
of quantitative progress towards accomplishing of the objectives of the SCEPs, the identification
and collection of various data sets, and the methodologies to process the data into performance
metrics that support the execution, analysis, and reporting of performance indicators at all levels
along the way. It serves as a resource for the various stake holders involved in carrying out the
SCEP to be informed of the required reporting and to provide the required data that supports
documenting the accomplishments of program. The plan encompasses the goals, performance
indicators, and trackable initiatives to be quantitatively reported, the requirements of the data
the will be collected to support the reporting, and the processing of the data to create effective
performance measure indicating attainment of goas and the ultimate GHG reduction to validate
the success of the Vulcan grant program.
To the extent possible and within the financial resources of the contract, it is the intent of SCEP
to validate the performance indicators based on primary data, that is data directly observed or
collected as part of the SCEP program activities. There are instances where secondary data
sources (such as published national or regional averages) will need to be utilized because direct
observations are infeasible or cost prohibitive. One such example of secondary data is the
utilization of EVs adopted by consumers in which published averages of consumer vehicle miles
traveled on an annual basis will be used in the calculation of GHG benefits. Even in such
situations, indirect data can be complimented (or validated) with surveys of the population.
However, it is the goal to use primary data for the majority of the program, ensuring that
appropriate data collection and reporting are incorporated from the beginning.
1.1 Principles and Framework
This PMP is developed concurrently with the USDOT Smart City award which concentrates on
the deployment of connected and automated vehicles and transportation infrastructure to
increase mobility, increase safety, reduce energy and GHG emissions, and enhance quality of
Foundation Quarterly Report | Q2 2017
life, particularly with respect to underserved communities. The principles of the SCEP PMP
merges with the overall USDOT data management plan (DMP) governing the larger Smart
Columbus project. The data from the SCEP PMP will be part of the Integrated Data Exchange
(IDE) as outlined in the USDOT data management plan (DMP) which emphasizes open data,
data sharing, and an agile approach to developing software to support the program objectives.
Data items collected to support SCEP PMP will be integrated into the USDOT funded Columbus
IDE for reuse, sharing, curation, and application development.
1.2 Roles/responsibilities
The Smart Columbus Program Management Office (PMO) will be the central coordinator with
respect to the collection, analysis, and dissemination of performance metrics and reporting
described herein, and will fall under the responsibility of the PMO performance measures
coordinator. It will be the responsibility of the PMO performance measures coordinator to insure
that all partners are cognizant of the PMP, that all participants assess performance in conformity
with the PMP, and that the PMP satisfies the needs of the projects, participants and sponsors.
As such, the PMP will be revised from time to time, such that is responsive to the needs of the
SCEP as it evolves through implementation and feedback. It is also the responsibility of the
SCEP performance measures coordinator to monitor the adequacy of the plan, and suggest
revisions and extensions in collaboration with the PMO, Vulcan, project partners, and supporting
working groups.
The PMO performance measures coordinator will provide templates and guidelines as
appropriate to guide the multiple stakeholders in submitting data. It will be the responsibility of
the performance measures coordinator to insure the appropriate descriptors (meta-data) is
available, and consistent formats are used across initiatives.
1.3 Sharing, preservation and protection SCEP will rely on the framework of the Integrated Data Exchange (IDE) in co-development
under the USDOT concurrent Smart City grant award. The IDE will provide the sharing,
preservation and protection architecture.
1.4 Terminology Performance indicators are addressed at three levels: the overall project level, the five project
priorities (grid de-carbonization, EV fleet adoption, Transit, Autonomous and Multi-Modal
Systems in the City, EV consumer adoption, and EV charging infrastructure), and the specific
initiatives under each priority area.
Project, priority, and initiative indicators are provided and are hierarchical. Priority indicators
contribute directly to a project indicator, and similarly initiative indicators contribute directly to
one of their respective priority indicators. Progress indicators are also defined. Progress
indicators encompass anything that can be numerically evaluated and reflects progress towards
objectives, but does not contribute directly to either higher level indicators. Examples of project,
priority, initiative and progress indicators are provided below.
Category #1: Project Indicators
Foundation Quarterly Report | Q2 2017
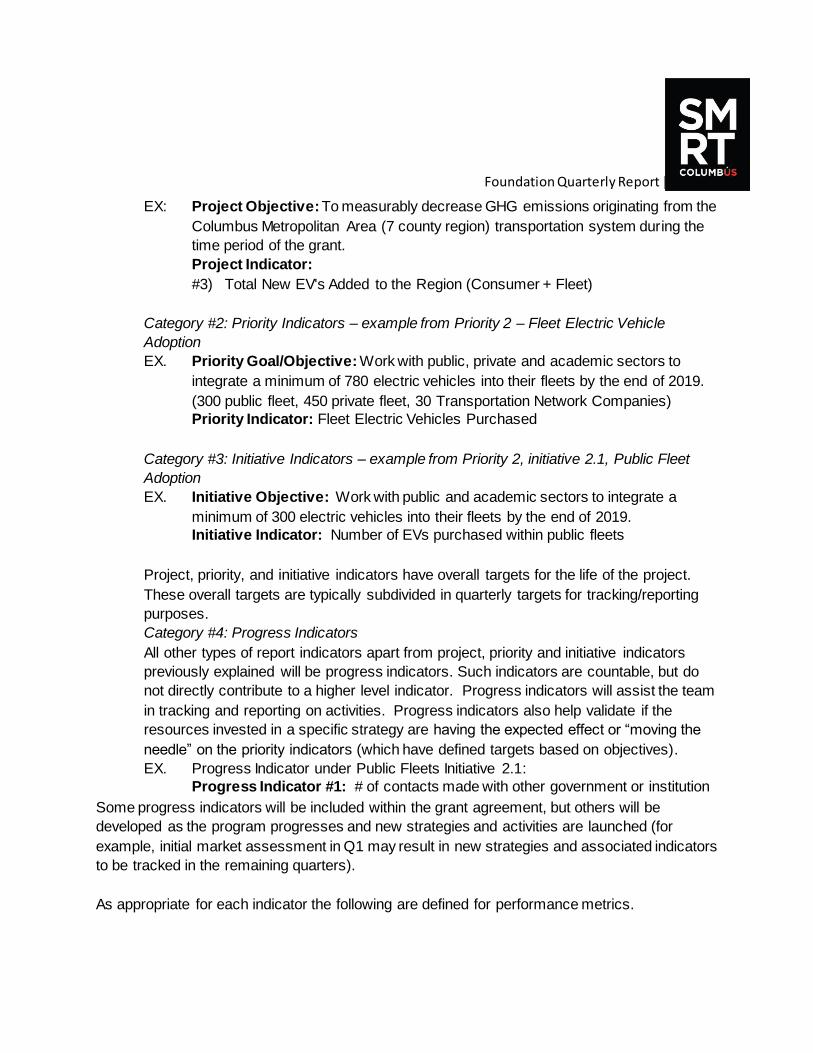
EX: Project Objective: To measurably decrease GHG emissions originating from the
Columbus Metropolitan Area (7 county region) transportation system during the
time period of the grant.
Project Indicator:
#3) Total New EV's Added to the Region (Consumer + Fleet)
Category #2: Priority Indicators – example from Priority 2 – Fleet Electric Vehicle
Adoption
EX. Priority Goal/Objective: Work with public, private and academic sectors to
integrate a minimum of 780 electric vehicles into their fleets by the end of 2019.
(300 public fleet, 450 private fleet, 30 Transportation Network Companies)
Priority Indicator: Fleet Electric Vehicles Purchased
Category #3: Initiative Indicators – example from Priority 2, initiative 2.1, Public Fleet
Adoption
EX. Initiative Objective: Work with public and academic sectors to integrate a
minimum of 300 electric vehicles into their fleets by the end of 2019.
Initiative Indicator: Number of EVs purchased within public fleets
Project, priority, and initiative indicators have overall targets for the life of the project.
These overall targets are typically subdivided in quarterly targets for tracking/reporting
purposes.
Category #4: Progress Indicators
All other types of report indicators apart from project, priority and initiative indicators
previously explained will be progress indicators. Such indicators are countable, but do
not directly contribute to a higher level indicator. Progress indicators will assist the team
in tracking and reporting on activities. Progress indicators also help validate if the
resources invested in a specific strategy are having the expected effect or “moving the
needle” on the priority indicators (which have defined targets based on objectives).
EX. Progress Indicator under Public Fleets Initiative 2.1:
Progress Indicator #1: # of contacts made with other government or institution
Some progress indicators will be included within the grant agreement, but others will be
developed as the program progresses and new strategies and activities are launched (for
example, initial market assessment in Q1 may result in new strategies and associated indicators
to be tracked in the remaining quarters).
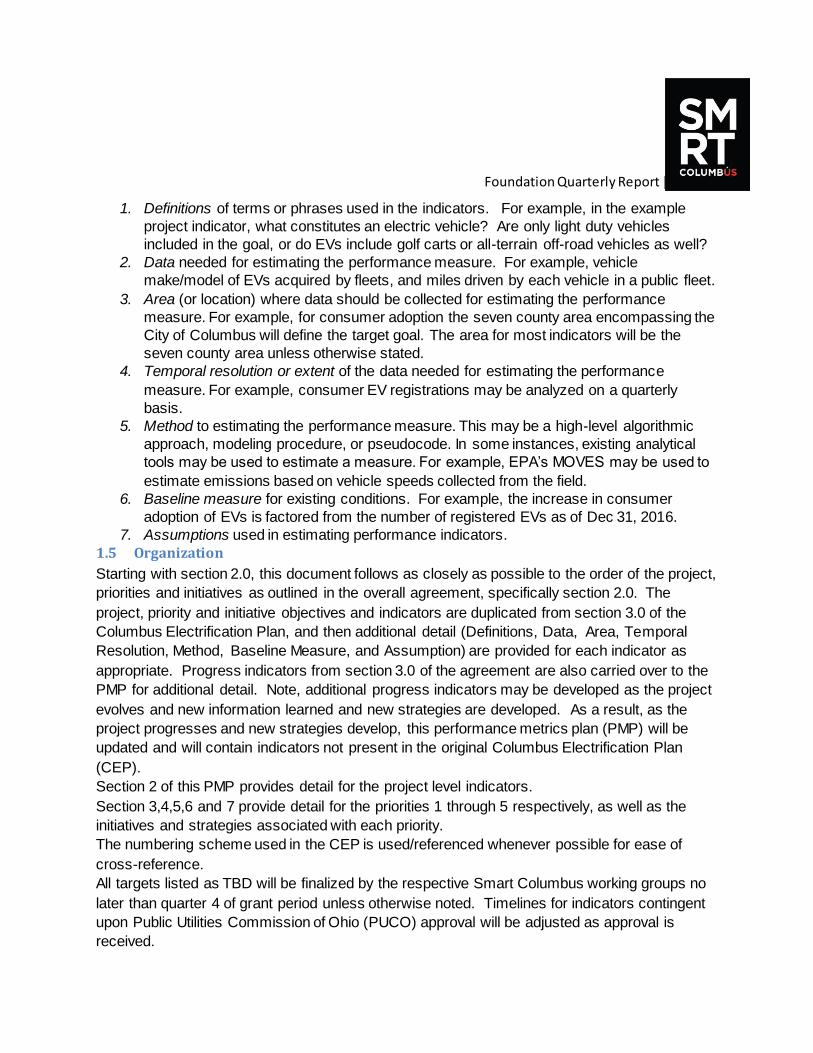
As appropriate for each indicator the following are defined for performance metrics.
Foundation Quarterly Report | Q2 2017
1. Definitions of terms or phrases used in the indicators. For example, in the example
project indicator, what constitutes an electric vehicle? Are only light duty vehicles
included in the goal, or do EVs include golf carts or all-terrain off-road vehicles as well?
2. Data needed for estimating the performance measure. For example, vehicle
make/model of EVs acquired by fleets, and miles driven by each vehicle in a public fleet.
3. Area (or location) where data should be collected for estimating the performance
measure. For example, for consumer adoption the seven county area encompassing the
City of Columbus will define the target goal. The area for most indicators will be the
seven county area unless otherwise stated.
4. Temporal resolution or extent of the data needed for estimating the performance
measure. For example, consumer EV registrations may be analyzed on a quarterly
basis.
5. Method to estimating the performance measure. This may be a high-level algorithmic
approach, modeling procedure, or pseudocode. In some instances, existing analytical
tools may be used to estimate a measure. For example, EPA’s MOVES may be used to
estimate emissions based on vehicle speeds collected from the field.
6. Baseline measure for existing conditions. For example, the increase in consumer
adoption of EVs is factored from the number of registered EVs as of Dec 31, 2016.
7. Assumptions used in estimating performance indicators.
1.5 Organization Starting with section 2.0, this document follows as closely as possible to the order of the project,
priorities and initiatives as outlined in the overall agreement, specifically section 2.0. The
project, priority and initiative objectives and indicators are duplicated from section 3.0 of the
Columbus Electrification Plan, and then additional detail (Definitions, Data, Area, Temporal
Resolution, Method, Baseline Measure, and Assumption) are provided for each indicator as
appropriate. Progress indicators from section 3.0 of the agreement are also carried over to the
PMP for additional detail. Note, additional progress indicators may be developed as the project
evolves and new information learned and new strategies are developed. As a result, as the
project progresses and new strategies develop, this performance metrics plan (PMP) will be
updated and will contain indicators not present in the original Columbus Electrification Plan
(CEP).
Section 2 of this PMP provides detail for the project level indicators.
Section 3,4,5,6 and 7 provide detail for the priorities 1 through 5 respectively, as well as the
initiatives and strategies associated with each priority.
The numbering scheme used in the CEP is used/referenced whenever possible for ease of
cross-reference.
All targets listed as TBD will be finalized by the respective Smart Columbus working groups no
later than quarter 4 of grant period unless otherwise noted. Timelines for indicators contingent
upon Public Utilities Commission of Ohio (PUCO) approval will be adjusted as approval is
received.

Foundation Quarterly Report | Q2 2017
Foundation Quarterly Report | Q2 2017
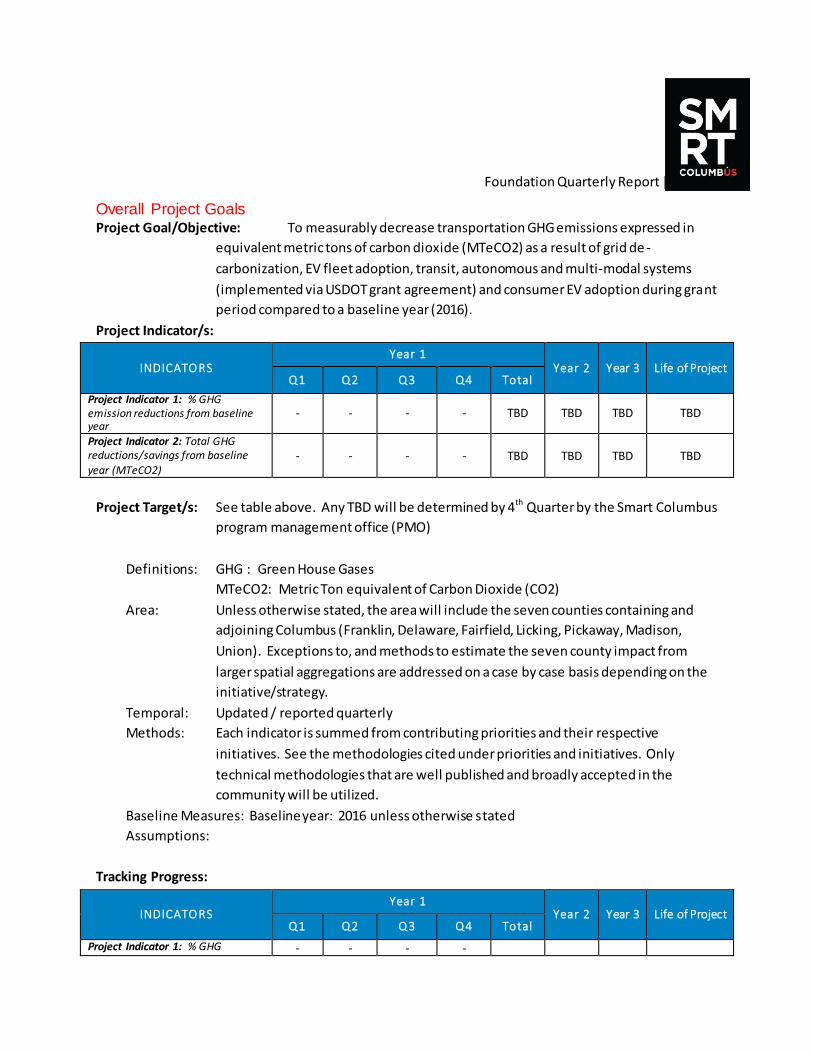
Overall Project Goals Project Goal/Objective: To measurably decrease transportation GHG emissions expressed in
equivalent metric tons of carbon dioxide (MTeCO2) as a result of grid de -
carbonization, EV fleet adoption, transit, autonomous and multi-modal systems
(implemented via USDOT grant agreement) and consumer EV adoption during grant
period compared to a baseline year (2016).
Project Indicator/s:
INDICATO RS Year 1
Year 2 Year 3 Life of Project Q1 Q2 Q3 Q4 Total
Project Indicator 1: % GHG emission reductions from baseline year
- - - - TBD TBD TBD TBD
Project Indicator 2: Total GHG reductions/savings from baseline
year (MTeCO2) - - - - TBD TBD TBD TBD
Project Target/s: See table above. Any TBD will be determined by 4th Quarter by the Smart Columbus
program management office (PMO)
Definitions: GHG : Green House Gases
MTeCO2: Metric Ton equivalent of Carbon Dioxide (CO2)
Area: Unless otherwise stated, the area will include the seven counties containing and
adjoining Columbus (Franklin, Delaware, Fairfield, Licking, Pickaway, Madison,
Union). Exceptions to, and methods to estimate the seven county impact from
larger spatial aggregations are addressed on a case by case basis depending on the
initiative/strategy.
Temporal: Updated / reported quarterly
Methods: Each indicator is summed from contributing priorities and their respective
initiatives. See the methodologies cited under priorities and initiatives. Only
technical methodologies that are well published and broadly accepted in the
community will be utilized.
Baseline Measures: Baseline year: 2016 unless otherwise stated
Assumptions:
Tracking Progress:
INDICATO RS Year 1
Year 2 Year 3 Life of Project Q1 Q2 Q3 Q4 Total
Project Indicator 1: % GHG - - - -

Foundation Quarterly Report | Q2 2017
emission reductions from baseline year
Project Indicator 2: Total GHG reductions/savings from baseline
year (MTeCO2) - - - -
Foundation Quarterly Report | Q2 2017
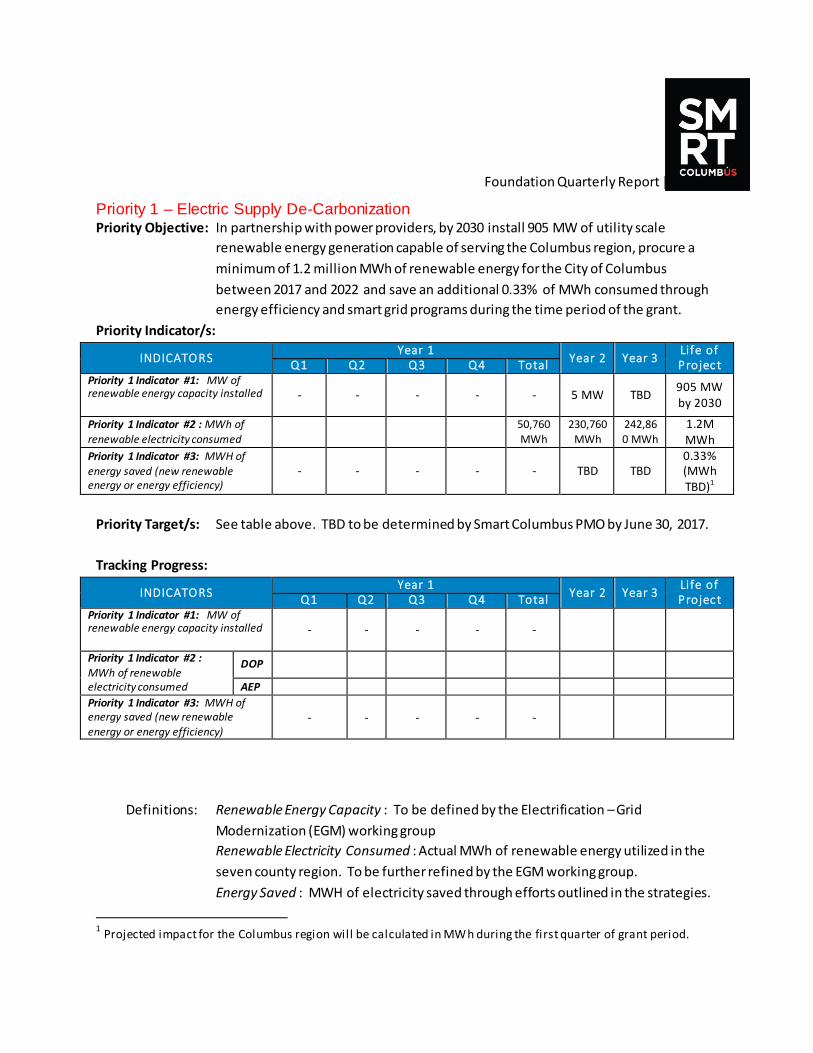
Priority 1 – Electric Supply De-Carbonization Priority Objective: In partnership with power providers, by 2030 install 905 MW of utility scale
renewable energy generation capable of serving the Columbus region, procure a
minimum of 1.2 million MWh of renewable energy for the City of Columbus
between 2017 and 2022 and save an additional 0.33% of MWh consumed through
energy efficiency and smart grid programs during the time period of the grant.
Priority Indicator/s:
INDICATO RS Year 1
Year 2 Year 3 Life of Project Q1 Q2 Q3 Q4 Total
Priority 1 Indicator #1: MW of renewable energy capacity installed - - - - - 5 MW TBD
905 MW by 2030
Priority 1 Indicator #2 : MWh of
renewable electricity consumed
50,760
MWh 230,760
MWh 242,86
0 MWh 1.2M MWh
Priority 1 Indicator #3: MWH of
energy saved (new renewable energy or energy efficiency)
- - - - - TBD TBD
0.33% (MWh TBD)1
Priority Target/s: See table above. TBD to be determined by Smart Columbus PMO by June 30, 2017.
Tracking Progress:
INDICATO RS Year 1
Year 2 Year 3 Life of Project Q1 Q2 Q3 Q4 Total
Priority 1 Indicator #1: MW of renewable energy capacity installed - - - - -
Priority 1 Indicator #2 : MWh of renewable electricity consumed
DOP
AEP Priority 1 Indicator #3: MWH of energy saved (new renewable energy or energy efficiency)
- - - - -
Definitions: Renewable Energy Capacity : To be defined by the Electrification – Grid
Modernization (EGM) working group
Renewable Electricity Consumed : Actual MWh of renewable energy utilized in the
seven county region. To be further refined by the EGM working group.
Energy Saved : MWH of electricity saved through efforts outlined in the strategies.
1 Projected impact for the Columbus region will be calculated in MWh during the first quarter of grant period.
Foundation Quarterly Report | Q2 2017
Data: Each contributing initiative provides estimates of power/energy. See contributing
initiative indicators
Area: The seven counties containing and encompassing Columbus except where noted.
Temporal: Life of project extends to 2030 when all renewable power strategies in this project
are anticipated to be online.
Methods: See methods form initiatives and strategies. The energy and power are cumulative
across the initiatives in 1.1 and 1.2.
Baseline Measures: Baseline year: 2016
Assumptions:
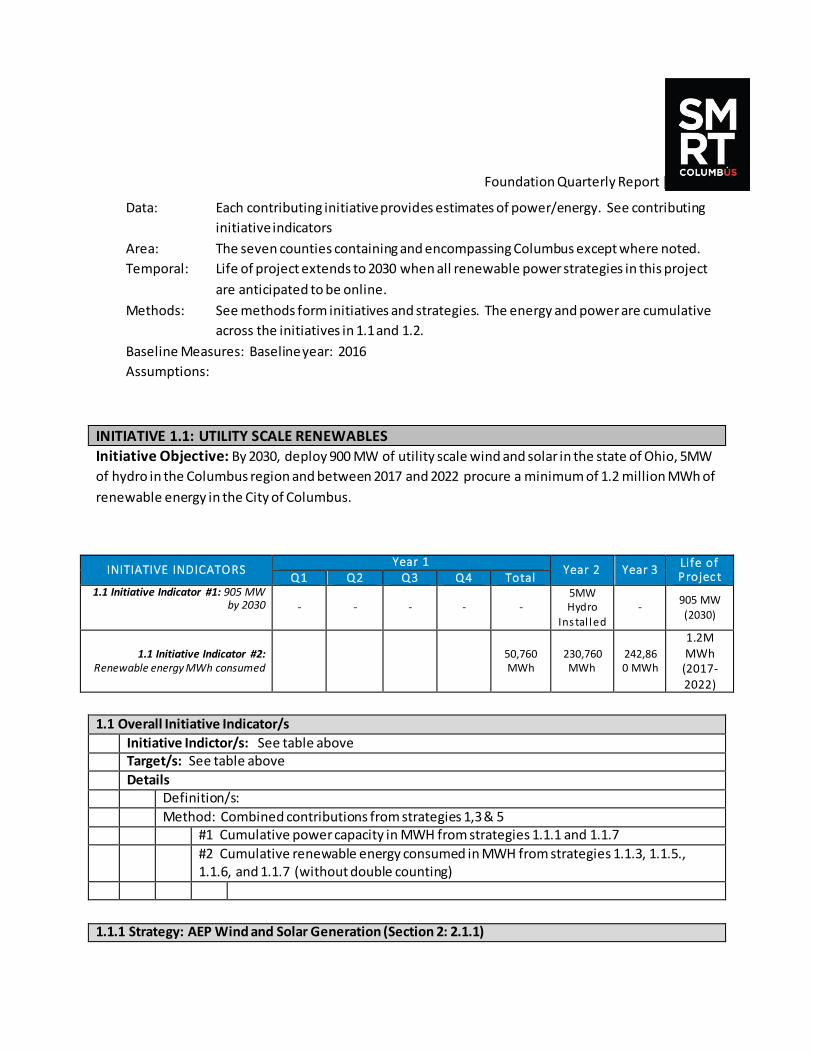
INITIATIVE 1.1: UTILITY SCALE RENEWABLES Initiative Objective: By 2030, deploy 900 MW of utility scale wind and solar in the state of Ohio, 5MW
of hydro in the Columbus region and between 2017 and 2022 procure a minimum of 1.2 million MWh of
renewable energy in the City of Columbus.
INITIATIVE INDICATO RS Year 1
Year 2 Year 3 Life of Project Q1 Q2 Q3 Q4 Total
1.1 Initiative Indicator #1: 905 MW by 2030 - - - - -
5MW Hydro
Instal led
- 905 MW
(2030)
1.1 Initiative Indicator #2: Renewable energy MWh consumed
50,760 MWh
230,760 MWh
242,860 MWh
1.2M MWh
(2017-2022)
1.1 Overall Initiative Indicator/s
Initiative Indictor/s: See table above Target/s: See table above
Details Definition/s:
Method: Combined contributions from strategies 1,3 & 5 #1 Cumulative power capacity in MWH from strategies 1.1.1 and 1.1.7
#2 Cumulative renewable energy consumed in MWH from strategies 1.1.3, 1.1.5., 1.1.6, and 1.1.7 (without double counting)
1.1.1 Strategy: AEP Wind and Solar Generation (Section 2: 2.1.1)
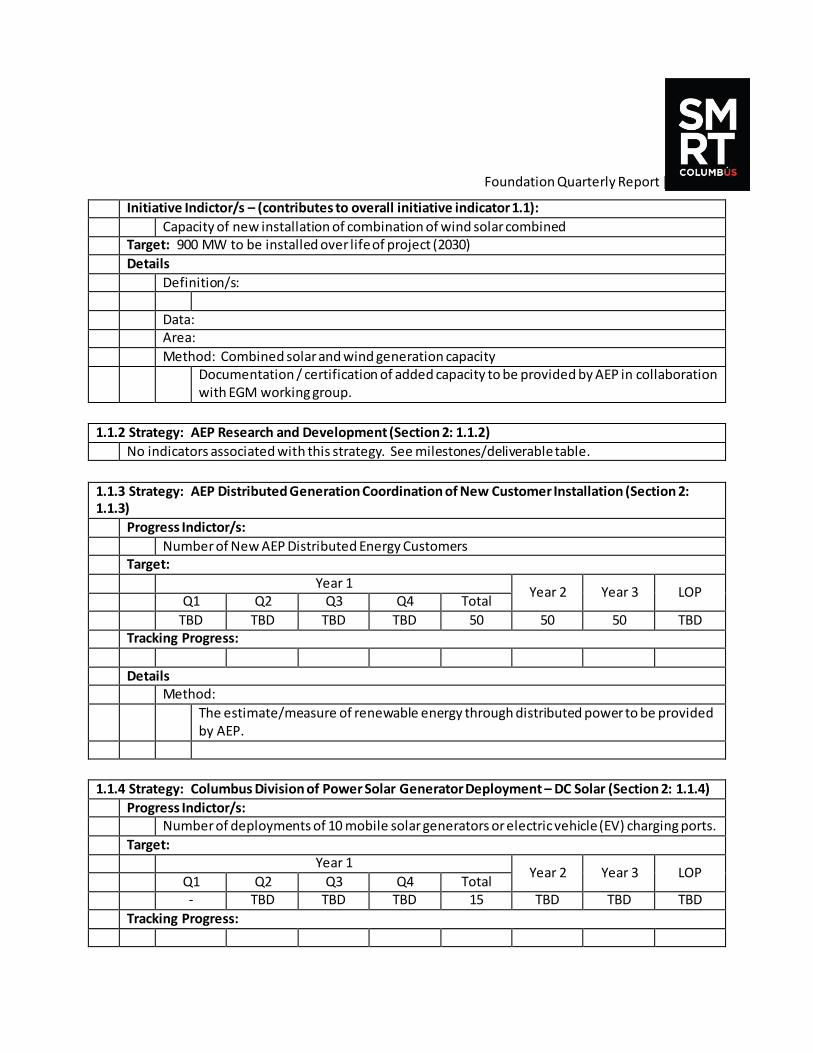
Foundation Quarterly Report | Q2 2017
Initiative Indictor/s – (contributes to overall initiative indicator 1.1):
Capacity of new installation of combination of wind solar combined Target: 900 MW to be installed over life of project (2030)
Details
Definition/s:
Data: Area:
Method: Combined solar and wind generation capacity Documentation / certification of added capacity to be provided by AEP in collaboration
with EGM working group.
1.1.2 Strategy: AEP Research and Development (Section 2: 1.1.2)
No indicators associated with this strategy. See milestones/deliverable table.
1.1.3 Strategy: AEP Distributed Generation Coordination of New Customer Installation (Section 2: 1.1.3)
Progress Indictor/s:
Number of New AEP Distributed Energy Customers Target:
Year 1 Year 2 Year 3 LOP
Q1 Q2 Q3 Q4 Total
TBD TBD TBD TBD 50 50 50 TBD Tracking Progress:
Details Method:
The estimate/measure of renewable energy through distributed power to be provided by AEP.
1.1.4 Strategy: Columbus Division of Power Solar Generator Deployment – DC Solar (Section 2: 1.1.4)
Progress Indictor/s: Number of deployments of 10 mobile solar generators or electric vehicle (EV) charging ports.
Target: Year 1
Year 2 Year 3 LOP Q1 Q2 Q3 Q4 Total - TBD TBD TBD 15 TBD TBD TBD
Tracking Progress:
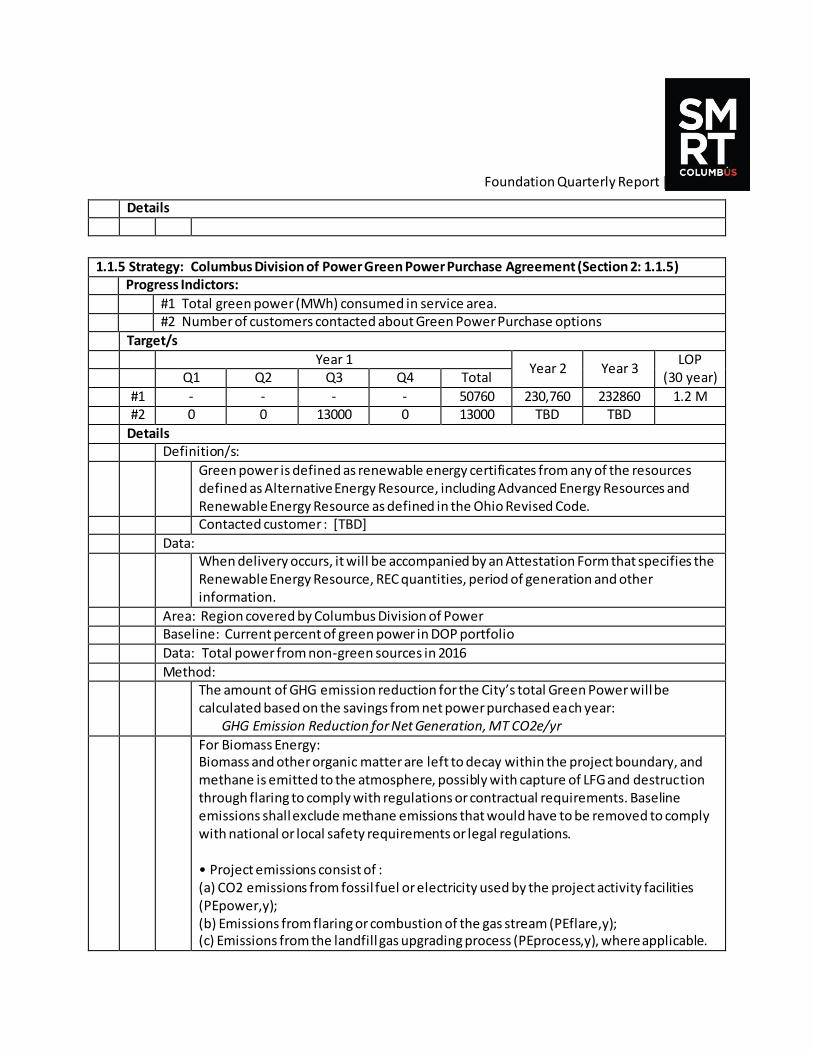
Foundation Quarterly Report | Q2 2017
Details
1.1.5 Strategy: Columbus Division of Power Green Power Purchase Agreement (Section 2: 1.1.5) Progress Indictors:
#1 Total green power (MWh) consumed in service area. #2 Number of customers contacted about Green Power Purchase options
Target/s
Year 1 Year 2 Year 3
LOP (30 year) Q1 Q2 Q3 Q4 Total
#1 - - - - 50760 230,760 232860 1.2 M #2 0 0 13000 0 13000 TBD TBD
Details Definition/s:
Green power is defined as renewable energy certificates from any of the resources defined as Alternative Energy Resource, including Advanced Energy Resources and Renewable Energy Resource as defined in the Ohio Revised Code.
Contacted customer : [TBD]
Data: When delivery occurs, it will be accompanied by an Attestation Form that specifies the
Renewable Energy Resource, REC quantities, period of generation and other information.
Area: Region covered by Columbus Division of Power Baseline: Current percent of green power in DOP portfolio
Data: Total power from non-green sources in 2016
Method: The amount of GHG emission reduction for the City’s total Green Power will be
calculated based on the savings from net power purchased each year: GHG Emission Reduction for Net Generation, MT CO2e/yr
For Biomass Energy: Biomass and other organic matter are left to decay within the project boundary, and methane is emitted to the atmosphere, possibly with capture of LFG and destruction through flaring to comply with regulations or contractual requirements. Baseline emissions shall exclude methane emissions that would have to be removed to comply with national or local safety requirements or legal regulations. • Project emissions consist of : (a) CO2 emissions from fossil fuel or electricity used by the project activity facilities (PEpower,y); (b) Emissions from flaring or combustion of the gas stream (PEflare,y); (c) Emissions from the landfill gas upgrading process (PEprocess,y), where applicable.
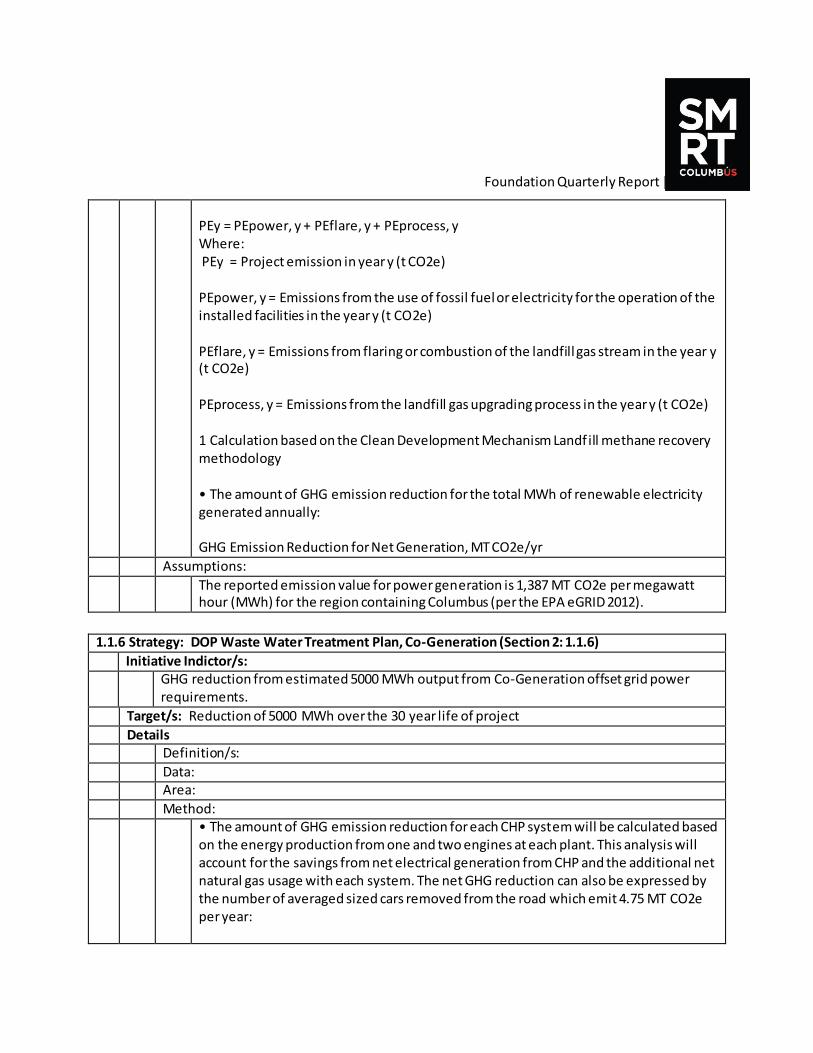
Foundation Quarterly Report | Q2 2017
PEy = PEpower, y + PEflare, y + PEprocess, y Where: PEy = Project emission in year y (t CO2e) PEpower, y = Emissions from the use of fossil fuel or electricity for the operation of the installed facilities in the year y (t CO2e) PEflare, y = Emissions from flaring or combustion of the landfill gas stream in the year y (t CO2e) PEprocess, y = Emissions from the landfill gas upgrading process in the year y (t CO2e) 1 Calculation based on the Clean Development Mechanism Landf ill methane recovery methodology • The amount of GHG emission reduction for the total MWh of renewable electricity generated annually: GHG Emission Reduction for Net Generation, MT CO2e/yr
Assumptions:
The reported emission value for power generation is 1,387 MT CO2e per megawatt hour (MWh) for the region containing Columbus (per the EPA eGRID 2012).
1.1.6 Strategy: DOP Waste Water Treatment Plan, Co-Generation (Section 2: 1.1.6)
Initiative Indictor/s: GHG reduction from estimated 5000 MWh output from Co-Generation offset grid power
requirements.
Target/s: Reduction of 5000 MWh over the 30 year life of project
Details Definition/s:
Data: Area:
Method: • The amount of GHG emission reduction for each CHP system will be calculated based
on the energy production from one and two engines at each plant. This analysis will account for the savings from net electrical generation from CHP and the additional net natural gas usage with each system. The net GHG reduction can also be expressed by the number of averaged sized cars removed from the road which emit 4.75 MT CO2e per year:
Foundation Quarterly Report | Q2 2017
GHG Emission Reduction for Net Generation, MT CO2e/yr GHG Emission Reduction for from Additional Natural Gas, MT CO2e/yr Net Reduction in GHG Footprint, MT CO2e/yr Equivalent Annual Cars Removed from Roads 1Calculation based on Arcadis consultant CoGen study.
Assumptions:
The reported emission value for power generation is 1,387 MT CO2e per megawatt hour (MWh) for the region containing Columbus (per the EPA eGRID 2012).
1.1.7 Strategy: Columbus Division of Power Hydroelectric Improvements (Section 2: 1.1.7) Initiative Indictor/s:
#1 MW capacity as a result of rehabilitation the City’s 5 MW hydroelectric plant located in the O’Shaughnessy Dam – additive to overall initiative indicator 1.1 #1
#2 MWh generated – additive to overall initiative indicator 1.1 #2
Target/s: 5MW capacity by end of 2018
10 MWh/yr starting in 2019
Details Definition/s:
Data: Total hours of operation and MWh generated in a three year period. Baseline: Plant generated 9,700 MWh (2013) and 7,300 MWh (2014). It ceased operations in
2015.
Assumptions: Plant nameplate capacity is 5MW Plant nameplate capacity is 5MW
The reported emission value for power generation is 1,387 MT CO2e per megawatt hour (MWh) for the region containing Columbus (per the EPA eGRID 2012).
Method: Estimate of MWh of energy
The amount of GHG emission reduction for the City’s hydroelectric plant will be calculated based on the additional MWh produced and hours of operation after improvements are implemented: GHG Emission Reduction for Net Generation, MT CO2e/yr
INITIATIVE 1.2: GRID MODERNIZATION AND EFFICIENCY
Initiative Objective: AEP and Columbus Division of Power will deploy energy efficiency programs, grid
modernization projects, which include battery storage installations, street and area light upgrades, AEP’s
gridSMART 2.0 upgrade, and expanded capacity programs that support renewables and electric vehicles.
1.2 Overall Initiative Indicator/s
Initiative Indictor/s:
Foundation Quarterly Report | Q2 2017
#1 Combined Energy Efficiency – MWh saved
#2 % GHG emission reductions from baseline year #3 Total GHG reductions/savings from [baseline year] (MTeCO2)
Targets
TBD by EGM working group by 6/30/2017 Details
Definition/s: Data:
Area: Method:
1.2.1 Strategy: AEP Energy Efficiency (Section 2: 1.2.1) Progress Indictors:
Expand Community Energy Savers (CES) program. Increase annual improvement in energy efficiency from 1% to 1.33% through a three-fold increase in CES participants.
Target/s: Threefold increase in CES participants
Details Baseline: Current 1% annual improvement in energy efficiency
Data: To be reported through AEP
Method: TBD : The method of documenting participation and estimating MWh saved, and ultimately GHG avoided will be provided by AEP by June 2017
1.2.2 AEP Vehicle to Grid Research (Section 2: 1.2.2)
No associated metrics with these deliverables
1.2.3 Strategy: AEP gridSMart Phase 2 AMI Meter Deployment (Section 2: 1.2.3)
Progress Indictor: Expand its gridSMART Advanced Metering Infrastructure (AMI) to customers.
Target: TBD – AEP by July 1, 2017
Details Baseline:
Data: Method:
1.2.4 Strategy: AEP Microgrids and Battery Storage (Section 2: 1.2.4)
Progress Indictor: Expand its gridSMART Advanced Metering Infrastructure (AMI) to customers.
Target: One by end of year 2, 1 to 2 by end of year 3 Details
Foundation Quarterly Report | Q2 2017
Baseline:
Data: Method: To be reported by AEP
1.2.5 Strategy: AEP Smart Lighting (Section 2: 1.2.5)
Progress Indictor: Number of installed and operating AEP owned Smart Street and Area Lighting controls on
existing AEP street and area lights. (Targets for 2017)
Target: TBD by EGM working group by 6/30/2017 Details
Baseline: Number of smart street light installed as of Dec 31, 2016 Data:
Method: To be reported by AEP
See methodology for GHG and power save from 1.2.7 below.
1.2.6 Columbus DOP Grid Modernization – AMI Meters (Section 2: 1.2.6)
Progress Indictors: Number of AMI meters installed
Target: 10,000 by end of year 2 Details
Baseline: Number of installed as of Dec 31, 2016
Data: Method: Associated GHG Emission Reduction Method
Assumptions: From the meter reading perspective, the project estimates a reduction in 24 vehicles that average 7,000 miles a year. Baseline: Number of vehicles used in 2016 to read meters, miles per gallon and averages miles driven per day/month. The net GHG reduction will be expressed by the number of averaged sized cars removed from the road per year which emit 4.75 MT CO2e per year (per EPA eGRID 2012). Net Reduction in GHG Footprint, MT CO2e/yr Equivalent Annual Cars Removed from Roads
1.2.7 Columbus DOP Street Light Technology Conversion (Section 2: 1.2.7)
Progress Indictors: Number of LED Street Lights Installed
Target: 700 in first year, total number TBD (Dec 31, 2017)
Foundation Quarterly Report | Q2 2017
Details
Baseline: Number of installed as of Dec 31, 2016 Data: Number of installed and operating reported by Columbus DOP
Method: Associated GHG Emission Reduction Method
Data: Estimate the nameplate/rated power (Watts) of existing luminaires. Daily hours of usage. Baseline: Assumptions: As 2015, there are approximately 52,000 existing street lights that the Division of Power is responsible for maintaining. This represents approximately 65% of the city’s streets. Calculate the gross electricity savings by comparing the total average power of the project luminaires multiplied by project annual hours of operation, with the average power of the baseline luminaires multiplied by baseline annual hours of operation (daily hours times 365 or other number equal to the number of days per year that the lights are expected to be operated); Calculate the net electricity saving (NES) by correcting the gross electricity savings for any leakage and transmission & distribution losses. See Appendix B: LED Streetlight Conversion – GHG Calculation Methodology for full calculation details.
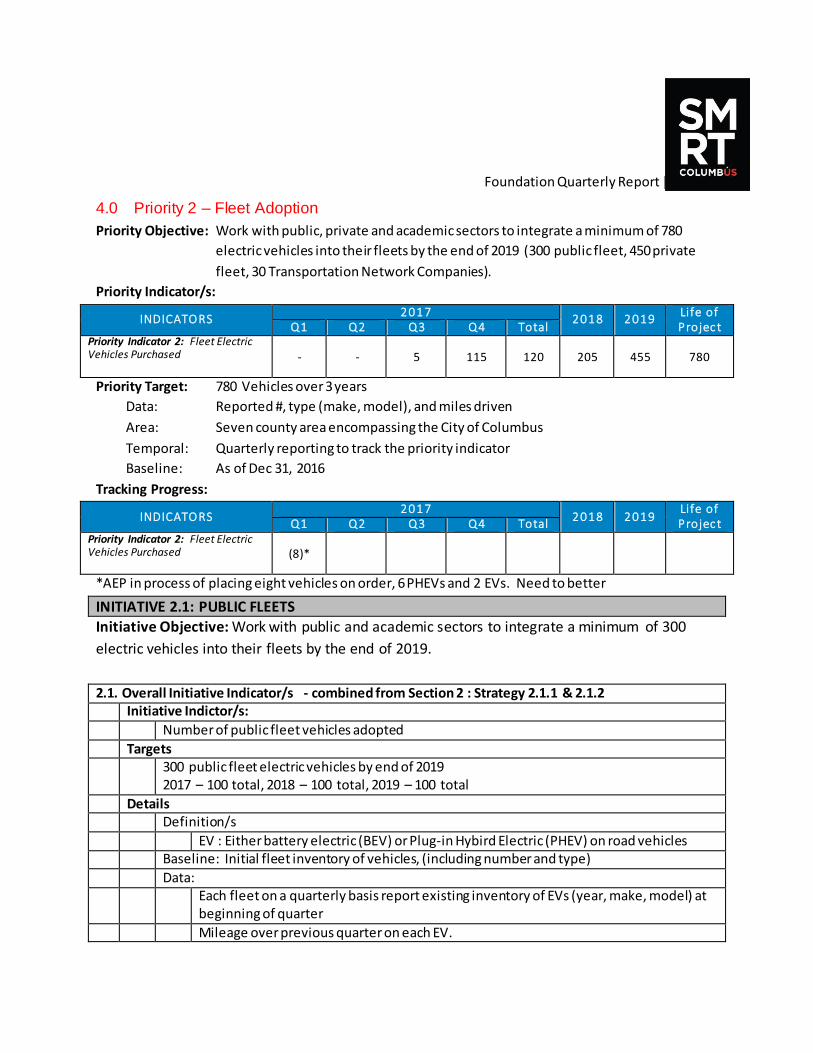
Foundation Quarterly Report | Q2 2017
4.0 Priority 2 – Fleet Adoption
Priority Objective: Work with public, private and academic sectors to integrate a minimum of 780
electric vehicles into their fleets by the end of 2019 (300 public fleet, 450 private
fleet, 30 Transportation Network Companies).
Priority Indicator/s:
INDICATO RS 2017
2018 2019 Life of Project Q1 Q2 Q3 Q4 Total
Priority Indicator 2: Fleet Electric Vehicles Purchased - - 5 115 120 205 455 780
Priority Target: 780 Vehicles over 3 years
Data: Reported #, type (make, model), and miles driven
Area: Seven county area encompassing the City of Columbus
Temporal: Quarterly reporting to track the priority indicator
Baseline: As of Dec 31, 2016
Tracking Progress:
INDICATO RS 2017
2018 2019 Life of Project Q1 Q2 Q3 Q4 Total
Priority Indicator 2: Fleet Electric Vehicles Purchased (8)*
*AEP in process of placing eight vehicles on order, 6 PHEVs and 2 EVs. Need to better
INITIATIVE 2.1: PUBLIC FLEETS
Initiative Objective: Work with public and academic sectors to integrate a minimum of 300
electric vehicles into their fleets by the end of 2019.
2.1. Overall Initiative Indicator/s - combined from Section 2 : Strategy 2.1.1 & 2.1.2 Initiative Indictor/s:
Number of public fleet vehicles adopted
Targets 300 public fleet electric vehicles by end of 2019
2017 – 100 total, 2018 – 100 total, 2019 – 100 total
Details Definition/s
EV : Either battery electric (BEV) or Plug-in Hybird Electric (PHEV) on road vehicles Baseline: Initial fleet inventory of vehicles, (including number and type)
Data: Each fleet on a quarterly basis report existing inventory of EVs (year, make, model) at
beginning of quarter
Mileage over previous quarter on each EV.
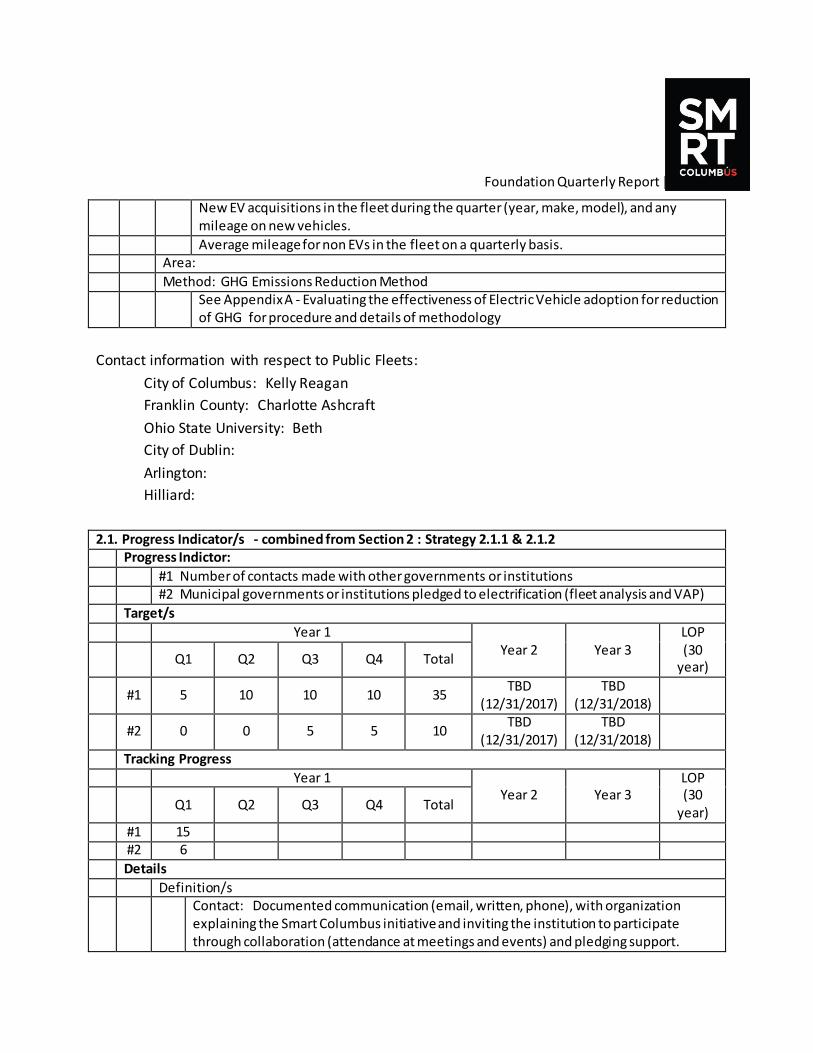
Foundation Quarterly Report | Q2 2017
New EV acquisitions in the fleet during the quarter (year, make, model), and any mileage on new vehicles.
Average mileage for non EVs in the fleet on a quarterly basis. Area:
Method: GHG Emissions Reduction Method See Appendix A - Evaluating the effectiveness of Electric Vehicle adoption for reduction
of GHG for procedure and details of methodology
Contact information with respect to Public Fleets:
City of Columbus: Kelly Reagan
Franklin County: Charlotte Ashcraft
Ohio State University: Beth
City of Dublin:
Arlington:
Hilliard:
2.1. Progress Indicator/s - combined from Section 2 : Strategy 2.1.1 & 2.1.2 Progress Indictor:
#1 Number of contacts made with other governments or institutions #2 Municipal governments or institutions pledged to electrification (fleet analysis and VAP)
Target/s
Year 1 Year 2 Year 3
LOP (30
year)
Q1 Q2 Q3 Q4 Total
#1 5 10 10 10 35
TBD (12/31/2017)
TBD (12/31/2018)
#2 0 0 5 5 10
TBD (12/31/2017)
TBD (12/31/2018)
Tracking Progress
Year 1 Year 2 Year 3
LOP (30
year)
Q1 Q2 Q3 Q4 Total
#1 15 #2 6
Details
Definition/s Contact: Documented communication (email, written, phone), with organization
explaining the Smart Columbus initiative and inviting the institution to participate through collaboration (attendance at meetings and events) and pledging support.
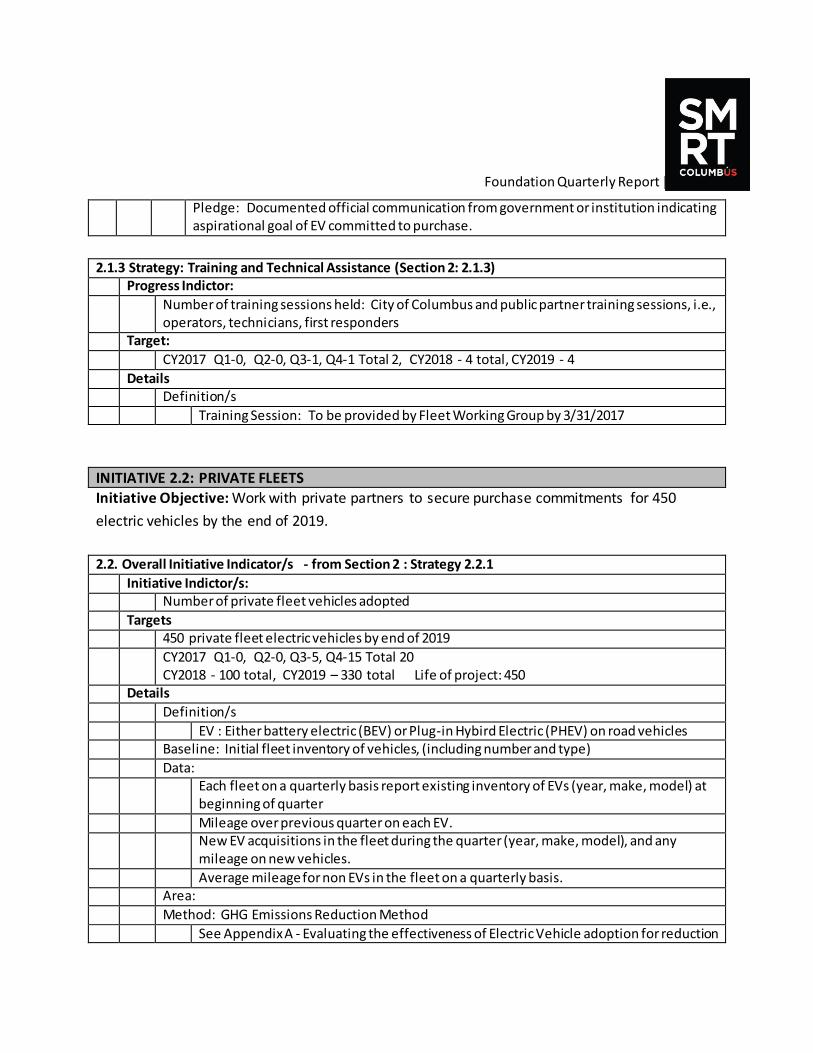
Foundation Quarterly Report | Q2 2017
Pledge: Documented official communication from government or institution indicating aspirational goal of EV committed to purchase.
2.1.3 Strategy: Training and Technical Assistance (Section 2: 2.1.3) Progress Indictor:
Number of training sessions held: City of Columbus and public partner training sessions, i.e., operators, technicians, first responders
Target:
CY2017 Q1-0, Q2-0, Q3-1, Q4-1 Total 2, CY2018 - 4 total, CY2019 - 4
Details Definition/s
Training Session: To be provided by Fleet Working Group by 3/31/2017
INITIATIVE 2.2: PRIVATE FLEETS Initiative Objective: Work with private partners to secure purchase commitments for 450
electric vehicles by the end of 2019.
2.2. Overall Initiative Indicator/s - from Section 2 : Strategy 2.2.1
Initiative Indictor/s: Number of private fleet vehicles adopted
Targets 450 private fleet electric vehicles by end of 2019
CY2017 Q1-0, Q2-0, Q3-5, Q4-15 Total 20 CY2018 - 100 total, CY2019 – 330 total Life of project: 450
Details
Definition/s
EV : Either battery electric (BEV) or Plug-in Hybird Electric (PHEV) on road vehicles Baseline: Initial fleet inventory of vehicles, (including number and type)
Data: Each fleet on a quarterly basis report existing inventory of EVs (year, make, model) at
beginning of quarter
Mileage over previous quarter on each EV. New EV acquisitions in the fleet during the quarter (year, make, model), and any
mileage on new vehicles.
Average mileage for non EVs in the fleet on a quarterly basis. Area:
Method: GHG Emissions Reduction Method
See Appendix A - Evaluating the effectiveness of Electric Vehicle adoption for reduction
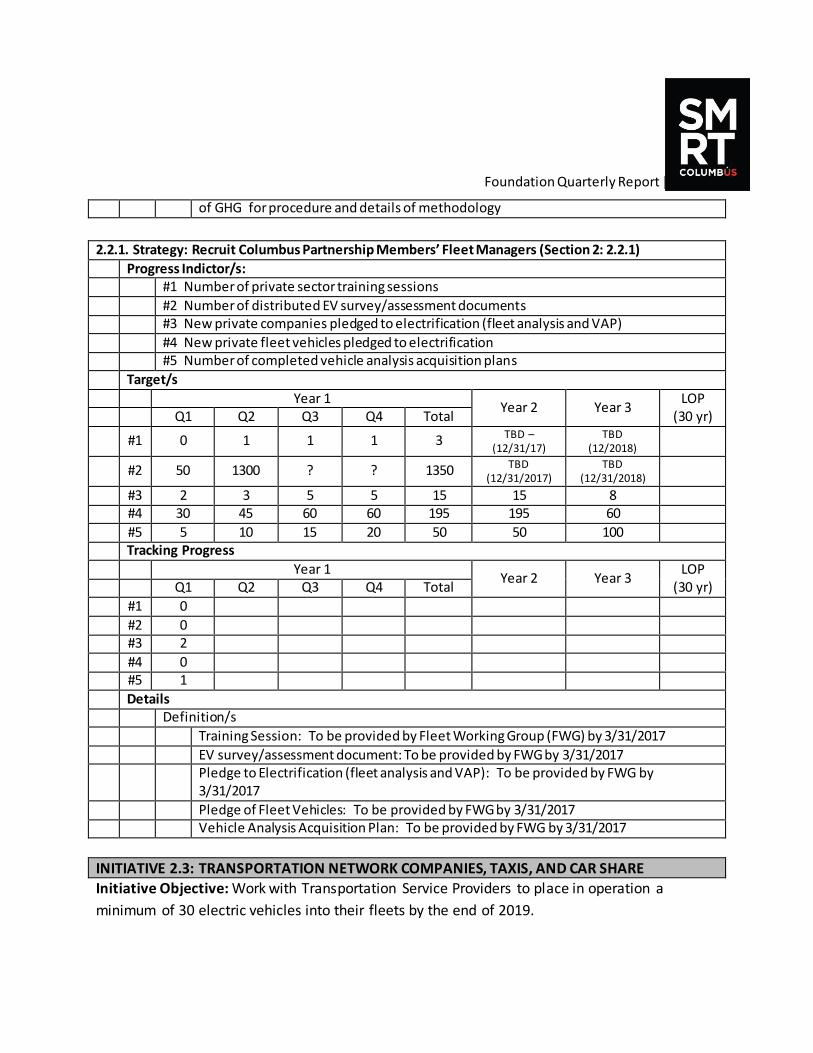
Foundation Quarterly Report | Q2 2017
of GHG for procedure and details of methodology
2.2.1. Strategy: Recruit Columbus Partnership Members’ Fleet Managers (Section 2: 2.2.1)
Progress Indictor/s: #1 Number of private sector training sessions
#2 Number of distributed EV survey/assessment documents #3 New private companies pledged to electrification (fleet analysis and VAP)
#4 New private fleet vehicles pledged to electrification #5 Number of completed vehicle analysis acquisition plans
Target/s
Year 1 Year 2 Year 3
LOP (30 yr) Q1 Q2 Q3 Q4 Total
#1 0 1 1 1 3 TBD – (12/31/17)
TBD (12/2018)
#2 50 1300 ? ? 1350 TBD (12/31/2017)
TBD (12/31/2018)
#3 2 3 5 5 15 15 8 #4 30 45 60 60 195 195 60
#5 5 10 15 20 50 50 100 Tracking Progress
Year 1 Year 2 Year 3
LOP (30 yr) Q1 Q2 Q3 Q4 Total
#1 0
#2 0 #3 2
#4 0 #5 1
Details Definition/s
Training Session: To be provided by Fleet Working Group (FWG) by 3/31/2017
EV survey/assessment document: To be provided by FWG by 3/31/2017 Pledge to Electrification (fleet analysis and VAP): To be provided by FWG by
3/31/2017
Pledge of Fleet Vehicles: To be provided by FWG by 3/31/2017 Vehicle Analysis Acquisition Plan: To be provided by FWG by 3/31/2017
INITIATIVE 2.3: TRANSPORTATION NETWORK COMPANIES, TAXIS, AND CAR SHARE
Initiative Objective: Work with Transportation Service Providers to place in operation a
minimum of 30 electric vehicles into their fleets by the end of 2019.
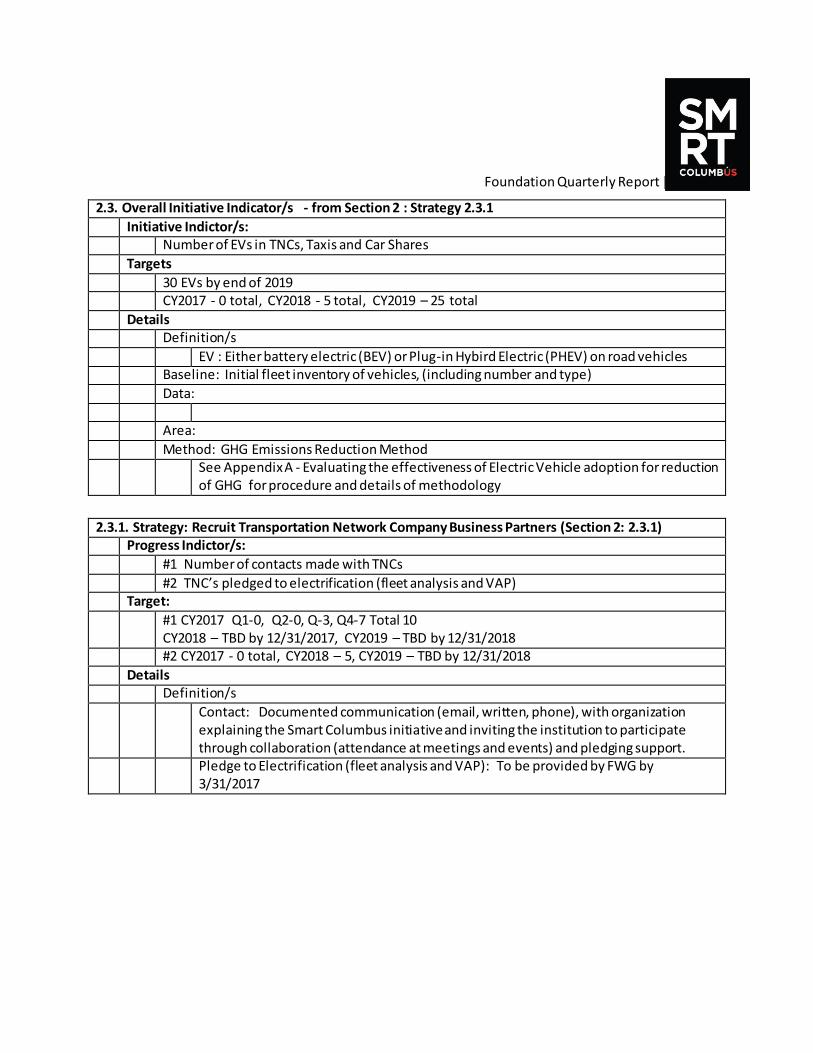
Foundation Quarterly Report | Q2 2017
2.3. Overall Initiative Indicator/s - from Section 2 : Strategy 2.3.1
Initiative Indictor/s: Number of EVs in TNCs, Taxis and Car Shares
Targets
30 EVs by end of 2019 CY2017 - 0 total, CY2018 - 5 total, CY2019 – 25 total
Details Definition/s
EV : Either battery electric (BEV) or Plug-in Hybird Electric (PHEV) on road vehicles Baseline: Initial fleet inventory of vehicles, (including number and type)
Data:
Area:
Method: GHG Emissions Reduction Method See Appendix A - Evaluating the effectiveness of Electric Vehicle adoption for reduction
of GHG for procedure and details of methodology
2.3.1. Strategy: Recruit Transportation Network Company Business Partners (Section 2: 2.3.1) Progress Indictor/s:
#1 Number of contacts made with TNCs
#2 TNC’s pledged to electrification (fleet analysis and VAP) Target:
#1 CY2017 Q1-0, Q2-0, Q-3, Q4-7 Total 10 CY2018 – TBD by 12/31/2017, CY2019 – TBD by 12/31/2018
#2 CY2017 - 0 total, CY2018 – 5, CY2019 – TBD by 12/31/2018
Details Definition/s
Contact: Documented communication (email, written, phone), with organization explaining the Smart Columbus initiative and inviting the institution to participate through collaboration (attendance at meetings and events) and pledging support.
Pledge to Electrification (fleet analysis and VAP): To be provided by FWG by 3/31/2017
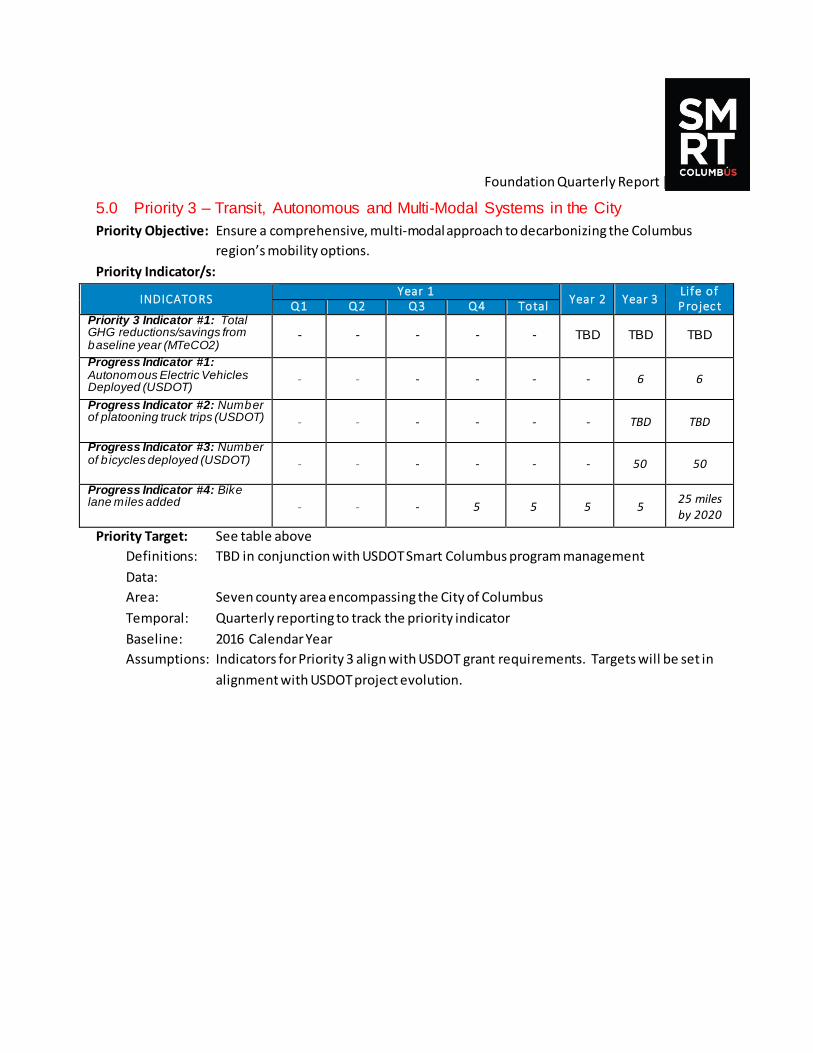
Foundation Quarterly Report | Q2 2017
5.0 Priority 3 – Transit, Autonomous and Multi-Modal Systems in the City
Priority Objective: Ensure a comprehensive, multi-modal approach to decarbonizing the Columbus
region’s mobility options.
Priority Indicator/s:
INDICATO RS Year 1
Year 2 Year 3 Life of Project Q1 Q2 Q3 Q4 Total
Priority 3 Indicator #1: Total GHG reductions/savings from baseline year (MTeCO2)
- - - - - TBD TBD TBD
Progress Indicator #1: Autonomous Electric Vehicles Deployed (USDOT)
- - - - - - 6 6
Progress Indicator #2: Number of platooning truck trips (USDOT) - - - - - - TBD TBD
Progress Indicator #3: Number of b icycles deployed (USDOT) - - - - - - 50 50
Progress Indicator #4: Bike lane miles added - - - 5 5 5 5
25 miles by 2020
Priority Target: See table above
Definitions: TBD in conjunction with USDOT Smart Columbus program management
Data:
Area: Seven county area encompassing the City of Columbus
Temporal: Quarterly reporting to track the priority indicator
Baseline: 2016 Calendar Year
Assumptions: Indicators for Priority 3 align with USDOT grant requirements. Targets will be set in
alignment with USDOT project evolution.
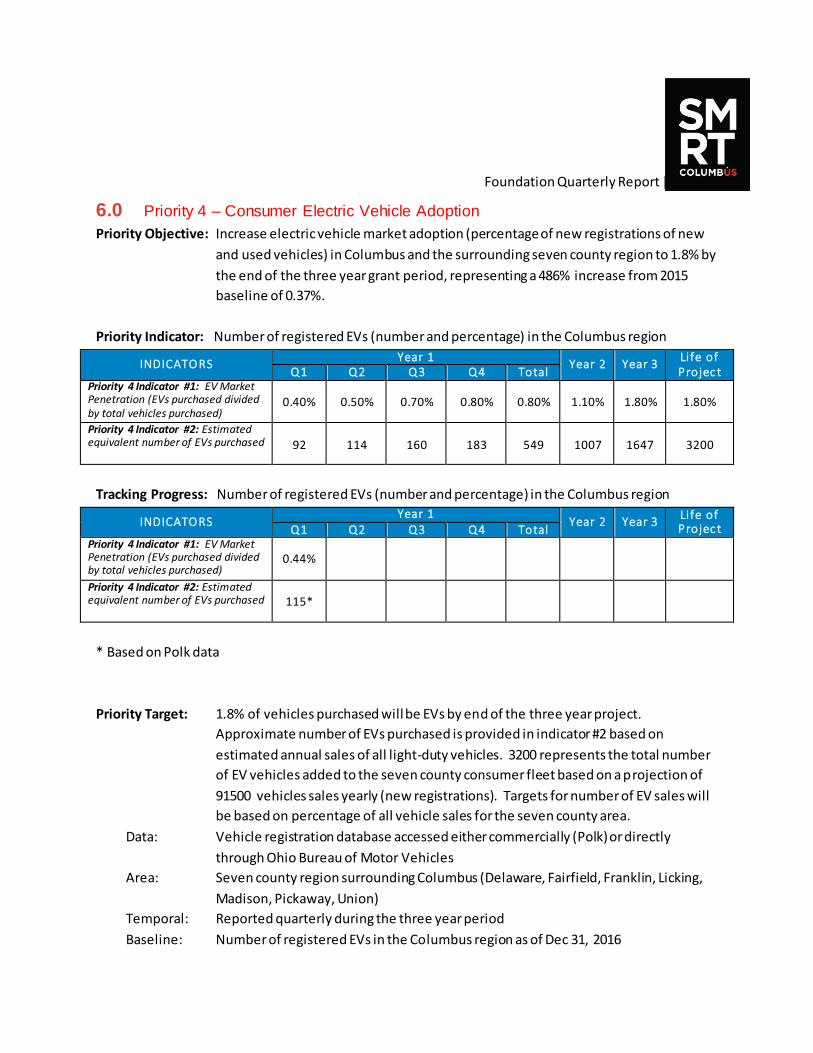
Foundation Quarterly Report | Q2 2017
6.0 Priority 4 – Consumer Electric Vehicle Adoption Priority Objective: Increase electric vehicle market adoption (percentage of new registrations of new
and used vehicles) in Columbus and the surrounding seven county region to 1.8% by
the end of the three year grant period, representing a 486% increase from 2015
baseline of 0.37%.
Priority Indicator: Number of registered EVs (number and percentage) in the Columbus region
INDICATO RS Year 1
Year 2 Year 3 Life of Project Q1 Q2 Q3 Q4 Total
Priority 4 Indicator #1: EV Market Penetration (EVs purchased divided by total vehicles purchased)
0.40% 0.50% 0.70% 0.80% 0.80% 1.10% 1.80% 1.80%
Priority 4 Indicator #2: Estimated equivalent number of EVs purchased 92 114 160 183 549 1007 1647 3200
Tracking Progress: Number of registered EVs (number and percentage) in the Columbus region
INDICATO RS Year 1
Year 2 Year 3 Life of Project Q1 Q2 Q3 Q4 Total
Priority 4 Indicator #1: EV Market Penetration (EVs purchased divided by total vehicles purchased)
0.44%
Priority 4 Indicator #2: Estimated equivalent number of EVs purchased 115*
* Based on Polk data
Priority Target: 1.8% of vehicles purchased will be EVs by end of the three year project.
Approximate number of EVs purchased is provided in indicator #2 based on
estimated annual sales of all light-duty vehicles. 3200 represents the total number
of EV vehicles added to the seven county consumer fleet based on a projection of
91500 vehicles sales yearly (new registrations). Targets for number of EV sales will
be based on percentage of all vehicle sales for the seven county area.
Data: Vehicle registration database accessed either commercially (Polk) or directly
through Ohio Bureau of Motor Vehicles
Area: Seven county region surrounding Columbus (Delaware, Fairfield, Franklin, Licking,
Madison, Pickaway, Union)
Temporal: Reported quarterly during the three year period
Baseline: Number of registered EVs in the Columbus region as of Dec 31, 2016
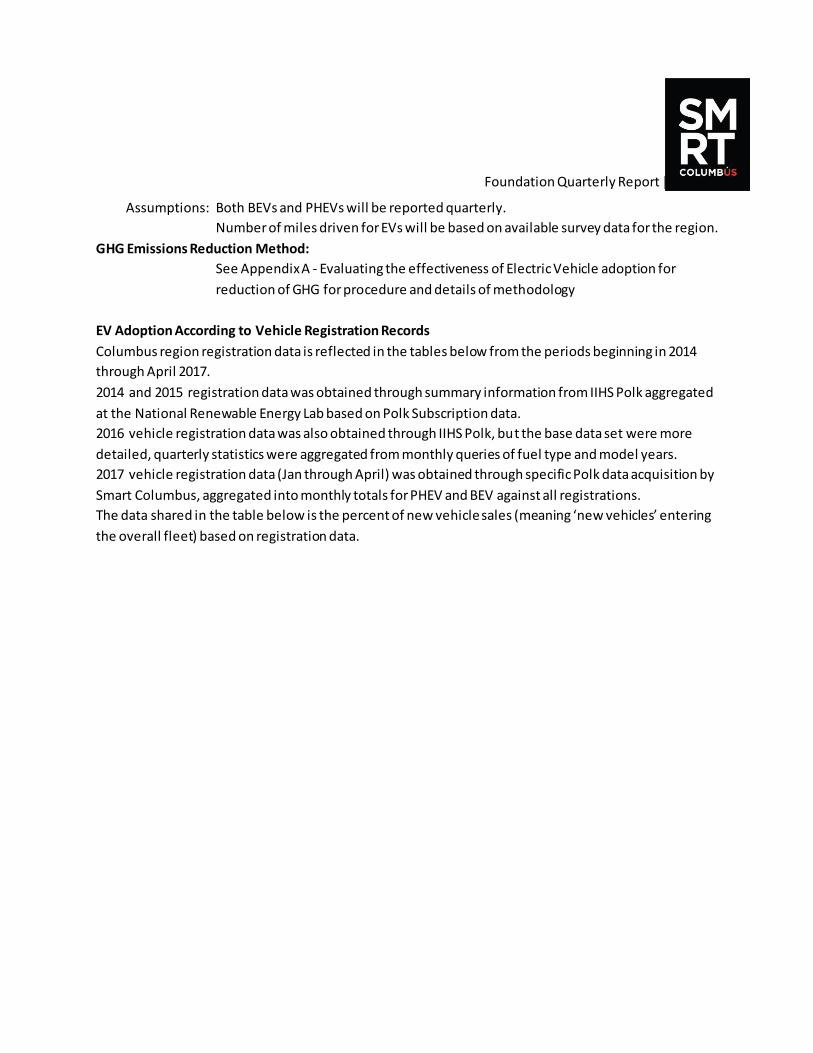
Foundation Quarterly Report | Q2 2017
Assumptions: Both BEVs and PHEVs will be reported quarterly.
Number of miles driven for EVs will be based on available survey data for the region.
GHG Emissions Reduction Method:
See Appendix A - Evaluating the effectiveness of Electric Vehicle adoption for
reduction of GHG for procedure and details of methodology
EV Adoption According to Vehicle Registration Records
Columbus region registration data is reflected in the tables below from the periods beginning in 2014
through April 2017.
2014 and 2015 registration data was obtained through summary information from IIHS Polk aggregated
at the National Renewable Energy Lab based on Polk Subscription data.
2016 vehicle registration data was also obtained through IIHS Polk, but the base data set were more
detailed, quarterly statistics were aggregated from monthly queries of fuel type and model years.
2017 vehicle registration data (Jan through April) was obtained through specific Polk data acquisition by
Smart Columbus, aggregated into monthly totals for PHEV and BEV against all registrations.
The data shared in the table below is the percent of new vehicle sales (meaning ‘new vehicles’ entering
the overall fleet) based on registration data.
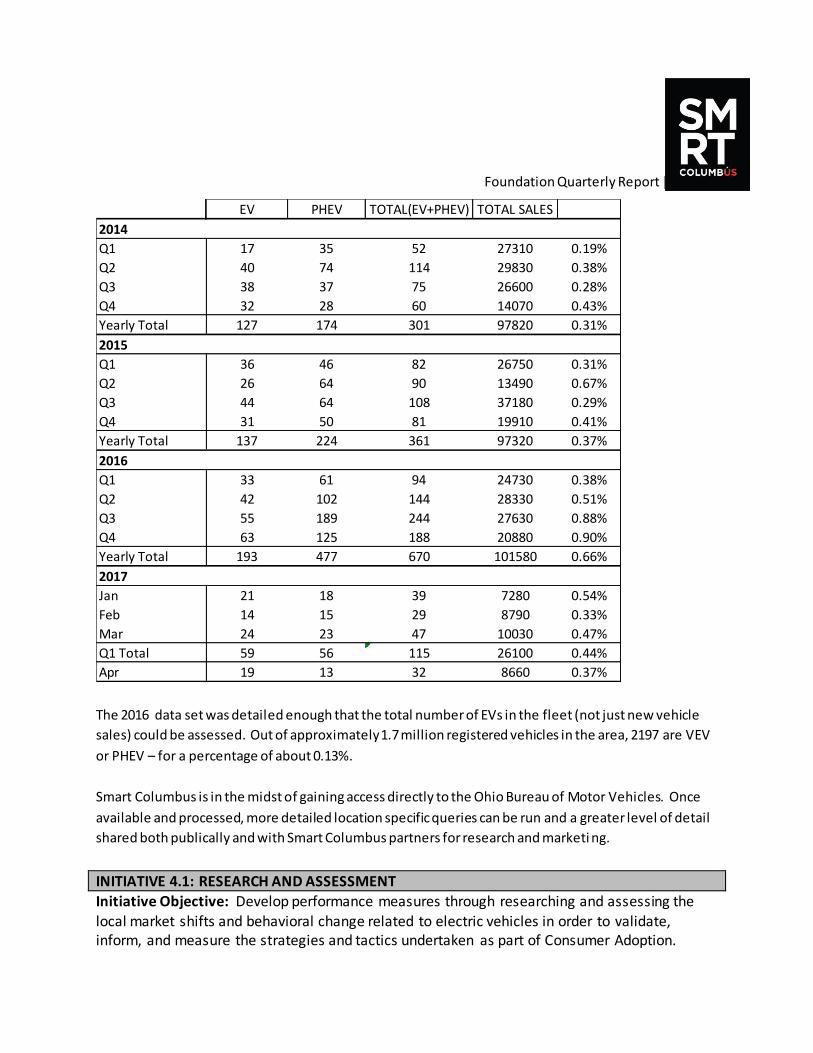
Foundation Quarterly Report | Q2 2017
The 2016 data set was detailed enough that the total number of EVs in the fleet (not just new vehicle
sales) could be assessed. Out of approximately 1.7 million registered vehicles in the area, 2197 are VEV
or PHEV – for a percentage of about 0.13%.
Smart Columbus is in the midst of gaining access directly to the Ohio Bureau of Motor Vehicles. Once
available and processed, more detailed location specific queries can be run and a greater level of detail
shared both publically and with Smart Columbus partners for research and marketi ng.
INITIATIVE 4.1: RESEARCH AND ASSESSMENT
Initiative Objective: Develop performance measures through researching and assessing the local market shifts and behavioral change related to electric vehicles in order to validate, inform, and measure the strategies and tactics undertaken as part of Consumer Adoption.
EV PHEV TOTAL(EV+PHEV) TOTAL SALES
2014
Q1 17 35 52 27310 0.19%
Q2 40 74 114 29830 0.38%
Q3 38 37 75 26600 0.28%
Q4 32 28 60 14070 0.43%
Yearly Total 127 174 301 97820 0.31%
2015
Q1 36 46 82 26750 0.31%
Q2 26 64 90 13490 0.67%
Q3 44 64 108 37180 0.29%
Q4 31 50 81 19910 0.41%
Yearly Total 137 224 361 97320 0.37%
2016
Q1 33 61 94 24730 0.38%
Q2 42 102 144 28330 0.51%
Q3 55 189 244 27630 0.88%
Q4 63 125 188 20880 0.90%
Yearly Total 193 477 670 101580 0.66%
2017
Jan 21 18 39 7280 0.54%
Feb 14 15 29 8790 0.33%
Mar 24 23 47 10030 0.47%
Q1 Total 59 56 115 26100 0.44%
Apr 19 13 32 8660 0.37%
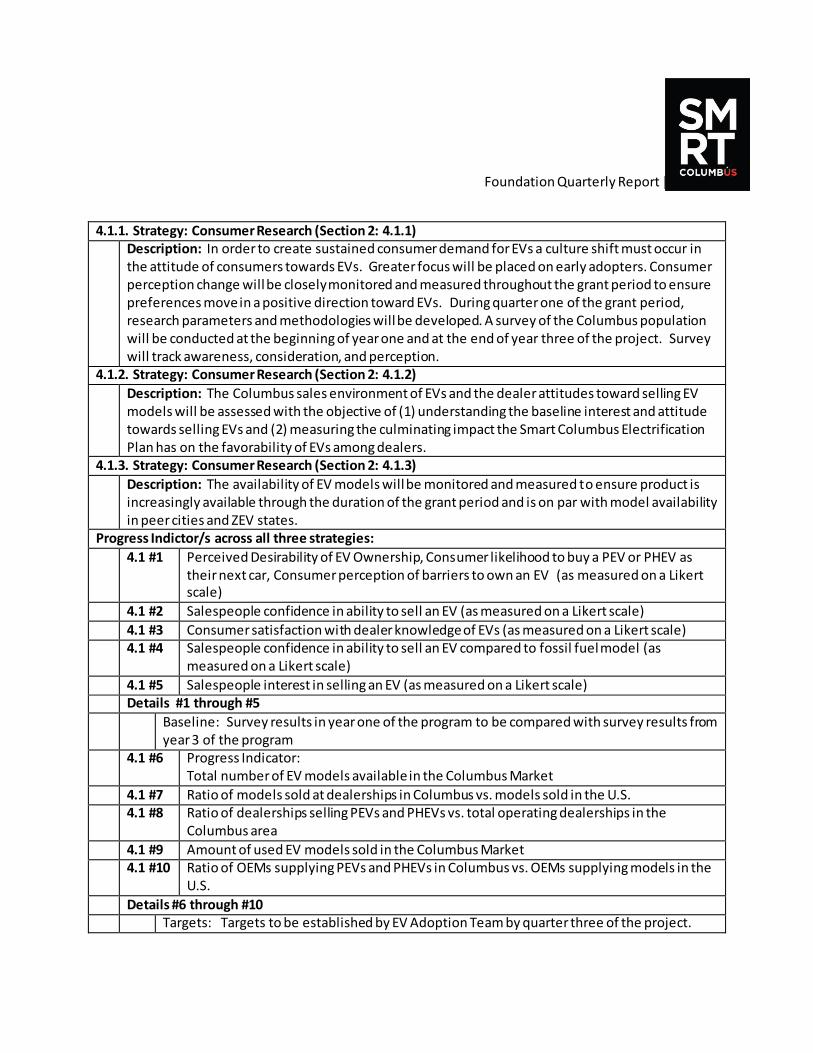
Foundation Quarterly Report | Q2 2017
4.1.1. Strategy: Consumer Research (Section 2: 4.1.1)
Description: In order to create sustained consumer demand for EVs a culture shift must occur in the attitude of consumers towards EVs. Greater focus will be placed on early adopters. Consumer perception change will be closely monitored and measured throughout the grant period to ensure preferences move in a positive direction toward EVs. During quarter one of the grant period, research parameters and methodologies will be developed. A survey of the Columbus population will be conducted at the beginning of year one and at the end of year three of the project. Survey will track awareness, consideration, and perception.
4.1.2. Strategy: Consumer Research (Section 2: 4.1.2)
Description: The Columbus sales environment of EVs and the dealer attitudes toward selling EV models will be assessed with the objective of (1) understanding the baseline interest and attitude towards selling EVs and (2) measuring the culminating impact the Smart Columbus Electrification Plan has on the favorability of EVs among dealers.
4.1.3. Strategy: Consumer Research (Section 2: 4.1.3)
Description: The availability of EV models will be monitored and measured to ensure product is increasingly available through the duration of the grant period and is on par with model availability in peer cities and ZEV states.
Progress Indictor/s across all three strategies:
4.1 #1 Perceived Desirability of EV Ownership, Consumer likelihood to buy a PEV or PHEV as their next car, Consumer perception of barriers to own an EV (as measured on a Likert scale)
4.1 #2 Salespeople confidence in ability to sell an EV (as measured on a Likert scale)
4.1 #3 Consumer satisfaction with dealer knowledge of EVs (as measured on a Likert scale) 4.1 #4 Salespeople confidence in ability to sell an EV compared to fossil fuel model (as
measured on a Likert scale)
4.1 #5 Salespeople interest in selling an EV (as measured on a Likert scale) Details #1 through #5
Baseline: Survey results in year one of the program to be compared with survey results from year 3 of the program
4.1 #6 Progress Indicator: Total number of EV models available in the Columbus Market
4.1 #7 Ratio of models sold at dealerships in Columbus vs. models sold in the U.S. 4.1 #8 Ratio of dealerships selling PEVs and PHEVs vs. total operating dealerships in the
Columbus area
4.1 #9 Amount of used EV models sold in the Columbus Market 4.1 #10 Ratio of OEMs supplying PEVs and PHEVs in Columbus vs. OEMs supplying models in the
U.S.
Details #6 through #10 Targets: Targets to be established by EV Adoption Team by quarter three of the project.
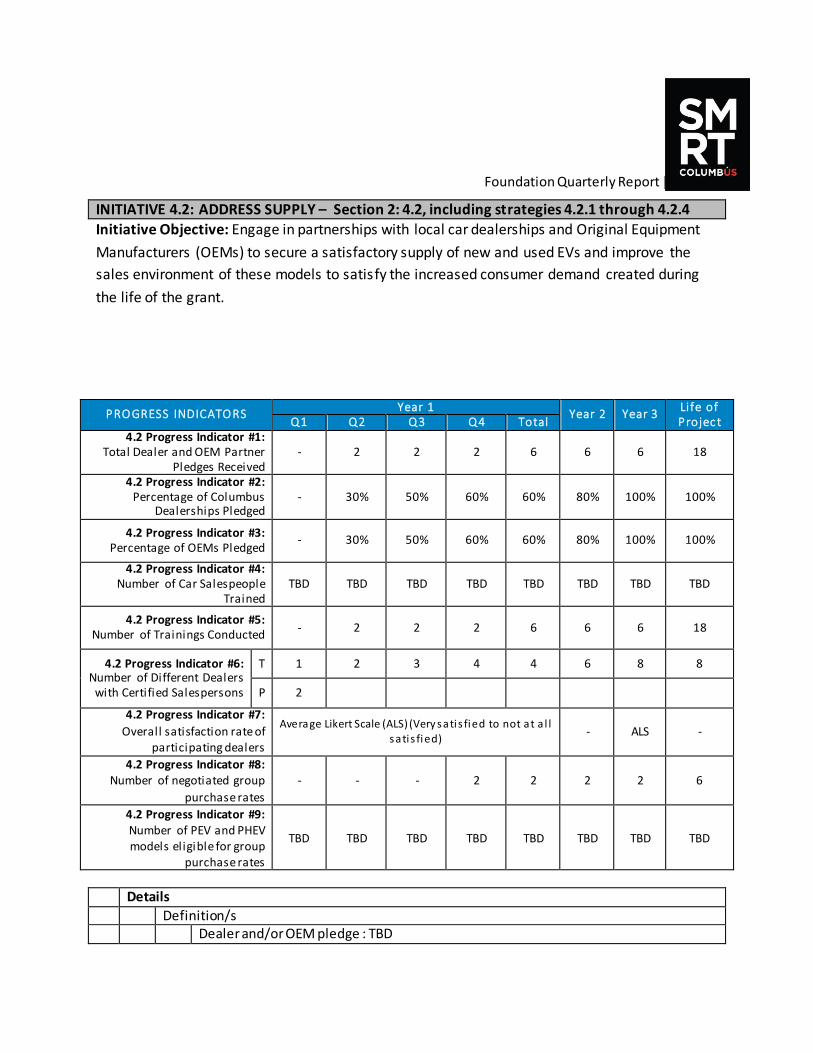
Foundation Quarterly Report | Q2 2017
INITIATIVE 4.2: ADDRESS SUPPLY – Section 2: 4.2, including strategies 4.2.1 through 4.2.4
Initiative Objective: Engage in partnerships with local car dealerships and Original Equipment
Manufacturers (OEMs) to secure a satisfactory supply of new and used EVs and improve the
sales environment of these models to satisfy the increased consumer demand created during
the life of the grant.
PRO GRESS INDICATO RS Year 1
Year 2 Year 3 Life of Project Q1 Q2 Q3 Q4 Total
4.2 Progress Indicator #1: Total Dealer and OEM Partner
Pledges Received - 2 2 2 6 6 6 18
4.2 Progress Indicator #2: Percentage of Columbus
Dealerships Pledged - 30% 50% 60% 60% 80% 100% 100%
4.2 Progress Indicator #3: Percentage of OEMs Pledged
- 30% 50% 60% 60% 80% 100% 100%
4.2 Progress Indicator #4: Number of Car Salespeople
Trained TBD TBD TBD TBD TBD TBD TBD TBD
4.2 Progress Indicator #5: Number of Trainings Conducted
- 2 2 2 6 6 6 18
4.2 Progress Indicator #6: Number of Different Dealers
with Certified Salespersons
T 1 2 3 4 4 6 8 8
P 2
4.2 Progress Indicator #7:
Overall satisfaction rate of participating dealers
Average Likert Scale (ALS) (Very satis fied to not at a l l satis fied)
- ALS -
4.2 Progress Indicator #8: Number of negotiated group
purchase rates
- - - 2 2 2 2 6
4.2 Progress Indicator #9: Number of PEV and PHEV models eligible for group
purchase rates
TBD TBD TBD TBD TBD TBD TBD TBD
Details
Definition/s Dealer and/or OEM pledge : TBD
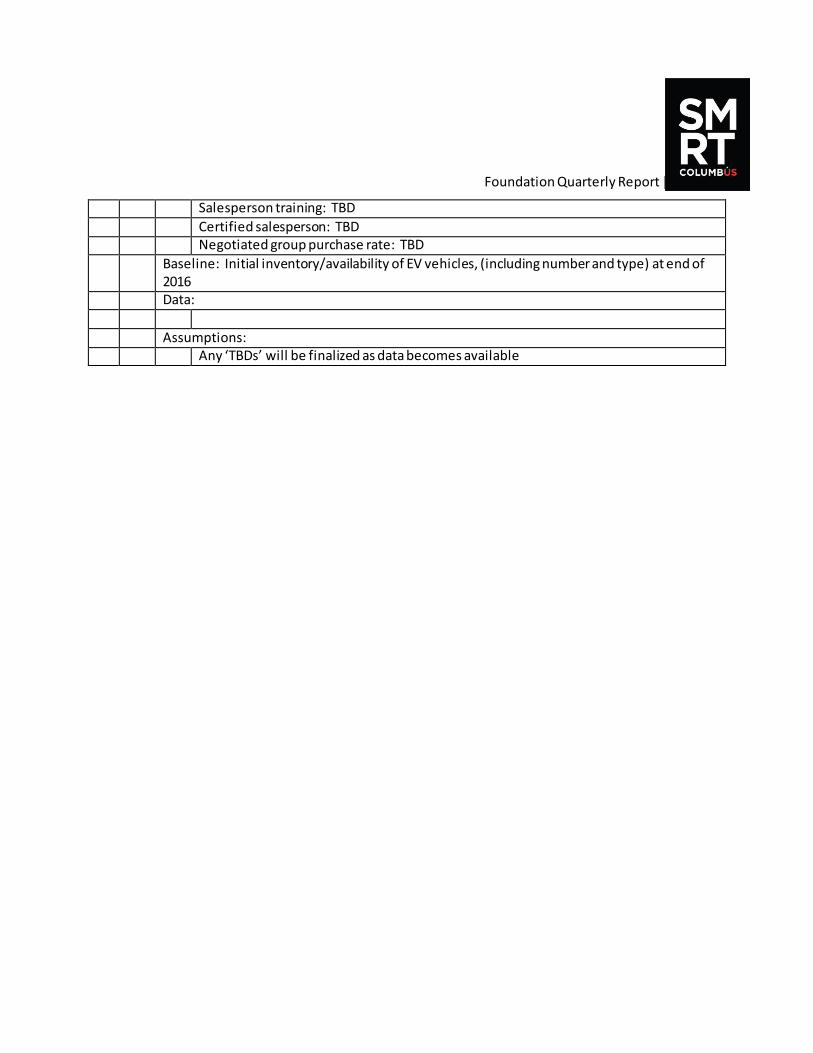
Foundation Quarterly Report | Q2 2017
Salesperson training: TBD
Certified salesperson: TBD Negotiated group purchase rate: TBD
Baseline: Initial inventory/availability of EV vehicles, (including number and type) at end of 2016
Data:
Assumptions: Any ‘TBDs’ will be finalized as data becomes available
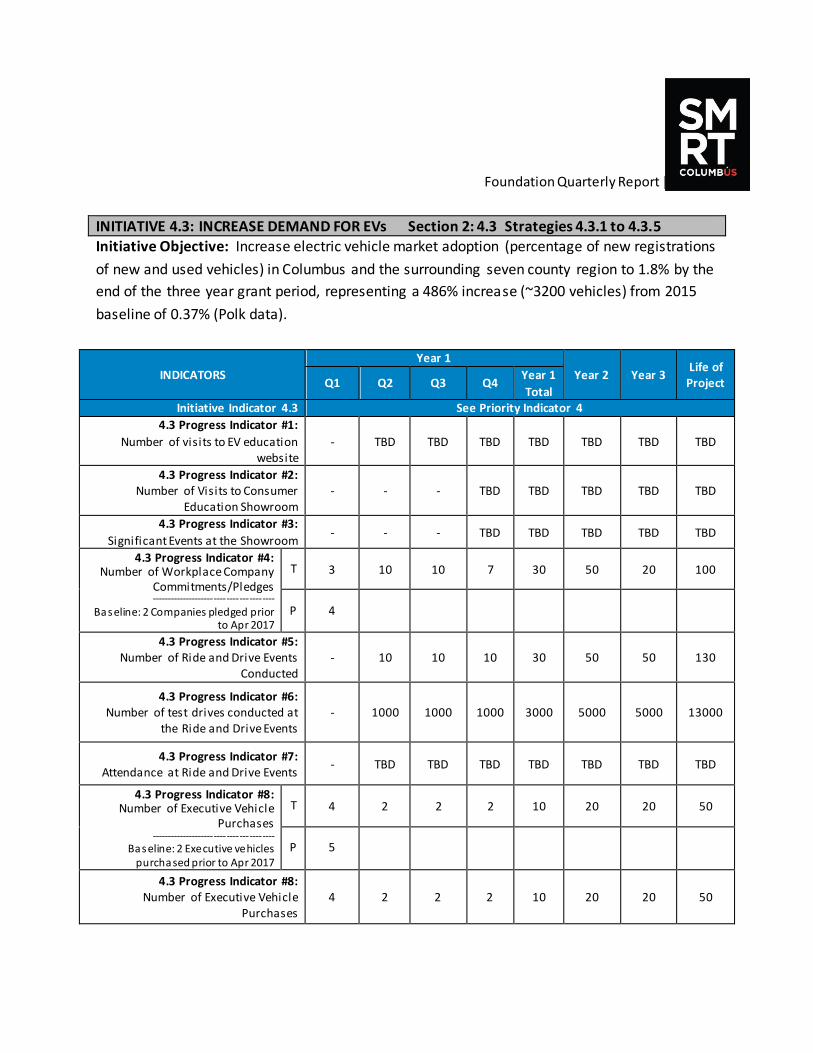
Foundation Quarterly Report | Q2 2017
INITIATIVE 4.3: INCREASE DEMAND FOR EVs Section 2: 4.3 Strategies 4.3.1 to 4.3.5 Initiative Objective: Increase electric vehicle market adoption (percentage of new registrations
of new and used vehicles) in Columbus and the surrounding seven county region to 1.8% by the
end of the three year grant period, representing a 486% increase (~3200 vehicles) from 2015
baseline of 0.37% (Polk data).
INDICATORS
Year 1
Year 2 Year 3 Life of
Project Q1 Q2 Q3 Q4 Year 1
Total Initiative Indicator 4.3 See Priority Indicator 4
4.3 Progress Indicator #1:
Number of visits to EV education website
- TBD TBD TBD TBD TBD TBD TBD
4.3 Progress Indicator #2: Number of Visits to Consumer
Education Showroom - - - TBD TBD TBD TBD TBD
4.3 Progress Indicator #3:
Significant Events at the Showroom - - - TBD TBD TBD TBD TBD
4.3 Progress Indicator #4: Number of Workplace Company
Commitments/Pledges ---------------------------------------
Baseline: 2 Companies pledged prior to Apr 2017
T 3 10 10 7 30 50 20 100
P 4
4.3 Progress Indicator #5: Number of Ride and Drive Events
Conducted - 10 10 10 30 50 50 130
4.3 Progress Indicator #6: Number of test drives conducted at
the Ride and Drive Events - 1000 1000 1000 3000 5000 5000 13000
4.3 Progress Indicator #7: Attendance at Ride and Drive Events
- TBD TBD TBD TBD TBD TBD TBD
4.3 Progress Indicator #8: Number of Executive Vehicle
Purchases ---------------------------------------
Baseline: 2 Executive vehicles purchased prior to Apr 2017
T 4 2 2 2 10 20 20 50
P 5
4.3 Progress Indicator #8: Number of Executive Vehicle
Purchases 4 2 2 2 10 20 20 50
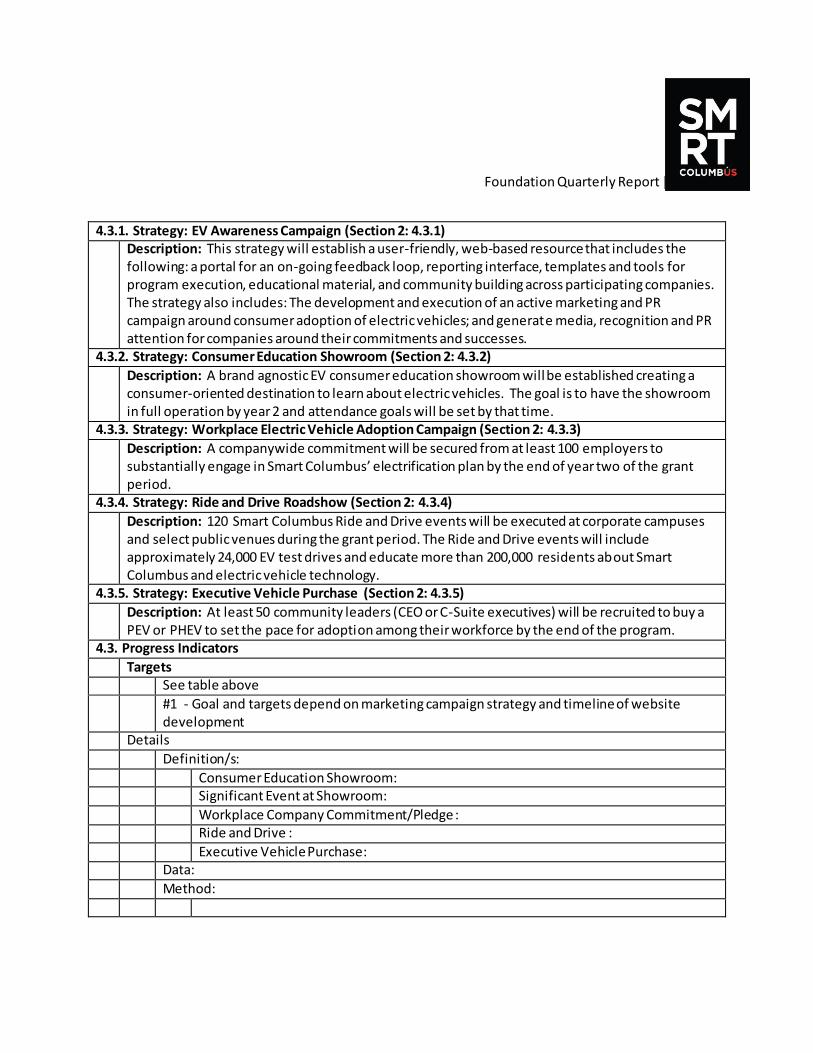
Foundation Quarterly Report | Q2 2017
4.3.1. Strategy: EV Awareness Campaign (Section 2: 4.3.1)
Description: This strategy will establish a user-friendly, web-based resource that includes the following: a portal for an on-going feedback loop, reporting interface, templates and tools for program execution, educational material, and community building across participating companies. The strategy also includes: The development and execution of an active marketing and PR campaign around consumer adoption of electric vehicles; and generate media, recognition and PR attention for companies around their commitments and successes.
4.3.2. Strategy: Consumer Education Showroom (Section 2: 4.3.2)
Description: A brand agnostic EV consumer education showroom will be established creating a consumer-oriented destination to learn about electric vehicles. The goal is to have the showroom in full operation by year 2 and attendance goals will be set by that time.
4.3.3. Strategy: Workplace Electric Vehicle Adoption Campaign (Section 2: 4.3.3)
Description: A companywide commitment will be secured from at least 100 employers to substantially engage in Smart Columbus’ electrification plan by the end of year two of the grant period.
4.3.4. Strategy: Ride and Drive Roadshow (Section 2: 4.3.4)
Description: 120 Smart Columbus Ride and Drive events will be executed at corporate campuses and select public venues during the grant period. The Ride and Drive events will include approximately 24,000 EV test drives and educate more than 200,000 residents about Smart Columbus and electric vehicle technology.
4.3.5. Strategy: Executive Vehicle Purchase (Section 2: 4.3.5)
Description: At least 50 community leaders (CEO or C-Suite executives) will be recruited to buy a PEV or PHEV to set the pace for adoption among their workforce by the end of the program.
4.3. Progress Indicators
Targets See table above
#1 - Goal and targets depend on marketing campaign strategy and timeline of website development
Details
Definition/s:
Consumer Education Showroom: Significant Event at Showroom:
Workplace Company Commitment/Pledge : Ride and Drive :
Executive Vehicle Purchase: Data:
Method:

Foundation Quarterly Report | Q2 2017
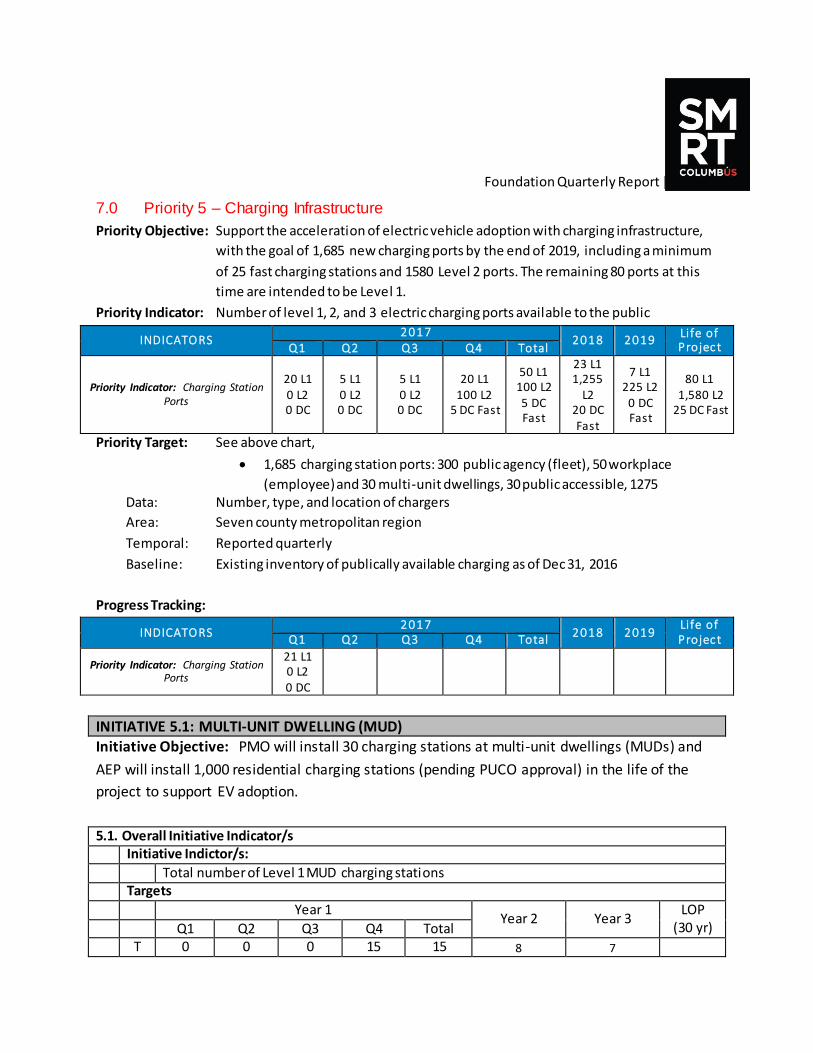
Foundation Quarterly Report | Q2 2017
7.0 Priority 5 – Charging Infrastructure
Priority Objective: Support the acceleration of electric vehicle adoption with charging infrastructure,
with the goal of 1,685 new charging ports by the end of 2019, including a minimum
of 25 fast charging stations and 1580 Level 2 ports. The remaining 80 ports at this
time are intended to be Level 1.
Priority Indicator: Number of level 1, 2, and 3 electric charging ports available to the public
INDICATO RS 2017
2018 2019 Life of Project Q1 Q2 Q3 Q4 Total
Priority Indicator: Charging Station Ports
20 L1 0 L2 0 DC
5 L1 0 L2 0 DC
5 L1 0 L2 0 DC
20 L1 100 L2
5 DC Fast
50 L1 100 L2 5 DC Fast
23 L1 1,255
L2 20 DC Fast
7 L1 225 L2
0 DC Fast
80 L1 1,580 L2 25 DC Fast
Priority Target: See above chart,
1,685 charging station ports: 300 public agency (fleet), 50 workplace
(employee) and 30 multi-unit dwellings, 30 public accessible, 1275 Data: Number, type, and location of chargers
Area: Seven county metropolitan region
Temporal: Reported quarterly
Baseline: Existing inventory of publically available charging as of Dec 31, 2016
Progress Tracking:
INDICATO RS 2017
2018 2019 Life of Project Q1 Q2 Q3 Q4 Total
Priority Indicator: Charging Station Ports
21 L1 0 L2 0 DC
INITIATIVE 5.1: MULTI-UNIT DWELLING (MUD) Initiative Objective: PMO will install 30 charging stations at multi-unit dwellings (MUDs) and
AEP will install 1,000 residential charging stations (pending PUCO approval) in the life of the
project to support EV adoption.
5.1. Overall Initiative Indicator/s Initiative Indictor/s:
Total number of Level 1 MUD charging stations Targets
Year 1 Year 2 Year 3
LOP (30 yr) Q1 Q2 Q3 Q4 Total
T 0 0 0 15 15 8 7
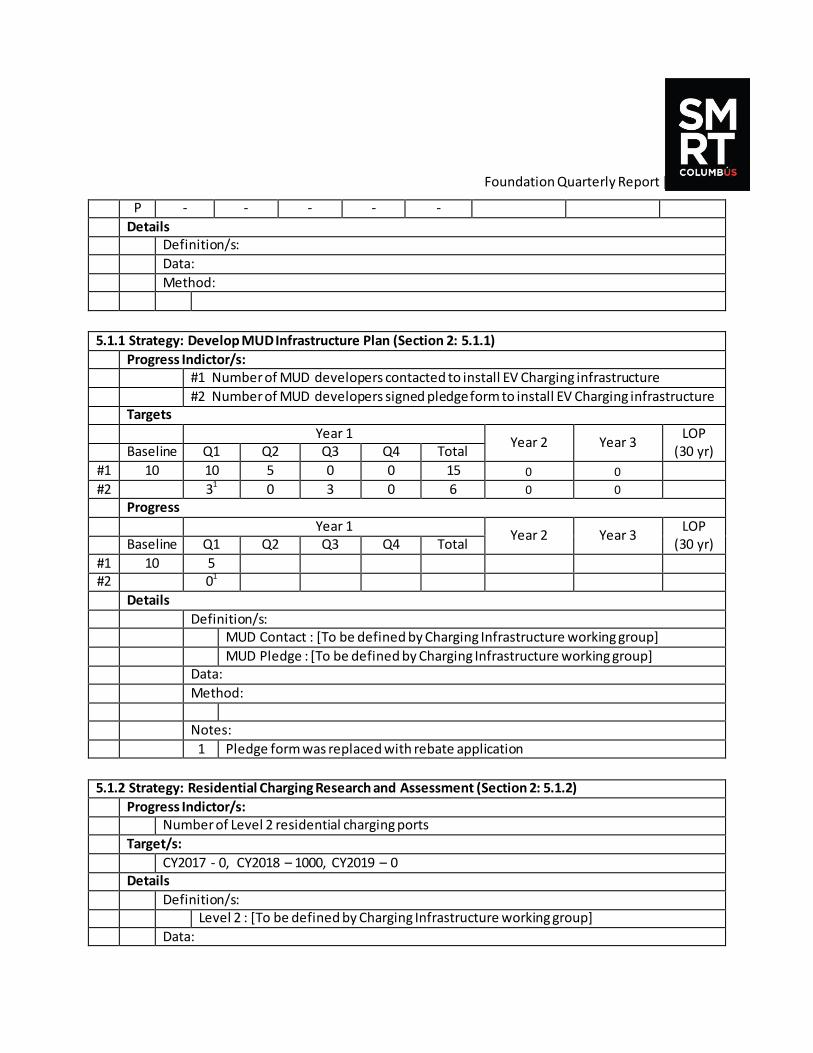
Foundation Quarterly Report | Q2 2017
P - - - - -
Details Definition/s:
Data:
Method:
5.1.1 Strategy: Develop MUD Infrastructure Plan (Section 2: 5.1.1)
Progress Indictor/s: #1 Number of MUD developers contacted to install EV Charging infrastructure
#2 Number of MUD developers signed pledge form to install EV Charging infrastructure Targets
Year 1 Year 2 Year 3
LOP (30 yr) Baseline Q1 Q2 Q3 Q4 Total
#1 10 10 5 0 0 15 0 0
#2 31 0 3 0 6 0 0 Progress
Year 1 Year 2 Year 3
LOP (30 yr) Baseline Q1 Q2 Q3 Q4 Total
#1 10 5 #2 01
Details
Definition/s: MUD Contact : [To be defined by Charging Infrastructure working group]
MUD Pledge : [To be defined by Charging Infrastructure working group] Data:
Method:
Notes:
1 Pledge form was replaced with rebate application
5.1.2 Strategy: Residential Charging Research and Assessment (Section 2: 5.1.2)
Progress Indictor/s: Number of Level 2 residential charging ports
Target/s:
CY2017 - 0, CY2018 – 1000, CY2019 – 0 Details
Definition/s: Level 2 : [To be defined by Charging Infrastructure working group]
Data:
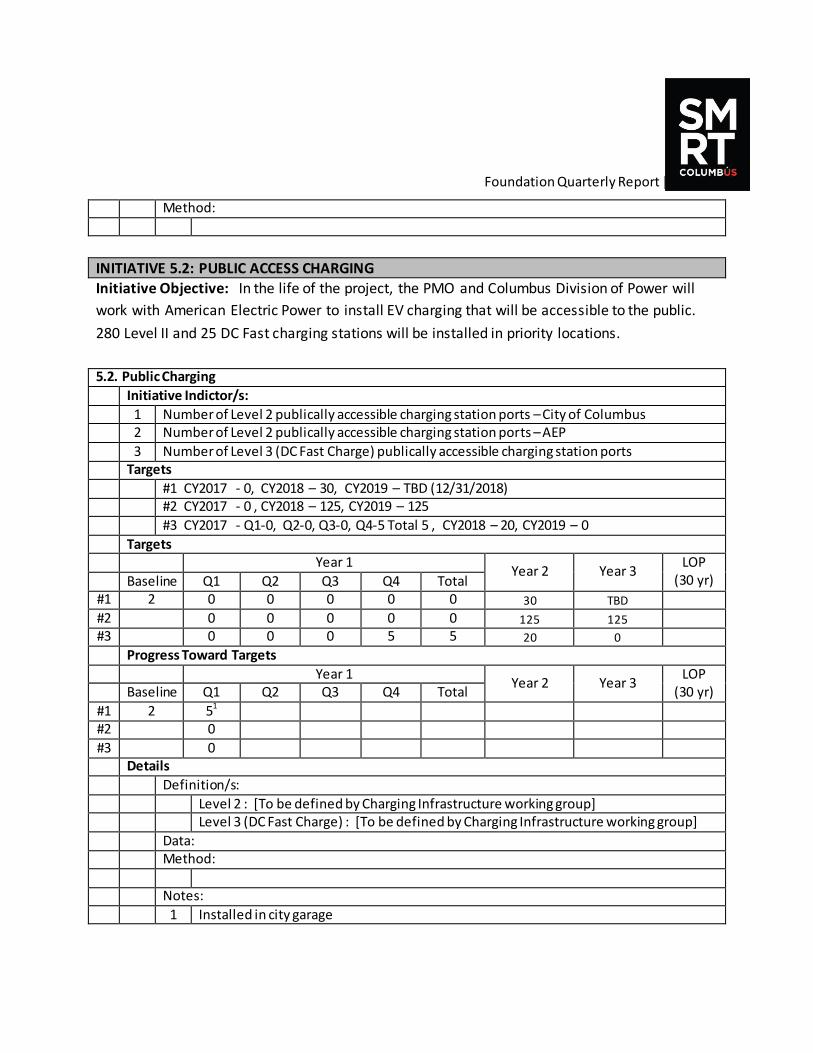
Foundation Quarterly Report | Q2 2017
Method:
INITIATIVE 5.2: PUBLIC ACCESS CHARGING Initiative Objective: In the life of the project, the PMO and Columbus Division of Power will
work with American Electric Power to install EV charging that will be accessible to the public.
280 Level II and 25 DC Fast charging stations will be installed in priority locations.
5.2. Public Charging
Initiative Indictor/s:
1 Number of Level 2 publically accessible charging station ports – City of Columbus 2 Number of Level 2 publically accessible charging station ports – AEP
3 Number of Level 3 (DC Fast Charge) publically accessible charging station ports Targets
#1 CY2017 - 0, CY2018 – 30, CY2019 – TBD (12/31/2018) #2 CY2017 - 0 , CY2018 – 125, CY2019 – 125
#3 CY2017 - Q1-0, Q2-0, Q3-0, Q4-5 Total 5 , CY2018 – 20, CY2019 – 0
Targets Year 1
Year 2 Year 3 LOP
(30 yr) Baseline Q1 Q2 Q3 Q4 Total #1 2 0 0 0 0 0 30 TBD
#2 0 0 0 0 0 125 125 #3 0 0 0 5 5 20 0
Progress Toward Targets
Year 1 Year 2 Year 3
LOP (30 yr) Baseline Q1 Q2 Q3 Q4 Total
#1 2 51 #2 0
#3 0 Details
Definition/s:
Level 2 : [To be defined by Charging Infrastructure working group] Level 3 (DC Fast Charge) : [To be defined by Charging Infrastructure working group]
Data: Method:
Notes:
1 Installed in city garage
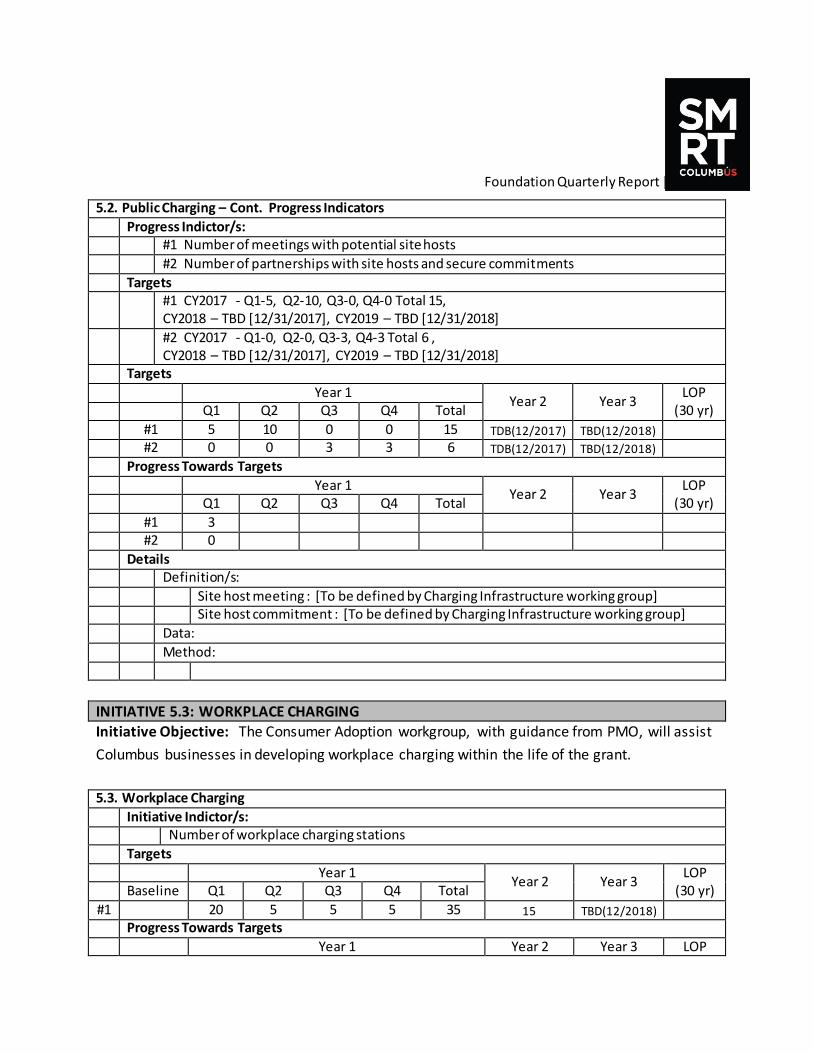
Foundation Quarterly Report | Q2 2017
5.2. Public Charging – Cont. Progress Indicators
Progress Indictor/s: #1 Number of meetings with potential site hosts
#2 Number of partnerships with site hosts and secure commitments
Targets #1 CY2017 - Q1-5, Q2-10, Q3-0, Q4-0 Total 15,
CY2018 – TBD [12/31/2017], CY2019 – TBD [12/31/2018]
#2 CY2017 - Q1-0, Q2-0, Q3-3, Q4-3 Total 6 , CY2018 – TBD [12/31/2017], CY2019 – TBD [12/31/2018]
Targets
Year 1 Year 2 Year 3
LOP (30 yr) Q1 Q2 Q3 Q4 Total
#1 5 10 0 0 15 TDB(12/2017) TBD(12/2018) #2 0 0 3 3 6 TDB(12/2017) TBD(12/2018)
Progress Towards Targets
Year 1 Year 2 Year 3
LOP (30 yr) Q1 Q2 Q3 Q4 Total
#1 3 #2 0
Details Definition/s:
Site host meeting : [To be defined by Charging Infrastructure working group] Site host commitment : [To be defined by Charging Infrastructure working group]
Data:
Method:
INITIATIVE 5.3: WORKPLACE CHARGING
Initiative Objective: The Consumer Adoption workgroup, with guidance from PMO, will assist
Columbus businesses in developing workplace charging within the life of the grant.
5.3. Workplace Charging
Initiative Indictor/s: Number of workplace charging stations
Targets
Year 1 Year 2 Year 3
LOP (30 yr) Baseline Q1 Q2 Q3 Q4 Total
#1 20 5 5 5 35 15 TBD(12/2018) Progress Towards Targets
Year 1 Year 2 Year 3 LOP
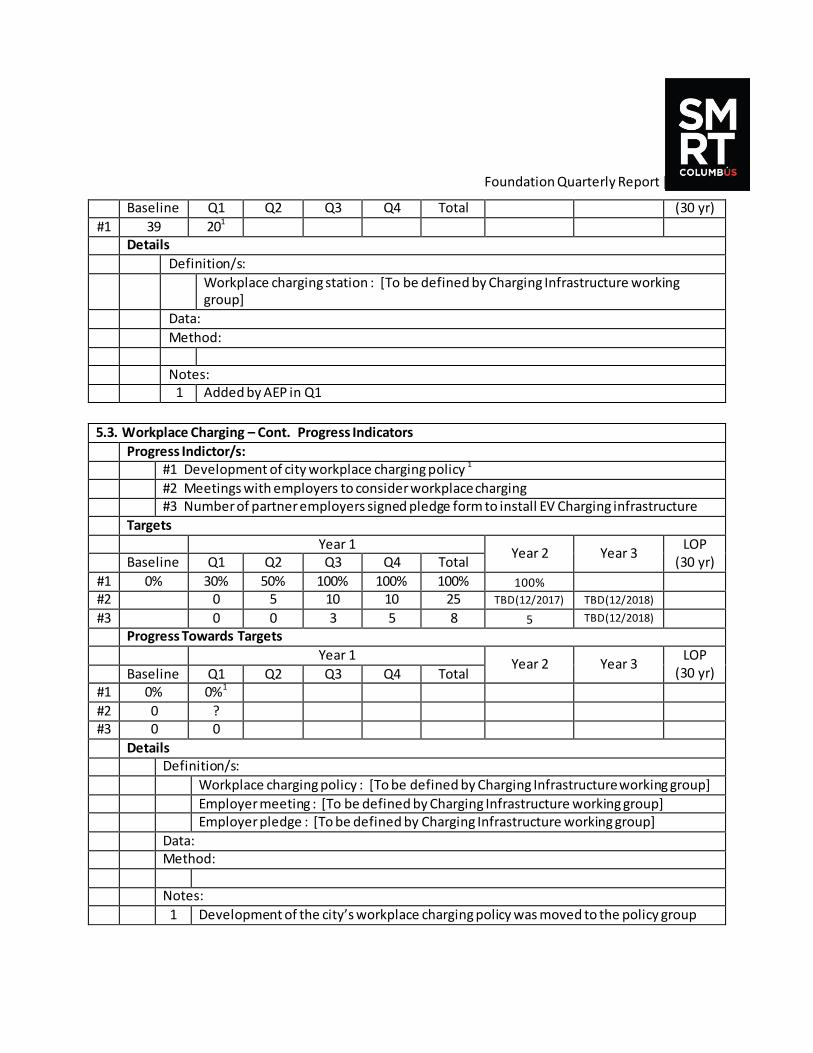
Foundation Quarterly Report | Q2 2017
Baseline Q1 Q2 Q3 Q4 Total (30 yr)
#1 39 201 Details
Definition/s:
Workplace charging station : [To be defined by Charging Infrastructure working group]
Data:
Method:
Notes: 1 Added by AEP in Q1
5.3. Workplace Charging – Cont. Progress Indicators
Progress Indictor/s: #1 Development of city workplace charging policy 1
#2 Meetings with employers to consider workplace charging #3 Number of partner employers signed pledge form to install EV Charging infrastructure
Targets
Year 1 Year 2 Year 3
LOP (30 yr) Baseline Q1 Q2 Q3 Q4 Total
#1 0% 30% 50% 100% 100% 100% 100% #2 0 5 10 10 25 TBD(12/2017) TBD(12/2018)
#3 0 0 3 5 8 5 TBD(12/2018) Progress Towards Targets
Year 1 Year 2 Year 3
LOP (30 yr) Baseline Q1 Q2 Q3 Q4 Total
#1 0% 0%1
#2 0 ? #3 0 0
Details Definition/s:
Workplace charging policy : [To be defined by Charging Infrastructure working group]
Employer meeting : [To be defined by Charging Infrastructure working group] Employer pledge : [To be defined by Charging Infrastructure working group]
Data: Method:
Notes:
1 Development of the city’s workplace charging policy was moved to the policy group
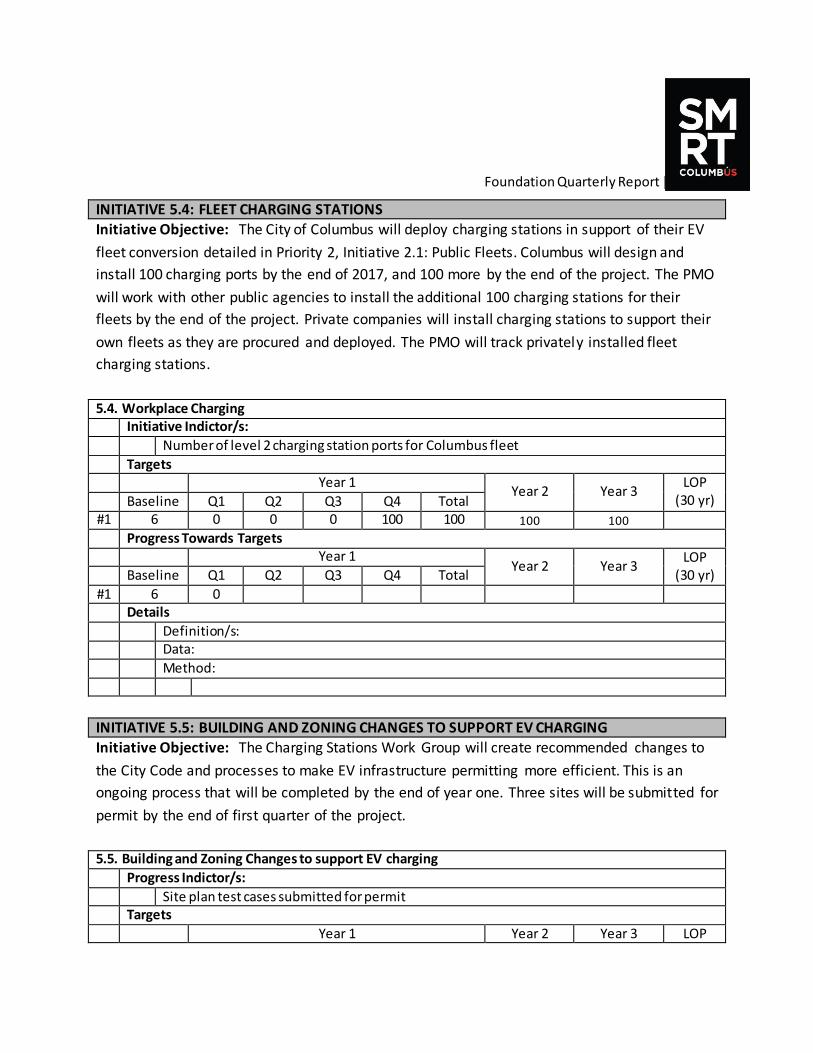
Foundation Quarterly Report | Q2 2017
INITIATIVE 5.4: FLEET CHARGING STATIONS
Initiative Objective: The City of Columbus will deploy charging stations in support of their EV
fleet conversion detailed in Priority 2, Initiative 2.1: Public Fleets. Columbus will design and
install 100 charging ports by the end of 2017, and 100 more by the end of the project. The PMO
will work with other public agencies to install the additional 100 charging stations for their
fleets by the end of the project. Private companies will install charging stations to support their
own fleets as they are procured and deployed. The PMO will track privately installed fleet
charging stations.
5.4. Workplace Charging Initiative Indictor/s:
Number of level 2 charging station ports for Columbus fleet
Targets Year 1
Year 2 Year 3 LOP
(30 yr) Baseline Q1 Q2 Q3 Q4 Total #1 6 0 0 0 100 100 100 100
Progress Towards Targets Year 1
Year 2 Year 3 LOP
(30 yr) Baseline Q1 Q2 Q3 Q4 Total
#1 6 0 Details
Definition/s: Data:
Method:
INITIATIVE 5.5: BUILDING AND ZONING CHANGES TO SUPPORT EV CHARGING Initiative Objective: The Charging Stations Work Group will create recommended changes to
the City Code and processes to make EV infrastructure permitting more efficient. This is an
ongoing process that will be completed by the end of year one. Three sites will be submitted for
permit by the end of first quarter of the project.
5.5. Building and Zoning Changes to support EV charging
Progress Indictor/s:
Site plan test cases submitted for permit Targets
Year 1 Year 2 Year 3 LOP
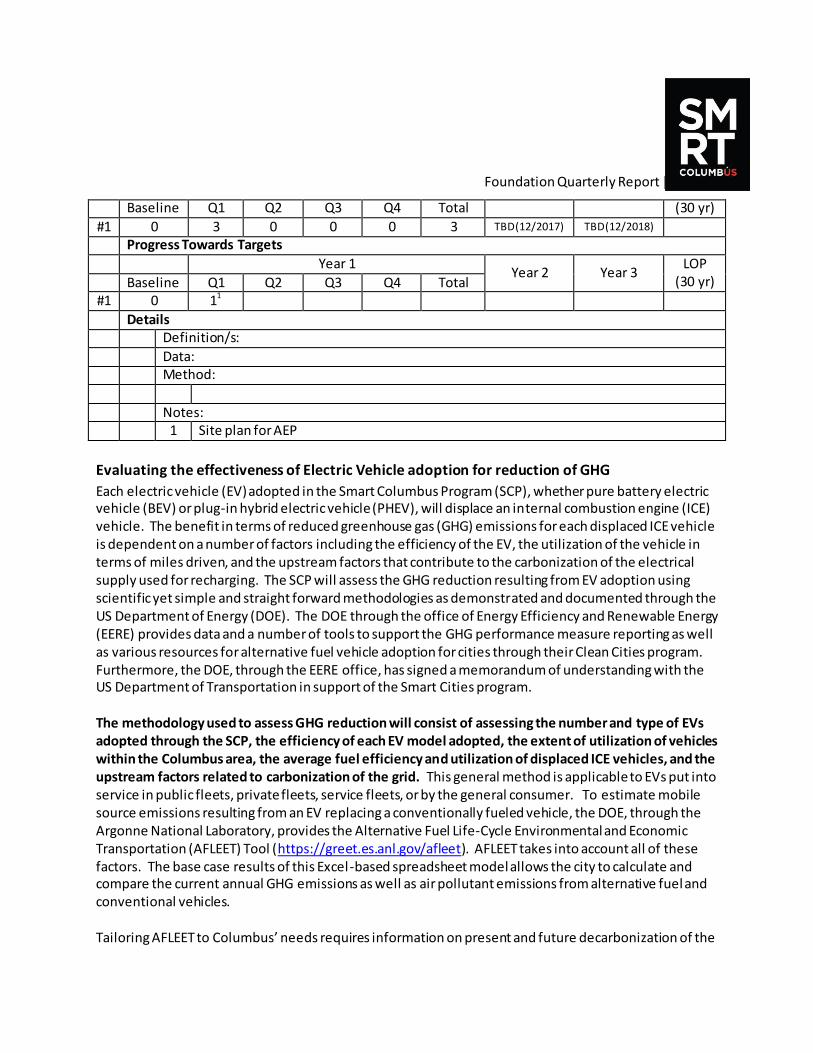
Foundation Quarterly Report | Q2 2017
Baseline Q1 Q2 Q3 Q4 Total (30 yr)
#1 0 3 0 0 0 3 TBD(12/2017) TBD(12/2018) Progress Towards Targets
Year 1 Year 2 Year 3
LOP (30 yr) Baseline Q1 Q2 Q3 Q4 Total
#1 0 11
Details Definition/s:
Data: Method:
Notes: 1 Site plan for AEP
Evaluating the effectiveness of Electric Vehicle adoption for reduction of GHG
Each electric vehicle (EV) adopted in the Smart Columbus Program (SCP), whether pure battery electric vehicle (BEV) or plug-in hybrid electric vehicle (PHEV), will displace an internal combustion engine (ICE) vehicle. The benefit in terms of reduced greenhouse gas (GHG) emissions for each displaced ICE vehicle is dependent on a number of factors including the efficiency of the EV, the utilization of the vehicle in terms of miles driven, and the upstream factors that contribute to the carbonization of the electrical supply used for recharging. The SCP will assess the GHG reduction resulting from EV adoption using scientific yet simple and straight forward methodologies as demonstrated and documented through the US Department of Energy (DOE). The DOE through the office of Energy Efficiency and Renewable Energy (EERE) provides data and a number of tools to support the GHG performance measure reporting as well as various resources for alternative fuel vehicle adoption for cities through their Clean Cities program. Furthermore, the DOE, through the EERE office, has signed a memorandum of understanding with the US Department of Transportation in support of the Smart Cities program. The methodology used to assess GHG reduction will consist of assessing the number and type of EVs adopted through the SCP, the efficiency of each EV model adopted, the extent of utilization of vehicles within the Columbus area, the average fuel efficiency and utilization of displaced ICE vehicles, and the upstream factors related to carbonization of the grid. This general method is applicable to EVs put into service in public fleets, private fleets, service fleets, or by the general consumer. To estimate mobile source emissions resulting from an EV replacing a conventionally fueled vehicle, the DOE, through the Argonne National Laboratory, provides the Alternative Fuel Life-Cycle Environmental and Economic Transportation (AFLEET) Tool (https://greet.es.anl.gov/afleet). AFLEET takes into account all of these factors. The base case results of this Excel-based spreadsheet model allows the city to calculate and compare the current annual GHG emissions as well as air pollutant emissions from alternative fuel and conventional vehicles. Tailoring AFLEET to Columbus’ needs requires information on present and future decarbonization of the
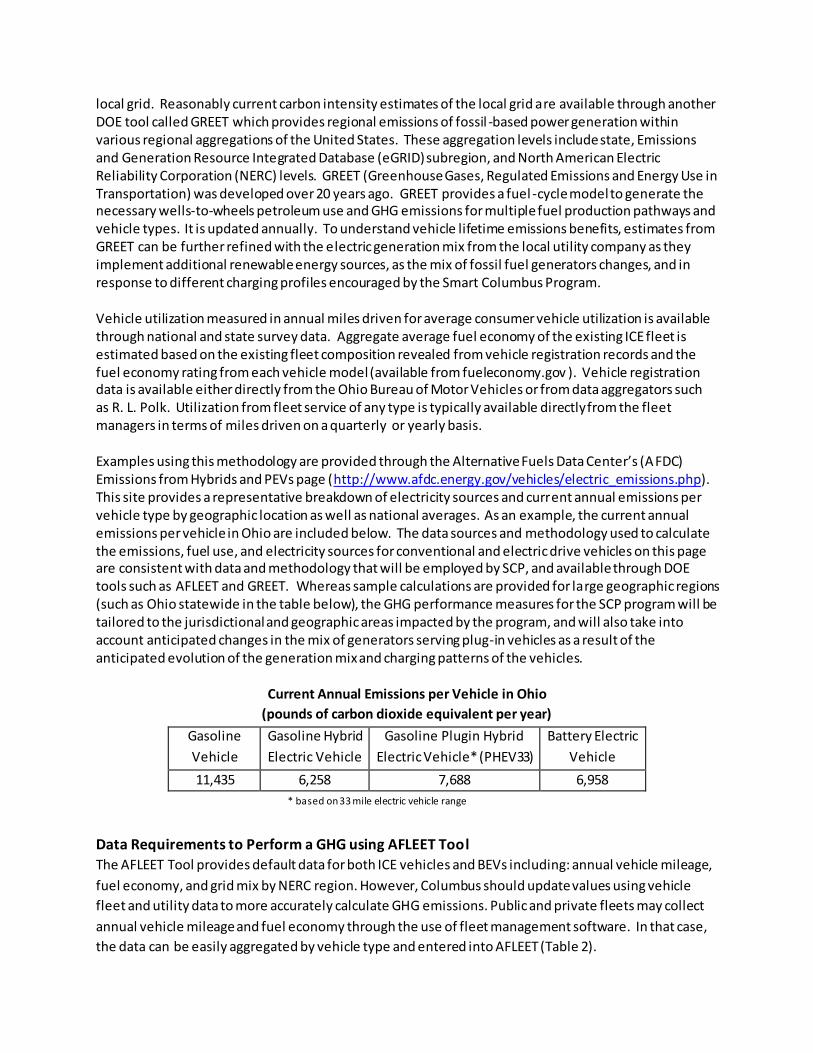
local grid. Reasonably current carbon intensity estimates of the local grid are available through another DOE tool called GREET which provides regional emissions of fossil -based power generation within various regional aggregations of the United States. These aggregation levels include state, Emissions and Generation Resource Integrated Database (eGRID) subregion, and North American Electric Reliability Corporation (NERC) levels. GREET (Greenhouse Gases, Regulated Emissions and Energy Use in Transportation) was developed over 20 years ago. GREET provides a fuel -cycle model to generate the necessary wells-to-wheels petroleum use and GHG emissions for multiple fuel production pathways and vehicle types. It is updated annually. To understand vehicle lifetime emissions benefits, estimates from GREET can be further refined with the electric generation mix from the local utility company as they implement additional renewable energy sources, as the mix of fossil fuel generators changes, and in response to different charging profiles encouraged by the Smart Columbus Program.
Vehicle utilization measured in annual miles driven for average consumer vehicle utilization is available through national and state survey data. Aggregate average fuel economy of the existing ICE fleet is estimated based on the existing fleet composition revealed from vehicle registration records and the fuel economy rating from each vehicle model (available from fueleconomy.gov ). Vehicle registration data is available either directly from the Ohio Bureau of Motor Vehicles or from data aggregators such as R. L. Polk. Utilization from fleet service of any type is typically available directly from the fleet managers in terms of miles driven on a quarterly or yearly basis. Examples using this methodology are provided through the Alternative Fuels Data Center’s (AFDC) Emissions from Hybrids and PEVs page (http://www.afdc.energy.gov/vehicles/electric_emissions.php). This site provides a representative breakdown of electricity sources and current annual emissions per vehicle type by geographic location as well as national averages. As an example, the current annual emissions per vehicle in Ohio are included below. The data sources and methodology used to calculate the emissions, fuel use, and electricity sources for conventional and electric drive vehicles on this page are consistent with data and methodology that will be employed by SCP, and available through DOE tools such as AFLEET and GREET. Whereas sample calculations are provided for large geographic regions (such as Ohio statewide in the table below), the GHG performance measures for the SCP program will be tailored to the jurisdictional and geographic areas impacted by the program, and will also take into account anticipated changes in the mix of generators serving plug-in vehicles as a result of the anticipated evolution of the generation mix and charging patterns of the vehicles.
Current Annual Emissions per Vehicle in Ohio
(pounds of carbon dioxide equivalent per year)
Gasoline
Vehicle
Gasoline Hybrid
Electric Vehicle
Gasoline Plugin Hybrid
Electric Vehicle* (PHEV33)
Battery Electric
Vehicle
11,435 6,258 7,688 6,958
* based on 33 mile electric vehicle range
Data Requirements to Perform a GHG using AFLEET Tool
The AFLEET Tool provides default data for both ICE vehicles and BEVs including: annual vehicle mileage,
fuel economy, and grid mix by NERC region. However, Columbus should update values using vehicle
fleet and utility data to more accurately calculate GHG emissions. Public and private fleets may collect
annual vehicle mileage and fuel economy through the use of fleet management software. In that case,
the data can be easily aggregated by vehicle type and entered into AFLEET (Table 2).
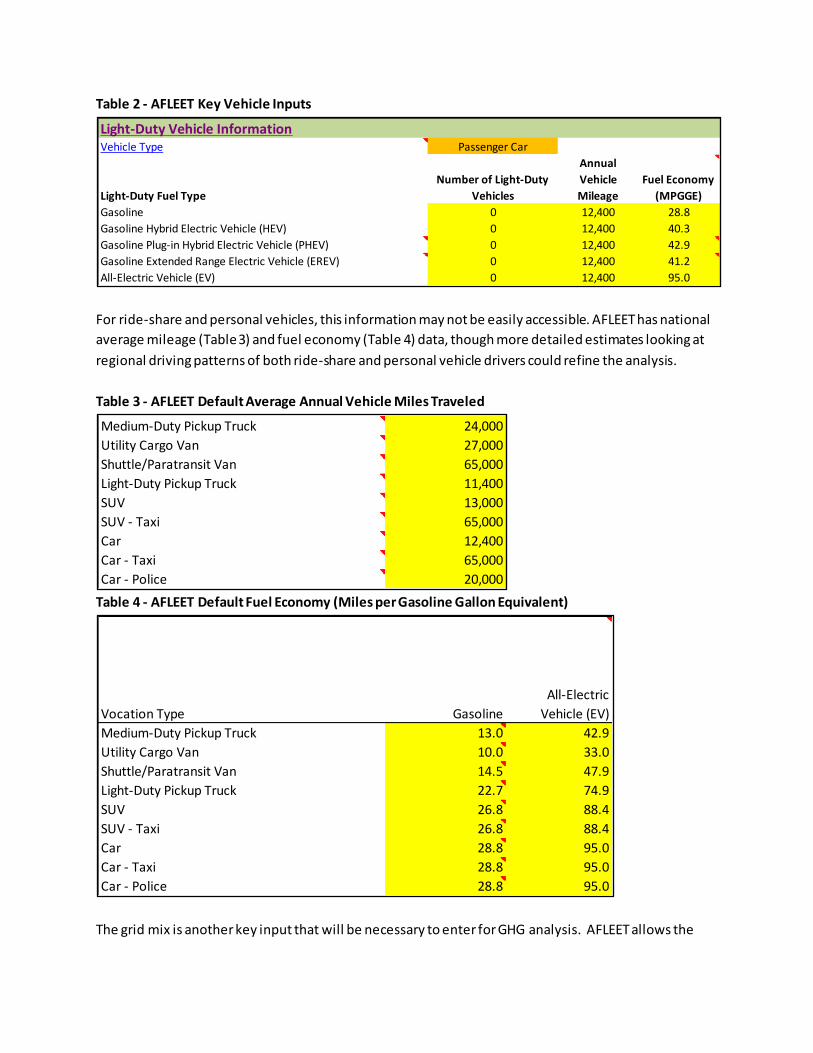
Table 2 - AFLEET Key Vehicle Inputs
For ride-share and personal vehicles, this information may not be easily accessible. AFLEET has national
average mileage (Table 3) and fuel economy (Table 4) data, though more detailed estimates looking at
regional driving patterns of both ride-share and personal vehicle drivers could refine the analysis.
Table 3 - AFLEET Default Average Annual Vehicle Miles Traveled
Table 4 - AFLEET Default Fuel Economy (Miles per Gasoline Gallon Equivalent)
The grid mix is another key input that will be necessary to enter for GHG analysis. AFLEET allows the
Light-Duty Vehicle InformationVehicle Type Passenger Car
Light-Duty Fuel Type
Number of Light-Duty
Vehicles
Annual
Vehicle
Mileage
Fuel Economy
(MPGGE)
Gasoline 0 12,400 28.8
Gasoline Hybrid Electric Vehicle (HEV) 0 12,400 40.3
Gasoline Plug-in Hybrid Electric Vehicle (PHEV) 0 12,400 42.9
Gasoline Extended Range Electric Vehicle (EREV) 0 12,400 41.2
All-Electric Vehicle (EV) 0 12,400 95.0
Medium-Duty Pickup Truck 24,000
Utility Cargo Van 27,000
Shuttle/Paratransit Van 65,000
Light-Duty Pickup Truck 11,400
SUV 13,000
SUV - Taxi 65,000
Car 12,400
Car - Taxi 65,000
Car - Police 20,000
Vocation Type Gasoline
All-Electric
Vehicle (EV)
Medium-Duty Pickup Truck 13.0 42.9
Utility Cargo Van 10.0 33.0
Shuttle/Paratransit Van 14.5 47.9
Light-Duty Pickup Truck 22.7 74.9
SUV 26.8 88.4
SUV - Taxi 26.8 88.4
Car 28.8 95.0
Car - Taxi 28.8 95.0
Car - Police 28.8 95.0
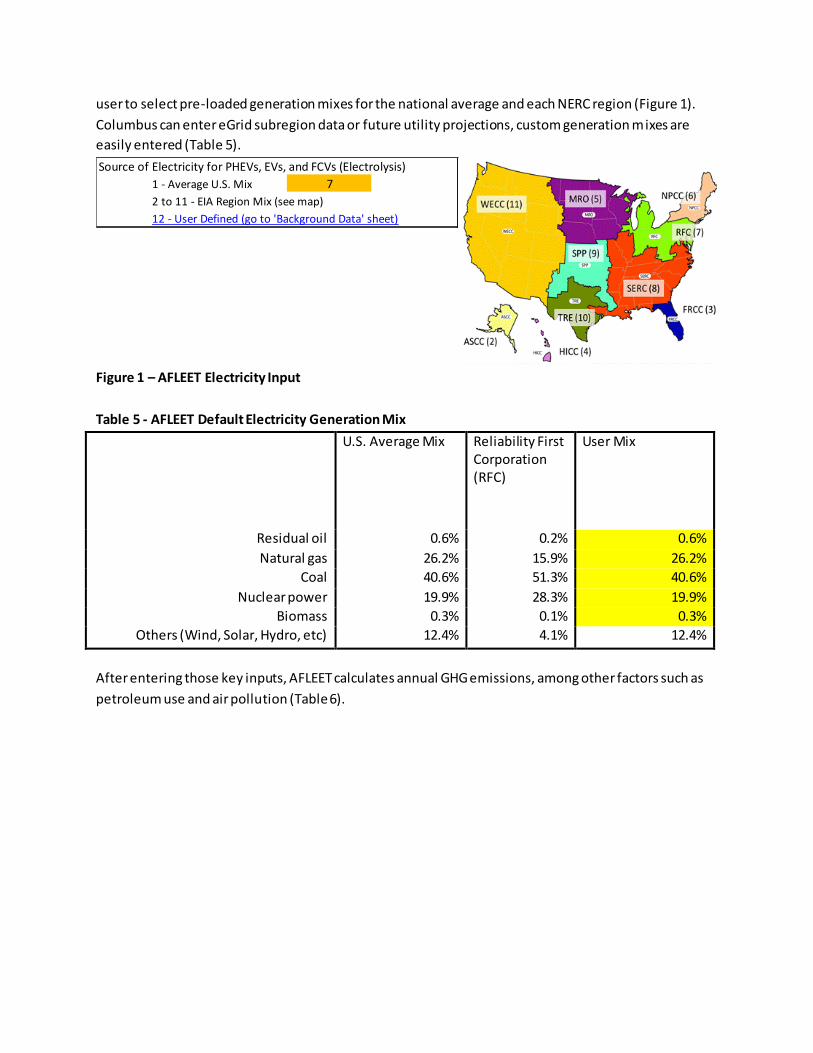
user to select pre-loaded generation mixes for the national average and each NERC region (Figure 1).
Columbus can enter eGrid subregion data or future utility projections, custom generation mixes are
easily entered (Table 5).
Figure 1 – AFLEET Electricity Input
Table 5 - AFLEET Default Electricity Generation Mix
U.S. Average Mix Reliability First Corporation (RFC)
User Mix
Residual oil 0.6% 0.2% 0.6%
Natural gas 26.2% 15.9% 26.2%
Coal 40.6% 51.3% 40.6%
Nuclear power 19.9% 28.3% 19.9%
Biomass 0.3% 0.1% 0.3%
Others (Wind, Solar, Hydro, etc) 12.4% 4.1% 12.4%
After entering those key inputs, AFLEET calculates annual GHG emissions, among other factors such as
petroleum use and air pollution (Table 6).
Source of Electricity for PHEVs, EVs, and FCVs (Electrolysis)
1 - Average U.S. Mix 7
2 to 11 - EIA Region Mix (see map)
12 - User Defined (go to 'Background Data' sheet)
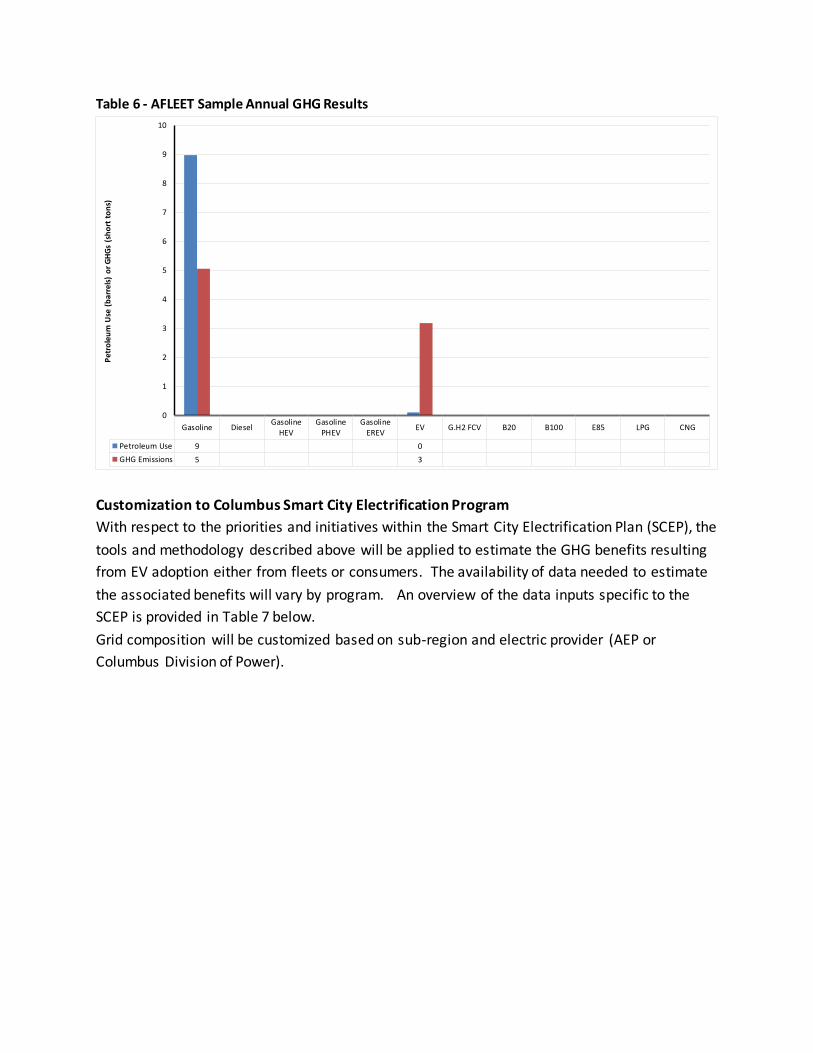
Table 6 - AFLEET Sample Annual GHG Results
Customization to Columbus Smart City Electrification Program
With respect to the priorities and initiatives within the Smart City Electrification Plan (SCEP), the
tools and methodology described above will be applied to estimate the GHG benefits resulting
from EV adoption either from fleets or consumers. The availability of data needed to estimate
the associated benefits will vary by program. An overview of the data inputs specific to the
SCEP is provided in Table 7 below.
Grid composition will be customized based on sub-region and electric provider (AEP or
Columbus Division of Power).
Gasoline DieselGasoline
HEVGasoline
PHEVGasoline
EREVEV G.H2 FCV B20 B100 E85 LPG CNG
Petroleum Use 9 0
GHG Emissions 5 3
0
1
2
3
4
5
6
7
8
9
10
Pet
role
um
Use
(b
arre
ls)
or
GH
Gs
(sh
ort
to
ns)
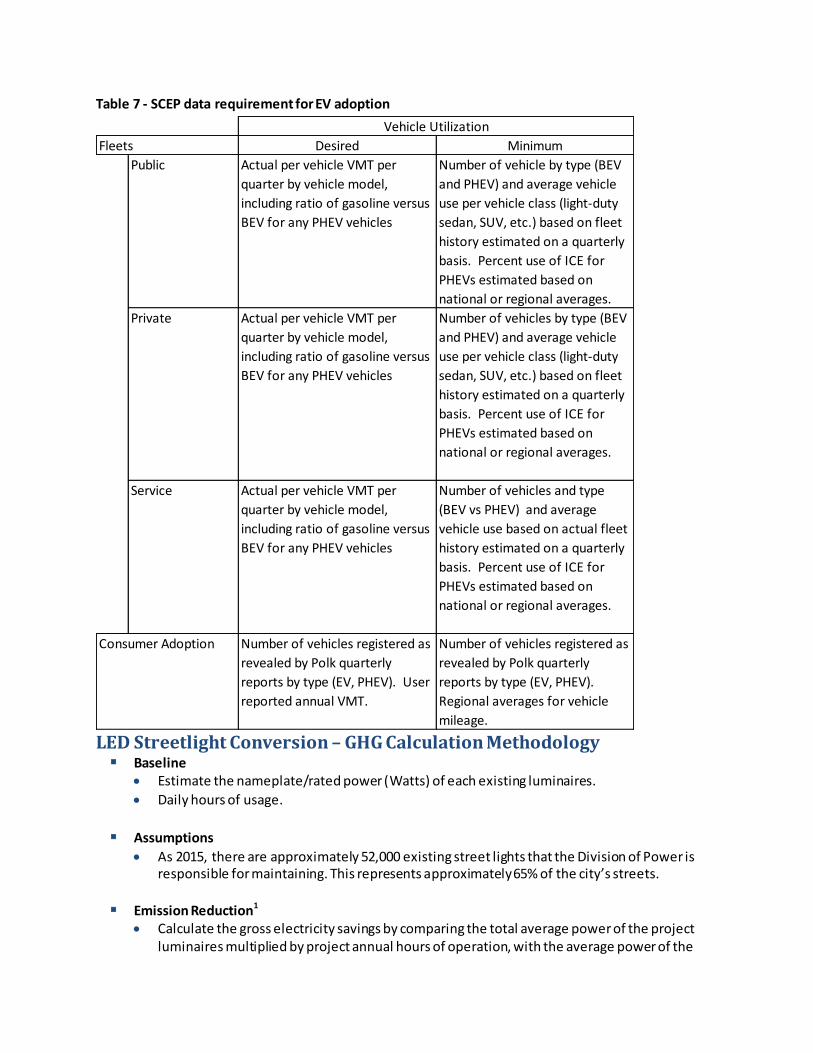
Table 7 - SCEP data requirement for EV adoption
LED Streetlight Conversion – GHG Calculation Methodology Baseline
Estimate the nameplate/rated power (Watts) of each existing luminaires.
Daily hours of usage.
Assumptions
As 2015, there are approximately 52,000 existing street lights that the Division of Power is responsible for maintaining. This represents approximately 65% of the city’s streets.
Emission Reduction1 Calculate the gross electricity savings by comparing the total average power of the project
luminaires multiplied by project annual hours of operation, with the average power of the
Fleets Desired Minimum
Public Actual per vehicle VMT per
quarter by vehicle model,
including ratio of gasoline versus
BEV for any PHEV vehicles
Number of vehicle by type (BEV
and PHEV) and average vehicle
use per vehicle class (light-duty
sedan, SUV, etc.) based on fleet
history estimated on a quarterly
basis. Percent use of ICE for
PHEVs estimated based on
national or regional averages.
Private Actual per vehicle VMT per
quarter by vehicle model,
including ratio of gasoline versus
BEV for any PHEV vehicles
Number of vehicles by type (BEV
and PHEV) and average vehicle
use per vehicle class (light-duty
sedan, SUV, etc.) based on fleet
history estimated on a quarterly
basis. Percent use of ICE for
PHEVs estimated based on
national or regional averages.
Service Actual per vehicle VMT per
quarter by vehicle model,
including ratio of gasoline versus
BEV for any PHEV vehicles
Number of vehicles and type
(BEV vs PHEV) and average
vehicle use based on actual fleet
history estimated on a quarterly
basis. Percent use of ICE for
PHEVs estimated based on
national or regional averages.
Consumer Adoption Number of vehicles registered as
revealed by Polk quarterly
reports by type (EV, PHEV). User
reported annual VMT.
Number of vehicles registered as
revealed by Polk quarterly
reports by type (EV, PHEV).
Regional averages for vehicle
mileage.
Vehicle Utilization
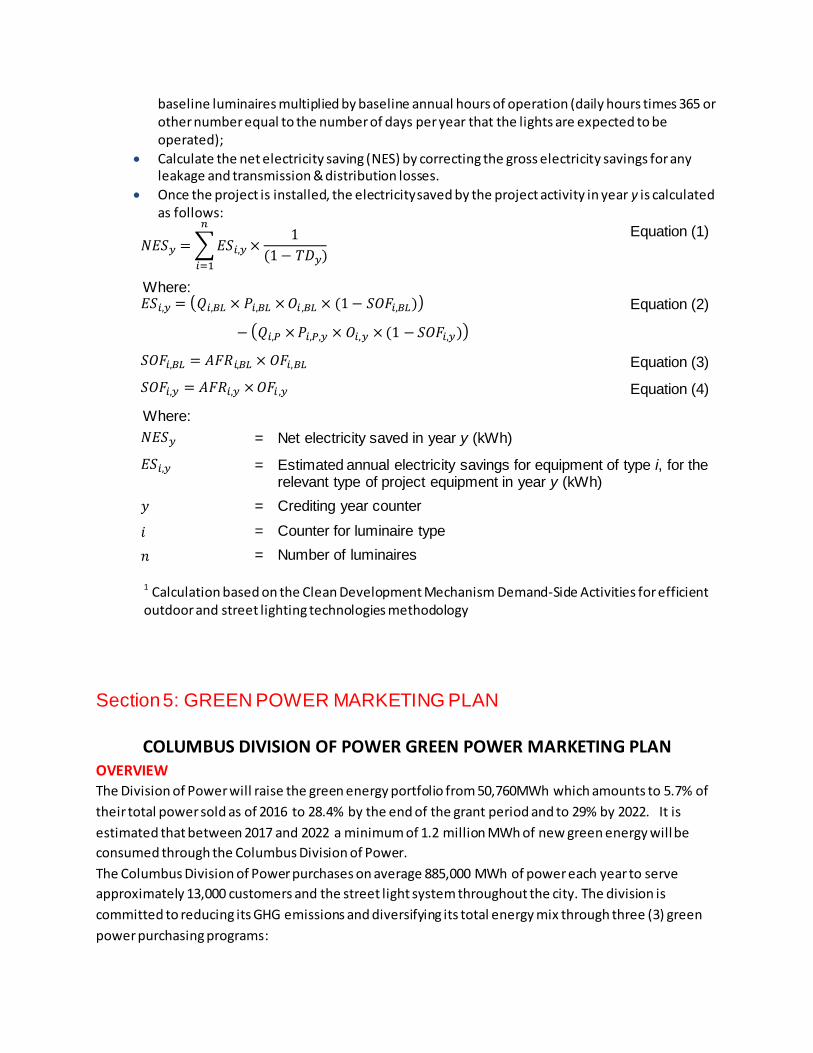
baseline luminaires multiplied by baseline annual hours of operation (daily hours times 365 or other number equal to the number of days per year that the lights are expected to be operated);
Calculate the net electricity saving (NES) by correcting the gross electricity savings for any leakage and transmission & distribution losses.
Once the project is installed, the electricity saved by the project activity in year y is calculated as follows:
𝑁𝐸𝑆𝑦 =∑𝐸𝑆𝑖,𝑦×1
(1− 𝑇𝐷𝑦)
𝑛
𝑖=1
Equation (1)
Where: 𝐸𝑆𝑖,𝑦 = (𝑄𝑖,𝐵𝐿 × 𝑃𝑖,𝐵𝐿 ×𝑂𝑖 ,𝐵𝐿 × (1− 𝑆𝑂𝐹𝑖,𝐵𝐿))
− (𝑄𝑖,𝑃 ×𝑃𝑖,𝑃,𝑦 × 𝑂𝑖,𝑦 ×(1 − 𝑆𝑂𝐹𝑖,𝑦))
Equation (2)
𝑆𝑂𝐹𝑖,𝐵𝐿 = 𝐴𝐹𝑅𝑖,𝐵𝐿 × 𝑂𝐹𝑖,𝐵𝐿 Equation (3)
𝑆𝑂𝐹𝑖,𝑦 = 𝐴𝐹𝑅𝑖,𝑦 ×𝑂𝐹𝑖 ,𝑦 Equation (4)
Where:
𝑁𝐸𝑆𝑦 = Net electricity saved in year y (kWh)
𝐸𝑆𝑖,𝑦 = Estimated annual electricity savings for equipment of type i, for the relevant type of project equipment in year y (kWh)
𝑦 = Crediting year counter
𝑖 = Counter for luminaire type
𝑛 = Number of luminaires
1 Calculation based on the Clean Development Mechanism Demand-Side Activities for efficient outdoor and street lighting technologies methodology
Section 5: GREEN POWER MARKETING PLAN
COLUMBUS DIVISION OF POWER GREEN POWER MARKETING PLAN OVERVIEW
The Division of Power will raise the green energy portfolio from 50,760MWh which amounts to 5.7% of
their total power sold as of 2016 to 28.4% by the end of the grant period and to 29% by 2022. It is
estimated that between 2017 and 2022 a minimum of 1.2 million MWh of new green energy will be
consumed through the Columbus Division of Power.
The Columbus Division of Power purchases on average 885,000 MWh of power each year to serve
approximately 13,000 customers and the street light system throughout the city. The division is
committed to reducing its GHG emissions and diversifying its total energy mix through three (3) green
power purchasing programs:
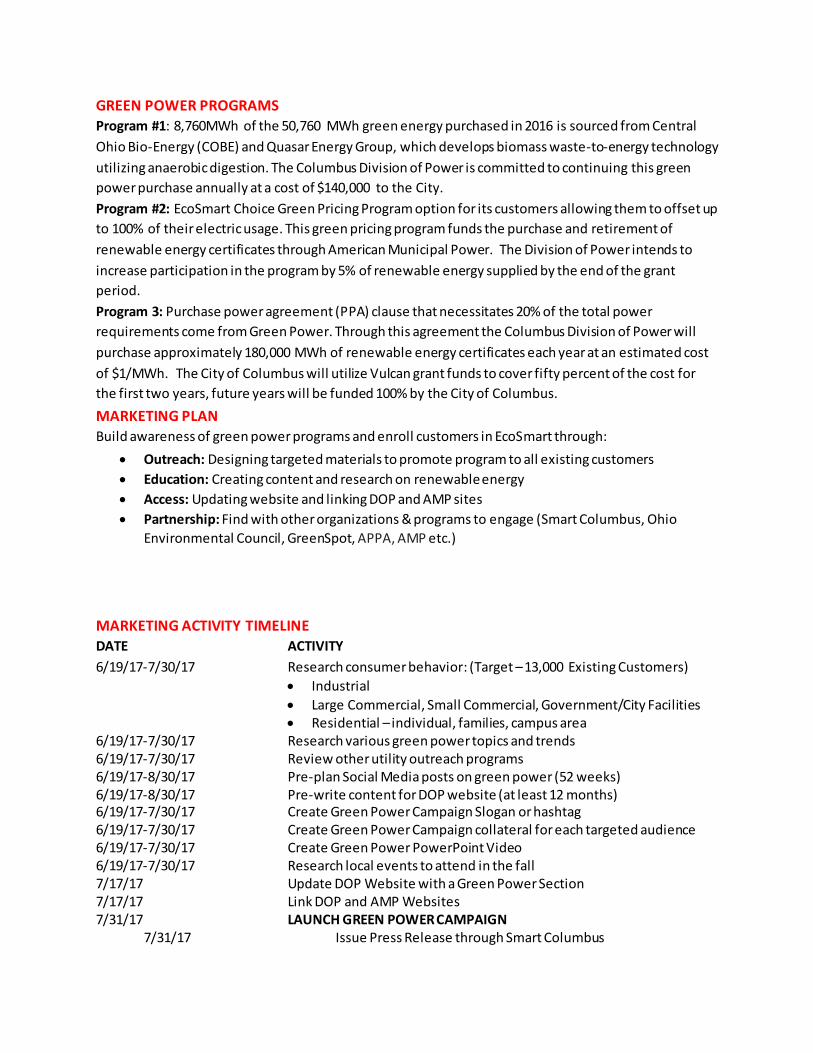
GREEN POWER PROGRAMS
Program #1: 8,760MWh of the 50,760 MWh green energy purchased in 2016 is sourced from Central
Ohio Bio-Energy (COBE) and Quasar Energy Group, which develops biomass waste-to-energy technology
utilizing anaerobic digestion. The Columbus Division of Power is committed to continuing this green
power purchase annually at a cost of $140,000 to the City.
Program #2: EcoSmart Choice Green Pricing Program option for its customers allowing them to offset up
to 100% of their electric usage. This green pricing program funds the purchase and retirement of
renewable energy certificates through American Municipal Power. The Division of Power intends to
increase participation in the program by 5% of renewable energy supplied by the end of the grant
period.
Program 3: Purchase power agreement (PPA) clause that necessitates 20% of the total power
requirements come from Green Power. Through this agreement the Columbus Division of Power will
purchase approximately 180,000 MWh of renewable energy certificates each year at an estimated cost
of $1/MWh. The City of Columbus will utilize Vulcan grant funds to cover fifty percent of the cost for
the first two years, future years will be funded 100% by the City of Columbus.
MARKETING PLAN
Build awareness of green power programs and enroll customers in EcoSmart through:
Outreach: Designing targeted materials to promote program to all existing customers
Education: Creating content and research on renewable energy
Access: Updating website and linking DOP and AMP sites
Partnership: Find with other organizations & programs to engage (Smart Columbus, Ohio
Environmental Council, GreenSpot, APPA, AMP etc.)
MARKETING ACTIVITY TIMELINE
DATE ACTIVITY
6/19/17-7/30/17 Research consumer behavior: (Target – 13,000 Existing Customers)
Industrial
Large Commercial, Small Commercial, Government/City Facilities Residential – individual, families, campus area
6/19/17-7/30/17 Research various green power topics and trends 6/19/17-7/30/17 Review other utility outreach programs 6/19/17-8/30/17 Pre-plan Social Media posts on green power (52 weeks) 6/19/17-8/30/17 Pre-write content for DOP website (at least 12 months) 6/19/17-7/30/17 Create Green Power Campaign Slogan or hashtag 6/19/17-7/30/17 Create Green Power Campaign collateral for each targeted audience 6/19/17-7/30/17 Create Green Power PowerPoint Video 6/19/17-7/30/17 Research local events to attend in the fall 7/17/17 Update DOP Website with a Green Power Section 7/17/17 Link DOP and AMP Websites 7/31/17 LAUNCH GREEN POWER CAMPAIGN
7/31/17 Issue Press Release through Smart Columbus
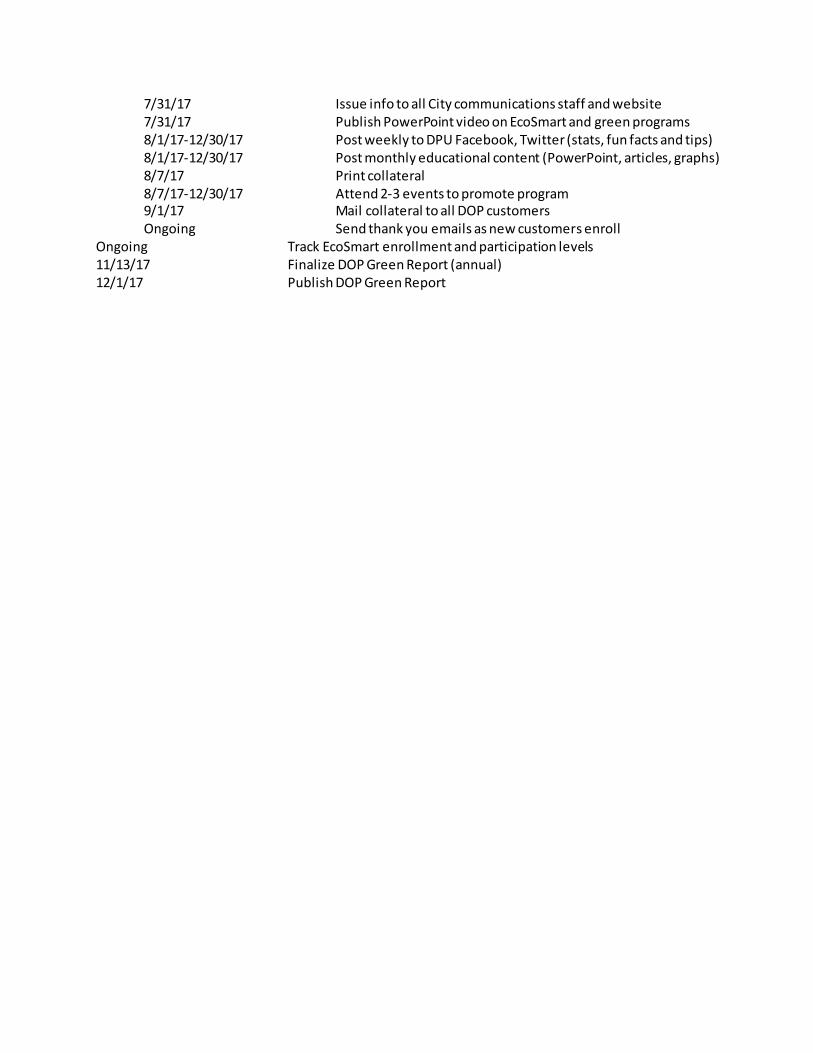
7/31/17 Issue info to all City communications staff and website 7/31/17 Publish PowerPoint video on EcoSmart and green programs 8/1/17-12/30/17 Post weekly to DPU Facebook, Twitter (stats, fun facts and tips) 8/1/17-12/30/17 Post monthly educational content (PowerPoint, articles, graphs) 8/7/17 Print collateral 8/7/17-12/30/17 Attend 2-3 events to promote program 9/1/17 Mail collateral to all DOP customers Ongoing Send thank you emails as new customers enroll
Ongoing Track EcoSmart enrollment and participation levels 11/13/17 Finalize DOP Green Report (annual) 12/1/17 Publish DOP Green Report