Embed Size (px)
Citation preview

Engineering Physics 2018; 2(2): 58-65
http://www.sciencepublishinggroup.com/j/ep
doi: 10.11648/j.ep.20180202.15
ISSN: 2640-1010 (Print); ISSN: 2640-1029 (Online)
Slug Frequency in Horizontal Pipeline Subject to a Sudden Contraction: State of the Art and Laboratory Testing Data
Ibtissem Belgacem1, Reda Mekhlouf
2
1Hydraulic Department, National Polytechnic School, Algiers, Algeria
2Shimadzu Software Development, Montréal, Canada
Email address:
To cite this article: Ibtissem Belgacem, Reda Mekhlouf. Slug Frequency in Horizontal Pipeline Subject to a Sudden Contraction: State of the Art and Laboratory
Testing Data. Engineering Physics. Vol. 2 No. 2, 2018, pp. 58-65. doi: 10.11648/j.ep.20180202.15
Received: October 16, 2018; Accepted: November 7, 2018; Published: December 25, 2018
Abstract: Liquid-gas two-phase flows are widely encountered in industrial applications including chemical processes,
petroleum engineering and energy manufacturing units systems. Of all flow patterns encountered in field operations, slug flow
is the dominant one in horizontal and near horizontal pipelines, and is also the most complicated one. Of all flow topological
configurations, slug flow is the most concerning from the operational perspectives. It is characterized by an alternate flow of
liquid slugs and gas pockets, resulting in an inherently unsteady hydrodynamic behavior. Frequency of the slug has important
significance on gas-liquid two-phase flow. This paper presents the results of experimental study of gas-liquid slug flow in a
horizontal pipe subjected or not to a sudden contraction. The first objective of this study is to present a state -of -the art of
correlations concerning slug frequency; an analysis on the accuracy of these correlations is performed based on direct
comparison against experimental data. It has been found that none of the slug frequency correlation was able to produce
accurate prediction. In this study, the effects of sudden contraction on slug frequency regime were also investigated
experimentally through the analysis of slug persistence and frequency, it has been found that: i) the slug flow prevails before
and after the contraction, ii) frequencies of the structures persist across the contraction.
Keywords: Two-Phase Flow, Slug, Frequency, Closure Equations, Contraction
1. Introduction
Two-phase gas-liquid flows in horizontal pipes are widely
exists in industrial processes and in the petroleum industry in
particular. In horizontal and near horizontal pipelines, the
transportation of gas and liquid in conducts can lead to
several topological configurations, flow patterns are usually
categorized into the following six type: stratified, wavy, slug,
elongated bubbles , annular, and dispersed bubble. As it is
demonstrated by classical flow-pattern maps [1-2] and
recently by [3], of all flow patterns encountered in field
operations, slug flow is the dominant one in horizontal and
near horizontal pipelines, and is also the most complicated
one. The slug flow is characterized by an alternate flow of
liquid slugs and gas pockets, this kind of flows can cause
several damage, like poor oil –water separation, large‐scale
installations instabilities, loss of production can reach up to
50% [4] and also fatigue problem. In gas-oil industry,
slugging is a major flow assurance challenge, the most
significant parameter associated with the slug flow is the
frequency that is defined as the number of slugs passing a
stationary observer per unit time [3], knowledge of the slug
frequency is essential to ensure correct sizing of pipelines,
developing mitigation procedures and also for fatigue
calculations.
Over the past five decades, many experimental and
theoretical studies have been performed by several
researchers [4, 6, 7] some representative works are
summarized in table 1.

59 Ibtissem Belgacem and Reda Mekhlouf: Slug Frequency in Horizontal Pipeline Subject to a Sudden Contraction:
State of the Art and Laboratory Testing Data
Table 1. Summary of slug frequency studies and closure correlations reported in the literature.
Reference
[4]
Channel configuration Fluid Major findings/Remarks
Circular
D=19 mm Water-carbon dioxide
Correlation
�� = 0.0226 ����� ��.���� +����
�.�
[5]
Channel configuration Fluid Major findings/Remarks
D=30mm and 38mm Water-air
Correlation
�� =0.0226��� �.���� + ������.�
�� : no-slip holdup �� =����
��� Froude number of du mexture
���=�� ��
[6] Channel configuration Fluid Major findings/Remarks
Correlation
[8]
Channel configuration Fluid Major findings/Remarks
D=42mm Air-water
calculated the probability density function and power
spectral density of the hold-up in order to estimate the average
slug frequency
Correlation
��= 0.0364�� ��.�� + !� ��
�.�" ��= ��!�
[9]
Channel configuration Fluid Major findings/Remarks
Data from the literature
-assumed that the slug frequency is one half of the frequency
of the unstable
waves precursors of slugs. He used linear stability analysis and
the concept of a
"most dangerous wave" to identify the frequency of the
unstable wave responsible for initiating a slug.
Correlation
�� = 0.61 #$#�
�$%$
[10]
Channel configuration Fluid Major findings/Remarks
31 < ' < 90 mm. air–water
-Correlation can only be expected to give reasonable
predictions in low viscosity liquid–gas flow systems where the
liquid flow rate is so high that gas velocity has negligible
impact on slug frequency.
Correlation
�� = 0.088 (��)�.�*
��
[11], [12]
Channel configuration Fluid Major findings/Remarks
Authors collected a large database on slug flow characteristics in both
low pressure test rigs and field production flow lines.
based on :
-The equilibrium film height
-The mechanics of slug formation from a horizontal stratified
flow
Correlation +,!� = 0.275 * 10�."/0�1 +,
2�$3��4 = 2.74 *0�1
�30�1
[13]
Channel configuration Fluid Major findings/Remarks
D=78mm Air-water
Air-oil
-investigated the relationship between pressure and slug
frequency
-it was found that the pressure had little effect on slug
frequency.
Correlation
��=0.0037 ��� 5
��,�78 )�� �� 9
�./ ��,�:; =5m/s
[14]
Channel configuration Fluid Major findings /remarks
D=76.3 mm
L=23m air-water
- The results reveal that the mechanisms responsible for the
formation of a slug, and thus the slug frequency, depend on the
liquid Froude number of the wavy stratified flow, the gas
velocity, and the location in the pipeline at which the slugs
form.
Correlation
[15] Channel configuration Fluid Major findings /remarks
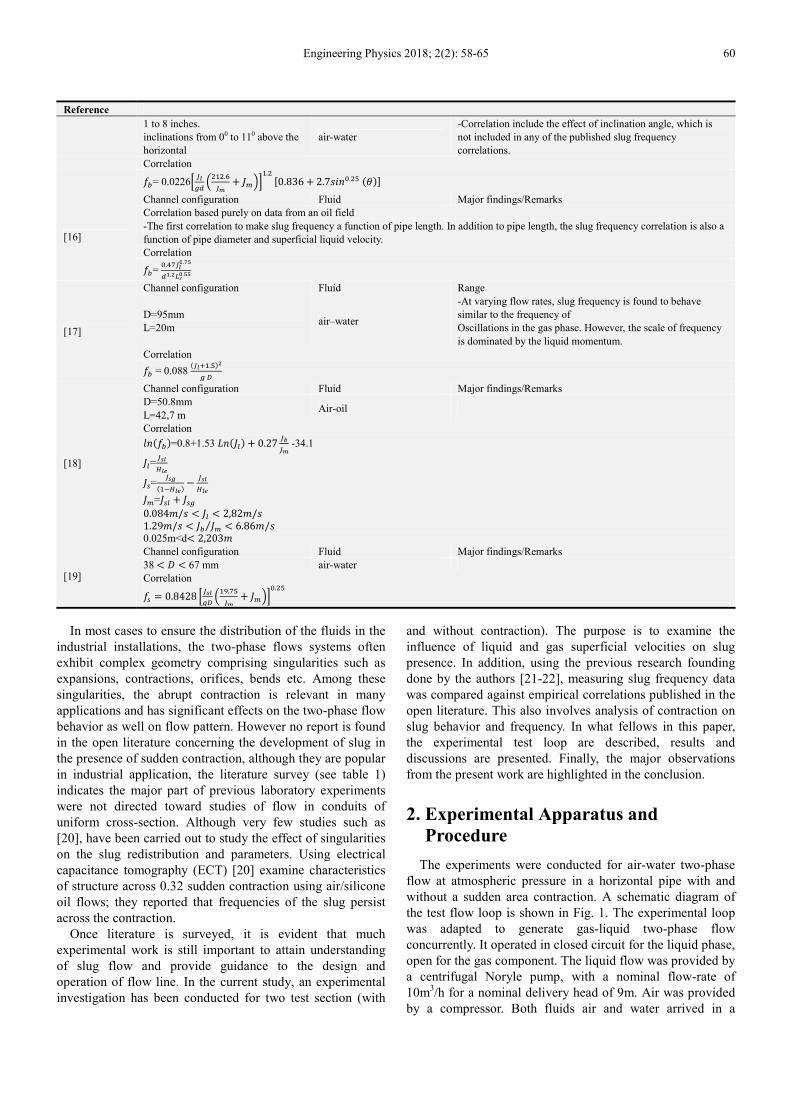
Engineering Physics 2018; 2(2): 58-65 60
Reference
1 to 8 inches.
inclinations from 00 to 110 above the
horizontal
air-water
-Correlation include the effect of inclination angle, which is
not included in any of the published slug frequency
correlations.
Correlation
��= 0.0226� ��� ���."�� + ����
�.� <0.836 + 2.7BCD�.��(E*F
[16]
Channel configuration Fluid Major findings/Remarks
Correlation based purely on data from an oil field
-The first correlation to make slug frequency a function of pipe length. In addition to pipe length, the slug frequency correlation is also a
function of pipe diameter and superficial liquid velocity.
Correlation
��= �.G���H.IJK. LMH.JJ
[17]
Channel configuration Fluid Range
D=95mm
L=20m air–water
-At varying flow rates, slug frequency is found to behave
similar to the frequency of
Oscillations in the gas phase. However, the scale of frequency
is dominated by the liquid momentum.
Correlation
�� = 0.088 (��)�.�*
��
[18]
Channel configuration Fluid Major findings/Remarks
D=50.8mm
L=42,7 m Air-oil
Correlation
ND(��*=0.8+1.53 OD(��* + 0.27 �,�� -34.1
��= ���0�1
�P= ��$(�30�1*−
���0�1 ��=�P� + �P�
0.084S/B < �� < 2,82S/B
1.29S/B < �� ��⁄ < 6.86S/B
0.025m<d< 2,203S
[19]
Channel configuration Fluid Major findings/Remarks
38 < ' < 67 mm air-water
Correlation
�P = 0.8428 ������ ��.���� + ����
�.��
In most cases to ensure the distribution of the fluids in the
industrial installations, the two-phase flows systems often
exhibit complex geometry comprising singularities such as
expansions, contractions, orifices, bends etc. Among these
singularities, the abrupt contraction is relevant in many
applications and has significant effects on the two-phase flow
behavior as well on flow pattern. However no report is found
in the open literature concerning the development of slug in
the presence of sudden contraction, although they are popular
in industrial application, the literature survey (see table 1)
indicates the major part of previous laboratory experiments
were not directed toward studies of flow in conduits of
uniform cross-section. Although very few studies such as
[20], have been carried out to study the effect of singularities
on the slug redistribution and parameters. Using electrical
capacitance tomography (ECT) [20] examine characteristics
of structure across 0.32 sudden contraction using air/silicone
oil flows; they reported that frequencies of the slug persist
across the contraction.
Once literature is surveyed, it is evident that much
experimental work is still important to attain understanding
of slug flow and provide guidance to the design and
operation of flow line. In the current study, an experimental
investigation has been conducted for two test section (with
and without contraction). The purpose is to examine the
influence of liquid and gas superficial velocities on slug
presence. In addition, using the previous research founding
done by the authors [21-22], measuring slug frequency data
was compared against empirical correlations published in the
open literature. This also involves analysis of contraction on
slug behavior and frequency. In what fellows in this paper,
the experimental test loop are described, results and
discussions are presented. Finally, the major observations
from the present work are highlighted in the conclusion.
2. Experimental Apparatus and
Procedure
The experiments were conducted for air-water two-phase
flow at atmospheric pressure in a horizontal pipe with and
without a sudden area contraction. A schematic diagram of
the test flow loop is shown in Fig. 1. The experimental loop
was adapted to generate gas-liquid two-phase flow
concurrently. It operated in closed circuit for the liquid phase,
open for the gas component. The liquid flow was provided by
a centrifugal Noryle pump, with a nominal flow-rate of
10m3/h for a nominal delivery head of 9m. Air was provided
by a compressor. Both fluids air and water arrived in a

61 Ibtissem Belgacem and Reda Mekhlouf: Slug Frequency in Horizontal Pipeline Subject to a Sudden Contraction:
State of the Art and Laboratory Testing Data
cylindrical mixing chamber feeding the cylindrical pipe made
in Polymethyl Methacrylate (PMMA) to allow optical access.
Prior to the experiments, the horizontality was set to avoid
any transition due to the effect of pipe inclination. Air was
filtered to remove all traces of oil and impurities and to
maintain good experimental conditions. Visualization of the
flow regime without the singularity was achieved at 7m from
the inlet of the pipe while in the presence of the contraction
this was done at 1m upstream and downstream the singularity
using a high resolution camera. Gas flow measurements were
performed by two Rotameters VMRP010092 and
VMRP010083 type. Liquid flow was measured by an
ultrasonic flow meter type PT878. The estimated incertitude
on liquid and gas flow rates were lower than ±2% and ±1%
respectively. The test section, as shown in Fig. 1, had inner
diameters of 0.04m and 0.03m upstream and downstream the
contraction respectively leading to a contraction area ratio of
0.567.
The working fluids were air and water delivered at a total
mass flux G ranging from 37.16 to 240 kg/m²s at a
temperature of 25°C with a flowing quality x range of
0.008X Y X 0.22. The deduced superficial velocities were
respectively for the liquid and gas as: 0.011m/s ≤ Jl≤ 0.24 m/s
and 0.54 m/s ≤ Jg ≤ 5.5 m/s.
Figure 1. Description of the experimental loop.
3. Results and Discussions
The experimental test matrix was chosen in order to have
slug flow on the two configurations.
3.1. Slug identification
Slug pattern in the tube were observed by treatment of the
electric signal tension delivered by the piezoelectric pressure
pick-up, together with visual observation for air water in the
transparent tube[21]. A typical time wave form spectrum is
presented in figure 2. It was noted under slug flow regime
that the entire movement of the slug through the pipe was
seen as increasing and decaying AE level which could be
correlated with the slug head and tail respectively [22]. The
slug flow data identified have been plotted in Figures 3, 4.a
and 4.b for horizontal pipe of uniform diameter, upstream
and downstream contraction, respectively together with the
transition lines of Mandhane flow map. In our experimental
work, at the transition from stratified-wavy flow to slug flow,
which happens at very low superficial [21] liquid velocities
(around jl =0.1 m/s) and relatively high gas velocities ( jg >2
m/s), slugs appear rarely and only at long distances from the
inlet, e.g. not before 120D. As the superficial liquid velocity
increases, slugs form closer to the inlet between 17D and
52D from the inlet.
Figure 2. Typical signal from fully developed slug flow.
Figure 3. Data distribution in Taitel et Dukler (1976) flow map for
configuration 1 (Horizontal pipe without contraction).
Engineering Physics 2018; 2(2): 58-65 62
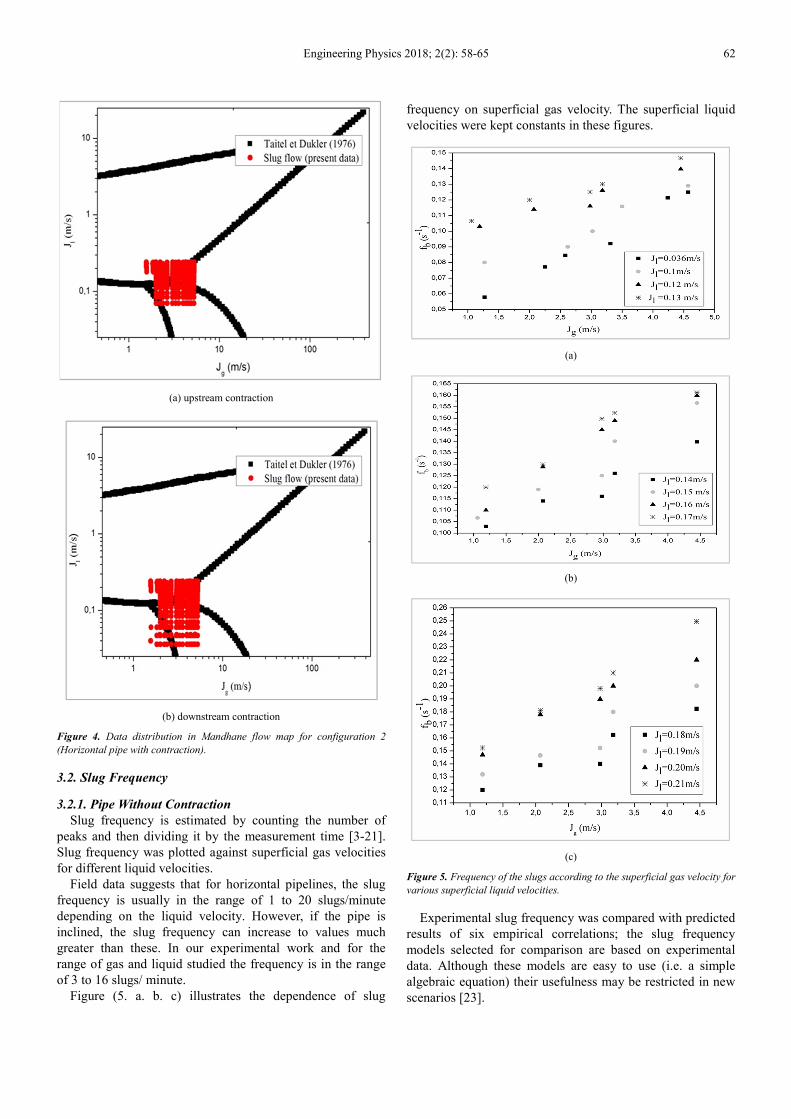
(a) upstream contraction
(b) downstream contraction
Figure 4. Data distribution in Mandhane flow map for configuration 2
(Horizontal pipe with contraction).
3.2. Slug Frequency
3.2.1. Pipe Without Contraction
Slug frequency is estimated by counting the number of
peaks and then dividing it by the measurement time [3-21].
Slug frequency was plotted against superficial gas velocities
for different liquid velocities.
Field data suggests that for horizontal pipelines, the slug
frequency is usually in the range of 1 to 20 slugs/minute
depending on the liquid velocity. However, if the pipe is
inclined, the slug frequency can increase to values much
greater than these. In our experimental work and for the
range of gas and liquid studied the frequency is in the range
of 3 to 16 slugs/ minute.
Figure (5. a. b. c) illustrates the dependence of slug
frequency on superficial gas velocity. The superficial liquid
velocities were kept constants in these figures.
(a)
(b)
(c)
Figure 5. Frequency of the slugs according to the superficial gas velocity for
various superficial liquid velocities.
Experimental slug frequency was compared with predicted
results of six empirical correlations; the slug frequency
models selected for comparison are based on experimental
data. Although these models are easy to use (i.e. a simple
algebraic equation) their usefulness may be restricted in new
scenarios [23].

63 Ibtissem Belgacem and Reda Mekhlouf: Slug Frequency in Horizontal Pipeline Subject to a Sudden Contraction:
State of the Art and Laboratory Testing Data
From figure.6, it is obvious that none of the slug frequency
correlations were able to produce predictions of reasonable
accuracy. The majority of the correlations grossly
overestimate the slug frequency, results generated from that it
were far away from the reality observed in the experiments.
In the literature we can find many approaches to explain the
results, [18] reports that slug frequency model revealed
important dependency on slug initiation mechanism and
development conditions, he suggests that the slugs generated
under a hydrodynamics slugging mechanism have lower
frequency than those generated under a terrain slugging
mechanism for high Froude number, experimental condition
parameters including pipe diameter, liquid velocity and the
ratio of slip to mixture velocities were found to linearly
correlate relate to slug frequency correlations.
a/ [4]
b/ [7]
c/ [8]
d/ [10]
e/ [9]

Engineering Physics 2018; 2(2): 58-65 64
f/ [17]
Figure 6. Comparison between experimental slug frequency data and
theoretical prediction.
3.2.2. Pipe with Contraction
As part of this work, measurements were conducted
upstream as well as downstream the contraction allowing
then to examine the frequency due to the singularity. Figure 7
shows twelve cases of slug frequency variations with
superficial gas velocity for different liquid velocities,
upstream and downstream pipe contraction. When examined
individually, the dominant tendency across most of the
twelve cases is for slug frequency to increase as superficial
liquid velocities are increased upstream as well as
downstream the sudden area change. In the most of the case
studied the slug frequency remains constant upstream and
downstream the contraction. There are remarkable cases
where the slug frequency variation downstream the
contraction is rather complicated. In one such case, slug
frequency remains constant at first before increasing. In other
such cases, the slug frequency initially increases and then
decreases.
This is in agreement with earlier report by Azzopardi et al.
(2014)
a/ Jl=0.1 m/s
Jg1=4.57m/s Jg2=2.58m/s Jg3=3.31m/s
Jg4=2.25m/s Jg5=1.27m/s
b/ Jl=0.21 m/s
Jg1=4.45m/s Jg2=3.18m/s Jg3=2.98m/s
Jg4=1.19m/s Jg5=2.07m/s
Figure 7. Slug frequency data upstream and downstream contraction.
4. Concluding Remark
This work sets out to provide new experimental data on
slug flow in horizontal pipe subjected or not to a sudden
contraction. Based on results from the experimental
measurements and visual observations, the following
conclusions are made:
Considering the preliminary study carried out, the
dominant tendency is for slug frequency to increases linearly
with the superficial liquid velocities and it is weakly affected
by the superficial gas velocity. On the other hand, none of the
slug frequency correlations tested against experimental slug
frequency data was able to produce predictions of reasonable
accuracy.
The main part of this work, however, is concerned with the
characterization of intermittent flow in the presence of sudden
contraction. First the presence of slug flow is shown on a flow
map upstream and downstream sudden area change, the
intermittent flow prevails before and after the contraction, In
addition, it has been found that frequencies of the structures do
not vary across the contraction. Ultimately, data are provided
for the validation and development of mathematical models
and numerical codes for the simulation of two-phase slug flow.
References
[1] Mandhane, J. M., Gregory, G. A., & Aziz, K. (1974). A flow pattern map for gas—liquid flow in horizontal pipes. International Journal of Multiphase Flow, 1(4), 537-553.
[2] Taitel, Y., & Dukler, A. E. (1976). A model for predicting flow regime transitions in horizontal and near horizontal gas‐liquid flow. AIChE Journal, 22(1), 47-55.
[3] Belgacem, I., Salhi, Y., SI-Ahmed, E. K., Legrand, J. (2105). Development and statistical characterization of slug in two-phase flow along horizontal pipeline “. Mechanics & Industry.

65 Ibtissem Belgacem and Reda Mekhlouf: Slug Frequency in Horizontal Pipeline Subject to a Sudden Contraction:
State of the Art and Laboratory Testing Data
[4] Gregory, G. A., Scott, D. A., 1969. Correlation of liquid slug velocity and frequency in horizontal cocurrent gas–liquid slug flow. AIChE J. 42, pp. 901–907.
[5] Greskovich, E. J., & Shrier, A. L. (1972). Slug frequency in horizontal gas-liquid slug flow. Industrial & Engineering Chemistry Process Design and Development, 11(2), 317-318.
[6] Taitel, Y. and A. E. Dukler, 1977. A Model For Slug Frequency During Gas-liquid Flow in Horizontal and Near-Horizontal Gas-Liquid Flow, Int. J. of Multiphase Flow, Vol. 19, No. 5, pp. 829-838.
[7] Heywood, N. I., & Richardson, J. F. (1979). Slug flow of air—water mixtures in a horizontal pipe: Determination of liquid holdup by γ-ray absorption. Chemical Engineering Science, 34(1), 17-30.
[8] Tronconi, E., 1990. Prediction of slug frequency in horizontal two-phase slug flow. AIChE J. vol. 36, pp. 701–709.
[9] Nydal, O. J., Pintus, S., Andreussi, P., 1992. Statistical characterization of slug flow in horizontal pipes. Int. J. Multiphase Flow 18, pp. 439–453.
[10] Hill, T. J., & Wood, D. G. (1990). A new approach to the prediction of slug frequency. In 65 th Annual Technical Conference and Exhibition of SPE, September (pp. 23-26).
[11] Hill, T. J., & Wood, D. G. (1994). Slug flow: Occurrence, consequences, and prediction (No. CONF-940879--). Society of Petroleum Engineers, Richardson, TX (United States).
[12] Manolis, I., Mendes-Tatsis, M., Hewitt, G., 1995. The effect of pressure on slug frequency on two-phase horizontal flow. Presented at the 2nd International Conference on Multiphase Flow, Kyoto, Japan (cité par El safran 2009).
[13] Woods, B. D., Hanratty, T. J., 1999. Influence of Froude number on physical processes determining frequency of slugging in horizontal gas–liquid flows. Int. J. Multiphase Flow vol. 25, pp. 1195–1223.
[14] Zabaras, G., 2000. Prediction of slug frequency for gas/liquid flows. SPE 65093. SPE J. 5 (3).
[15] Shea, R., Eidsmoen, H., Nordsveen, M., Rasmussen, J., Xu, Z., Nossen, J., 2004. Slug frequency prediction method comparison. BHRG Multiphase Production Technology Proceedings, Banff, Canada.
[16] Kadri, U., Mudde, R. F., Oliemans, R. V. A.(2008). A growth model for dynamic slugs in gas/liquid horizontal pipes. In Proc. BHR Conf., Banff, Canada, pp. 241–254.
[17] Al-Safran, E. (2009). Investigation and prediction of slug frequency in gas/liquid horizontal pipe flow. Journal of Petroleum Science and Engineering, 69(1), 143-155.
[18] Hernandez Perez, V., Azzopardi, B. J., & Morvan, H. (2007). Slug flow in inclined pipes. In Proceedings of 6th international conference on multiphase flow (pp. 9-13).
[19] Azzopardi, B. J., Ijioma, A., Yang, S., Abdulkareem, L. A., Azzi, A., & Abdulkadir, M. (2014). Persistence of frequency in gas–liquid flows across a change in pipe diameter or orientation. International Journal of Multiphase Flow, 67, 22-31.
[20] Al-Lababidi, S., Addali, A., & Mba, D. (2012). Upstream Multiphase Flow Assurance Monitoring Using Acoustic Emission. INTECH Open Access Publisher.
[21] Belgacem, I., Salhi, Y., SI-Ahmed, E. K., Legrand, J., &Rosant, J. M. (2013). Experimental investigation of slug pattern in a horizontal two-phase flow. Computational Methods in Multiphase Flow VII. Wit transaction on Engineering Sciences, 79, 423-433.
[22] Rodrigues, H. T., Morales, R. E., Mazza, R. A., & Rosa, E. S. (2007). A comparative study of closure equations for gas-liquid slug flow. In international congress of mechanical engineering- COBEM (Vol.19).