Embed Size (px)
Citation preview

SLUG FRONT GAS ENTRAINMENT IN
GAS-LIQUID TWO-PHASE FLOW IN
HORIZONTAL AND NEAR HORIZONTAL
PIPES
By
Mohammed Kabir Abdullahi
A thesis submitted in partial fulfilment of the requirements for the
Degree of Doctor of Philosophy of Imperial College London and for
the Diploma of Membership of Imperial College London
Department of Chemical Engineering
Imperial College London
South Kensington Campus
Prince Consort Road
London
SW7 2AZ
January 2013

Slug front gas entrainment in gas-liquid two-phase flow in horizontal and near horizontal pipes
PhD Thesis (MK Abdullahi, 2013) 2
Declaration of Originality
Slug front gas entrainment in gas-liquid two-phase flow in horizontal and near horizontal pipes PhD Thesis (MK Abdullahi, 2013)
3
The work reported in this thesis is completely original and was carried out by me. All other
materials were appropriately referenced.
Copyright Declaration
Slug front gas entrainment in gas-liquid two-phase flow in horizontal and near horizontal pipes PhD Thesis (MK Abdullahi, 2013)
4
The copyright of this thesis rests with the author and is made available under a Creative
Commons Attribution-Non Commercial-No Derivatives licence. Researchers are free to copy,
distribute or transmit the thesis on the condition that they attribute it, that they do not use
it for commercial purposes and that they do not alter, transform or build upon it. For any
reuse or distribution, researchers must make clear to others the license terms of this work.
Abstract
Slug front gas entrainment in gas-liquid two-phase flow in horizontal and near horizontal pipes PhD Thesis (MK Abdullahi, 2013)
5
Abstract
This thesis presents experimental studies relating to gas-liquid slug flows in horizontal and
near-horizontal pipelines. In such flows, liquid-continuous regions (“slugs”) pass along the
pipe separated by regions of stratified flow (“elongated bubbles”) (see Chapter 1). Gas may
be entrained at the slug fronts and is subsequently discharged into the elongated bubble at
the slug tail. The focus of the work described in this thesis is on this gas entrainment
process. Specifically, the aim is to make objective measurements of the slug front gas
entrainment rate. A review of the earlier work (see Chapter 2) showed a large diversity of
results for slug front gas entrainment. This reflects the difficulty of doing objective
experiments on this important parameter. In the work described here, two new techniques
for determining gas entrainment rate were implemented and investigated, namely the
three-way valve method and the bubble shrinkage method. All of the experiments described
in this thesis were with air-water flows at near atmospheric pressure, though the techniques
developed could be applied to other fluid pairs and to different pressures. The three-way
valve method involves diverting a slug front to pass over a stratified liquid layer and to
determine the gas pick-up rate at the slug front from the slug front propagation velocity.
The experiments were carried out for a 32.8 mm pipe in the LOTUS facility (described in
Chapter 3) and for a 78 mm pipe using the WASP facility (also described in Chapter 3). The
experimental results are presented in Chapters 4 and 5 respectively and show that the gas
entrainment rate per unit film width is similar for the two diameters and depends on the
relative velocity between the slug front and the liquid film ahead of it. The results indicate
entrainment rates which are within the range previously measured but which are above
those calculated from the existing correlations. A new correlation for prediction of gas
entrainment in slug flow in horizontal pipes was developed which adequately predicts
previous gas entrainment work (repeated here using LOTUS facility).
In the bubble shrinkage method, the aim is to measure the shrinkage rate (and hence the
rate of loss of gas by entrainment) of an elongated bubble passing along a pipe in a liquid
flow. Development work on this method is described in Chapter 6 and (though the test
section lengths were not sufficient to measure shrinkage accurately), it could be deduced
Abstract
Slug front gas entrainment in gas-liquid two-phase flow in horizontal and near horizontal pipes
PhD Thesis (MK Abdullahi, 2013) 6
(from measurements of the slug front (bubble tail) velocity) that the results were consistent
with the three-way valve experiments.
The actual phenomena accompanying gas entrainment at the slug front in slug flow are
extremely complex and this was demonstrated with high speed video photography using an
Olympus i-SPEED 3 system (see Chapter 7). Depending on the actual conditions, the
advancing slug front could be attached to or detached from the preceding liquid layer. There
were significant differences in the phenomena observed depending on the nature of the
preceding liquid layer (stratified flow, descending liquid film, and stationary liquid film).

Acknowledgement
Slug front gas entrainment in gas-liquid two-phase flow in horizontal and near horizontal pipes PhD Thesis (MK Abdullahi, 2013)
7
To my parents Abdullah and Khadija
And to my wife Zainab
Acknowledgement
Slug front gas entrainment in gas-liquid two-phase flow in horizontal and near horizontal pipes
PhD Thesis (MK Abdullahi, 2013) 8
Acknowledgement
Firstly, I would like to thank Professor Geoffrey Hewitt for his professional guidance, support
and kindness throughout the course of carrying out this PhD research work in multiphase
flow. I am particularly grateful to him for taking good time to review each Chapter and made
fruitful suggestions, without his immense wealth of experience the work described in this
thesis would not have been possible. I would also want to thank my second supervisor
Professor Stephen Richardson for his guidance at the beginning of this research work.
I would like to also thank my family, parents and in-laws for their patience during this
research work. I would like to acknowledge all the research fellows and post-docs past and
present that worked with me within Transient Multiphase Flow (TMF) research group. In
chronological order from the first that worked with me on LOTUS rig, LOWPRESS and WASP
facility, I wish to express my gratitude to Dr. Colin P. Hale, Dr. Ioannis G. Manolis, Dr. Paul F.
Pickering, Dr. Benjamin Pierre, Dr. Ivan Zadrazil and Dr. Safa Sharaf. These gentlemen helped
immensely in carrying out the experiments. I would particularly wish to thank Benjamin and
Ivan whom I have enjoyed working with on the LOWPRESS rig and WASP facility
respectively.
I would also like to thank the Mechanical Workshop staff for help with the construction and
modification of the experimental facilities, these are, Tony Meredith, Richard Wallington
and Bob Brace. Richard guided me to manufacture the twin-wire probes on LOTUS and
LOWPRESS while Bob did all the modification works on WASP facility. I also wish to thank
Nam Ly of Computer Services Unit of the Department and Chin Lang of Electronics
Workshop.
This project was funded by the PTDF (Petroleum Technology Development Fund) Nigeria
and Joint Project on Multiphase Flow and Flow Assurance. Therefore, I would like to
acknowledge the contributions made to this project by PTDF, the UK Engineering and
Physical Sciences Research Council (EPSRC) and the following: - Advantica; BP Exploration;
CD-adapco; Chevron; ConocoPhillips; ENI; ExxonMobil; FEESA; IFP; Institutt for
Acknowledgement
Slug front gas entrainment in gas-liquid two-phase flow in horizontal and near horizontal pipes
PhD Thesis (MK Abdullahi, 2013) 9
Energiteknikk; PDVSA (INTEVEP); Petrobras; PETRONAS; Scandpower PT; Shell; SINTEF;
StatoilHydro and TOTAL. I wish to express my sincere gratitude for this support.
Table of Contents
Slug front gas entrainment in gas-liquid two-phase flow in horizontal and near horizontal pipes PhD Thesis (MK Abdullahi, 2013)
10
Table of Contents
Declaration of Originality 3
Copyright Declaration 4
Abstract 5
Acknowledgement 7
Table of Contents 10
List of Figures 17
List of Tables 26
List of Symbols 27
Chapter 1: Introduction 34
1.1 Gas-Liquid Two-Phase Flow 35
1.2 Flow Regimes in Horizontal Pipe 35
1.3 Flow Transition and Flow Regime Maps for Horizontal and Inclined 38
Pipeline Flows
1.4 Slug Flows 45
1.4.1 Description of slug flow 46
1.4.2 Problems related to slugging 48
1.5 Slug Flow Models 48
1.5.1 Dukler and Hubbard (1975) horizontal slug flow model 49
Table of Contents
Slug front gas entrainment in gas-liquid two-phase flow in horizontal and near horizontal pipes
PhD Thesis (MK Abdullahi, 2013) 11
1.5.2 Taitel and Barnea (1990a) unified slug flow model 55
1.5.3 Cook & Behnia (2000) model 64
1.5.4 Zhang et al. (2003a) model 70
1.5.5 Xu et al (2007) model 75
1.5.6 Kadri et al (2009) 78
1.6 General Objective of the Project 86
1.7 Project Approach 86
1.8 Summary of Subsequent Chapters 89
Chapter 2: Gas Entrainment in Slug Flows 91
2.1 Experimental Measurements of Gas Entrainment 94
2.1.1 Experiments on stationary slugs (hydraulic jumps) 94
2.1.1.1 Experiments of Jepson (1987) 94
2.1.1.2 Experiments of Pan (2010) 95
2.1.2 Experiments based on measurements on moving slugs 96
2.1.2.1 Experiments of Nydal and Andreussi (1991) 96
2.1.2.2 Experiments of Paglianti et al (1993) 97
2.1.2.3 Experiments of Manolis (1995) 98
2.1.2.4 Experiments of Hale (2007) 99
Table of Contents
Slug front gas entrainment in gas-liquid two-phase flow in horizontal and near horizontal pipes
PhD Thesis (MK Abdullahi, 2013) 12
2.1.3 Comparison of results from various experiments 100
2.2 Correlation and Prediction of Gas Entrainment Effects 102
2.2.1 Correlations of gas entrainment rate 102
2.2.1.1 Correlation of Nydal and Andreussi (1991) 102
2.2.1.2 Correlation of Manolis (1995) 104
2.2.2 Slug flow models incorporating gas entrainment 106
2.2.2.1 Model of Bonizzi and Issa (2003) 106
2.2.2.2 Model of Brauner and Ullmann (2004) 111
2.3 Conclusion 118
Chapter 3: Experimental Facilities and Methods 119
3.1 The LOTUS facility 121
3.1.1 Pressurized water source for the LOTUS experiments 123
3.1.1.1 Liquid flow measurement with Venturi meter 124
3.1.2 Setting up and measuring the air and water flow rates during 126
initial stratified flow period
3.2 The WASP High Pressure Facility 128
3.2.1 General description 128
3.2.2 Air sources for WASP experiments 130
Table of Contents
Slug front gas entrainment in gas-liquid two-phase flow in horizontal and near horizontal pipes
PhD Thesis (MK Abdullahi, 2013) 13
3.2.3 Liquid sources for WASP experiments 131
3.2.4 Modification of WASP test section for 3-way valve gas 133
entrainment experiments
3.3 The Low Pressure (LOWPRESS) Facility 140
3.3.1 Water sources for the LOWPRESS experiments 142
3.3.2 Air source for the LOWPRESS experiments 144
3.4 Twin-wire Conductance Probes 144
3.4.1 Calibration of twin-wire conductance probes 150
3.5 Data Acquisition and Processing 155
3.5.1 Data acquisition and processing on LOTUS and LOWPRESS rigs 155
3.5.2 Data acquisition and processing on WASP facility 156
3.6 Conclusion 157
Chapter 4: Measurements of Slug front Gas Entrainment Rates on the LOTUS 158
Facility (32.8 mm diameter pipe)
4.1 Basis of Push-in Gas Entrainment Measurements 159
4.1.1 Slug front translational velocity calculation 163
4.1.2 Change in slug front velocity with distance 167
4.1.3 Error analysis of experimental measurements 171
Table of Contents
Slug front gas entrainment in gas-liquid two-phase flow in horizontal and near horizontal pipes
PhD Thesis (MK Abdullahi, 2013) 14
4.2 Experiments with Stratified Flow ahead of the Advancing Slug in a 173
Horizontal Pipe
4.3 Experiments with a Stationary Liquid Film ahead of the Advancing Slug in a 179
Horizontal Pipe
4.4 Experiments with an Upwards Inclined Pipe and a Film Moving Down 182
Towards the Advancing Slug Front
4.5 Experiments with a Dry Pipe ahead of the Advancing Slug Front in a 186
Horizontal Pipe
4.6 Conclusion 187
Chapter 5: Measurements of Slug Front Gas Entrainment Rates on the WASP 188
Facility (77.92 mm diameter pipe)
5.1 Introduction 189
5.2 Implementation of the WASP Experiments 193
5.3 Experiments with Stratified Flow ahead of Slug Front in Horizontal Pipe using 197
the WASP Facility
5.4 Conclusion 200
Chapter 6: Bubble Experiments on LOWPRESS Facility (32.8 mm diameter pipe) 201
6.1 The Principle of the Bubble Experiment 203
6.2 Methods of Bubble Entrapment 205
6.2.1 Bubble entrapment using pairs of valves 205
6.2.2 Bubble entrapment using a dog-leg pipe section 206
6.2.3 Bubble entrapment using a pipe bridge 208
6.3 Consistency between Bubble and Three-way Valve Experiments 210
Table of Contents
Slug front gas entrainment in gas-liquid two-phase flow in horizontal and near horizontal pipes
PhD Thesis (MK Abdullahi, 2013) 15
6.4 Conclusion 213
Chapter 7: Visualisation of Slug Front Advance Using High Speed Video Photography 214
On LOWRESS Facility (32.8 mm diameter pipe)
7.1 Recording and Processing the Video Images 215
7.2 Slug Front Progression over Liquid Layer in Stratified Flow in a Horizontal Pipe 215
7.3 Slug Front Progression over a Downwards Flowing Liquid Film in a Slightly 219
Upwards Inclined Pipe
7.4 Slug Front Progression over a Stationary Liquid Film in a Horizontal Pipe 221
7.5 Comparison of Slug Front Progression over Stratified Layer, Downward 224
Flowing Film and Stationary Film
7.6 Conclusion 226
Chapter 8: Conclusions and Recommendations 227
8.1 Conclusions 227
8.2 Recommendations 228
References 231
Appendices 242
Appendix A: Data for Gas Entrainment with Stratified Flow ahead of Slug in 242
Horizontal Pipe (LOTUS rig)
Appendix B: Data for Gas Entrainment with Stratified Flow ahead of Slug in 258
Horizontal Pipe (WASP facility)
Appendix C: Data for Gas Entrainment with Stationary Liquid Film ahead of Slug in 259
Horizontal Pipe (LOTUS rig)
Table of Contents
Slug front gas entrainment in gas-liquid two-phase flow in horizontal and near horizontal pipes
PhD Thesis (MK Abdullahi, 2013) 16
Appendix D: Data for Gas Entrainment with Down Flow of Liquid Film towards an 269
Advancing Slug in 1o Degree Inclined Pipe (LOTUS rig)
Appendix E: Data for Gas Entrainment with Dry Pipe ahead of an Advancing Slug in 280
Horizontal Pipe (LOTUS rig)
Appendix F: Data for Bubble Experiments with Bridge in Horizontal pipe 283
(LOWPRESS rig)
Appendix G: Data for Bubble Experiments with Bridge in 10 Inclined Pipe 286
(LOWPRESS rig)
List of Figures
Slug front gas entrainment in gas-liquid two-phase flow in horizontal and near horizontal pipes PhD Thesis (MK Abdullahi, 2013)
17
List of Figures
Chapter 1: Introduction
Figure 1.1: Sketch of horizontal gas-liquid flow patterns 36
(after Hewitt & Hall-Taylor, 1970)
Figure 1.2: Flow patterns map for air-water two-phase flow in a horizontal pipe. 39
The shaded lines denote the flow regime boundaries as determined experimentally
by Mandhane et al (1974). The solid lines denote the boundaries determined by
the analysis of Taitel & Dukler (1976).
Figure 1.3: Illustration of the geometry of the idealized stratified flow in a round 41
pipe
Figure 1.4: Generalised flow pattern map for horizontal flow 44
(Taitel and Dukler, 1976)
Figure 1.5: Generalised flow pattern map for horizontal and slightly inclined flow 44
(Taitel and Dukler, 1976)
Figure 1.6: Sketch of two-phase gas-liquid slug flow in pipelines 46
Figure 1.7: Photograph of two-phase gas-liquid slug flow in pipelines 46
Figure 1.8: The process of slug formation 49
Figure 1.9: The physical model for slug flow 50
Figure 1.10: Illustration of the geometry of the idealized slug flow in a round pipe 55
Figure 1.11: The physical model of Cook and Behnia (2000) 64
List of Figures
Slug front gas entrainment in gas-liquid two-phase flow in horizontal and near horizontal pipes
PhD Thesis (MK Abdullahi, 2013) 18
Figure 1.12: Cross-section of the pipe for stratified flow representation 78
(Kadri et al, 2009a)
Figure 1.13: Sketch of a slug flow in pipe 80
Figure 1.14: A slug at initiation time expressed as two sinusoidal waves 81
(after Kadri et al, 2009a)
Figure 1.15: A representation of the average fully developed slug flow 84
(Kadri et al, 2009a)
Chapter 2: Gas Entrainment in Slug Flows 91
Figure 2.1: Entrainment and shedding processes occurring in slug flows 92
Figure 2.2: Schematic of the concept of hydraulic jump experiments 95
(J. Pan, 2010)
Figure 2.3: Assembly of gate and gas inlet section 96
Figure 2.4: Schematic diagram of the experimental set-up 97
(Nydal and Andreussi, 1991)
Figure 2.5: Schematic diagram of the push in experiment on the WASP rig 98
Figure 2.6: Schematic diagram for dog leg experiment 99
Figure 2.7: Comparison of results of previous gas entrainment experiments 101
Figure 2.8: Schematic of the liquid front advances over a liquid film and gas 103
entrained into the slug body (Nydal & Andreussi 1991)
List of Figures
Slug front gas entrainment in gas-liquid two-phase flow in horizontal and near horizontal pipes
PhD Thesis (MK Abdullahi, 2013) 19
Chapter 3: Experimental Facilities and Methods 119
Figure 3.1: General schematic of the LOTUS Rig 122
Figure 3.2: Flow arrangement for the LOTUS “push-in” experiments 122
Figure 3.3: Components of “push-in” experiments on LOTUS facility 123
Figure 3.4: Photograph of the Norgren pressure regulator 124
Figure 3.5: Calibration curve of Venturi for the single phase water flow 125
Figure 3.6: Photograph of LOTUS rotameters 127
Figure 3.7: Calibration curve for rotameter A 127
Figure 3.8: Generic schematic of the WASP facility 129
Figure 3.9: The high pressure air supply tanks in the Department of Aeronautics 130
Figure 3.10: Photograph of water tank (right) and oil tank (left) 132
Figure 3.11: Configuration of the WASP facility used in present experiments 134
Figure 3.12: The inlet section and the pneumatically actuated 3-way valve on the 136
WASP facility test section
Figure 3.13: Installation of venturi meter into WASP system 137
Figure 3.14: The pressure transducers for the Venturi: differential (right) and 137
absolute (left)
Figure 3.15: Flow line for the three feed supplies: top left slug feed, top right air 137
supply line and bottom stratified water line with manual control valve
List of Figures
Slug front gas entrainment in gas-liquid two-phase flow in horizontal and near horizontal pipes
PhD Thesis (MK Abdullahi, 2013) 20
Figure 3.16: Modified schematic of WASP facility with 3-way valve, venturi and 138
new valve (V21)
Figure 3.17: The slug-catcher which primarily separates the gas and liquid phases 139
Figure 3.18: Schematic of the LOWPRESS 32mm rig 141
Figure 3.19: Photograph of LOWPRESS rig test line 141
Figure 3.20: Photograph of LOWPRESS rig pressurised water tank 142
Figure 3.21: Photograph of liquid slug feed flow meter (MAG5000) 143
Figure 3.22: Photograph of 3-way valve 143
Figure 3.23: Schematic representation of the twin-wire conductivity probe as 145
used on the LOTUS and LOWPRESS facilities
Figure 3.24: Photograph of mounted twin-platinum-wire probes on the 32.8 mm 145
LOTUS rig showing probes 2 and 3
Figure 3.25: Design and assembly of twin-wire probes on WASP test section 146
(Manolis, 1995)
Figure 3.26: Internal view of twin-wire probes on WASP test section 146
Figure 3.27: Conductivity probes electronic circuits (Part I) 148
Figure 3.28: Conductivity probes electronic circuits (Part II) 149
Figure 3.29: Variation of data logger reading (proportional to conductance) with 151
non-dimensional liquid height for the four twin wire probes used in the LOTUS
and LOWPRESS experiments
Figure 3.30: Corrected side-on ⁄ versus actual ⁄ 152
List of Figures
Slug front gas entrainment in gas-liquid two-phase flow in horizontal and near horizontal pipes
PhD Thesis (MK Abdullahi, 2013) 21
Figure 3.31: Typical WASP conductivity Probes Calibration Curves (Hale, 2000) 153
Figure 3.32: WASP conductivity probes calibration curves (a) Probe 1 (b) Probe 2 154
Figure 3.33: Block diagram of high-frequency probes signal processing system 156
Chapter 4: Measurements of Slug Front Gas Entrainment Rates on the LOTUS 158
Facility (32.8 mm diameter pipe)
Figure 4.1: Stratified flow flowing in horizontal test section 159
Figure 4.2: Slug flowing over stratified flow in horizontal test section 159
Figure 4.3: Schematic showing the progression of a slug front 162
Figure 4.4: Schematic showing stationary control volume around a slug 162
Figure 4.5: Time traces (a) dimensionless liquid film height as a function of time 164
for probes placed at 4.4 m (CPR1) and 6.2 m (CPR4) from the three-way valve (b)
slug and air feed superficial velocities
Figure 4.6: Dimensionless liquid film height as a function of time for probes 165
at 4.4 m (CPR1) and 6.2 m (CPR4) from the three-way valve with the trace
for probe CPR1 shifted by 0.70 s
Figure 4.7: Variation of slug front velocity with position for the runs summarised 170
in Table 4.1
Figure 4.8: Plot of the results from Table 4.1 in the form of the correlation 170
described in Chapter 5
Figure 4.9: Presentation of error results 173
List of Figures
Slug front gas entrainment in gas-liquid two-phase flow in horizontal and near horizontal pipes
PhD Thesis (MK Abdullahi, 2013) 22
Figure 4.10: Taitel & Dukler (1976) flow pattern map applied to LOTUS air-water 174
system for horizontal pipe
Figure 4.11: Time traces for the dimensionless liquid film height for = 6.55 m/s 175
= 0.015 m/s and = 2.45 m/s (A is stratified flow film height, B is the slug
front and C is the slug tail)
Figure 4.12: Slug flow gas entrainment rate as a function of relative velocity for the 175
LOTUS stratified flow push-in experiments
Figure 4.13: Slug flow gas entrainment rate per interfacial length as a function of 177
relative velocity for the LOTUS stratified flow push-in experiments
Figure 4.14: Comparison of slug flow gas entrainment rate as a function of relative 178
velocity for the LOTUS stratified flow push-in experiments with previous models
Figure 4.15: Slug flow gas entrainment rates as a function of relative velocity on 180
LOTUS with a stationary film ahead of the liquid slug
Figure 4.16: Slug flow gas entrainment rate per interfacial length with a stationary 181
film ahead of the slug front compared with (a) data obtained by Hale (2007)
(b) previous correlations
Figure 4.17: Liquid film flowing downward in a 10 inclined pipe 182
Figure 4.18: Slug flowing over liquid film flowing downward in a 10 upwards 182
inclined pipe
Figure 4.19: Slug flow gas entrainment rates for the experiments with the inclined 183
pipe (a) compared with stratified flow experiments correlation (b) compared with
Manolis data on WASP facility
List of Figures
Slug front gas entrainment in gas-liquid two-phase flow in horizontal and near horizontal pipes
PhD Thesis (MK Abdullahi, 2013) 23
Figure 4.20: Slug flow gas entrainment rates per interfacial length for the 184 experiments with the inclined pipe
Figure 4.21: Effect of film velocity on slug flow gas entrainment rates per 185
interfacial length in inclined pipe
Figure 4.22: Present data for slug flow gas entrainment rate in an upwards 185
inclined pipe per interface width as a function of relative velocity compared
to earlier correlations
Figure 4.23: Slug flow gas entrainment rates in a horizontal pipe with a dry pipe 186
ahead of the slug (LOTUS data with 32.8 mm pipe)
Chapter 5: Measurements of Slug Front Gas Entrainment Rates on the WASP 188
Facility (77.92 mm diameter pipe)
Figure 5.1: Slug flowing over stratified flow in horizontal test section (a) Stratified 190
air-water flow and 3-way valve closed (b) Liquid slug flowing over the stratified
flow and 3-way valve open
Figure 5.2: Taitel & Dukler (1976) flow pattern map applied to WASP air-water 192
system for horizontal pipe
Figure 5.3: Photograph of 3-way valve (top) and pneumatic actuator (bottom) 194
Figure 5.4: Time traces for dimensionless liquid film height in a typical WASP 196
experiment for = 4.206 m/s; = 0.024 m/s and = 2.25 m/s
Figure 5.5: Slug flow gas entrainment rate in horizontal pipe on WASP 197
Figure 5.6: Comparison of Slug flow gas entrainment rate per unit film width 198
for the experiments on WASP and LOTUS respectively in horizontal pipe
List of Figures
Slug front gas entrainment in gas-liquid two-phase flow in horizontal and near horizontal pipes
PhD Thesis (MK Abdullahi, 2013) 24
Figure 5.7: Comparison of slug flow gas entrainment per interfacial width on 199 WASP with earlier correlations
Figure 5.8: Comparison of slug flow gas entrainment on WASP with data for 200
a stationary film ahead of the slug obtained by Hale (2007)
Chapter 6: Bubble Experiments on LOWPRESS Facility (32.8 mm diameter pipe) 201
Figure 6.1: Schematic showing the progression of a bubble and slug front in 203
horizontal pipe
Figure 6.2: Bubble entrapment using globe valves (blue handles of valves shown) 205
Figure 6.3: Process of bubble entrapment and release using globe valves 205
Figure 6.4: Photograph of test section configured for bubble entrapment using 207
dog-leg
Figure 6.5: Sketch showing the motion of bubble and fragmentation along the pipe 207
for bubble entrapment using dog-leg
Figure 6.6: Photograph of test section configured for bubble entrapment using 209
bridge
Figure 6.7: Sketch showing the motion of bubble and fragmentation along the pipe 209
pipe for bubble entrapment using bridge
Figure 6.8: Time traces for the dimensionless liquid film height for bridge configured 210
run in horizontal pipe
Figure 6.9: Slug front gas entrainment from bridge-entrapped bubble experiments 212
compared with Equation 5.2 for the three-way valve experiments
List of Figures
Slug front gas entrainment in gas-liquid two-phase flow in horizontal and near horizontal pipes
PhD Thesis (MK Abdullahi, 2013) 25
Chapter 7: Visualisation of Slug Front Advance Using High Speed Video 214
Photography on LOWPRESS Facility (32.8 mm diameter pipe)
Figure 7.1: Sequence of images of slug flow over a stratified gas-liquid flow 216
= 1.54 m/s, = 0.0395 m/s and = 3.727 m/s in horizontal pipe
Figure 7.2: Motion of the slug front over stratified flows which had an initial gas 217
Velocity, of 1.54 m/s
Figure 7.3: Comparison of aerated slug front images for horizontal slug flow with 218
stratified gas-liquid flow at = 0.02959 m/s
Figure 7.4: Sequence of movie images for slug injection in a 10 upwards 219
inclined pipe
Figure 7.5: Slug front images for slug injection with back flow of liquid in a 10 220
upwardly inclined pipe
Figure 7.6: Sequence of instantaneous images for slug front progression over a 221
stationary liquid film (initial film height 10mm and slug injection velocity 3.727 m/s)
Figure 7.7: Slug front progression over a stationary film: Comparison of images 223
of slug front appearance for various cases
Figure 7.8: Comparison of slug front progression for stratified flow, downwards 225
film flow and stationary film cases (slug feed superficial velocity = 1.504 m/s)
List of Tables
Slug front gas entrainment in gas-liquid two-phase flow in horizontal and near horizontal pipes PhD Thesis (MK Abdullahi, 2013)
26
List of Tables
Chapter 1: Introduction 34
Table 1.1: Summary of the errors in predicted slug frequency 74
Chapter 2: Gas Entrainment in Slug Flows
Table 2.1: Comparison of experimental arrangements for the previous experiments 100
Chapter 3: Experimental Facilities and Methods
Table 3.1: Venturi meter specifications 125
Table 3.2: Task list for WASP modification work 135
Chapter 4: Measurements of Slug Front Gas Entrainment Rates on the LOTUS facility 158
(32.8 mm diameter pipe)
Table 4.1: Variation of slug front velocity at different gas-liquid stratified flow 169
velocities
Table 4.2: Error analysis conditions 172
Chapter 5: Measurements of Slug Front Gas Entrainment Rates on the WASP 188
Facility (77.92 mm diameter pipe)
Table 5.1: New 3-way valve operation 195
List of Symbols
Slug front gas entrainment in gas-liquid two-phase flow in horizontal and near horizontal pipes PhD Thesis (MK Abdullahi, 2013)
27
LIST OF SYMBOLS
Total cross sectional area of the pipe m2
Cross sectional area occupied by liquid phase m2
Cross sectional area occupied by gas phase m2
Average area occupied by the liquid in Eqn. (1.5.6.4) m2
Amplitude of the disturbance in Eqn. (1.5.6.4) m
Complex wave velocity m/s
Constant defined by Eqn. (1.5.1.13) ~
Distribution coefficient defined by Eqn. (2.46) ~
Real part of in Eqn. (1.5.6.5) m/s
Imaginary part of in Eqn. (1.5.6.5) m/s
Internal diameter of pipe m
Equivalent diameter for the gas phase m
Equivalent diameter for the liquid phase m
Eötvös number ~
Rate of production of surface energy N/m/s
Friction factor ~
List of Symbols
Slug front gas entrainment in gas-liquid two-phase flow in horizontal and near horizontal pipes
PhD Thesis (MK Abdullahi, 2013) 28
Dimensionless parameter defined by Eqn. (1.3.16a) ~
Entrainment of liquid in the gas core ~
Froude number ~
Acceleration due to gravity m/s2
Liquid height m
Dimensionless liquid height ~
k Constant in Eqn. (6.5)and wave number in Eqn. (1.5.6.4) ~
Dimensionless parameter defined by Eqn. (1.3.16b) ~
Length of pipe, slug liquid film, bubble m
Film region length m
Slug length m
Slug unit length m
Shedding rate of dispersed bubbles at the slug tail kg.s-1.m-1
Mass transfer per unit volume between the phase kg.s-1.m-3
Mass flow of liquid defined in Eqn. (1.5.3.1) kg/s
Pressure bar
Average hydrostatic pressure bar
Volumetric flow rate m3/s
Slip velocity (ratio of liquid to gas superficial velocities) ~
List of Symbols
Slug front gas entrainment in gas-liquid two-phase flow in horizontal and near horizontal pipes
PhD Thesis (MK Abdullahi, 2013) 29
Gas constant J/kmole K
Reynolds number ~
Perimeter occupied by gas phase m
Interfacial perimeter between gas and liquid phase m
Perimeter occupied by liquid phase m
Time s
Dimensionless parameter defined by Eqn. (1.3.16c) ~
Film region period s
Slug body period s
A parameter defined in Eqn. (1.5.4.16) kg/m/s2
Slug unit period s
Velocity m/s
Bubble tail velocity m/s
Drift flux velocity m/s
Time average gas velocity m/s
Time average liquid velocity m/s
Gas superficial velocity m/s
Liquid superficial velocity m/s
List of Symbols
Slug front gas entrainment in gas-liquid two-phase flow in horizontal and near horizontal pipes
PhD Thesis (MK Abdullahi, 2013) 30
Velocity of entrained gas m/s
Velocity of gas in the elongated bubble region m/s
Average gas velocity in the film region m/s
Average gas velocity in the slug body m/s
Velocity head defined by Eqn. (1.5.1.33) m/s
Bubble translational velocity m/s
Liquid film velocity m/s
Average fluid velocity at the slug tail m/s
Average liquid velocity in the slug body m/s
Slug feed superficial velocity m/s
Push-in ‘liquid slug’ velocity m/s
Average liquid velocity in the film region m/s
Mixture velocity m/s
Superficial mixture velocity m/s
Bubble or slug front velocity m/s
Initial volume of single bubble m3
Gas volume m3
Volumetric gas entrainment rate m3/s
List of Symbols
Slug front gas entrainment in gas-liquid two-phase flow in horizontal and near horizontal pipes
PhD Thesis (MK Abdullahi, 2013) 31
Volumetric flow rate of liquid film m3/s
Slug feed (pushing liquid) volumetric flow rate m3/s
Slug frequency s-1
Mass rate of flow kg/s
Weber number ~
Lockhart & Martinelli parameter in Eqn. (1.3.11) ~
Distance moved by slug or bubble m
and rate of pickup of mass into the slug kg/s
Lockhart & Martinelli parameter in Eqn. (1.3.12) ~
Parameter defined in Eqn. (1.5.3.32) ~
Greek letters
Gas fraction in the bubble section ~
Gas void fraction in liquid slug ~
Gas void fraction in slug unit ~
Liquid film holdup ~
Liquid film holdup at tail of slug ~
Liquid holdup in slug unit ~
List of Symbols
Slug front gas entrainment in gas-liquid two-phase flow in horizontal and near horizontal pipes
PhD Thesis (MK Abdullahi, 2013) 32
Volume average void fraction ~
Wavelength m
Density kg/m3
Shear stress N/m2
Dimensionless pressure drop ~
Rate of re-coalescence of entrained bubble with elongated bubble m/s
Rate of bubble re-entrainment from elongated bubble tail to wake m/s
Rate of gas entrainment in Eqn. (2.86) m/s
Angle degrees
Viscosity Ns/m2
Surface tension N/m
Subscripts
Accelerational
Bubble
Frictional or film
Gas
Gas bubble
Gas entrainment
List of Symbols
Slug front gas entrainment in gas-liquid two-phase flow in horizontal and near horizontal pipes
PhD Thesis (MK Abdullahi, 2013) 33
Hydrostatic
Interfacial or imaginary
Liquid or length
Liquid film
Liquid slug
Mixture
Pipe
Slug body
Superficial gas
Superficial liquid
Translational
Unit slug
Viscous
Chapter 1: Introduction
Slug front gas entrainment in gas-liquid two-phase flow in horizontal and near horizontal pipes PhD Thesis (MK Abdullahi, 2013)
34
Chapter 1: Introduction
Summary: In this chapter, the subject of gas-liquid two-phase flow is introduced and the
regimes occurring in gas-liquid two-phase flow in a horizontal pipe (and the transitions
between these regimes) are then described to provide a context for the main focus for the
work presented in this thesis, namely slug flow. Slug flows and the problems associated with
them are then described in more detail and the approaches used for modelling slug flow are
discussed. The final three sections of this chapter deal with the general objectives of the
work, with the approach taken and summarize the subsequent chapters respectively. The
headings of the Sections in this chapter are as follows:
1.1 Gas-Liquid Two-Phase Flow
1.2 Flow Regimes in Horizontal Pipes
1.3 Flow Transition and Flow Regime Maps for Horizontal and Inclined Pipeline Flows
1.4 Slug Flows
1.5 Slug Flow Models
1.6 General Objective of the Project
1.7 Project Approach
1.8 Summary of Subsequent Chapters
Chapter 1: Introduction
Slug front gas entrainment in gas-liquid two-phase flow in horizontal and near horizontal pipes
PhD Thesis (MK Abdullahi, 2013) 35
1.1 Gas-Liquid Two-Phase Flow
In many (perhaps most) chemical engineering systems, flows containing more than one
phase (i.e. multiphase flows) are commonly encountered. These systems include separation
units, chemical reactors, nuclear reactors, heat exchangers with tube bundles, pipeline
systems and host of others. Gas-liquid or vapour-liquid flows are encountered in oil and gas
pipelines, condensers, evaporators, distillation unit, absorbers, combustion systems, etc.
Liquid-liquid systems exist when dealing with liquid-liquid extraction and emulsions. Slurries
of solid particles in liquid are also commonly transported through pipelines. A better
understanding of multiphase flow helps in the design of multiphase systems. The emphasis
of the present project is on flows of gas-liquid mixtures in horizontal and slightly inclined
pipes.
1.2 Flow Regimes in Horizontal Pipe
For gas-liquid two-phase flow in a horizontal pipe, a variety of flow patterns may occur.
These patterns are dictated by the gas and liquid flow rates and the fluid physical
properties. The most important flow patterns are bubble flow, stratified smooth flow,
stratified wavy flow, slug flow and annular flow. The nature of these regimes is discussed in
more detail below. The focus of the present work is on slug flow. Though the emphasis of
the present work is on horizontal flow, it should be emphasized that the flow patterns are
strongly influenced by pipe inclination. Even an inclination of 0.5o can dramatically alter the
flow patterns and the fundamental transport mechanisms (Baker, 2005).
Classification and description of the flow distributions into flow patterns or flow regimes is
still often a very subjective process. However, there are some generally accepted
descriptions such as those of Mandhane et al. (1974), Taitel & Dukler (1976) and Hewitt
(1978). The following regimes are the most commonly described for horizontal and near
horizontal flows (Figure 1.1).
Chapter 1: Introduction
Slug front gas entrainment in gas-liquid two-phase flow in horizontal and near horizontal pipes
PhD Thesis (MK Abdullahi, 2013) 36
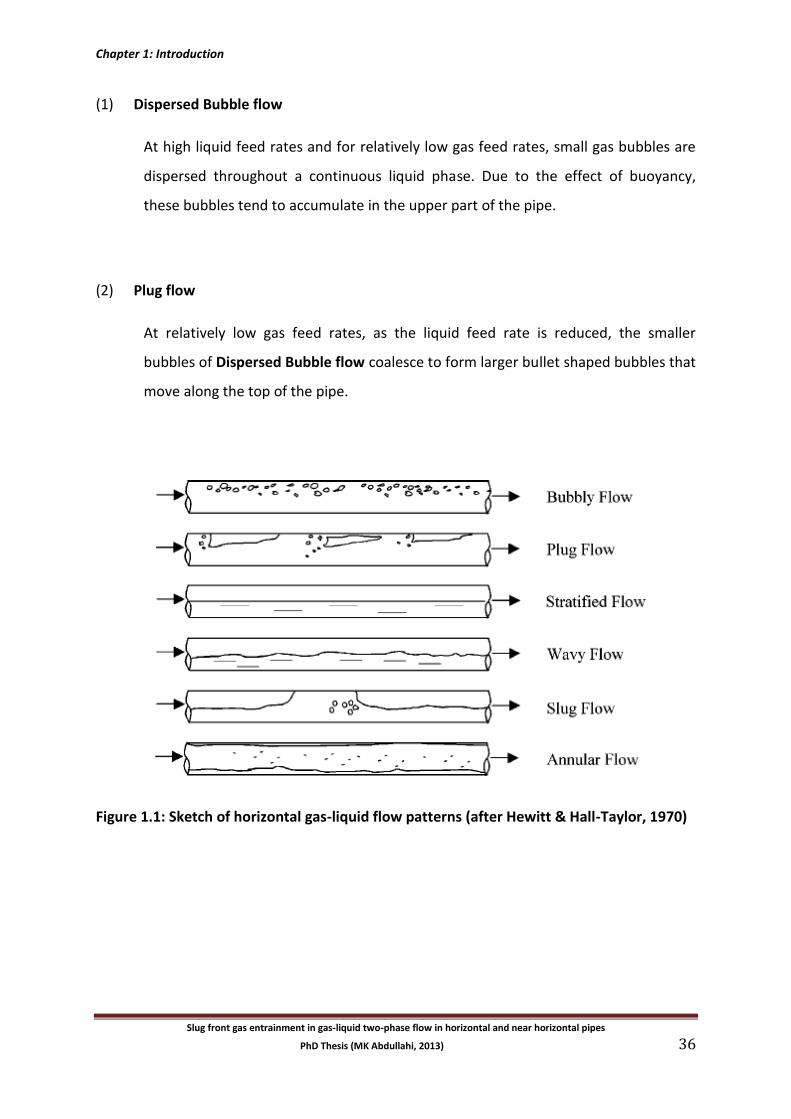
(1) Dispersed Bubble flow
At high liquid feed rates and for relatively low gas feed rates, small gas bubbles are
dispersed throughout a continuous liquid phase. Due to the effect of buoyancy,
these bubbles tend to accumulate in the upper part of the pipe.
(2) Plug flow
At relatively low gas feed rates, as the liquid feed rate is reduced, the smaller
bubbles of Dispersed Bubble flow coalesce to form larger bullet shaped bubbles that
move along the top of the pipe.
Figure 1.1: Sketch of horizontal gas-liquid flow patterns (after Hewitt & Hall-Taylor, 1970)
Chapter 1: Introduction
Slug front gas entrainment in gas-liquid two-phase flow in horizontal and near horizontal pipes
PhD Thesis (MK Abdullahi, 2013) 37
(3) Stratified Smooth flow
At low liquid and gas feed rates gravitational effects cause total separation of the
two phases. This results in the liquid flowing along the bottom of the pipe and the
gas flowing along the top.
(4) Stratified Wavy flow
As the gas velocity is increased in Stratified Smooth flow the interfacial shear forces
increase, rippling the liquid surface and producing a wavy interface.
(5) Slug flow
As the gas and liquid feed rates are increased further, the interface becomes
progressively more wavy until eventually the whole cross-section of the pipe is
blocked by a wave. The resultant "piston" of liquid is then accelerated by the gas
flow; surging along the pipe, and scooping up the liquid film in front as it progresses
and may entrain some gas. This "piston" is followed by a region containing an
elongated gas bubble moving over a thin liquid film. Hence an intermittent regime
develops in which elongated gas bubbles and liquid slugs alternately pass along the
pipe.
(6) Annular flow
At even higher gas flow rates, the gas passes through the centre of the pipe leaving a
ring or annulus of liquid around the inside of the pipe, which due to gravity, is thicker
at the bottom. Some liquid may also be entrained in the gas core as small, dispersed
droplets.
Chapter 1: Introduction
Slug front gas entrainment in gas-liquid two-phase flow in horizontal and near horizontal pipes
PhD Thesis (MK Abdullahi, 2013) 38
1.3 Flow Transition and Flow Regime Maps for Horizontal and Inclined Pipeline Flows
Gas-liquid flow can assume different distributions within a pipeline depending on flow rates,
inclination and fluid properties. In many engineering fields, knowledge of flow regime is
essential to properly design, analyse and operate multiphase flow systems. For example, to
accurately estimate the pressure drop and void fraction, it is necessary to know the actual
flow pattern under the specified flow conditions. A wide variety of flow patterns have been
examined depending up on the fluid physical properties and input fluxes of the two phases
and the size and inclination of the pipe.
Flow regime distinction forms a fundamental element of pipeline design since different flow
patterns have different pressure and velocity profiles. For instance the pressure drop for a
dispersed bubble flow (predominantly liquid), will differ from that of an annular-dispersed
flow (predominantly gas) and this has a profound influence on design. Photographic,
conductance and radiation-absorption techniques are often used to deduce flow patterns;
however, the characterisation of flow patterns can still be subjective. Wall effects and the
physical orientation of the pipe (horizontal, inclined or vertical) are additional factors that
complicate flow regime delineation. The existence of deformable interfaces and the
consequential existence of a variety of flow patterns make prediction of two-phase gas-
liquid flows very difficult; a common approach is to develop phenomenological models
based on the physical observations.
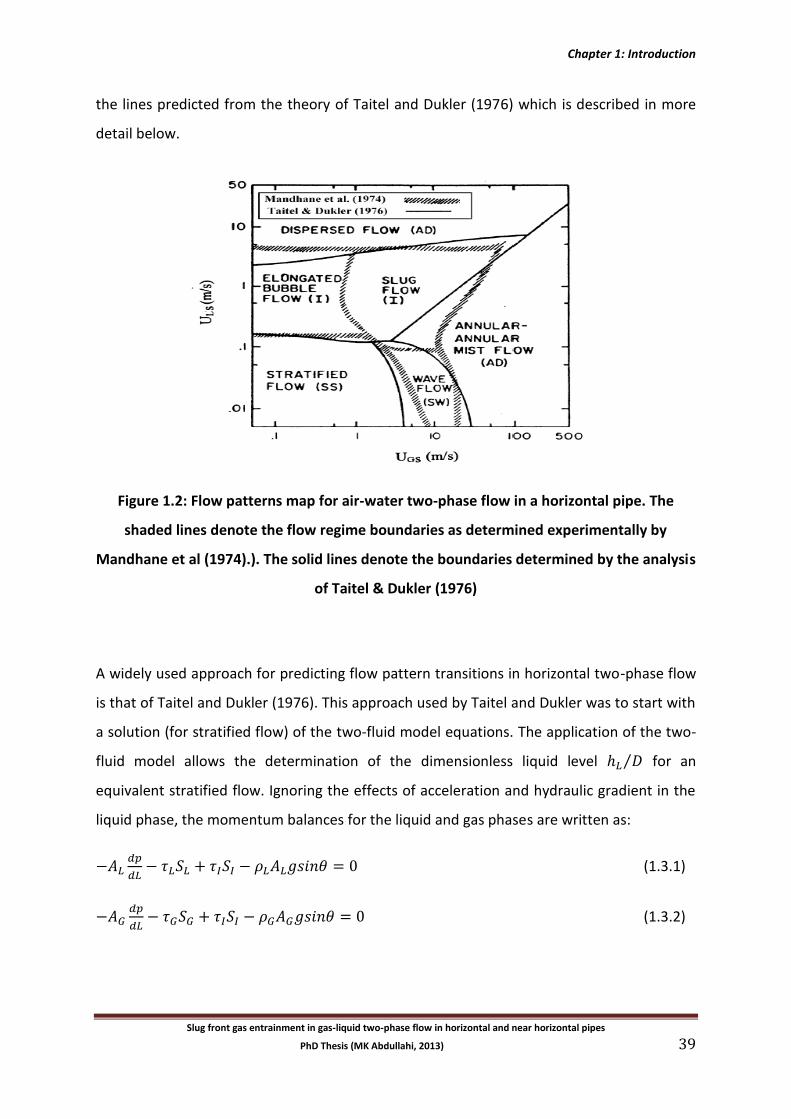
Observations on flow patterns are conveniently expressed in terms of flow pattern maps or
flow regime maps. Here, the regions of occurrence of the various regimes are plotted in
terms of variable such as the superficial velocities of the respective phases. Figure 1.2 shows
an example of such a map produced by Mandhane et al (1974). This map is a plot of liquid
flow rate against gas flow rate for an air-water two phase system. One can clearly see that
whilst annular flow is limited to very high gas flow rates, and bubble flow is limited to very
high liquid flow rates, the slug flow regime lies in the middle of the diagram, and can occur
over a wide range of gas and liquid flow rates. This fact, in conjunction with the intermittent
nature and prevalence of the regime in the petrochemical industry, where it is a commonly
observed flow regime, make the study of slug flow imperative. Also shown in Figure 1.2 are
Chapter 1: Introduction
Slug front gas entrainment in gas-liquid two-phase flow in horizontal and near horizontal pipes
PhD Thesis (MK Abdullahi, 2013) 39
the lines predicted from the theory of Taitel and Dukler (1976) which is described in more
detail below.
Figure 1.2: Flow patterns map for air-water two-phase flow in a horizontal pipe. The
shaded lines denote the flow regime boundaries as determined experimentally by
Mandhane et al (1974).). The solid lines denote the boundaries determined by the analysis
of Taitel & Dukler (1976)
A widely used approach for predicting flow pattern transitions in horizontal two-phase flow
is that of Taitel and Dukler (1976). This approach used by Taitel and Dukler was to start with
a solution (for stratified flow) of the two-fluid model equations. The application of the two-
fluid model allows the determination of the dimensionless liquid level ⁄ for an
equivalent stratified flow. Ignoring the effects of acceleration and hydraulic gradient in the
liquid phase, the momentum balances for the liquid and gas phases are written as:
(1.3.1)
(1.3.2)
Chapter 1: Introduction
Slug front gas entrainment in gas-liquid two-phase flow in horizontal and near horizontal pipes
PhD Thesis (MK Abdullahi, 2013) 40
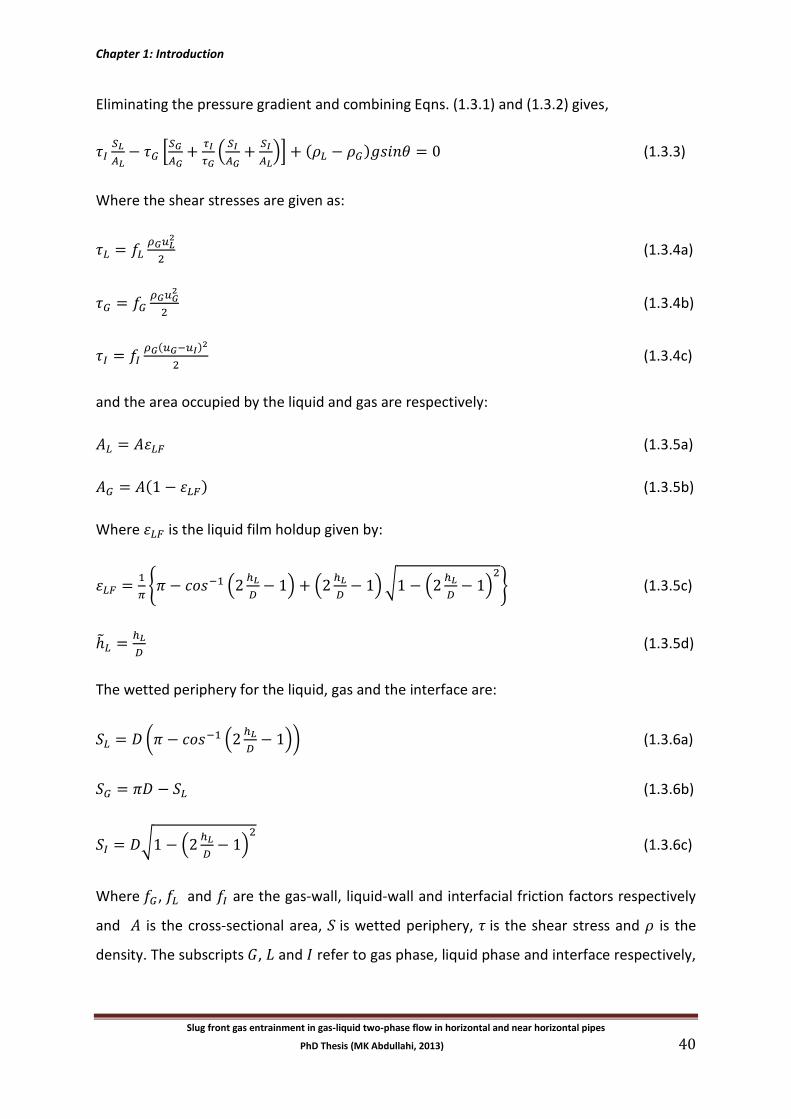
Eliminating the pressure gradient and combining Eqns. (1.3.1) and (1.3.2) gives,
[
(
)] ( ) (1.3.3)
Where the shear stresses are given as:
(1.3.4a)
(1.3.4b)
( )
(1.3.4c)
and the area occupied by the liquid and gas are respectively:
(1.3.5a)
( ) (1.3.5b)
Where is the liquid film holdup given by:
{ (
) (
)√ (
)
} (1.3.5c)
(1.3.5d)
The wetted periphery for the liquid, gas and the interface are:
( (
)) (1.3.6a)
(1.3.6b)
√ (
)
(1.3.6c)
Where , and are the gas-wall, liquid-wall and interfacial friction factors respectively
and is the cross-sectional area, is wetted periphery, is the shear stress and is the
density. The subscripts , and refer to gas phase, liquid phase and interface respectively,
Chapter 1: Introduction
Slug front gas entrainment in gas-liquid two-phase flow in horizontal and near horizontal pipes
PhD Thesis (MK Abdullahi, 2013) 41
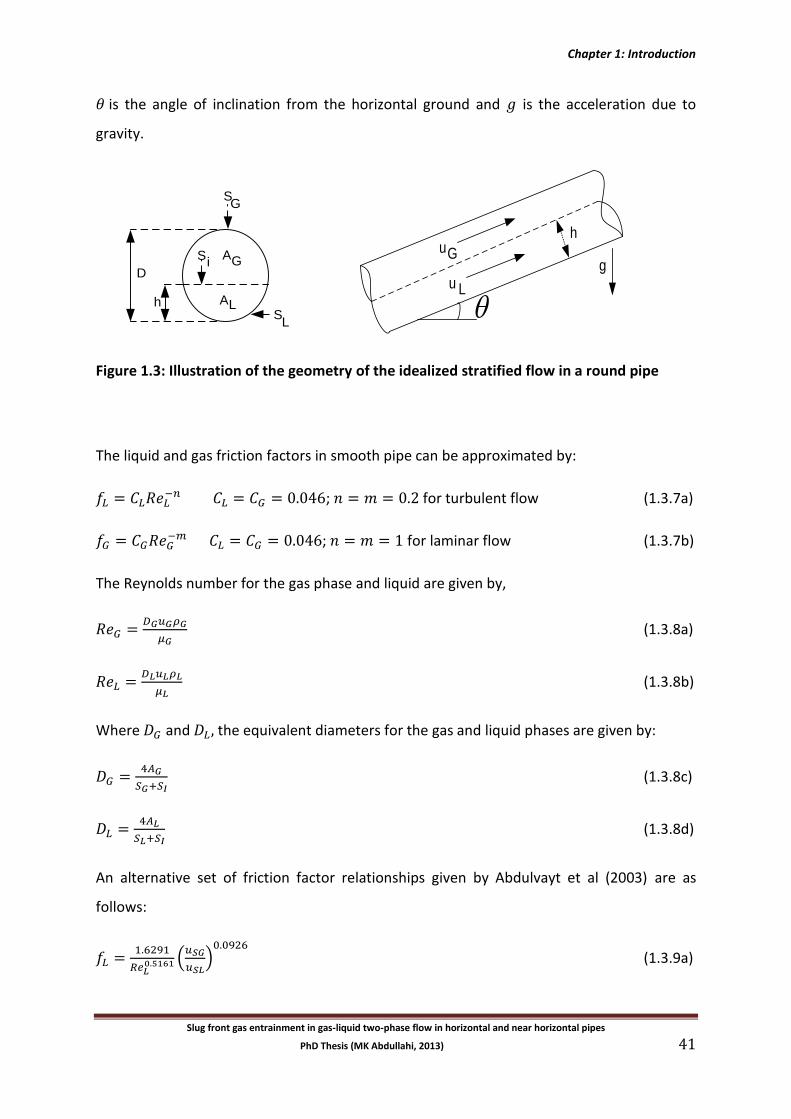
is the angle of inclination from the horizontal ground and is the acceleration due to
gravity.
D
h
A
A
L S
i S
L
G
G
S
gu
u
G
L
h
Figure 1.3: Illustration of the geometry of the idealized stratified flow in a round pipe
The liquid and gas friction factors in smooth pipe can be approximated by:
; for turbulent flow (1.3.7a)
; for laminar flow (1.3.7b)
The Reynolds number for the gas phase and liquid are given by,
(1.3.8a)
(1.3.8b)
Where and the equivalent diameters for the gas and liquid phases are given by:
(1.3.8c)
(1.3.8d)
An alternative set of friction factor relationships given by Abdulvayt et al (2003) are as
follows:
(
)
(1.3.9a)
Chapter 1: Introduction
Slug front gas entrainment in gas-liquid two-phase flow in horizontal and near horizontal pipes
PhD Thesis (MK Abdullahi, 2013) 42
(1.3.9b)
When,
then
(1.3.9c)
Taitel and Dukler substituted Eqns. (1.3.7) – (1.3.8), into Eqn. (1.3.3) leading to the following
result (dimensional quantities are designated with a tilde),
(
)
(
) |
| (
) (1.3.10)
Where:
⁄ and ⁄
⁄ and ⁄
⁄ ; ⁄ and ⁄
⁄ and ⁄
is the Lockhart and Martinelli (1949) parameter defined as:
( ⁄ )
( ⁄ ) (1.3.11)
where the subscript refers to the frictional pressure gradient. is a parameter defined by
Taitel & Dukler (1976) to represent the effect of pipe inclination given by:
( )
( ⁄ ) (1.3.12)
All dimensionless quantities with a tilde (~) are functions of the dimensionless liquid height,
. This allowed Taitel and Dukler to relate uniquely to X and Y via Equation 1.3.10.
Taitel and Dukler then used the relationship for dimensionless liquid height together with
semi-theoretical expressions to obtain the regime transitions in terms of
and several
Chapter 1: Introduction
Slug front gas entrainment in gas-liquid two-phase flow in horizontal and near horizontal pipes
PhD Thesis (MK Abdullahi, 2013) 43
dimensionless groups as shown in Figure 1.4. Examples are Taitel and Dukler relationship for
the transition from stratified flow to intermittent flow based on the Kelvin-Helmholtz
instability (Taitel and Dukler, 1976) as follows:
(
)
√( )
√
(1.3.13)
If the gas velocity on the left hand side (LHS) is greater than the expression on the right
hand side (RHS), then the Bernoulli suction force overcomes the gravity force causing the
flow to be unstable and the transition from stratified to non-stratified occurs. On the other
hand, if the inequality is not satisfied namely LHS < RHS, then the flow is stable and
stratified flow will exist in the pipe (Shoham, 2006).
where
√ (
)
(1.3.14)
and the transition from slug to annular flow given by Taitel and Dukler as follows:
or
(1.3.15)
Taitel and Dukler (1976) expressed the various transitions in terms of the following
dimensionless groups (which are also functions of ):
√
√ (1.3.16a)
[
( ) ] ⁄
(1.3.16b)
[( ⁄ )
( ) ] (1.3.16c)
Where , and are dimensionless parameters shown on the axes in the Figures 1.4 and
1.5. Since these dimensionless groups are also functions of ⁄ , the transitions can be
plotted in terms of , , and ⁄ as shown in Figure 1.4 (taken from Pan (2010). For a
horizontal channel, ⁄ is a function of (since, for this case, ) via Eqn. (1.3.10);
thus, the transition lines can also be plotted in terms of as shown in Figure 1.5. For the
Chapter 1: Introduction
Slug front gas entrainment in gas-liquid two-phase flow in horizontal and near horizontal pipes
PhD Thesis (MK Abdullahi, 2013) 44
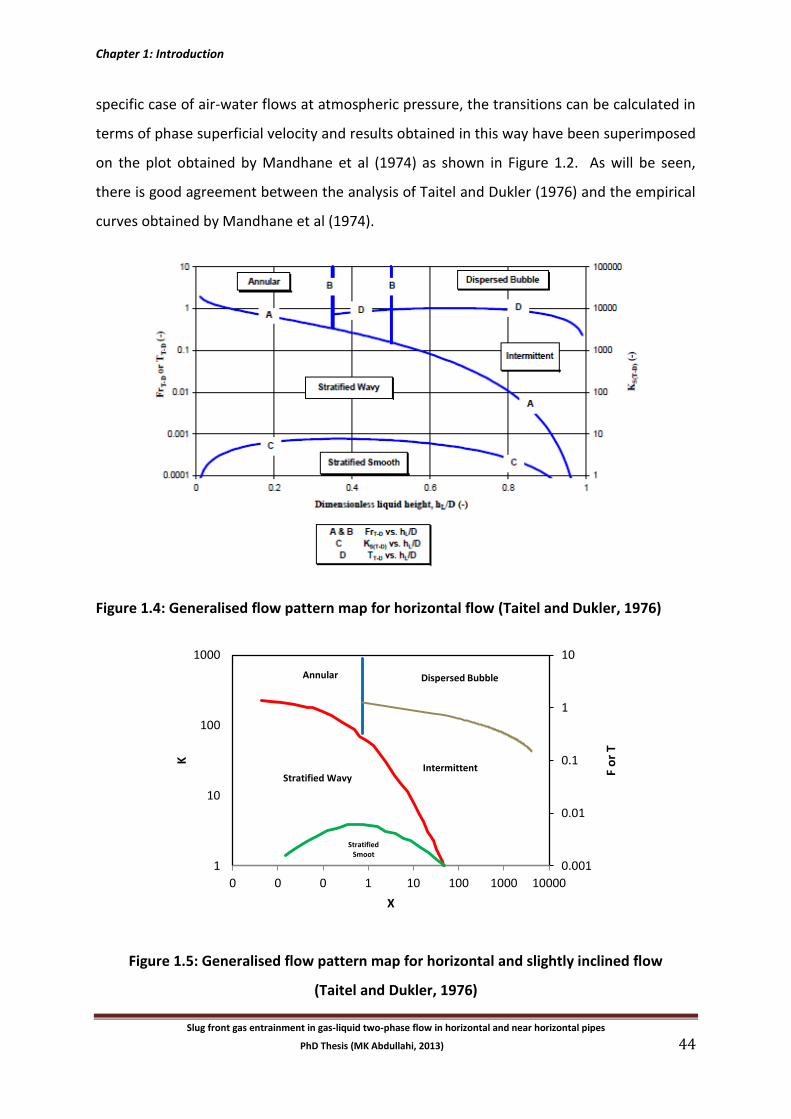
specific case of air-water flows at atmospheric pressure, the transitions can be calculated in
terms of phase superficial velocity and results obtained in this way have been superimposed
on the plot obtained by Mandhane et al (1974) as shown in Figure 1.2. As will be seen,
there is good agreement between the analysis of Taitel and Dukler (1976) and the empirical
curves obtained by Mandhane et al (1974).
Figure 1.4: Generalised flow pattern map for horizontal flow (Taitel and Dukler, 1976)
Figure 1.5: Generalised flow pattern map for horizontal and slightly inclined flow
(Taitel and Dukler, 1976)
0.001
0.01
0.1
1
10
1
10
100
1000
0 0 0 1 10 100 1000 10000
F o
r T
K
X
Dispersed Bubble
Stratified Wavy
Stratified Smoot
Annular
Intermittent
Chapter 1: Introduction
Slug front gas entrainment in gas-liquid two-phase flow in horizontal and near horizontal pipes
PhD Thesis (MK Abdullahi, 2013) 45
Further information on flow pattern transitions in two-phase gas-liquid flow is given by
Watson & Hewitt (1999); Ishi & Tsoukalas (2001); Simons & Hanratty (2001), Hurlburt &
Hanratty (2002), Issa & Kempf (2003), Hewitt (2005) and Mahvash & Ross (2008). Kirpalani
et al (2007) has information on flow regimes for small diameter tubes and curved geometry
systems. Xu et al (2007) presented the results of an extensive study of flow regime
transitions for air/non-Newtonian shear-thinning fluid systems using 10 m long, 20-60 mm
diameter tubes inclined at various angles from horizontal to vertical; for shallow
inclinations, their experimental results agreed satisfactorily with the theoretical maps
presented by Barnea (1987).
1.4 Slug Flows
Slug flows occur in horizontal, inclined and vertical pipes over a wide range of gas and
liquid flow rates. It is a dominant flow pattern in upward inclined flow (Shoham (2006).
Slug flow is characterized by an alternating flow of gas pockets and liquid slugs. The gas
phase is usually concentrated in large bullet-shaped pockets; for vertical flows, these
pockets are often called “Taylor bubbles”. The gas pockets are separated by liquid slugs,
which may contain small entrained gas bubbles. The gas pockets flow in the upper part
of the pipe for horizontal and inclined flow, while in vertical flow the gas pockets (Taylor
bubbles) are symmetric around the pipe axis. The occurrence of slugs of liquid in
multiphase processes is one of the major problems in multiphase transport pipeline
systems, particularly in the oil and gas industry. Slug flow is encountered in a number of
practical situations as listed below (Fabre; 1992):
production of hydrocarbons in oil fields and their transportation in pipelines;
production of steam and water in geothermal power plants;
boiling and condensation in vapour-liquid systems of thermal power plants;
emergency core cooling of nuclear reactors
heat and mass transfer between gas and liquid in chemical reactors.
Chapter 1: Introduction
Slug front gas entrainment in gas-liquid two-phase flow in horizontal and near horizontal pipes
PhD Thesis (MK Abdullahi, 2013) 46
1.4.1 Description of Slug flow
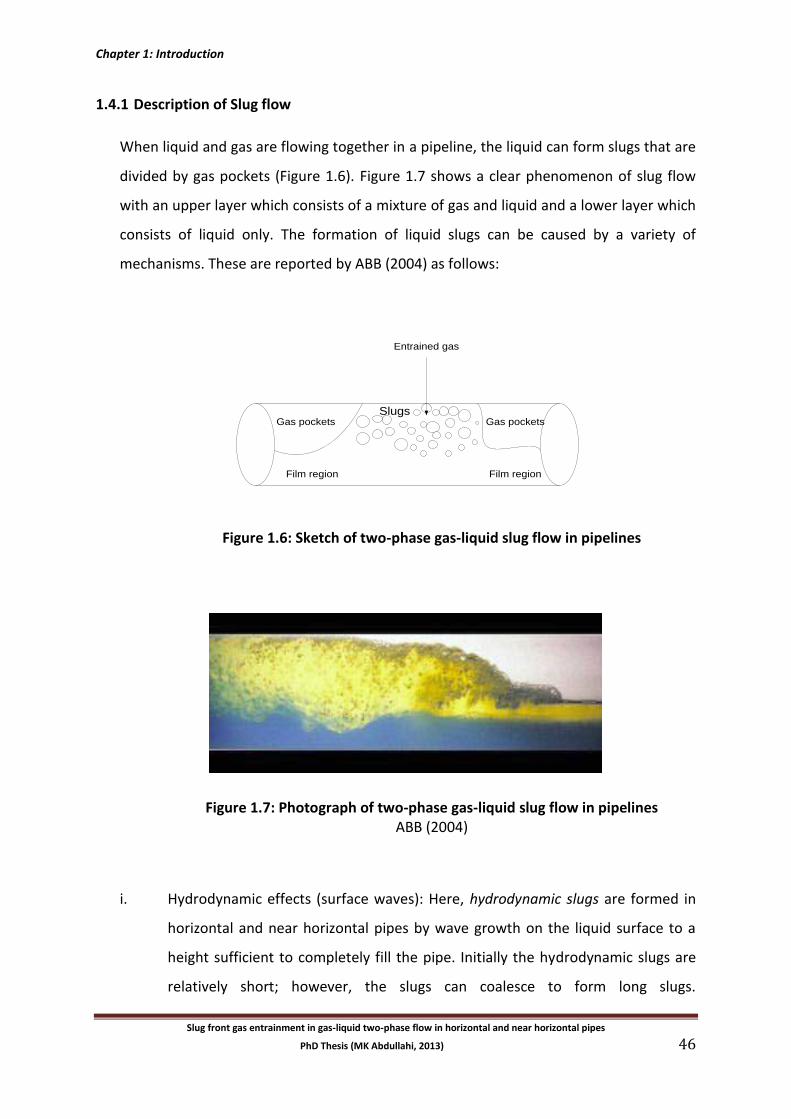
When liquid and gas are flowing together in a pipeline, the liquid can form slugs that are
divided by gas pockets (Figure 1.6). Figure 1.7 shows a clear phenomenon of slug flow
with an upper layer which consists of a mixture of gas and liquid and a lower layer which
consists of liquid only. The formation of liquid slugs can be caused by a variety of
mechanisms. These are reported by ABB (2004) as follows:
Gas pockets
Film region
Slugs
Entrained gas
Film region
Gas pockets
Figure 1.6: Sketch of two-phase gas-liquid slug flow in pipelines
Figure 1.7: Photograph of two-phase gas-liquid slug flow in pipelines ABB (2004)
i. Hydrodynamic effects (surface waves): Here, hydrodynamic slugs are formed in
horizontal and near horizontal pipes by wave growth on the liquid surface to a
height sufficient to completely fill the pipe. Initially the hydrodynamic slugs are
relatively short; however, the slugs can coalesce to form long slugs.
Chapter 1: Introduction
Slug front gas entrainment in gas-liquid two-phase flow in horizontal and near horizontal pipes
PhD Thesis (MK Abdullahi, 2013) 47
Hydrodynamic slugging is difficult to prevent since it occurs over a wide range of
flow conditions. Repeated impacts of slug passages for instance through bends
can cause fatigue in pipeline systems. It is therefore necessary to predict the slug
volume, velocity and frequency.
ii. Terrain effects (dips in pipe layout): Terrain slugging is typically created near a
dip in a flow line, well or riser and can in principle only occur if there is a
downward flow followed by an upward flow (for example where there is a
section of downwards inclined pipe leading to a riser – “riser induced slugging”).
Here, liquid collects in and blocks the downward inclined pipe and is periodically
pushed up the riser when the gas pressure behind the blockage builds up
sufficiently to push the liquid out. The large flow surges associated with severe
slugs can cause serious operational problems for topside equipment such as
separator vessels and compressors. Understanding the phenomena of terrain
induced slugging might prevent shutdowns and production loss.
iii. Other slugging types are caused by pipe operations. Pigging of a pipeline causes
most of the liquid inventory to be pushed from the line as a liquid slug ahead of
the pig. Shutdown of a line will drain the liquid that is left in the line down to low
level. At start up, the accumulated liquid exits the pipeline as slugs. Such
operational slugs can also occur if the gas flow rate is increased; in this case, a
slug formed near the entrance grows by picking up the previously-existing thicker
liquid layer ahead of the slug.
Chapter 1: Introduction
Slug front gas entrainment in gas-liquid two-phase flow in horizontal and near horizontal pipes
PhD Thesis (MK Abdullahi, 2013) 48
1.4.2 Problems related to slugging
Several operational problems can be attributed to slugging:
1 Liquid overflow: liquid overflow in separators may be caused by the formation of
slugs in the pipelines feeding the separator. When the slug enters, the liquid level
rises higher than the separator can purge.
2 High pressure: high pressure in the separator or near the outlet can be a serious
safety problem. An intermittent surge in gas production can lead to high pressure in
separator vessels and leads to shut down. Slugs can create large pressure impacts,
especially when passing through valves or bends. For example if an orifice is half the
pipe area, the slugs can cause pressure surge fifteen times higher than the tank
pressure (The ABB Group, 2004). This may lead to pipeline rupture.
3 Overload on gas compressors: downstream equipment, such as compressors, require
steady gas flow rate. Slug flow typically gives an oscillating gas flow rate with very
high periodic surges. This was the main reason for the shutdown of the Vallhall field
where the gas compressors needed a relatively steady inflow of gas (The ABB Group,
2004).
4 High frictional pressure loss: the hydrodynamic slug flow regime cause a high
frictional pressure loss compared to other flow regimes. Therefore, a change into
this regime along flow lines might give decreased flow capacity.
1.5 Slug Flow Models
The complex nature of slug flow has hindered development of accurate predictive models.
However, several phenomenological models have been developed that enable reasonable
prediction of the flow characteristics, such as the average liquid holdup and pressure
gradient. In this section some of the models are presented.
Chapter 1: Introduction
Slug front gas entrainment in gas-liquid two-phase flow in horizontal and near horizontal pipes
PhD Thesis (MK Abdullahi, 2013) 49
1.5.1 Dukler and Hubbard (1975) horizontal slug flow model
Dukler and Hubbard (1975) used a facility with a horizontal pipe, 19.8 m long and 38 mm
internal diameter test section to acquire data on air-water two-phase slug flow. From their
observations, Dukler and Hubbard developed a mathematical model that predicts the
features of hydrodynamic slug flow, such as the slug length, slug velocity, holdup and
pressure distribution. The model was in good agreement with experimental data.
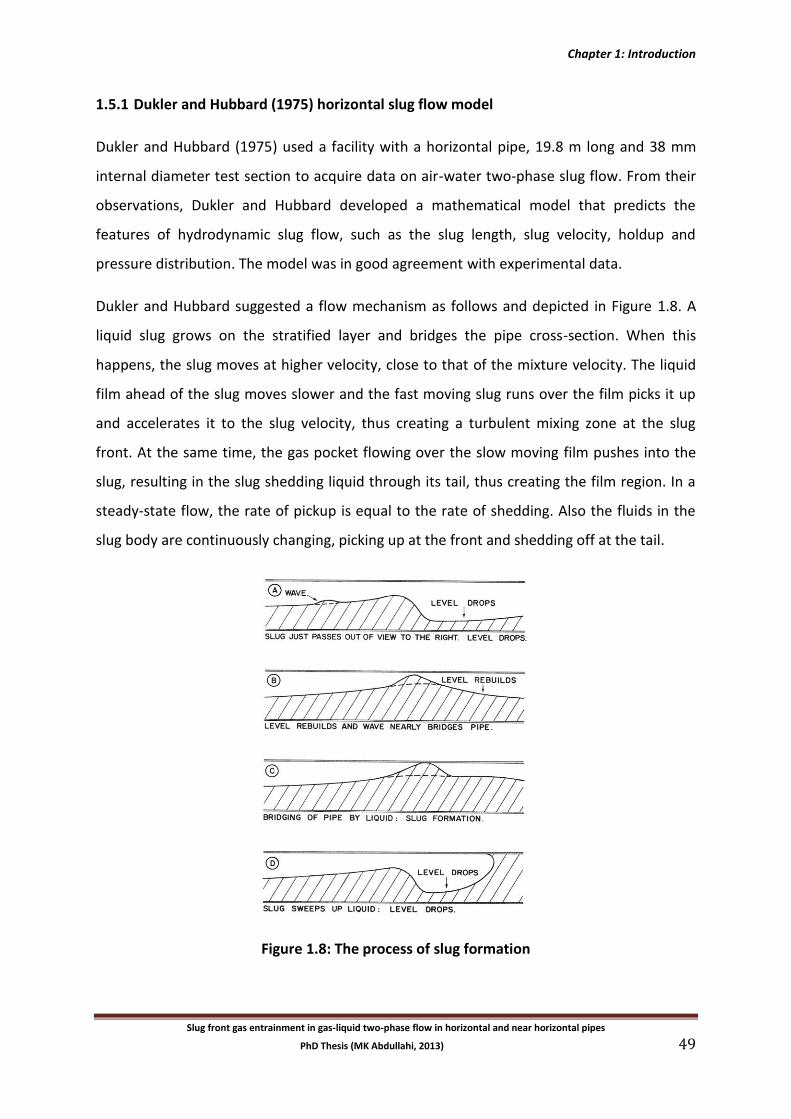
Dukler and Hubbard suggested a flow mechanism as follows and depicted in Figure 1.8. A
liquid slug grows on the stratified layer and bridges the pipe cross-section. When this
happens, the slug moves at higher velocity, close to that of the mixture velocity. The liquid
film ahead of the slug moves slower and the fast moving slug runs over the film picks it up
and accelerates it to the slug velocity, thus creating a turbulent mixing zone at the slug
front. At the same time, the gas pocket flowing over the slow moving film pushes into the
slug, resulting in the slug shedding liquid through its tail, thus creating the film region. In a
steady-state flow, the rate of pickup is equal to the rate of shedding. Also the fluids in the
slug body are continuously changing, picking up at the front and shedding off at the tail.
Figure 1.8: The process of slug formation
Chapter 1: Introduction
Slug front gas entrainment in gas-liquid two-phase flow in horizontal and near horizontal pipes
PhD Thesis (MK Abdullahi, 2013) 50
The model requires two closure variables; these are slug frequency and slug body holdup.
Dukler and Hubbard assumed homogenous no-slip flow in the slug body. The model
identifies two components of the pressure drop in the slug, namely the accelerational
pressure drop in the mixing zone and frictional pressure drop in the slug body. The
accelerational pressure drop is due to the acceleration to the slug velocity of liquid picked
up at the slug front from the liquid film ahead of the slug while the frictional pressure drop
results from the shear between the slug body and the pipe wall.
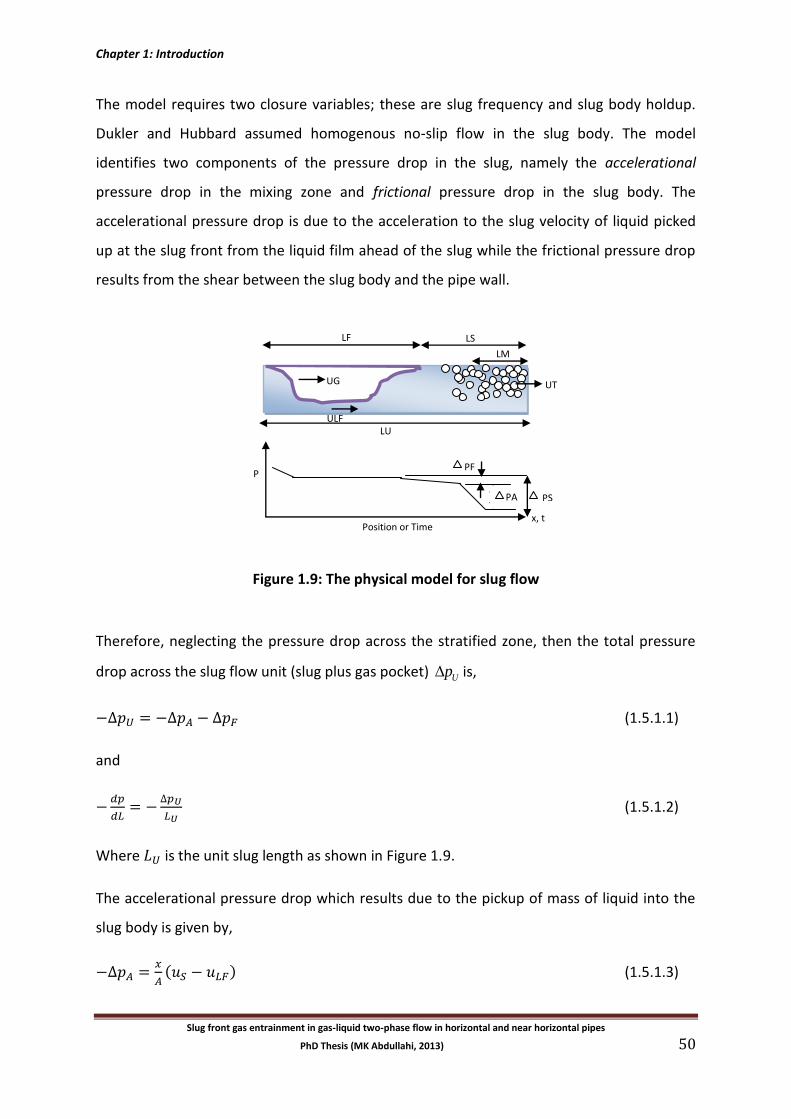
Figure 1.9: The physical model for slug flow
Therefore, neglecting the pressure drop across the stratified zone, then the total pressure
drop across the slug flow unit (slug plus gas pocket) Up is,
(1.5.1.1)
and
(1.5.1.2)
Where is the unit slug length as shown in Figure 1.9.
The accelerational pressure drop which results due to the pickup of mass of liquid into the
slug body is given by,
( ) (1.5.1.3)
P
x, t Position or Time
ULF
PS
PF
LU
LM
LS LF
UT UG
PA
Chapter 1: Introduction
Slug front gas entrainment in gas-liquid two-phase flow in horizontal and near horizontal pipes
PhD Thesis (MK Abdullahi, 2013) 51
Where is the rate of pickup of mass into the slug; is the mean velocity of the fluids in
the slug body (equivalent to the mixture velocity) and is the velocity of liquid film ahead
of the slug.
The frictional pressure drop which is required to overcome the shear stress between the
slug body and the pipe wall is given by,
(1.5.1.4)
Where is the density of the slug body and is given by,
( ) (1.5.1.5)
and are the liquid and gas densities respectively and is the slug body holdup.
The Fanning friction factor can be estimated from Eqn. (1.3.4). The Reynolds number in
the slug body is determined using the relation below.
(1.5.1.6)
Here the slug viscosity, is based on the slug liquid holdup as,
( ) (1.5.1.7)
Dukler & Hubbard related the slug body velocity to the slug front velocity by applying a mass
balance over a control volume bounded by the slug front and a plane with respect to a
coordinate system moving at the slug front velocity, .1 In this situation, the interface is
stationary while all the liquid flows backward.
The total volumetric flow rate of the mixture which is constant is given by,
(1.5.1.8)
The liquid film flows backward at and the liquid slug at . Then applying the
liquid continuity equation results in,
( ) ( ) (1.5.1.9)
1 This methodology was simplified by Shoham (2006).
Chapter 1: Introduction
Slug front gas entrainment in gas-liquid two-phase flow in horizontal and near horizontal pipes
PhD Thesis (MK Abdullahi, 2013) 52
This equation defines the pickup rate. By rearranging,
(1.5.1.10)
Therefore, Equation (1.5.1.10) can be rewritten as,
( ) (1.5.1.11)
Where,
(1.5.1.12)
Also from the shedding process analysis, Dukler & Hubbard correlated as a function of slug
body Reynolds number as,
( ) ( ) (1.5.1.13)
The velocity of the liquid film in the framework is:
(1.5.1.14)
Applying a momentum balance to a differential control volume of liquid film of width
gives:
(
)
( ) (1.5.1.15)
Where , is the average hydrostatic pressure acting on a cross sectional area of the film.
Differentiating the hydrostatic pressure and the internal term gives:
( )
∫ ( )
(1.5.1.16)
and
(
)
(1.5.1.17)
Where is the film local width and
, substituting Eqns. (1.5.1.16) and (1.5.1.17)
into Eqn. (1.5.1.15) and solving for
gives the final equation for the film profile as:
Chapter 1: Introduction
Slug front gas entrainment in gas-liquid two-phase flow in horizontal and near horizontal pipes
PhD Thesis (MK Abdullahi, 2013) 53
(1.5.1.18)
The slug unit period, which is the time a slug unit takes to pass a given point, is the
reciprocal of slug frequency given by,
(1.5.1.19)
where is the slug frequency
Therefore, the slug unit length is given by,
(1.5.1.20)
And the slug length is,
(1.5.1.21)
where the slug body period.
Hence,
(1.5.1.22)
By taking an overall mass on the liquid phase, the liquid slug length is determined as,
( ∫
)
(1.5.1.23)
Alternatively,
( ∫
)
(1.5.1.24)
Using the integration with time,
( ) ( ) (1.5.1.25)
and
( ( )) (1.5.1.26)
Chapter 1: Introduction
Slug front gas entrainment in gas-liquid two-phase flow in horizontal and near horizontal pipes
PhD Thesis (MK Abdullahi, 2013) 54
also
,
,
and
(1.5.1.27)
Putting Equations (1.5.1.25) and (1.5.1.26) into (1.5.1.23) and rearranging gives,
{ ∫ [ ( )]
} (1.5.1.28)
By assuming an equilibrium liquid film in stratified region, the integral in Eqn. (1.5.1.28) is
simplified giving,
{ [ ( )]} (1.5.1.29)
And substituting for in terms of and solving for , then the final equation for the slug
length is,
( )[
( )] (1.5.1.30)
The gas-phase velocity in the film region can be deduced by taking mass balance in the
translational velocity coordinate system in the control volume. The mass balance between
the two planes and the resulting equation for the gas velocity is,
( )( ) ( )( ) (1.5.1.31)
And hence,
(
) (1.5.1.32)
The length of the mixing zone is based on the correlation for the velocity head and is given
by,
( )
(1.5.1.33)
The calculation procedure for the Dukler and Hubbard method is as follows:
Specify input parameters: , , , fluid properties, and
Calculate the slug velocity from Eqn. (1.5.1.8)
Chapter 1: Introduction
Slug front gas entrainment in gas-liquid two-phase flow in horizontal and near horizontal pipes
PhD Thesis (MK Abdullahi, 2013) 55
Determine from Eqn. (1.5.1.13) or empirically for laminar flow and for
turbulent flow; and from Eqn. (1.5.1.11) and Eqn. (1.5.1.12) respectively
Assume a value for then carry out the following iterative calculations:
Calculate from Eqn. (1.5.1.22)
Integrate numerically Eqn. (1.5.1.18) from to , determine ( ), ( ),
( ) and ( ).
Calculate from Eqn. (1.5.1.30)
Compare the assumed and calculated values of if there is no convergence, repeat the
steps
Then calculate: from the final result of the integration of Eqn. (1.5.1.18), from
Eqn. (1.5.1.3) and from Eqn. (1.5.1.16) and from Eqn. (1.3.4).
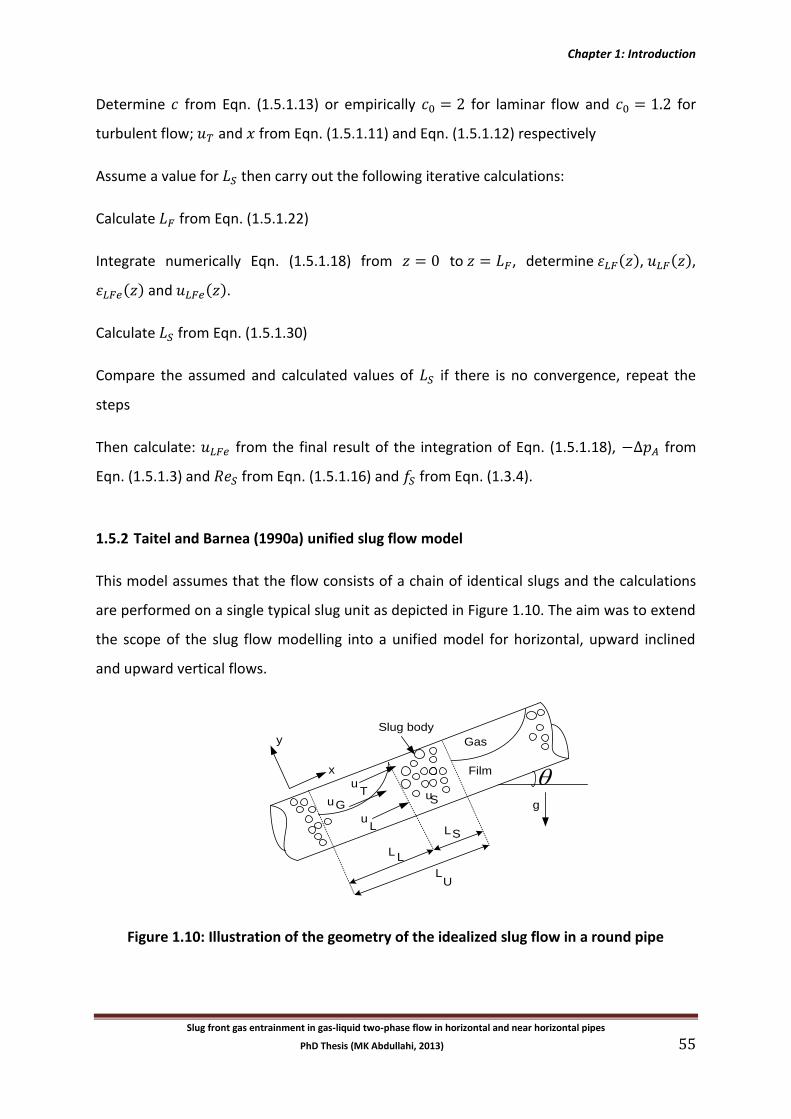
1.5.2 Taitel and Barnea (1990a) unified slug flow model
This model assumes that the flow consists of a chain of identical slugs and the calculations
are performed on a single typical slug unit as depicted in Figure 1.10. The aim was to extend
the scope of the slug flow modelling into a unified model for horizontal, upward inclined
and upward vertical flows.
Slug body
Gas
Film
g
u
G
L
uu
u
T
L L
S
S
L
LU
x
y
Figure 1.10: Illustration of the geometry of the idealized slug flow in a round pipe
Chapter 1: Introduction
Slug front gas entrainment in gas-liquid two-phase flow in horizontal and near horizontal pipes
PhD Thesis (MK Abdullahi, 2013) 56
Taitel and Barnea showed that the liquid mass balance over a slug unit can be determined
by two different approaches. One approach is to integrate the fluid-flow rate at a fixed cross
section over the time of the passage of the slug unit,
( ∫
)
(1.5.2.1)
Where:
is the input liquid mass flow rate
is the average liquid velocity in the slug body
is the average liquid velocity in the film region
, and are the times for the passage of the slug unit, the liquid slug zone and liquid
film/gas-pocket region respectively.
Substituting,
, , and into Eqn. (1.5.2.1) gives:
∫
(1.5.2.2)
The second method considers the volume of fluid in the slug unit and is,
( ∫
)
(1.5.2.3)
Where is the mass pickup rate of liquid at the slug front and is given by,
( ) ( ) (1.5.2.4)
Using Eqn. (1.5.2.4) it can be shown that Eqns. (1.5.2.2) and (1.5.2.3) are the same.
Combining, (1.5.2.2) and (1.5.2.4) gives,
( )
∫ ( )
(1.5.2.5)
Chapter 1: Introduction
Slug front gas entrainment in gas-liquid two-phase flow in horizontal and near horizontal pipes
PhD Thesis (MK Abdullahi, 2013) 57
A continuity balance on both gas and liquid phase gives a constant volumetric flow rate at
any cross section of the slug unit. Hence applying this balance on a cross section in the liquid
slug body gives,
( ) (1.5.2.6)
The average liquid holdup of a slug unit is:
( ) ∫ ( )
(1.5.2.7)
Using the mass balance of Eqn. (1.5.2.5), the integral can be eliminated, which gives:
(1.5.2.8)
And in terms of superficial velocity of the gas;
( )
(1.5.2.9)
Eqns. (1.5.2.8) and (1.5.2.9) interestingly show that the liquid holdup in the slug depends
only on liquid superficial velocity ; gas superficial velocity ; the gas bubble velocity in
the liquid slug, ; the translational velocity and the liquid holdup within the slug body,
. However it does not depend on the slug structure.
The film length, its profile, the velocity profile along the film and the film thickness and its
velocity just before the pickup are important for calculating the slug pressure drop. The
shape of the liquid film is a complex turbulent 3D structure with a free surface. In this
model, an approximate 1D approach of ‘channel flow’ theory was adopted as presented by
Dukler and Hubbard (1975).
The analysis is carried out at the translational velocity coordinate system, (based on Dukler
& Hubbard (1975 model) in which the interface is stationary and the liquid film flows
backward at the pickup mass flow rate, in a steady-state manner. The axial coordinate in
this model is pointing backwards from the rear of the slug body into the liquid-film zone.
Chapter 1: Introduction
Slug front gas entrainment in gas-liquid two-phase flow in horizontal and near horizontal pipes
PhD Thesis (MK Abdullahi, 2013) 58
For the solution of the film velocity, and the film holdup , as a functions of position
from the rear of the slug , momentum balances on the film are carried out as,
(1.5.2.10)
and
(1.5.2.11)
where:
(1.5.2.12a)
and
(1.5.2.12b)
The shear stress is expressed using the actual velocities as,
| |
(1.5.2.13a)
| |
(1.5.2.13b)
and
| |( )
(1.5.2.14)
The shear stresses are considered positive in the downstream direction, .
The friction factors in smooth pipes can be determined from Blasius correlation using the
hydraulic diameter concept. This gives,
( | |
)
(1.5.2.15)
The hydraulic diameter is calculated from Eqn. (1.3.6a), for the gas using Eqn. (1.3.6b)
and has the values shown in Eqn. (1.3.4b).
Chapter 1: Introduction
Slug front gas entrainment in gas-liquid two-phase flow in horizontal and near horizontal pipes
PhD Thesis (MK Abdullahi, 2013) 59
By eliminating the pressure drop from Eqns. (1.5.2.10) and (1.5.2.11) gives:
(
) ( ) ( )
(1.5.2.16)
From Eqn. (1.5.2.4),
( ) ( )
(1.5.2.17)
and
( ) ( )( )
(1.5.2.18)
By differentiating Eqns. (1.5.2.17) & (1.5.2.18) to get the derivatives
and
, then
substituting into Eqn. (1.5.2.16) gives,
(
) ( )
( ) ( )
( )( )
( )
(1.5.2.19)
√ (
)
(1.5.2.20)
Eqn. (1.5.2.19) is a detailed 1D channel analysis.
For large , equilibrium liquid level is reached and for this case,
, therefore Eqn.
(1.5.2.19) reduces to Eqn. (1.3.3) given in section 3 when the numerator is equated to zero,
[
(
)] ( ) (1.3.3)
Also the critical liquid film level occurs at
when the denominator of Eqn. (1.5.2.19)
is equated to zero.
Chapter 1: Introduction
Slug front gas entrainment in gas-liquid two-phase flow in horizontal and near horizontal pipes
PhD Thesis (MK Abdullahi, 2013) 60
This gives,
( )
( )
( )( )
( )
(1.5.2.21)
Another simplification to the film-gas pocket region is to consider the pressure drop in the
region as negligible as suggested by Dukler and Hubbard (1975). By this assumption, the
liquid can be taken as an uncoupled free surface open channel flow and therefore Eqn.
(1.5.2.19) reduces to,
(1.5.2.22)
Due to the intermittent nature of slug flow, the axial pressure drop is not constant.
Considering a global force balance across a slug unit, the pressure drop is given by,
∫
(1.5.2.23)
The liquid slug density in the slug unit is,
( ) (1.5.2.24)
Alternatively, neglecting the pressure drop in the film region leads to:
(1.5.2.25)
Where is the average liquid density in the slug body defined in Eqn. (1.5.1.5). The first
term in Eqn. (1.5.2.25) is the gravitational pressure drop while the second term is the
frictional pressure drop. The third term is the pressure loss due to mixing at the slug front
which Dukler and Hubbard (1975) referred to accelerational pressure drop. This pressure
drop is given in Eqn. (1.5.1.3).
( ) (1.5.1.3)
Closure relationships for this model as in the case of Dukler and Hubbard (1975) model are
the liquid holdup in the slug body, slug length, slug frequency and slug translation velocity.
Chapter 1: Introduction
Slug front gas entrainment in gas-liquid two-phase flow in horizontal and near horizontal pipes
PhD Thesis (MK Abdullahi, 2013) 61
The translational velocity of the Taylor bubble is the sum of its rise velocity and the drift
velocity given by:
(1.5.2.26)
For horizontal and upward inclined pipe flows, Bendiksen (1984) model is used to describe
the drift velocity , and is given by,
√ √ (1.5.2.27)
And the gas bubble velocity in the slug, as in the case of translational velocity of the Taylor
bubble is also assumed to be the sum of the bubble rise velocity and the drift flux velocity
plus the contribution of the mixture velocity (Shoham, 2006),
[ ( )
]
(1.5.2.28)
For horizontal and near horizontal flows, where the bubbles tend to accumulate at the top
of the pipe, it is commonly assumed that the bubble travels at the mixture velocity; hence
the flow distribution coefficient is equal to one.
The liquid holdup within the liquid slug which is assumed to depend on the liquid velocity
following the recommendation of Gregory et al. (1978) is,
( ⁄ ) (1.5.2.29)
Based on Gregory et al (1978) data, Malnes (1982) developed an alternative correlation as,
(1.5.2.30)
Where is a coefficient defined as,
(
)
(1.5.2.31)
where is the gas-liquid surface tension.
Chapter 1: Introduction
Slug front gas entrainment in gas-liquid two-phase flow in horizontal and near horizontal pipes
PhD Thesis (MK Abdullahi, 2013) 62
Barnea & Brauner (1985) also developed the following expression for slug body hold up,
{ [
( ) ] ⁄
[
]
⁄
[
] ⁄
}
(1.5.2.32)
where is the surface tension, is the liquid friction factor and and are the liquid
and gas densities respectively.
Andreussi & Bendiksen (1989) proposed another correlation for slug liquid holdup based on
experimental studies for air-water system which was found to be applicable to slug flow
with gas entrainment. The correlation is given as,
(1.5.2.33a)
Where,
[ (
)
]√ (1.5.2.33b)
cm
[
] √ (1.5.2.33c)
(1.5.2.33d)
Recently, Abdul-Majeed (2000) also developed a slug holdup correlation which depends
only on fluid viscosity and mixture velocity. The correlation is,
(
) (1.5.2.34)
and are the gas and liquid viscosities respectively.
Zabaras (2000) developed a correlation for slug frequency which modifies Gregory (1969)
correlation for horizontal to one that includes near horizontal pipe and is given by:
(
)
(
)
[ ( ) ] (1.5.2.35)
Chapter 1: Introduction
Slug front gas entrainment in gas-liquid two-phase flow in horizontal and near horizontal pipes
PhD Thesis (MK Abdullahi, 2013) 63
Slug frequency for small diameter pipe inches, a value of is recommended.
For large diameter pipes, inches, the Scott et al. (1986) correlation is recommended
and is given by,
( ) [ ( )] (1.5.2.36)
Note that, is in feet and is in inches.
The calculation procedure for the Taitel and Barnea model is as follows:
Determine the mixture velocity from Eqn. (1.5.2.6).
Determine , , , and from closure relationships.
Determine from Eqn. (1.5.2.6).
Guess and determine , , , , , and from geometrical relationships.
Calculate from Eqn. (1.5.2.17).
Determine from Eqn. (1.5.2.18).
Determine and from Eqn. (1.5.2.15).
Calculate , from Eqn. (1.5.2.13) and from Eqn. (1.5.2.14).
Determine from Eqn. (1.5.2.2).
and .
Determine the total pressure drop from Eqn. (1.5.2.25).
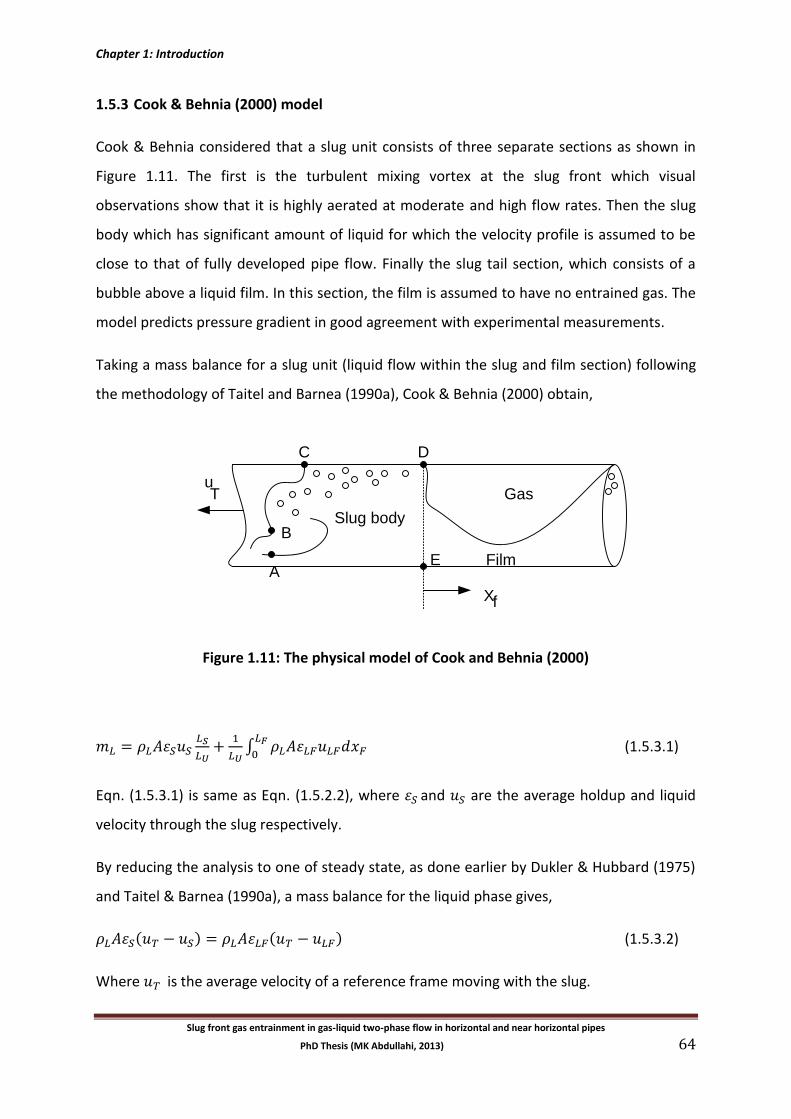
Chapter 1: Introduction
Slug front gas entrainment in gas-liquid two-phase flow in horizontal and near horizontal pipes
PhD Thesis (MK Abdullahi, 2013) 64
1.5.3 Cook & Behnia (2000) model
Cook & Behnia considered that a slug unit consists of three separate sections as shown in
Figure 1.11. The first is the turbulent mixing vortex at the slug front which visual
observations show that it is highly aerated at moderate and high flow rates. Then the slug
body which has significant amount of liquid for which the velocity profile is assumed to be
close to that of fully developed pipe flow. Finally the slug tail section, which consists of a
bubble above a liquid film. In this section, the film is assumed to have no entrained gas. The
model predicts pressure gradient in good agreement with experimental measurements.
Taking a mass balance for a slug unit (liquid flow within the slug and film section) following
the methodology of Taitel and Barnea (1990a), Cook & Behnia (2000) obtain,
A
B
C D
Slug body
Film
Gas
f
uT
E
X
Figure 1.11: The physical model of Cook and Behnia (2000)
∫
(1.5.3.1)
Eqn. (1.5.3.1) is same as Eqn. (1.5.2.2), where and are the average holdup and liquid
velocity through the slug respectively.
By reducing the analysis to one of steady state, as done earlier by Dukler & Hubbard (1975)
and Taitel & Barnea (1990a), a mass balance for the liquid phase gives,
( ) ( ) (1.5.3.2)
Where is the average velocity of a reference frame moving with the slug.
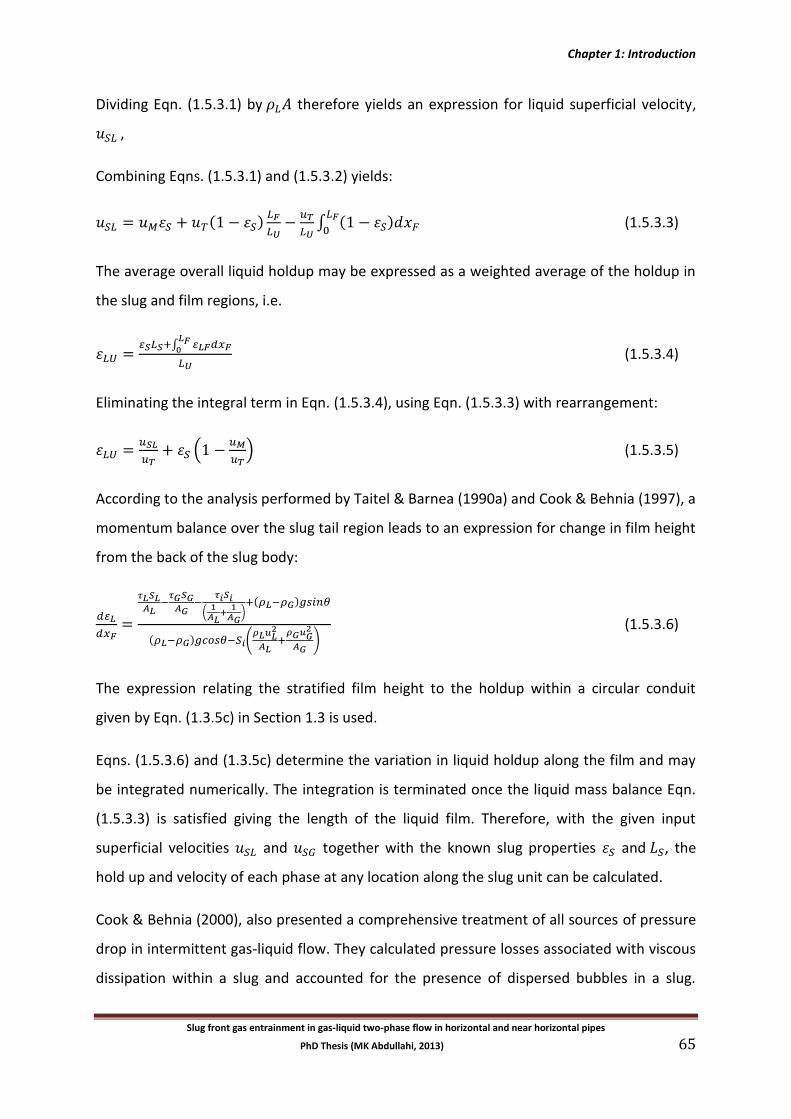
Chapter 1: Introduction
Slug front gas entrainment in gas-liquid two-phase flow in horizontal and near horizontal pipes
PhD Thesis (MK Abdullahi, 2013) 65
Dividing Eqn. (1.5.3.1) by therefore yields an expression for liquid superficial velocity,
,
Combining Eqns. (1.5.3.1) and (1.5.3.2) yields:
( )
∫ ( )
(1.5.3.3)
The average overall liquid holdup may be expressed as a weighted average of the holdup in
the slug and film regions, i.e.
∫
(1.5.3.4)
Eliminating the integral term in Eqn. (1.5.3.4), using Eqn. (1.5.3.3) with rearrangement:
(
) (1.5.3.5)
According to the analysis performed by Taitel & Barnea (1990a) and Cook & Behnia (1997), a
momentum balance over the slug tail region leads to an expression for change in film height
from the back of the slug body:
(
) ( )
( ) (
)
(1.5.3.6)
The expression relating the stratified film height to the holdup within a circular conduit
given by Eqn. (1.3.5c) in Section 1.3 is used.
Eqns. (1.5.3.6) and (1.3.5c) determine the variation in liquid holdup along the film and may
be integrated numerically. The integration is terminated once the liquid mass balance Eqn.
(1.5.3.3) is satisfied giving the length of the liquid film. Therefore, with the given input
superficial velocities and together with the known slug properties and , the
hold up and velocity of each phase at any location along the slug unit can be calculated.
Cook & Behnia (2000), also presented a comprehensive treatment of all sources of pressure
drop in intermittent gas-liquid flow. They calculated pressure losses associated with viscous
dissipation within a slug and accounted for the presence of dispersed bubbles in a slug.
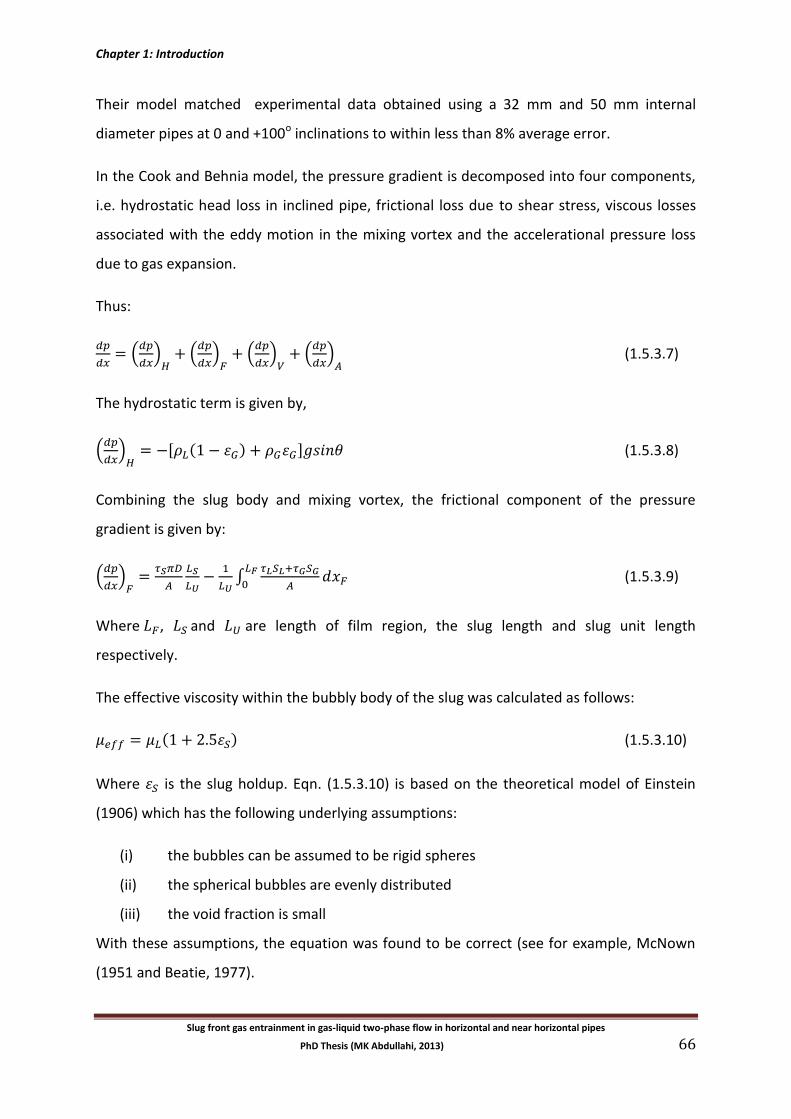
Chapter 1: Introduction
Slug front gas entrainment in gas-liquid two-phase flow in horizontal and near horizontal pipes
PhD Thesis (MK Abdullahi, 2013) 66
Their model matched experimental data obtained using a 32 mm and 50 mm internal
diameter pipes at 0 and +100o inclinations to within less than 8% average error.
In the Cook and Behnia model, the pressure gradient is decomposed into four components,
i.e. hydrostatic head loss in inclined pipe, frictional loss due to shear stress, viscous losses
associated with the eddy motion in the mixing vortex and the accelerational pressure loss
due to gas expansion.
Thus:
(
) (
) (
) (
)
(1.5.3.7)
The hydrostatic term is given by,
(
)
[ ( ) ] (1.5.3.8)
Combining the slug body and mixing vortex, the frictional component of the pressure
gradient is given by:
(
)
∫
(1.5.3.9)
Where , and are length of film region, the slug length and slug unit length
respectively.
The effective viscosity within the bubbly body of the slug was calculated as follows:
( ) (1.5.3.10)
Where is the slug holdup. Eqn. (1.5.3.10) is based on the theoretical model of Einstein
(1906) which has the following underlying assumptions:
(i) the bubbles can be assumed to be rigid spheres
(ii) the spherical bubbles are evenly distributed
(iii) the void fraction is small
With these assumptions, the equation was found to be correct (see for example, McNown
(1951 and Beatie, 1977).
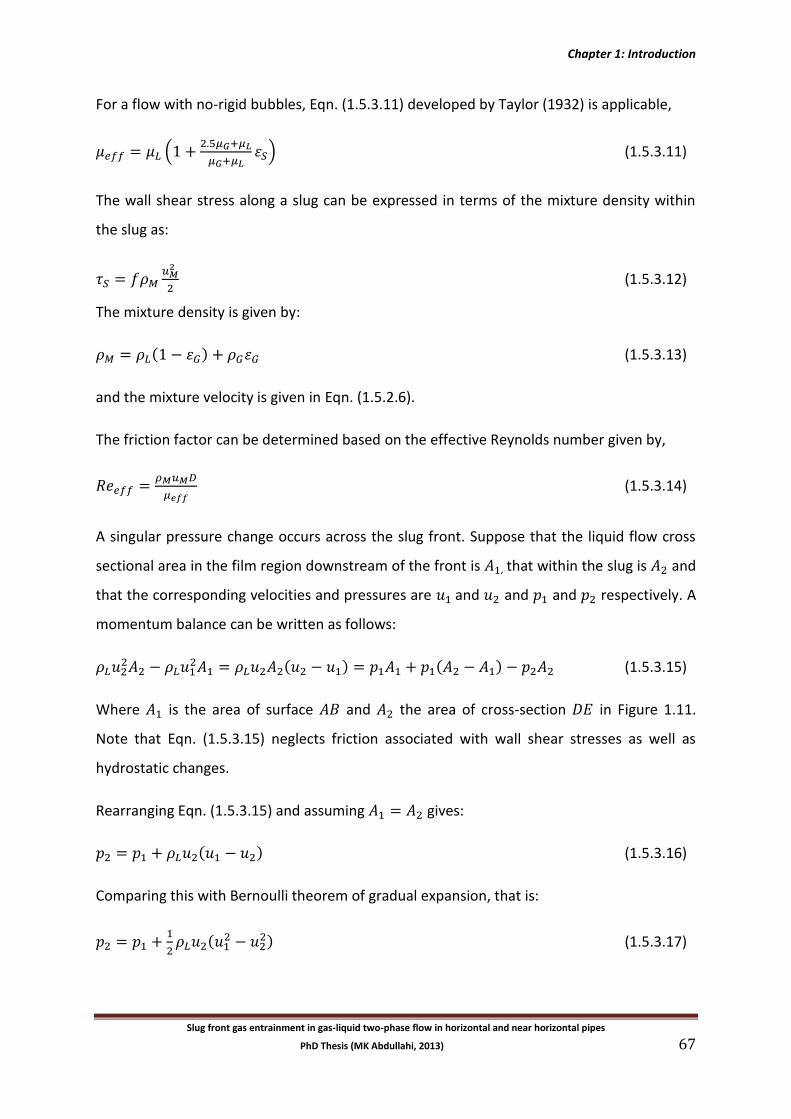
Chapter 1: Introduction
Slug front gas entrainment in gas-liquid two-phase flow in horizontal and near horizontal pipes
PhD Thesis (MK Abdullahi, 2013) 67
For a flow with no-rigid bubbles, Eqn. (1.5.3.11) developed by Taylor (1932) is applicable,
(
) (1.5.3.11)
The wall shear stress along a slug can be expressed in terms of the mixture density within
the slug as:
(1.5.3.12)
The mixture density is given by:
( ) (1.5.3.13)
and the mixture velocity is given in Eqn. (1.5.2.6).
The friction factor can be determined based on the effective Reynolds number given by,
(1.5.3.14)
A singular pressure change occurs across the slug front. Suppose that the liquid flow cross
sectional area in the film region downstream of the front is , that within the slug is and
that the corresponding velocities and pressures are and and and respectively. A
momentum balance can be written as follows:
( ) ( ) (1.5.3.15)
Where is the area of surface and the area of cross-section in Figure 1.11.
Note that Eqn. (1.5.3.15) neglects friction associated with wall shear stresses as well as
hydrostatic changes.
Rearranging Eqn. (1.5.3.15) and assuming gives:
( ) (1.5.3.16)
Comparing this with Bernoulli theorem of gradual expansion, that is:
(
) (1.5.3.17)
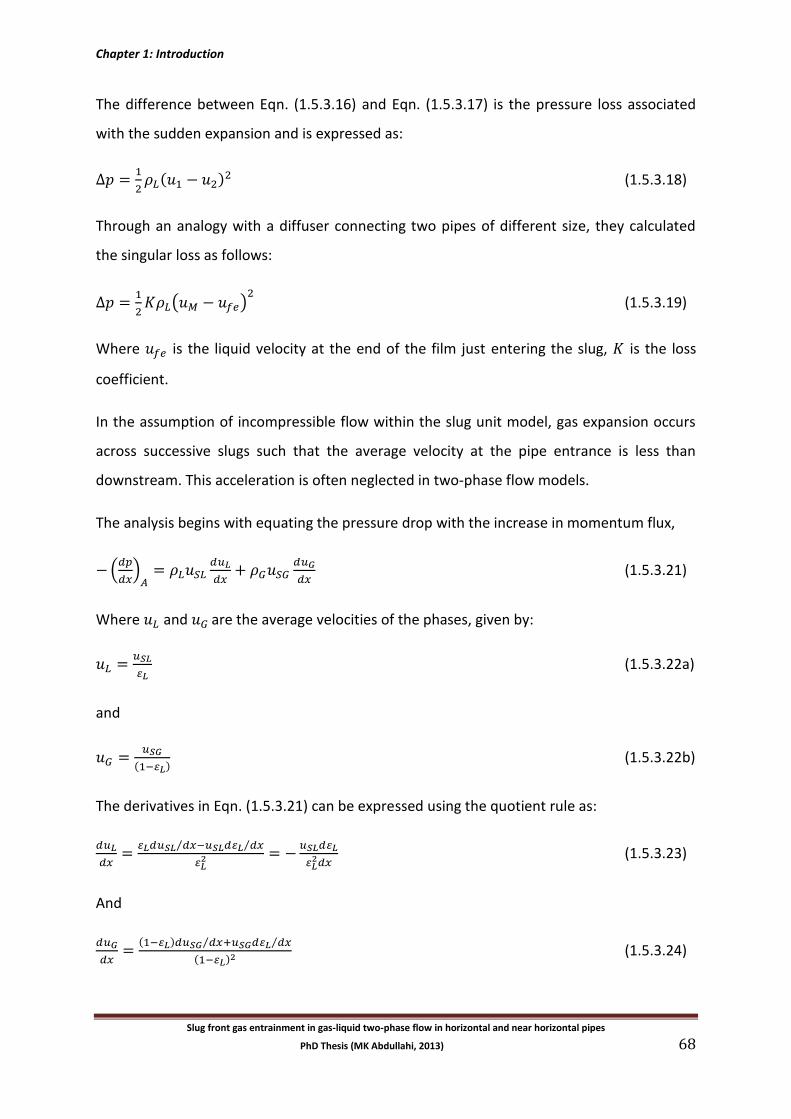
Chapter 1: Introduction
Slug front gas entrainment in gas-liquid two-phase flow in horizontal and near horizontal pipes
PhD Thesis (MK Abdullahi, 2013) 68
The difference between Eqn. (1.5.3.16) and Eqn. (1.5.3.17) is the pressure loss associated
with the sudden expansion and is expressed as:
( )
(1.5.3.18)
Through an analogy with a diffuser connecting two pipes of different size, they calculated
the singular loss as follows:
( )
(1.5.3.19)
Where is the liquid velocity at the end of the film just entering the slug, is the loss
coefficient.
In the assumption of incompressible flow within the slug unit model, gas expansion occurs
across successive slugs such that the average velocity at the pipe entrance is less than
downstream. This acceleration is often neglected in two-phase flow models.
The analysis begins with equating the pressure drop with the increase in momentum flux,
(
)
(1.5.3.21)
Where and are the average velocities of the phases, given by:
(1.5.3.22a)
and
( ) (1.5.3.22b)
The derivatives in Eqn. (1.5.3.21) can be expressed using the quotient rule as:
⁄ ⁄
(1.5.3.23)
And
( ) ⁄ ⁄
( ) (1.5.3.24)
Chapter 1: Introduction
Slug front gas entrainment in gas-liquid two-phase flow in horizontal and near horizontal pipes
PhD Thesis (MK Abdullahi, 2013) 69
Mass continuity balance in the gas leads to,
(1.5.3.25)
Combining Eqns. (1.5.3.21 – 1.5.3.25), yields:
(
)
[
( )
]
( )
(1.5.3.26)
The gas density derivative term in Eqn. (1.5.3.25) can be expressed from the ideal gas law
as:
(1.5.3.27)
Assuming a constant slug holdup along the pipe, the liquid holdup derivative in Eqn.
(1.5.3.26) can be evaluated by differentiating Eqn. (1.5.3.5) to obtain,
(
)
(
) (1.5.3.28)
The second term on the RHS of Eqn. (1.5.3.28) is zero since the ratio of mixture velocity to
slug velocity is constant. This expression can therefore be rewritten as:
(
)
note that
(1.5.3.29)
and it is assumed that the slug velocity is 1.2 times the mixture velocity.
Assuming isothermal flow, constant,
(1.5.3.30)
Eqns. (1.5.3.28) – (1.5.3.30) can be combined to yield the expression for the holdup
derivative in Eqn. (1.5.3.26) as:
(1.5.3.31)
Writing the acceleration pressure gradient as:
(
)
(1.5.3.32)
Chapter 1: Introduction
Slug front gas entrainment in gas-liquid two-phase flow in horizontal and near horizontal pipes
PhD Thesis (MK Abdullahi, 2013) 70
Where is given by,
[
( )
]
( ) (1.5.3.33)
The total pressure gradient can be expressed in terms of frictional, hydrostatic and viscous
components as:
( ⁄ ) ( ⁄ ) ( ⁄ )
(1.5.3.34)
1.5.4 Zhang et al. (2003a) model
Zhang et al. developed a unified hydrodynamic slug flow model for predictions of flow
pattern transition, pressure gradient, liquid holdup and slug characteristics in gas-liquid pipe
flow at all inclination angles from -90o to 90o. The model is based on dynamics of slug flows,
which shares transition boundaries with all other flow patterns. In Zhang et al. (2003b), the
model was validated with extensive experimental data acquired with different pipe
diameters, inclination angles, fluid physical properties, gas-liquid flow rates and flow
patterns. A good agreement was observed.
In this model, the control volume includes the entire liquid film region, incorporating the
liquid film and the gas pocket. The continuity equations for the input mass flow rate at the
left boundary and the output at the right boundary are respectively:
( ) ( ) (1.5.4.1)
and
( ) (1.5.4.2)
Where and are the liquid holdups in the film and the gas respectively, is the
mixture velocity ( ) and is the gas core velocity.
For a fully developed slug flow, where the input mass flow rate equals the output mass flow
rate, the continuity equation for the liquid phase in film region is:
( ) ( ) ( ) (1.5.4.3)
Chapter 1: Introduction
Slug front gas entrainment in gas-liquid two-phase flow in horizontal and near horizontal pipes
PhD Thesis (MK Abdullahi, 2013) 71
Also in the gas input mass flow rate at the left boundary and the output at the right
boundary are respectively:
( )( ) (1.5.4.4)
and
( )( ) (1.5.4.5)
Then the continuity equation for the gas phase is,
( )( ) ( )( ) (1.5.4.6)
Combining Eqns. (1.5.4.3) and (1.5.4.6) gives:
( ) (1.5.4.7)
Considering the passage of a slug unit at an observation point, the following relations hold
respectively for the liquid and gas phases,
( ) (1.5.4.8a)
( ) ( ) (1.5.4.8b)
The slug unit length is given by,
(1.5.4.9)
The momentum equation for the liquid phase is given by:
( )
( )( )
(1.5.4.10)
and for the gas,
( )
( )( )
( )
(1.5.4.11)
Therefore, the combined pressure drop is given by:
( )( ) ( )( )
( ) (
( ))
( )
(1.5.4.12)
Chapter 1: Introduction
Slug front gas entrainment in gas-liquid two-phase flow in horizontal and near horizontal pipes
PhD Thesis (MK Abdullahi, 2013) 72
In order to calculate the liquid entrainment in the gas core, the relationship of Whalley &
Hewitt (1978) is used:
(
)
(
)
(1.5.4.13)
Where,
(1.5.4.14a)
√ (1.5.4.14b)
(1.5.4.14c)
(1.5.4.14d)
Zhang et al (2003) developed a unified mechanistic model for the slug liquid holdup, which
can be used for the whole range of pipe inclinations. The holdup is given by:
[( ) ] ⁄
(1.5.4.15)
Where,
(
( )( )
( )( )( )
) (1.5.4.16)
and
| |
(1.5.4.17)
The mixture density in the slug body and the mixture velocity can be estimated from Eqn.
(1.5.3.15) and Eqn. (1.5.3.16) respectively.
For the solution of the combined momentum equations, the slug liquid holdup must be
estimated, Gregory et al. (1978) correlation (given in Eqn. (1.5.2.3)) may be used. The
translational velocity is given in Eqn. (1.5.2.1) and the drift velocity in Eqn. (1.5.2.2).
Chapter 1: Introduction
Slug front gas entrainment in gas-liquid two-phase flow in horizontal and near horizontal pipes
PhD Thesis (MK Abdullahi, 2013) 73
The estimation of the slug length for horizontal pipe is valid for relatively small pipe
diameters. For inclined flow in small diameter pipes the slug length may be estimated by:
( ) (1.5.4.18)
Closure relations in interfacial friction, interfacial perimeter, liquid film holdup, slug
translational velocity, slug length and slug frequency are required. Slug frequency is an
important parameter in wide range of mechanistic models and is particularly important in
the design of separator vessels. The Gregory & Scott (1969) correlation for slug frequency is
as follows:
(
)
[
]
(1.5.4.19)
where '
Su is the slug velocity at which the minimum slug frequency occurs.
Zabaras (2000) modified the Gregory and Scott correlation to take account of pipe
inclination ( ) from the horizontal and is given by:
(
)
[
]
[ ( )] (1.5.4.20)
is the mixture velocity.
Wren et al (2005), after careful examination of their data, came up with another value of
the power and the constants in the Gregory and Scott equation as follows:
(
)
[
]
(1.5.4.21)
For further readings on slug frequency see also Taitel Y. & Dukler A.E. (1977).
Table 1.1 gives a comparison of the slug frequency correlations made by Wren et al (2005)
for data set in a 0.05 m pipe at similar liquid velocity. The minimum slug frequency occurs
at a slug velocity of 3.4 m/s.

Chapter 1: Introduction
Slug front gas entrainment in gas-liquid two-phase flow in horizontal and near horizontal pipes
PhD Thesis (MK Abdullahi, 2013) 74
Table 1.1: Summary of the errors in predicted slug frequency
Parameters Gregory & Scott Zabaras Wren et al
Exponent, n 1.20 1.20 0.32
U* 6.00 6.00 3.40
Co 1.35 1.35 1.20
Average error (%) -120 -163 +1.4
Standard deviation (%) 140 167 25
Calculations procedure for Zhang et al (2003a) model:
Calculate from Eqn. (1.5.2.26) in Taitel & Barnea model.
Calculate from Eqn. (1.5.4.18).
Calculate from Eqn. (1.5.4.13).
Calculate from any of the closure equations Eqns. (1.5.2.29) – (1.5.2.34) in Taitel &
Barnea model.
Guess .
Simultaneously solve Eqns. (1.5.4.3), (1.5.4.5), (1.5.4.8a) and (1.5.4.13) for , , and
.
Calculate , , from Eqns. (1.3.6a), (1.3.6b) and (1.3.6c).
Calculate , and from Eqns. (1.3.7a), (1.3.7b) and (1.3.7c).
Calculate , and from Eqns. (1.3.4a), (1.3.4b) and (1.3.4c).
Calculate new from Eqn. (1.5.4.12).
Chapter 1: Introduction
Slug front gas entrainment in gas-liquid two-phase flow in horizontal and near horizontal pipes
PhD Thesis (MK Abdullahi, 2013) 75
If |
| then output and if not repeat calculations.
The model was validated in Zhang et al (2003b) using experimental data in different pipe
sizes, ranging from 25.4 - 76.3 mm diameter pipes for slug characteristics including slug
frequency, film length, liquid holdups in the film and slug body. Good agreement was
observed with much of the experimental data.
1.5.5 Xu et al (2007) slug flow model
Xu et al. (2007) based their model for stratified flow (and for the bubble region in slug flow)
on that of Taitel and Dukler (1976). However, they generalized the model to gas/non-
Newtonian flows using a relationship for liquid phase Reynolds number by Heywood &
Charles (1979):
(
) (1.5.5.1a)
Where , the equivalent diameter for the liquid phase is given by:
(1.5.5.1b)
The liquid-to-wall shear stress was calculated by using this Reynolds number in Equation
2.2.29a. For the interfacial gas-liquid shear stress, Xu et al. used (Cohen &
Hanratty 1968). As was discussed above, the main output from the Taitel and Dukler (1976)
model is a value for
, knowing , both the void fraction and the pressure drop may
be calculated. Thus, the liquid film holdup is given in Eqn. (1.3.5c).
The dimensionless pressure drop is given by:
( ⁄ )
( ⁄ )
(
)
( )
( )( ) (1.5.5.2)
where is the Lochart-Martinelli multiplier parameter.
Chapter 1: Introduction
Slug front gas entrainment in gas-liquid two-phase flow in horizontal and near horizontal pipes
PhD Thesis (MK Abdullahi, 2013) 76
By definition,
( ⁄ )
( ⁄ )
(1.5.5.3)
Substituting Eqn. (1.5.5.4) into Eqn. (1.5.5.3) gives,
( ⁄ )
( ⁄ )
(
)
( )
( )( ) (1.5.5.4)
For horizontal flow, the dimensionless frictional pressure gradient is expressed as:
(
) (1.5.5.5)
Therefore, a drag reduction occurs in stratified flow as:
(
) ( ) (1.5.5.6)
According to the unit cell model, the slug length is made up of a liquid slug zone of length
and a film zone of length as shown in Figure 2.2.2.
[( ) ∫ ( )
] (1.5.5.7)
[ ∫
] (1.5.5.8)
where, is the void fraction, subscripts and refer to liquid slug and elongated bubble
zone, respectively while is the elongated bubble velocity.
Taking a gas mass balance relative to a coordinate system that moves with a translational
velocity, yields,
( ) ( ) (1.5.5.9)
The volume average void fraction over a slug unit is,
∫
(1.5.5.10)
Chapter 1: Introduction
Slug front gas entrainment in gas-liquid two-phase flow in horizontal and near horizontal pipes
PhD Thesis (MK Abdullahi, 2013) 77
Using Eqn. (1.5.5.9) to eliminate the integral term, in Eqn. (1.5.5.10) yields,
( ) (1.5.5.11)
The Gregory et al. (1978) correlation in Eqn. (1.5.2.3) is used for the void fraction S within
the liquid slug.
By assuming a uniform film along the film zone, the average pressure gradient is obtained
through a momentum balance over a global control volume of the slug unit, giving by:
(
)
(
) (1.5.5.12)
where the average density over a slug unit is:
( ) (1.5.5.13)
and the average density within the liquid slug is given in Eqn. (1.5.1.5). is the liquid slug
friction factor which can be calculated with the liquid slug Reynolds number in Eqn.
(1.5.5.1a).
Once a solution has been obtained for the holdup in the elongated bubble zone and the
average gas velocity by solving Eqn. (1.3.3) numerically, the total pressure drop can be
obtained by substituting Eqns. (1.5.5.7) – (1.5.5.11) into Eqn. (1.5.5.12). With non-
dimensional quantities denoted by a tilde (~), Eqn. (1.5.5.12) reduces to:
( ⁄ )
( ⁄ )
( )
(
) (1.5.5.14)
where,
( ⁄ )
( ⁄ )
(1.5.5.15)
For horizontal flow, the dimensionless frictional pressure gradient can be given by:
( ⁄ )
( ⁄ )
(
) (1.5.5.16)
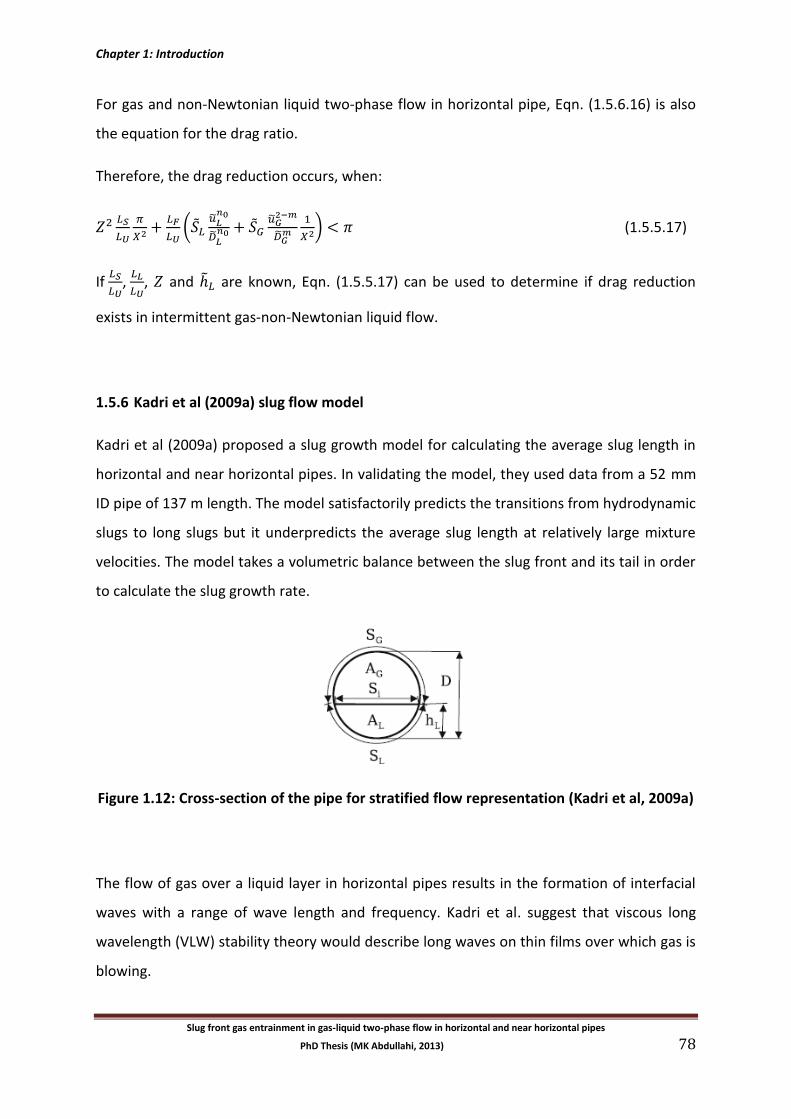
Chapter 1: Introduction
Slug front gas entrainment in gas-liquid two-phase flow in horizontal and near horizontal pipes
PhD Thesis (MK Abdullahi, 2013) 78
For gas and non-Newtonian liquid two-phase flow in horizontal pipe, Eqn. (1.5.6.16) is also
the equation for the drag ratio.
Therefore, the drag reduction occurs, when:
(
) (1.5.5.17)
If
,
, and are known, Eqn. (1.5.5.17) can be used to determine if drag reduction
exists in intermittent gas-non-Newtonian liquid flow.
1.5.6 Kadri et al (2009a) slug flow model
Kadri et al (2009a) proposed a slug growth model for calculating the average slug length in
horizontal and near horizontal pipes. In validating the model, they used data from a 52 mm
ID pipe of 137 m length. The model satisfactorily predicts the transitions from hydrodynamic
slugs to long slugs but it underpredicts the average slug length at relatively large mixture
velocities. The model takes a volumetric balance between the slug front and its tail in order
to calculate the slug growth rate.
Figure 1.12: Cross-section of the pipe for stratified flow representation (Kadri et al, 2009a)
The flow of gas over a liquid layer in horizontal pipes results in the formation of interfacial
waves with a range of wave length and frequency. Kadri et al. suggest that viscous long
wavelength (VLW) stability theory would describe long waves on thin films over which gas is
blowing.
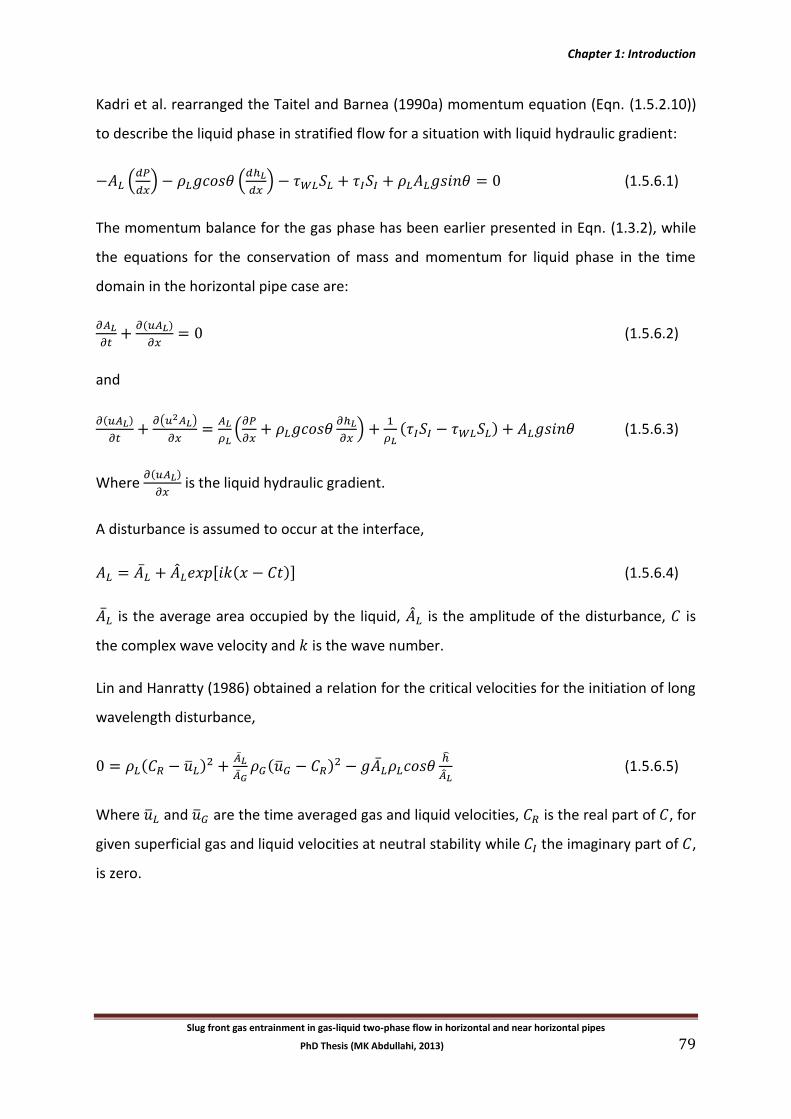
Chapter 1: Introduction
Slug front gas entrainment in gas-liquid two-phase flow in horizontal and near horizontal pipes
PhD Thesis (MK Abdullahi, 2013) 79
Kadri et al. rearranged the Taitel and Barnea (1990a) momentum equation (Eqn. (1.5.2.10))
to describe the liquid phase in stratified flow for a situation with liquid hydraulic gradient:
(
) (
) (1.5.6.1)
The momentum balance for the gas phase has been earlier presented in Eqn. (1.3.2), while
the equations for the conservation of mass and momentum for liquid phase in the time
domain in the horizontal pipe case are:
( )
(1.5.6.2)
and
( )
( )
(
)
( ) (1.5.6.3)
Where ( )
is the liquid hydraulic gradient.
A disturbance is assumed to occur at the interface,
[ ( )] (1.5.6.4)
is the average area occupied by the liquid, is the amplitude of the disturbance, is
the complex wave velocity and is the wave number.
Lin and Hanratty (1986) obtained a relation for the critical velocities for the initiation of long
wavelength disturbance,
( )
( )
(1.5.6.5)
Where and are the time averaged gas and liquid velocities, is the real part of , for
given superficial gas and liquid velocities at neutral stability while the imaginary part of ,
is zero.
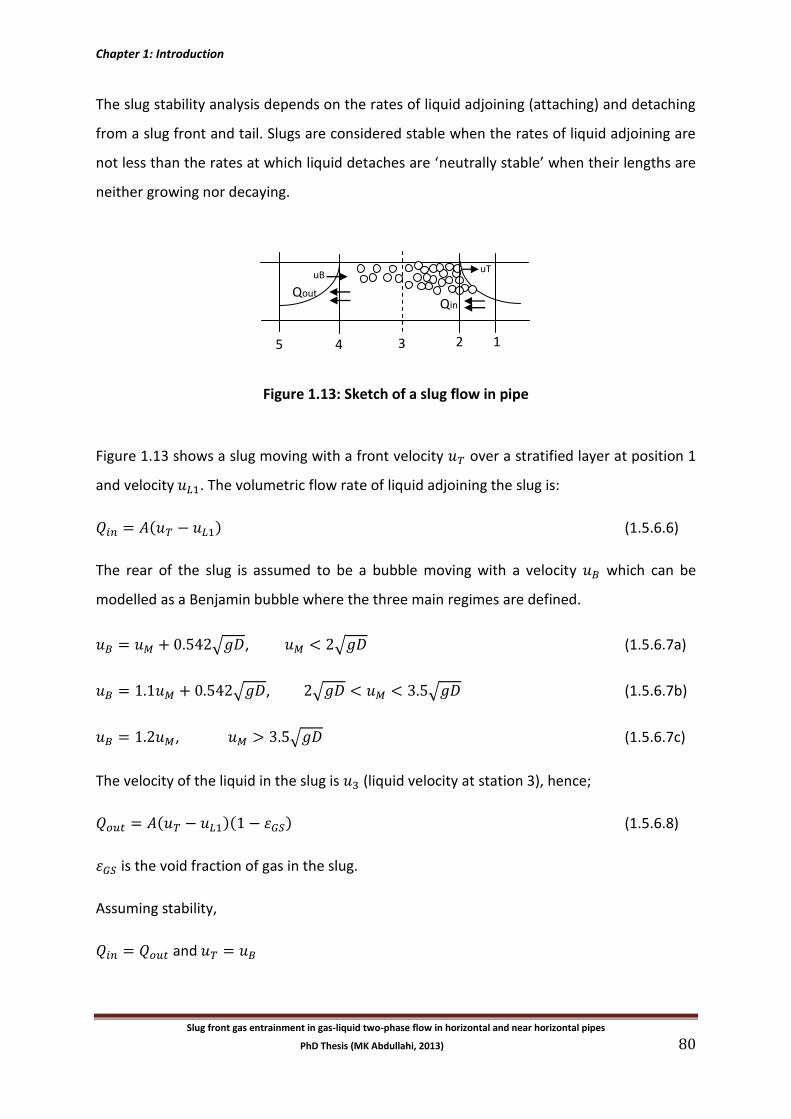
Chapter 1: Introduction
Slug front gas entrainment in gas-liquid two-phase flow in horizontal and near horizontal pipes
PhD Thesis (MK Abdullahi, 2013) 80
The slug stability analysis depends on the rates of liquid adjoining (attaching) and detaching
from a slug front and tail. Slugs are considered stable when the rates of liquid adjoining are
not less than the rates at which liquid detaches are ‘neutrally stable’ when their lengths are
neither growing nor decaying.
Figure 1.13: Sketch of a slug flow in pipe
Figure 1.13 shows a slug moving with a front velocity over a stratified layer at position 1
and velocity . The volumetric flow rate of liquid adjoining the slug is:
( ) (1.5.6.6)
The rear of the slug is assumed to be a bubble moving with a velocity which can be
modelled as a Benjamin bubble where the three main regimes are defined.
√ , √ (1.5.6.7a)
√ , √ √ (1.5.6.7b)
, √ (1.5.6.7c)
The velocity of the liquid in the slug is (liquid velocity at station 3), hence;
( )( ) (1.5.6.8)
is the void fraction of gas in the slug.
Assuming stability,
and
5 4 3 2 1
Qin Qout
uT uB
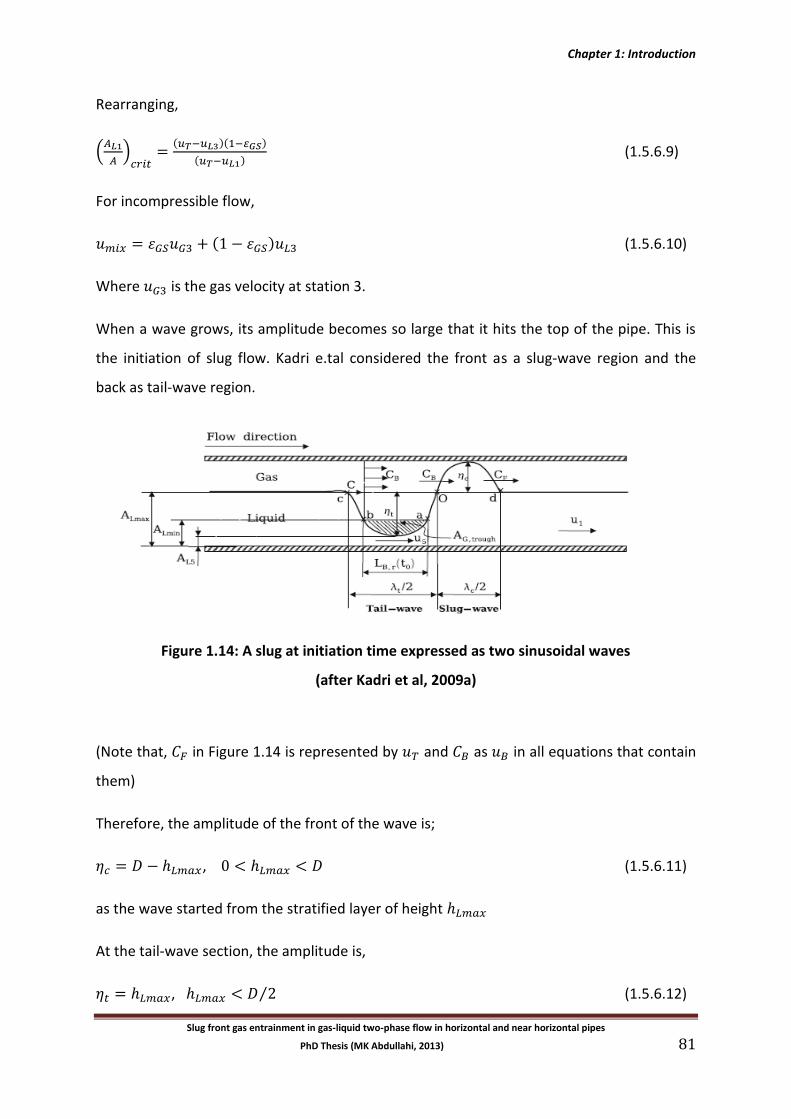
Chapter 1: Introduction
Slug front gas entrainment in gas-liquid two-phase flow in horizontal and near horizontal pipes
PhD Thesis (MK Abdullahi, 2013) 81
Rearranging,
(
)
( )( )
( ) (1.5.6.9)
For incompressible flow,
( ) (1.5.6.10)
Where is the gas velocity at station 3.
When a wave grows, its amplitude becomes so large that it hits the top of the pipe. This is
the initiation of slug flow. Kadri e.tal considered the front as a slug-wave region and the
back as tail-wave region.
Figure 1.14: A slug at initiation time expressed as two sinusoidal waves
(after Kadri et al, 2009a)
(Note that, in Figure 1.14 is represented by and as in all equations that contain
them)
Therefore, the amplitude of the front of the wave is;
, (1.5.6.11)
as the wave started from the stratified layer of height
At the tail-wave section, the amplitude is,
, ⁄ (1.5.6.12)
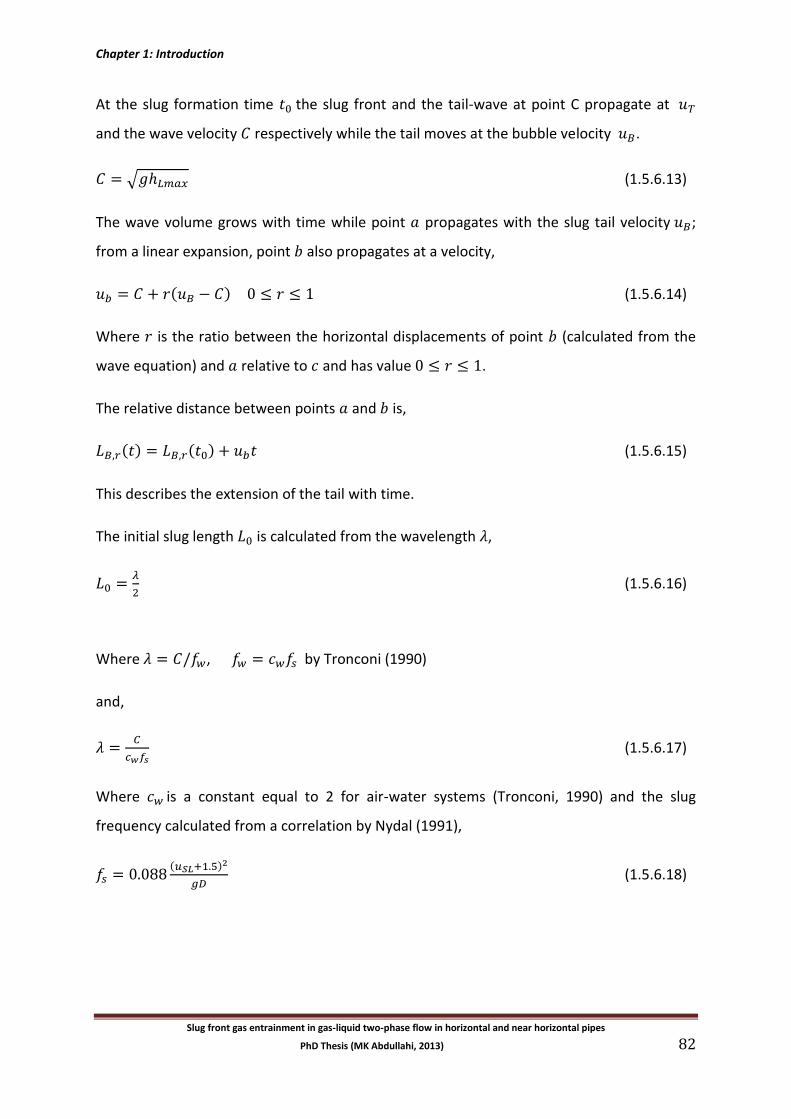
Chapter 1: Introduction
Slug front gas entrainment in gas-liquid two-phase flow in horizontal and near horizontal pipes
PhD Thesis (MK Abdullahi, 2013) 82
At the slug formation time the slug front and the tail-wave at point C propagate at
and the wave velocity respectively while the tail moves at the bubble velocity .
√ (1.5.6.13)
The wave volume grows with time while point propagates with the slug tail velocity ;
from a linear expansion, point also propagates at a velocity,
( ) (1.5.6.14)
Where is the ratio between the horizontal displacements of point (calculated from the
wave equation) and relative to and has value .
The relative distance between points and is,
( ) ( ) (1.5.6.15)
This describes the extension of the tail with time.
The initial slug length is calculated from the wavelength ,
(1.5.6.16)
Where , by Tronconi (1990)
and,
(1.5.6.17)
Where is a constant equal to 2 for air-water systems (Tronconi, 1990) and the slug
frequency calculated from a correlation by Nydal (1991),
( )
(1.5.6.18)
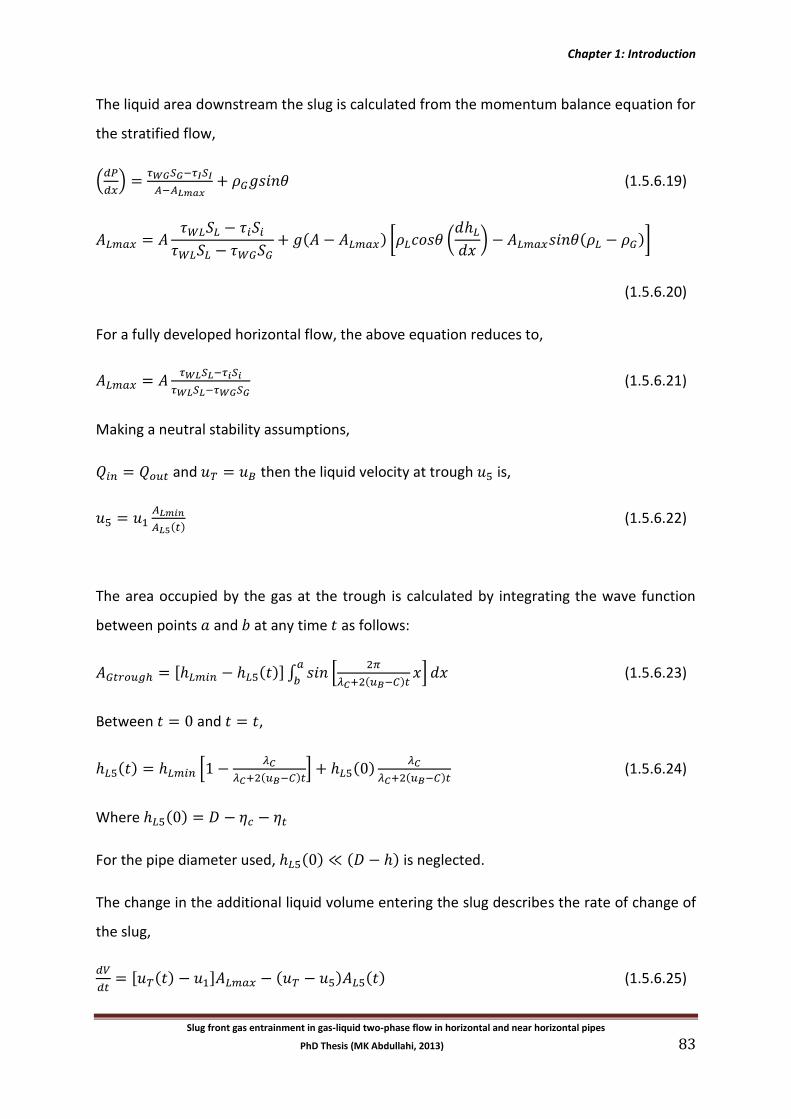
Chapter 1: Introduction
Slug front gas entrainment in gas-liquid two-phase flow in horizontal and near horizontal pipes
PhD Thesis (MK Abdullahi, 2013) 83
The liquid area downstream the slug is calculated from the momentum balance equation for
the stratified flow,
(
)
(1.5.6.19)
( ) [ (
) ( )]
(1.5.6.20)
For a fully developed horizontal flow, the above equation reduces to,
(1.5.6.21)
Making a neutral stability assumptions,
and then the liquid velocity at trough is,
( ) (1.5.6.22)
The area occupied by the gas at the trough is calculated by integrating the wave function
between points and at any time as follows:
[ ( )] ∫
[
( ) ] (1.5.6.23)
Between and ,
( ) [
( ) ] ( )
( ) (1.5.6.24)
Where ( )
For the pipe diameter used, ( ) ( ) is neglected.
The change in the additional liquid volume entering the slug describes the rate of change of
the slug,
[ ( ) ] ( ) ( ) (1.5.6.25)
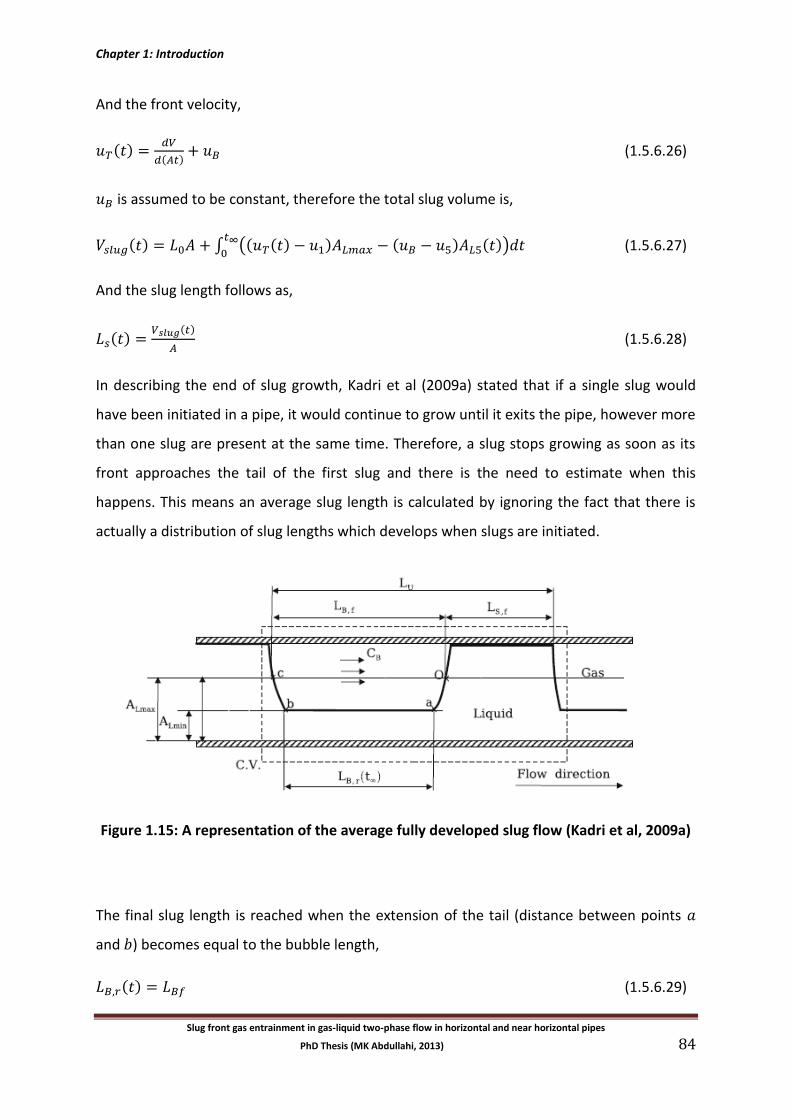
Chapter 1: Introduction
Slug front gas entrainment in gas-liquid two-phase flow in horizontal and near horizontal pipes
PhD Thesis (MK Abdullahi, 2013) 84
And the front velocity,
( )
( ) (1.5.6.26)
is assumed to be constant, therefore the total slug volume is,
( ) ∫ (( ( ) ) ( ) ( ))
(1.5.6.27)
And the slug length follows as,
( ) ( )
(1.5.6.28)
In describing the end of slug growth, Kadri et al (2009a) stated that if a single slug would
have been initiated in a pipe, it would continue to grow until it exits the pipe, however more
than one slug are present at the same time. Therefore, a slug stops growing as soon as its
front approaches the tail of the first slug and there is the need to estimate when this
happens. This means an average slug length is calculated by ignoring the fact that there is
actually a distribution of slug lengths which develops when slugs are initiated.
Figure 1.15: A representation of the average fully developed slug flow (Kadri et al, 2009a)
The final slug length is reached when the extension of the tail (distance between points
and ) becomes equal to the bubble length,
( ) (1.5.6.29)
Chapter 1: Introduction
Slug front gas entrainment in gas-liquid two-phase flow in horizontal and near horizontal pipes
PhD Thesis (MK Abdullahi, 2013) 85
(1.5.6.30)
By making a volumetric balance between the stratified flow and the fully developed slug
flow, a relationship between the bubble and slug length is obtained as follows:
(1.5.6.31)
When then which means there are no slugs formed.
Calculation procedure for the Kadri et al (2009a) model:
Calculate from Eqn. (1.5.6.7a-c).
Calculate from Eqn. (1.5.6.13).
Calculate from Eqn. (1.5.6.14).
Calculate from (1.5.6.26) or any existing closure equations.
Calculate from Eqn. (1.5.6.16).
Calculate from Eqn. (1.5.6.21).
Calculate from Eqn. (1.5.6.24).
Substitute Eqns. (1.5.6.15) and (1.5.6.29) and ( ) in place of into Eqn. (1.5.6.31) in
order to calculate .
Calculate total slug volume ( ) from Eqn. (1.5.6.27).
Calculate slug length ( ) from Eqn. (1.5.6.28).
Chapter 1: Introduction
Slug front gas entrainment in gas-liquid two-phase flow in horizontal and near horizontal pipes
PhD Thesis (MK Abdullahi, 2013) 86
1.6 General Objectives of the Project
From the above discussions on slug flow in two-phase gas-liquid flow lines, it is evident that
further research is needed to provide a clearer understanding of the phenomena in slug
flow and on mitigation of its effects. Therefore, the main objectives of this study are:
(1) To conduct experiments on slug flows with the primary aim of making definitive
measurements of the rate of gas entrainment at a slug front over a wide range of flow
conditions using different techniques and facilities.
1.7 Project Approach
Modelling of slug flow generally requires experimental data for validation and model
development. Even though the occurrence of gas entrainment at the slug front has
been recognised, such gas entrainment is rarely included in models (a notable
exception is the one-dimensional computational model of Bonizzi & Issa (2003)). It
seems likely that entrainment of gas (in addition to entrainment of liquid) at the slug
front can have a crucial influence on slug translation velocity. Unfortunately, there is
a dearth of data on slug front gas entrainment and such data as do exist are often
inconsistent. The prime aim of the work described in this thesis was to use new
techniques for measuring slug front gas entrainment.
The (rather limited) previous experiments aimed at measuring slug front gas
entrainment rate are reviewed in Chapter 2 (Section 2.1). These experiments used
different techniques to simulate slug flows; the measured gas entrainment rates at
the same relative velocity showed differences which are probably due to the
different experimental methods, none of which exactly simulated slug flows.
Consequently, the present project sought to design and execute experiments on slug
front gas entrainment which are representative of real slug flows. The experimental
work described in this thesis consisted of the following elements:
Chapter 1: Introduction
Slug front gas entrainment in gas-liquid two-phase flow in horizontal and near horizontal pipes
PhD Thesis (MK Abdullahi, 2013) 87
1. Experiments were performed to measure rate of gas entrainment at a slug
front with stratified gas-liquid flow ahead of the slug; this system therefore
matched the one occurring in the actual slug flow case. The experiments
were carried out in a horizontal 32.8 mm ID and 6.3 m long pipe. The
experiments started with the setting up of a stratified flow in the pipe. Then,
a 3-way valve was used to switch the inlet flow from the two-phase stratified
flow to a single phase liquid flow of known flow rate. Following the switching,
the injected flow immediately downstream of the inlet was a single phase
liquid flow with a known flow rate and hence known velocity. However, the
boundary between the injected region and the initial stratified flow region
(the simulated slug front) travelled at a velocity which was the sum of (a) the
injected liquid velocity and (b) the volumetric rate of fluid pickup at the slug
front divided by the pipe cross sectional area. Thus, the fluid pickup rate can
be determined using the known (single phase liquid) injection velocity and
the measured slug front velocity. The pickup rate is the sum of the pickup
rate of the liquid layer in the stratified flow ahead of the front and the rate of
gas entrainment at the front. Since the liquid pickup rate can be determined
if the velocity and height of the stratified liquid layer ahead of the slug are
known, the experiment can be interpreted to yield the required quantity,
namely the gas entrainment rate. The experiments were carried out at
different stratified flow settings as well as different liquid injection rates. The
first experiments were carried out on the LOTUS (Long Tube System) facility
in the Pilot Plant area of the Chemical Engineering Department at Imperial
College. However, because of reconstruction of the laboratories, LOTUS was
dismantled and the experiments were moved to another facility (LOWPRESS)
situated in Room 111A in the Chemical Engineering Department.
2. In earlier work at Imperial College, two experiments on gas entrainment rate
were carried out using the WASP (Water Air Sand Petroleum) facility. This
facility has a test section diameter of 78 mm and a test section length of 37
m.
Chapter 1: Introduction
Slug front gas entrainment in gas-liquid two-phase flow in horizontal and near horizontal pipes
PhD Thesis (MK Abdullahi, 2013) 88
The respective experiments were as follows:
(a) Manolis (1995) inclined the WASP test section at 10 upwards
inclination and injected a falling liquid layer from the end of the pipe.
By pushing in a known liquid flow rate from the other end of the pipe
and by measuring the rate of slug front propagation, it was possible to
deduce gas entrainment rate at the slug front.
(b) Hale (2007) carried out slug front gas entrainment tests in WASP
with the test section horizontal. Using a weir, a stationary liquid layer
of known thickness was set up in the pipe and water was injected into
the pipe forming a slug front. The timescale of the experiments was
such that the thickness of the initial stationary stratified layer did not
change appreciably during the passage of the slug front. Again, the
rate of gas entrainment could be calculated from knowledge of the
initial liquid layer height and the slug front translational velocity.
As will be seen, the above experiments do not precisely represent slug flow in
a horizontal pipe. In the Manolis experiment, the liquid is falling towards the
slug front and in the Hale experiment, the layer is stationary. In contrast, the
present experimental scheme with a stratified flow ahead of the slug
(described in (1) above) is expected to be a closer match to the real slug flow
case. Nevertheless, it was of interest to repeat the Manolis and Hale
experiments for the smaller tube diameter (namely 32.8 mm) and this was
done.
3. In equilibrium slug flow, the rate of gas and liquid pickup at the slug front
must equal the rate of shedding of gas and liquid at the slug tail. In slug flow,
the gas is usually quickly released at the tail but the liquid flow decelerates to
form the liquid layer which is picked up by the next slug front (see Hale et al,
2005). Precise matching of the liquid layer downstream of the advancing slug
front is difficult with the stratified flow scheme described in (1) above though
the range of possible conditions can be covered by using a wide range of
initial stratified flows. In an attempt to more closely match the slug flow case
Chapter 1: Introduction
Slug front gas entrainment in gas-liquid two-phase flow in horizontal and near horizontal pipes
PhD Thesis (MK Abdullahi, 2013) 89
a new experiment was designed and implemented in which a long gas bubble
was released into the pipe. Once reasonably steady flow was initiated, the
tail of this bubble would be expected to behave in a manner analogous to a
slug front. If the flow rate in the pipe upstream of the bubble is known, then
the rate of entrainment of gas at this analogous slug front can be deduced
from measurements of the slug front (bubble tail) velocity and the liquid
layer thickness in the bubble. This experiment was successfully implemented
though there were problems in generating a suitable long bubble.
4 Experiments in which a slug was pushed over a stratified flow (i.e. of the type
described in (1) above) were carried out in the WASP facility. The use of this
facility allowed the investigation of slug front gas entrainment in a much
larger pipe (i.e. for a pipe diameter of 78 mm rather than for a pipe diameter
of 32.8 mm as used in the other tests). Of course, there was a considerable
challenge in operating these experiments in this large facility.
5 During the experimental work, extensive use was made of high speed video
photography to visualise the behaviour of slugs.
1.8 Summary of Subsequent Chapters
In what follows, Chapter 2 reviews the previous experiments on slug front gas entrainment
and the correlations developed from the results obtained. These experiments included
those of Manolis (1995) and Hale (2007) (mentioned above) and also the use of stationary
hydraulic jumps. The incorporation of gas entrainment effects into analytical models for slug
flow is also discussed.
Chapter 3 describes the experimental facilities, which are the LOTUS, LOWPRESS and WASP.
The facilities are described in detail with special attention given to instrumentation such as
the conductivity probes, sources of liquid and gas supplies, the flow measurement devices
and data acquisition.
Chapter 1: Introduction
Slug front gas entrainment in gas-liquid two-phase flow in horizontal and near horizontal pipes
PhD Thesis (MK Abdullahi, 2013) 90
Chapter 4 describes the type (1) experiments (see above) carried out in 32.8 mm diameter
pipes. The experiments were carried out in horizontal as well as in a 10 inclined pipes. Gas
entrainment rate were calculated and compared with previous measurements. The results
for slug aeration could be incorporated in unit cell models and comparisons made of the
measurements and predictions of parameters such as liquid holdup, slug length, slug
frequency and slug pressure drop. This chapter also describes the experimental simulations
of the Manolis (1995) and Hale (2007) experiments using the 32.8 mm diameter pipe (see
(2) above).
Chapter 5 describes the type (1) experiments (see above) carried out on the WASP facility
with a 78 mm pipe (see (4) above). These experiments used a 3-way valve to inject a slug
front into a pre-set stratified flow. Comparisons of the results of these experiments with
those of on LOTUS as well as with previous studies are also presented. Anew correlation
was developed based on the results from LOTUS and WASP facilities for the type (1)
experiments.
Chapter 6 describes the “bubble” experiments (see (3) above). These experiments were
carried out in the 32.8 mm diameter pipe system. In these experiments, a bubble was
created and held in place then pushed out of the pipe using liquid slug. Gas entrainment
was calculated using the methods in Chapter 4 and then comparison made between the
methods employed.
As was mentioned above, high speed video photography was used extensively in the work
and these visualisation studies are summarised in Chapter 7.
Chapter 8 summarises the main conclusions from each part of the work and highlights areas
for possible future work.
Chapter 2: Gas entrainment in slug flows
Slug front gas entrainment in gas-liquid two-phase flow in horizontal and near horizontal pipes PhD Thesis (MK Abdullahi, 2013)
91
Chapter 2: Gas Entrainment in Slug Flows
Summary: The entrainment of gas at the slug front in slug flows is a process of the utmost
importance in such flows. Such entrainment not only has an effect on the gas content (or
liquid holdup) in the slug body but it also has a direct effect on the velocity at which the slug
propagates along the channel. Basically, the slug velocity is greater than the mean fluid
velocity in the channel since fluid (gas and liquid) is entrained at the slug front and is
discharged at the slug tail. If the thickness and velocity of the liquid layer ahead of the slug
front and the slug velocity are known, it is straightforward to calculate the rate of liquid
pick-up at the slug front. However, the process of slug front gas entrainment is much more
complicated and involves complex interactions between the slug front and the liquid layer
ahead of it. Not surprisingly, therefore, calculation (and even measurement) of slug front
gas entrainment is fraught with difficulty. This Chapter focuses on the gas entrainment
phenomenon, dealing first with previous experimental measurements of slug front gas
entrainment and then with the various models and correlations which have been postulated
for its calculation. The experiments can be divided into two classes, namely those in which
the entrainment at a stationary slug front (analogous to a hydraulic jump) is measured and
those in which the entrainment at a moving slug front is estimated. The second type of
experiment is more difficult, but arguably more realistic. It is not possible at the present
time to predict gas entrainment rates from first principles and all the models contain a
strong element of empiricism. The most straightforward models (exemplified by those of
Nydal and Andreussi 1991 and Manolis 1995) are in the form of empirical correlations for
gas entrainment rate. More complex models (exemplified here by those of Bonizzi and Issa
2003 and Brauner and Ullmann 2004) are those in which gas entrainment effects are
incorporated into overall models for slug flow. Figure 5.1 shows the processes of slug gas
entrainment in a horizontal pipe with stratified film flow ahead of the slug.
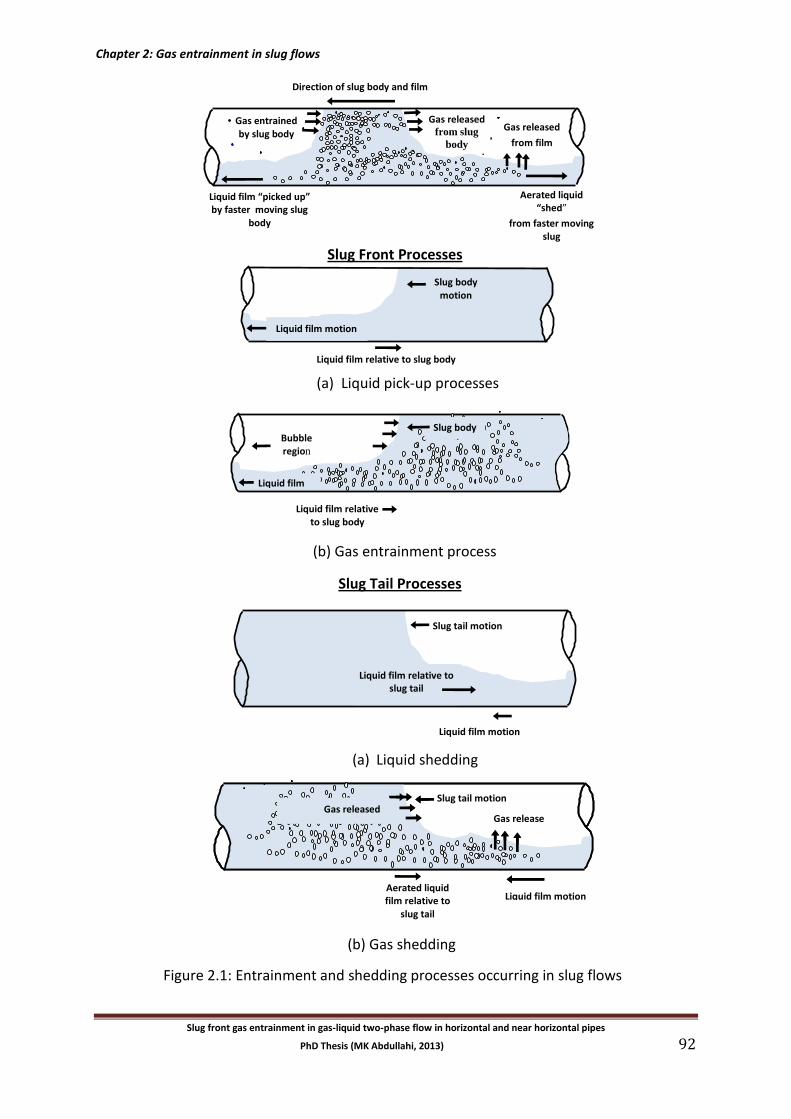
Chapter 2: Gas entrainment in slug flows
Slug front gas entrainment in gas-liquid two-phase flow in horizontal and near horizontal pipes
PhD Thesis (MK Abdullahi, 2013) 92
Slug body motion
Liquid film relative to slug body
Liquid film
motion
Bubble region
motion
(b) Gas entrainment process
Slug Front Processes
Slug Tail Processes
(a) Liquid shedding
Slug body motion
Liquid film motion
Liquid film relative to slug body
(a) Liquid pick-up processes
Figure 2.1: Entrainment and shedding processes occurring in slug flows
(b) Gas shedding
Direction of slug body and film
Gas released from slug
body
Gas entrained by slug body Gas released
from film
Aerated liquid “shed”
from faster moving slug
Liquid film “picked up” by faster moving slug
body
Liquid film relative to slug tail
Liquid film motion
Slug tail motion
Liquid film motion
Aerated liquid
film relative to
slug tail
Slug tail motion Gas released
Gas release
Aerated liquid film relative to
slug tail
Slug tail motion
Gas release Gas released
Chapter 2: Gas entrainment in slug flows
Slug front gas entrainment in gas-liquid two-phase flow in horizontal and near horizontal pipes
PhD Thesis (MK Abdullahi, 2013) 93
The Chapter is structured into the following Sections and Sub-Sections:
2.1 Experimental Measurements of Gas Entrainment Rate
2.1.1 Experiments on stationary slugs (hydraulic jumps)
2.1.1.1 Experiments of Jepson (1987)
2.1.1.2 Experiments of Pan (2010)
2.1.2 Experiments based on measurements on moving slugs
2.1.2.1 Experiments of Nydal and Andreussi (1991)
2.1.2.2 Experiments of Paglianti et al (1993)
2.1.2.3 Experiments of Manolis (1995)
2.1.2.4 Experiments of Hale (2007)
2.1.3 Comparison of results from various experiments
2.2 Correlation and Prediction of Gas Entrainment Effects
2.2.1 Correlations of gas entrainment rate
2.2.1.1 Correlation of Nydal and Andreussi (1991)
2.2.1.2 Correlation of Manolis (1995)
2.2.2 Slug flow models incorporating gas entrainment
2.2.2.1 Model of Bonizzi and Issa (2003)
2.2.2.2 Model of Brauner and Ullmann (2004)
2.3 Conclusion
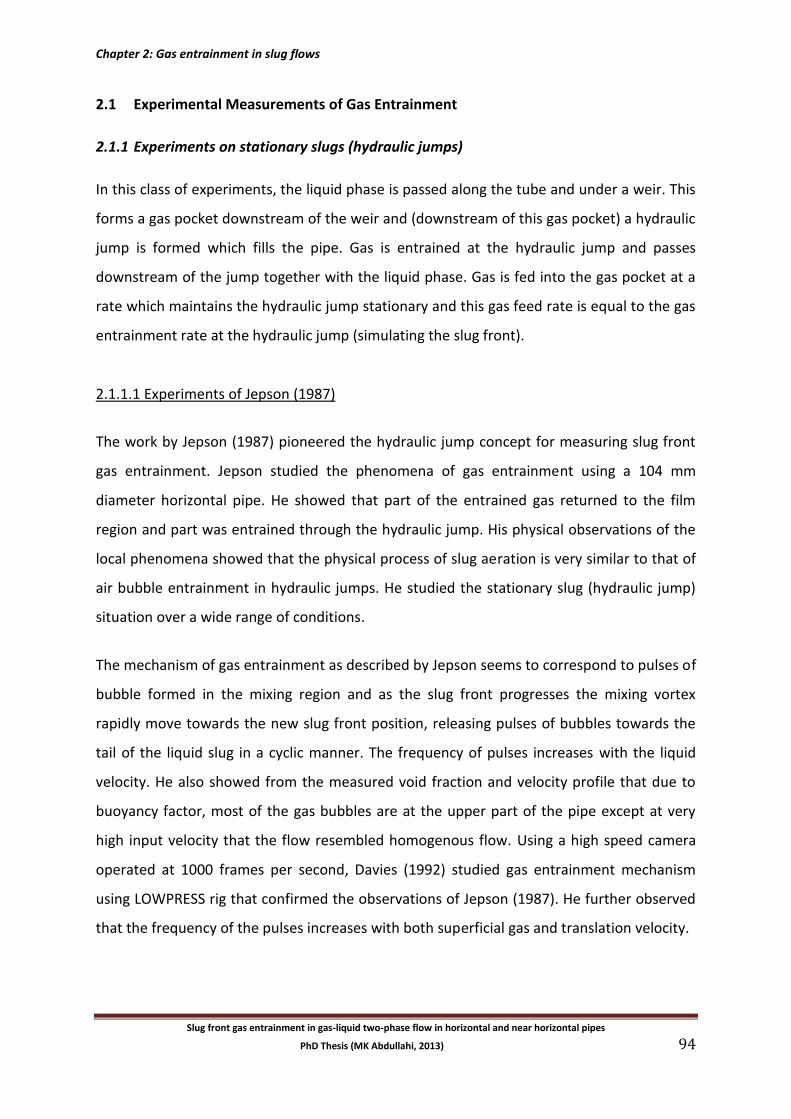
Chapter 2: Gas entrainment in slug flows
Slug front gas entrainment in gas-liquid two-phase flow in horizontal and near horizontal pipes
PhD Thesis (MK Abdullahi, 2013) 94
2.1 Experimental Measurements of Gas Entrainment
2.1.1 Experiments on stationary slugs (hydraulic jumps)
In this class of experiments, the liquid phase is passed along the tube and under a weir. This
forms a gas pocket downstream of the weir and (downstream of this gas pocket) a hydraulic
jump is formed which fills the pipe. Gas is entrained at the hydraulic jump and passes
downstream of the jump together with the liquid phase. Gas is fed into the gas pocket at a
rate which maintains the hydraulic jump stationary and this gas feed rate is equal to the gas
entrainment rate at the hydraulic jump (simulating the slug front).
2.1.1.1 Experiments of Jepson (1987)
The work by Jepson (1987) pioneered the hydraulic jump concept for measuring slug front
gas entrainment. Jepson studied the phenomena of gas entrainment using a 104 mm
diameter horizontal pipe. He showed that part of the entrained gas returned to the film
region and part was entrained through the hydraulic jump. His physical observations of the
local phenomena showed that the physical process of slug aeration is very similar to that of
air bubble entrainment in hydraulic jumps. He studied the stationary slug (hydraulic jump)
situation over a wide range of conditions.
The mechanism of gas entrainment as described by Jepson seems to correspond to pulses of
bubble formed in the mixing region and as the slug front progresses the mixing vortex
rapidly move towards the new slug front position, releasing pulses of bubbles towards the
tail of the liquid slug in a cyclic manner. The frequency of pulses increases with the liquid
velocity. He also showed from the measured void fraction and velocity profile that due to
buoyancy factor, most of the gas bubbles are at the upper part of the pipe except at very
high input velocity that the flow resembled homogenous flow. Using a high speed camera
operated at 1000 frames per second, Davies (1992) studied gas entrainment mechanism
using LOWPRESS rig that confirmed the observations of Jepson (1987). He further observed
that the frequency of the pulses increases with both superficial gas and translation velocity.
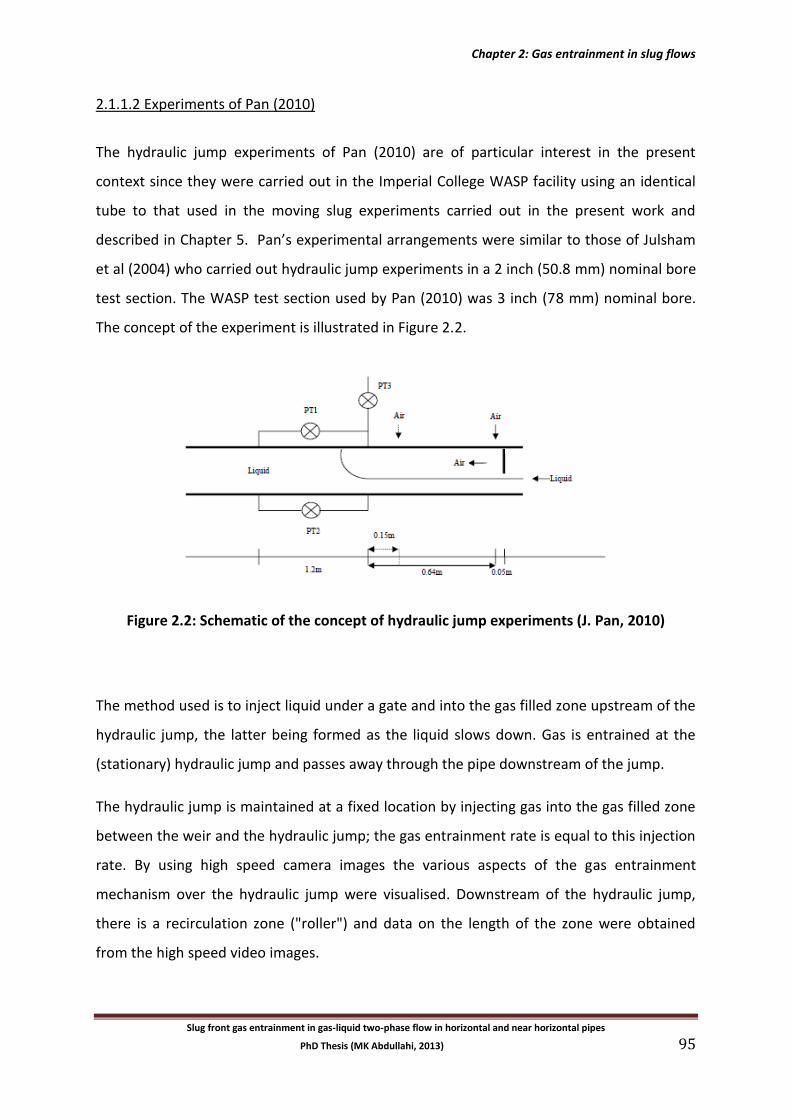
Chapter 2: Gas entrainment in slug flows
Slug front gas entrainment in gas-liquid two-phase flow in horizontal and near horizontal pipes
PhD Thesis (MK Abdullahi, 2013) 95
2.1.1.2 Experiments of Pan (2010)
The hydraulic jump experiments of Pan (2010) are of particular interest in the present
context since they were carried out in the Imperial College WASP facility using an identical
tube to that used in the moving slug experiments carried out in the present work and
described in Chapter 5. Pan’s experimental arrangements were similar to those of Julsham
et al (2004) who carried out hydraulic jump experiments in a 2 inch (50.8 mm) nominal bore
test section. The WASP test section used by Pan (2010) was 3 inch (78 mm) nominal bore.
The concept of the experiment is illustrated in Figure 2.2.
Figure 2.2: Schematic of the concept of hydraulic jump experiments (J. Pan, 2010)
The method used is to inject liquid under a gate and into the gas filled zone upstream of the
hydraulic jump, the latter being formed as the liquid slows down. Gas is entrained at the
(stationary) hydraulic jump and passes away through the pipe downstream of the jump.
The hydraulic jump is maintained at a fixed location by injecting gas into the gas filled zone
between the weir and the hydraulic jump; the gas entrainment rate is equal to this injection
rate. By using high speed camera images the various aspects of the gas entrainment
mechanism over the hydraulic jump were visualised. Downstream of the hydraulic jump,
there is a recirculation zone ("roller") and data on the length of the zone were obtained
from the high speed video images.
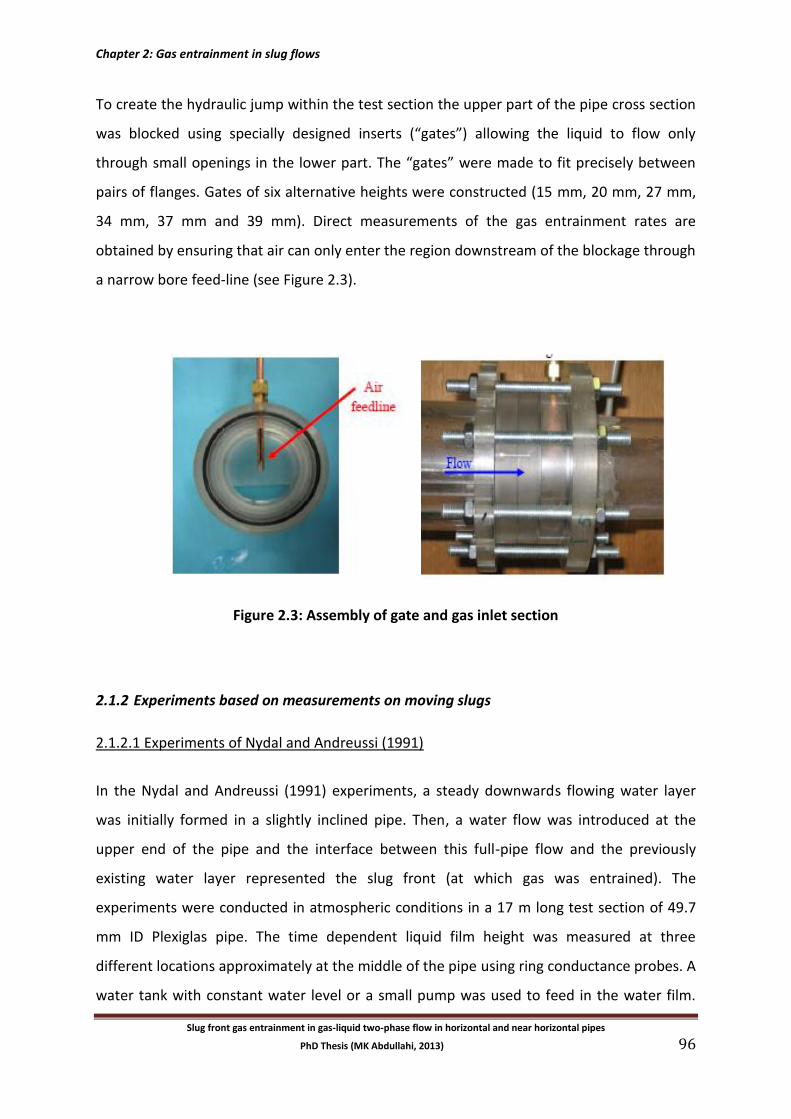
Chapter 2: Gas entrainment in slug flows
Slug front gas entrainment in gas-liquid two-phase flow in horizontal and near horizontal pipes
PhD Thesis (MK Abdullahi, 2013) 96
To create the hydraulic jump within the test section the upper part of the pipe cross section
was blocked using specially designed inserts (“gates”) allowing the liquid to flow only
through small openings in the lower part. The “gates” were made to fit precisely between
pairs of flanges. Gates of six alternative heights were constructed (15 mm, 20 mm, 27 mm,
34 mm, 37 mm and 39 mm). Direct measurements of the gas entrainment rates are
obtained by ensuring that air can only enter the region downstream of the blockage through
a narrow bore feed-line (see Figure 2.3).
Figure 2.3: Assembly of gate and gas inlet section
2.1.2 Experiments based on measurements on moving slugs
2.1.2.1 Experiments of Nydal and Andreussi (1991)
In the Nydal and Andreussi (1991) experiments, a steady downwards flowing water layer
was initially formed in a slightly inclined pipe. Then, a water flow was introduced at the
upper end of the pipe and the interface between this full-pipe flow and the previously
existing water layer represented the slug front (at which gas was entrained). The
experiments were conducted in atmospheric conditions in a 17 m long test section of 49.7
mm ID Plexiglas pipe. The time dependent liquid film height was measured at three
different locations approximately at the middle of the pipe using ring conductance probes. A
water tank with constant water level or a small pump was used to feed in the water film.
Chapter 2: Gas entrainment in slug flows
Slug front gas entrainment in gas-liquid two-phase flow in horizontal and near horizontal pipes
PhD Thesis (MK Abdullahi, 2013) 97
The film flow rate was measured with a calibrated rotameter. Very small flow rates were
determined by measuring the volume of liquid flowing out of the pipe in a given time
interval. The experimental arrangement is illustrated in Figure 2.4.
Figure 2.4: Schematic diagram of the experimental set-up (Nydal & Andreussi, 1991)
Four experimental campaigns were conducted, two at pipe inclination close to horizontal
with film almost stagnant. The others were one at 3o upwards and at 3o downwards. In each
case the film height and the velocity of the injected water were varied.
2.1.2.2 Experiments of Paglianti et al (1993)
A key assumption in experiments based on moving slugs is that the liquid layer being
approached by the slug is free of gas bubbles, the gas entrainment being associated only
with the slug front/film interaction. However, some interesting experiments in this context
were reported by Paglianti et al (1993) who considered the case of a long liquid slug
advancing over a slow moving liquid layer containing dispersed bubbles. Based on these
experiments, they conclude that the degassing of the liquid layer under the elongated
bubble is incomplete and that consequently the gas in the liquid layer contributes
Water slug
Overflow
Water dump
tank
Pumps
Water film
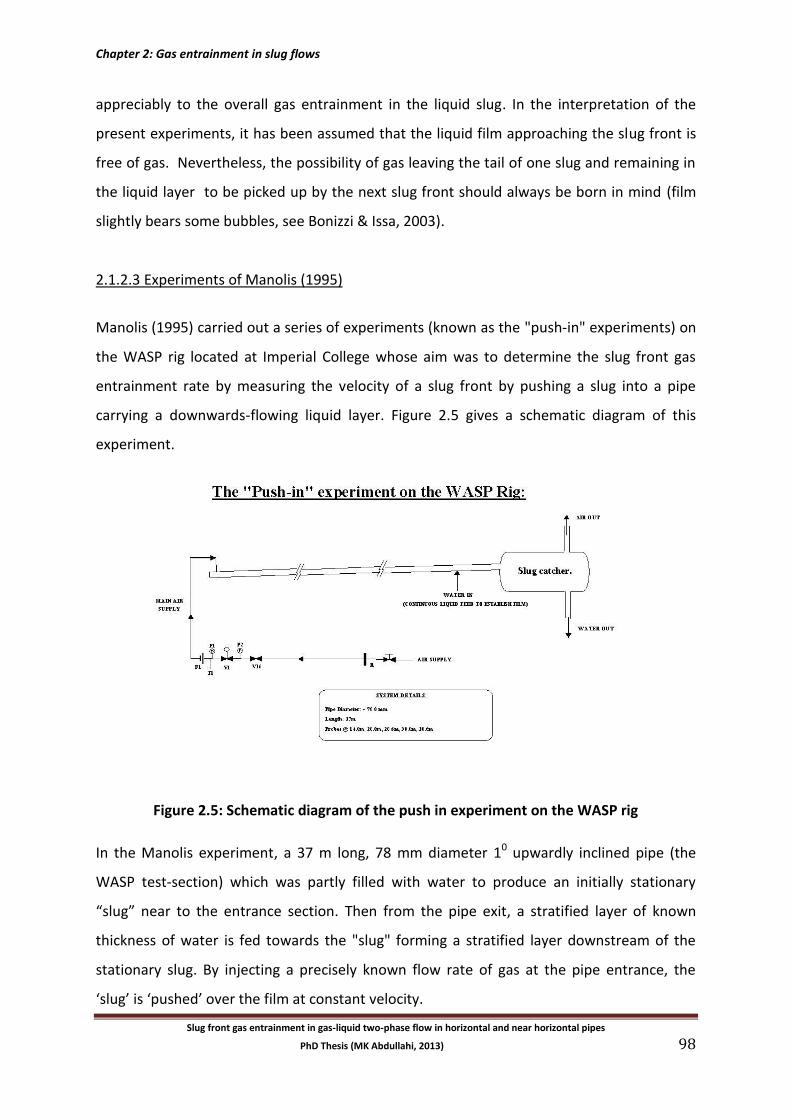
Chapter 2: Gas entrainment in slug flows
Slug front gas entrainment in gas-liquid two-phase flow in horizontal and near horizontal pipes
PhD Thesis (MK Abdullahi, 2013) 98
appreciably to the overall gas entrainment in the liquid slug. In the interpretation of the
present experiments, it has been assumed that the liquid film approaching the slug front is
free of gas. Nevertheless, the possibility of gas leaving the tail of one slug and remaining in
the liquid layer to be picked up by the next slug front should always be born in mind (film
slightly bears some bubbles, see Bonizzi & Issa, 2003).
2.1.2.3 Experiments of Manolis (1995)
Manolis (1995) carried out a series of experiments (known as the "push-in" experiments) on
the WASP rig located at Imperial College whose aim was to determine the slug front gas
entrainment rate by measuring the velocity of a slug front by pushing a slug into a pipe
carrying a downwards-flowing liquid layer. Figure 2.5 gives a schematic diagram of this
experiment.
Figure 2.5: Schematic diagram of the push in experiment on the WASP rig
In the Manolis experiment, a 37 m long, 78 mm diameter 10 upwardly inclined pipe (the
WASP test-section) which was partly filled with water to produce an initially stationary
“slug” near to the entrance section. Then from the pipe exit, a stratified layer of known
thickness of water is fed towards the "slug" forming a stratified layer downstream of the
stationary slug. By injecting a precisely known flow rate of gas at the pipe entrance, the
‘slug’ is ‘pushed’ over the film at constant velocity.
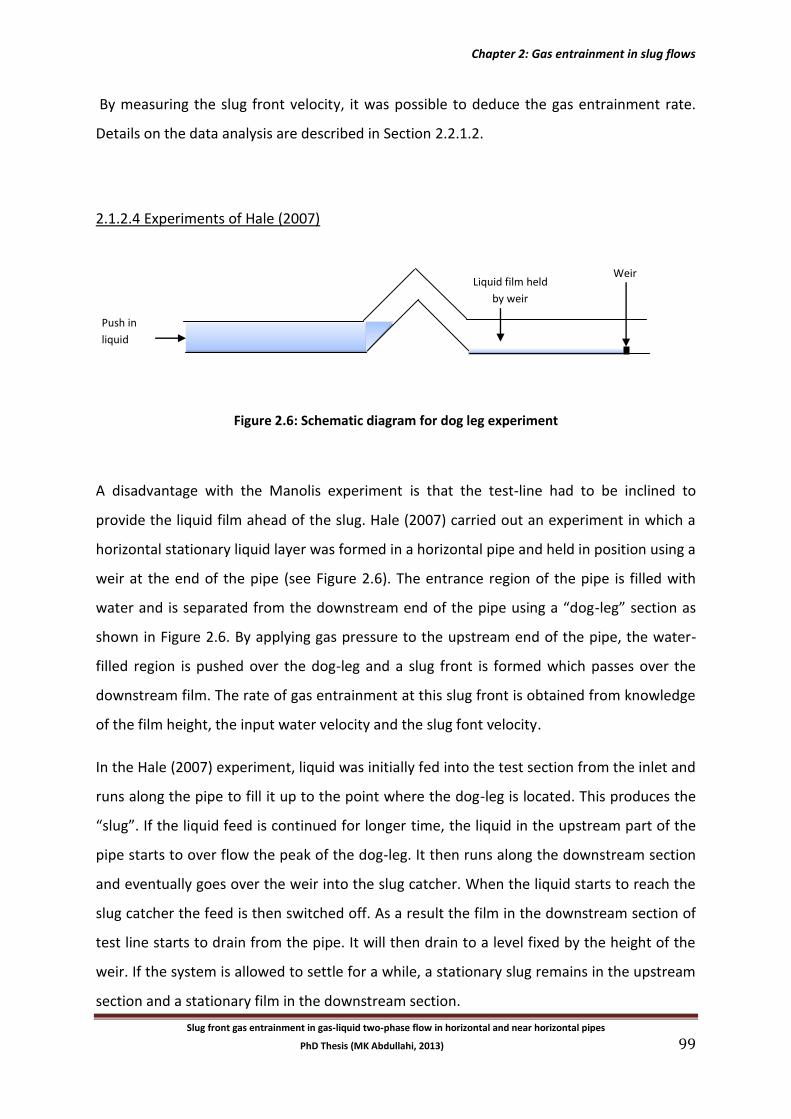
Chapter 2: Gas entrainment in slug flows
Slug front gas entrainment in gas-liquid two-phase flow in horizontal and near horizontal pipes
PhD Thesis (MK Abdullahi, 2013) 99
By measuring the slug front velocity, it was possible to deduce the gas entrainment rate.
Details on the data analysis are described in Section 2.2.1.2.
2.1.2.4 Experiments of Hale (2007)
Figure 2.6: Schematic diagram for dog leg experiment
A disadvantage with the Manolis experiment is that the test-line had to be inclined to
provide the liquid film ahead of the slug. Hale (2007) carried out an experiment in which a
horizontal stationary liquid layer was formed in a horizontal pipe and held in position using a
weir at the end of the pipe (see Figure 2.6). The entrance region of the pipe is filled with
water and is separated from the downstream end of the pipe using a “dog-leg” section as
shown in Figure 2.6. By applying gas pressure to the upstream end of the pipe, the water-
filled region is pushed over the dog-leg and a slug front is formed which passes over the
downstream film. The rate of gas entrainment at this slug front is obtained from knowledge
of the film height, the input water velocity and the slug font velocity.
In the Hale (2007) experiment, liquid was initially fed into the test section from the inlet and
runs along the pipe to fill it up to the point where the dog-leg is located. This produces the
“slug”. If the liquid feed is continued for longer time, the liquid in the upstream part of the
pipe starts to over flow the peak of the dog-leg. It then runs along the downstream section
and eventually goes over the weir into the slug catcher. When the liquid starts to reach the
slug catcher the feed is then switched off. As a result the film in the downstream section of
test line starts to drain from the pipe. It will then drain to a level fixed by the height of the
weir. If the system is allowed to settle for a while, a stationary slug remains in the upstream
section and a stationary film in the downstream section.
Weir
Push in
liquid
Liquid film held
by weir
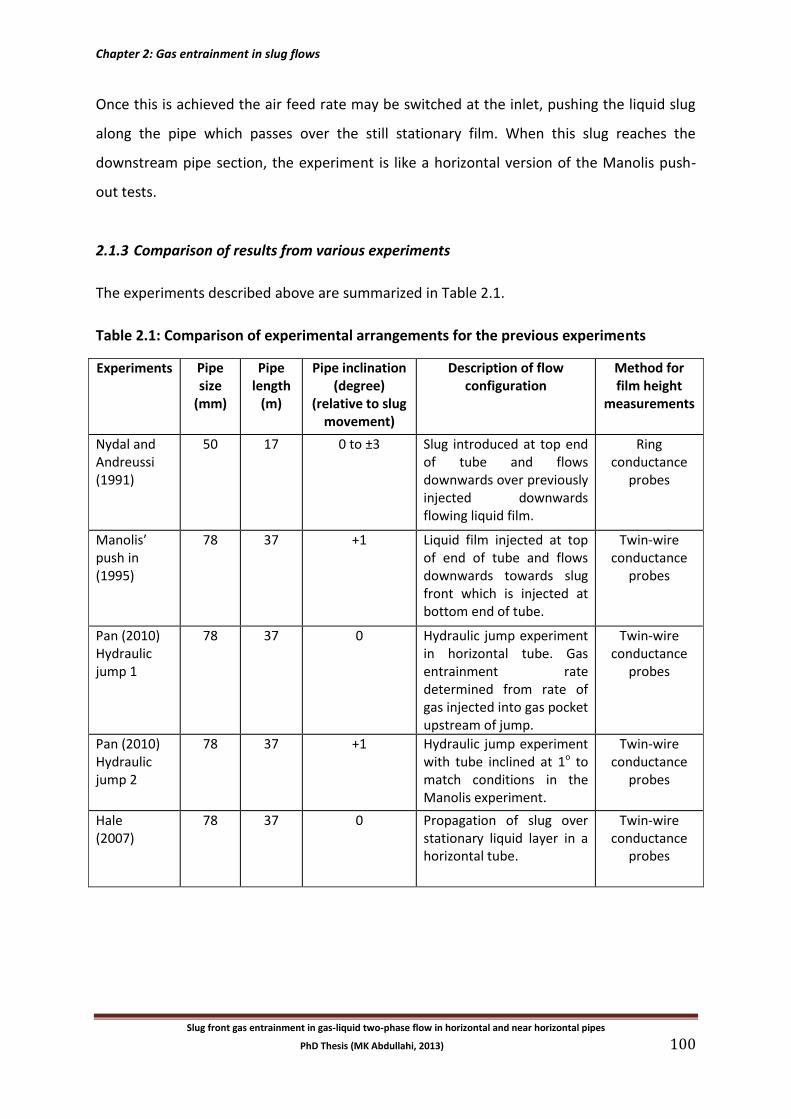
Chapter 2: Gas entrainment in slug flows
Slug front gas entrainment in gas-liquid two-phase flow in horizontal and near horizontal pipes
PhD Thesis (MK Abdullahi, 2013) 100
Once this is achieved the air feed rate may be switched at the inlet, pushing the liquid slug
along the pipe which passes over the still stationary film. When this slug reaches the
downstream pipe section, the experiment is like a horizontal version of the Manolis push-
out tests.
2.1.3 Comparison of results from various experiments
The experiments described above are summarized in Table 2.1.
Table 2.1: Comparison of experimental arrangements for the previous experiments
Experiments Pipe size
(mm)
Pipe length
(m)
Pipe inclination (degree)
(relative to slug movement)
Description of flow configuration
Method for film height
measurements
Nydal and Andreussi (1991)
50 17 0 to ±3 Slug introduced at top end of tube and flows downwards over previously injected downwards flowing liquid film.
Ring conductance
probes
Manolis’ push in (1995)
78 37 +1 Liquid film injected at top of end of tube and flows downwards towards slug front which is injected at bottom end of tube.
Twin-wire conductance
probes
Pan (2010) Hydraulic jump 1
78 37 0 Hydraulic jump experiment in horizontal tube. Gas entrainment rate determined from rate of gas injected into gas pocket upstream of jump.
Twin-wire conductance
probes
Pan (2010) Hydraulic jump 2
78 37 +1 Hydraulic jump experiment with tube inclined at 1o to match conditions in the Manolis experiment.
Twin-wire conductance
probes
Hale (2007)
78 37 0 Propagation of slug over stationary liquid layer in a horizontal tube.
Twin-wire conductance
probes
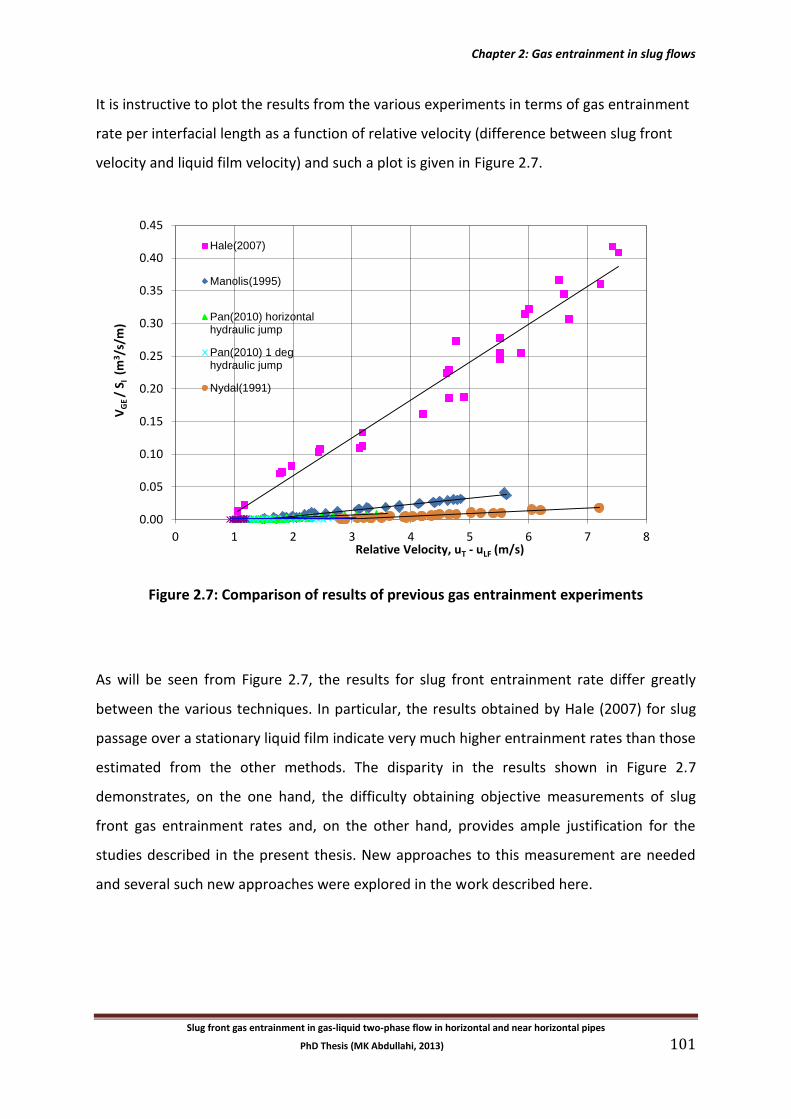
Chapter 2: Gas entrainment in slug flows
Slug front gas entrainment in gas-liquid two-phase flow in horizontal and near horizontal pipes
PhD Thesis (MK Abdullahi, 2013) 101
It is instructive to plot the results from the various experiments in terms of gas entrainment
rate per interfacial length as a function of relative velocity (difference between slug front
velocity and liquid film velocity) and such a plot is given in Figure 2.7.
Figure 2.7: Comparison of results of previous gas entrainment experiments
As will be seen from Figure 2.7, the results for slug front entrainment rate differ greatly
between the various techniques. In particular, the results obtained by Hale (2007) for slug
passage over a stationary liquid film indicate very much higher entrainment rates than those
estimated from the other methods. The disparity in the results shown in Figure 2.7
demonstrates, on the one hand, the difficulty obtaining objective measurements of slug
front gas entrainment rates and, on the other hand, provides ample justification for the
studies described in the present thesis. New approaches to this measurement are needed
and several such new approaches were explored in the work described here.
0.00
0.05
0.10
0.15
0.20
0.25
0.30
0.35
0.40
0.45
0 1 2 3 4 5 6 7 8
VG
E /
S I (
m3 /
s/m
)
Relative Velocity, uT - uLF (m/s)
Hale(2007)
Manolis(1995)
Pan(2010) horizontalhydraulic jump
Pan(2010) 1 deghydraulic jump
Nydal(1991)
Chapter 2: Gas entrainment in slug flows
Slug front gas entrainment in gas-liquid two-phase flow in horizontal and near horizontal pipes
PhD Thesis (MK Abdullahi, 2013) 102
2.2 Correlation and Prediction of Gas Entrainment Effects
2.2.1 Correlations of gas entrainment rate
2.2.1.1 Correlation of Nydal and Andreussi (1991)
Nydal & Andreussi (1991) measured the rate of gas entrainment of liquid front advancing
over a slow moving liquid layer in a 50 mm ID slightly inclined pipe using air-water at
atmospheric conditions. Using ring conductance probes, the gas content in the liquid body
at various locations was measured. They concluded that gas entrainment only occurs if a
liquid layer is present ahead of the slug front and if the relative velocity between the slug
front and the liquid layer is greater than a certain value. Furthermore, they suggest that the
rate of the net gas entrainment is approximately proportional to both the relative velocity
between the slug front and the liquid layer, and to the interfacial width of the liquid layer.
The theoretical concept of the experiment is presented below.
Considering Figure 2.8, the gas volumetric flux per unit pipe cross section entering the liquid
front , equals the total rate of change of the gas content in the slug,
∫
(2.1)
Where , is the cross-sectional void fraction and is the length of the aerated region. The
average void faction is given by:
∫
(2.2)
This result in,
( ) (2.3)
For a constant , the gas volume balance relative to the slug front is:
( ) (2.4)
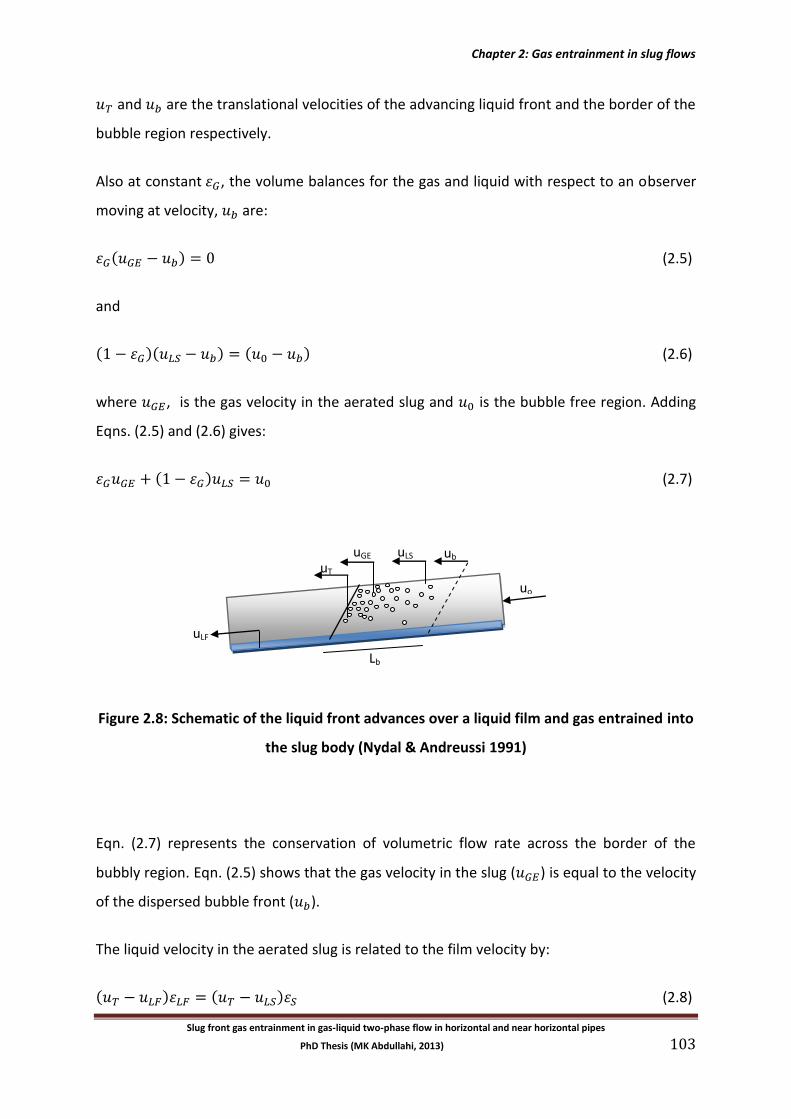
Chapter 2: Gas entrainment in slug flows
Slug front gas entrainment in gas-liquid two-phase flow in horizontal and near horizontal pipes
PhD Thesis (MK Abdullahi, 2013) 103
and are the translational velocities of the advancing liquid front and the border of the
bubble region respectively.
Also at constant , the volume balances for the gas and liquid with respect to an observer
moving at velocity, are:
( ) (2.5)
and
( )( ) ( ) (2.6)
where , is the gas velocity in the aerated slug and is the bubble free region. Adding
Eqns. (2.5) and (2.6) gives:
( ) (2.7)
Figure 2.8: Schematic of the liquid front advances over a liquid film and gas entrained into
the slug body (Nydal & Andreussi 1991)
Eqn. (2.7) represents the conservation of volumetric flow rate across the border of the
bubbly region. Eqn. (2.5) shows that the gas velocity in the slug ( ) is equal to the velocity
of the dispersed bubble front ( ).
The liquid velocity in the aerated slug is related to the film velocity by:
( ) ( ) (2.8)
Lb
uT
uLF
uo
uGE uLS ub
Chapter 2: Gas entrainment in slug flows
Slug front gas entrainment in gas-liquid two-phase flow in horizontal and near horizontal pipes
PhD Thesis (MK Abdullahi, 2013) 104
Where and are the liquid holdup in the film and slug respectively.
The gas entrainment rate can be calculated from Eqn. (2.1) by transforming it into a time
domain as:
(∫
∫
) (2.9)
where is the transit time of the slug front between two probes and is the void fraction
in the liquid body at point .
Nydal & Andreussi (1991) correlated their experimental results and suggested the following
expression for the gas entrained volumetric rate:
[
( ) ] (2.10)
Where is the net gas entrainment volumetric flux per unit cross-sectional area, is the
interfacial width and and are constants given by linear regression as = 0.076
and = 0.15 m/s.
However, the model did not take into consideration the drift velocity of the small bubbles in
the calculations of and this could lead to significant amount of error. Nydal et al. also
presented a calculation for the pressure drop required to accelerate liquid film across the
slug front based on the Dukler & Hubbard (1975) slug flow model.
2.2.1.2 Correlation of Manolis (1995)
Manolis (1995) obtained the gas entrainment rate from a material balance performed over
the “slug” front. The entrainment rate was found to be a linear function of the mixture
velocity and to increase as the liquid layer increases in depth. The estimation of the rate
follows from a volume balance by considering three cases as follows:
Chapter 2: Gas entrainment in slug flows
Slug front gas entrainment in gas-liquid two-phase flow in horizontal and near horizontal pipes
PhD Thesis (MK Abdullahi, 2013) 105
Case 1: when the slug front is moving over a stationary liquid layer and there is no gas
entrainment, the slug front velocity is given by:
( ) (2.11)
where is the volumetric inflow rate (in the Manolis experiments, gas was used to push in
the liquid slug and the volume flow of the pushing gas estimated which gave a value for ).
is the cross sectional area of the tube and is the fraction of the tube cross sectional
area occupied by the liquid film ahead of the slug front.
Case 2: when the slug front is moving over a liquid film flowing down towards the slug front
at a volumetric flow , the slug front velocity is give by:
( ) (2.12)
Case 3: when the slug front is moving over a back-flow of liquid of volumetric flow and
there is a volumetric gas entrainment rate of , the slug front velocity is give by:
( ) (2.13)
The third case applies to the Manolis pushing-in experiments.
Rearranging Eqn. (2.13) gives:
( ) (2.14)
Dividing Eqn. (2.14) by the cross-sectional area transforms the equation into velocity terms
as:
( ) (2.15)
From the experiments, Manolis correlated the push-in results as in Eqn. (2.16)
[( ) ( ) ] (2.16)
where is the net gas volumetric entrainment rate, is the interfacial width, is a
constant given by linear regression as and the minimum relative velocity for
Chapter 2: Gas entrainment in slug flows
Slug front gas entrainment in gas-liquid two-phase flow in horizontal and near horizontal pipes
PhD Thesis (MK Abdullahi, 2013) 106
gas entrainment, ( ) m/s. This value of the minimum relative velocity
for gas entrainment is close to that found by Nydal and Andreussi (1991) and also to the
value of 2 m/s obtained by Bos & Du Chatinier (1994) in experiments on sphere-propelled
liquid slugs performed in a 26 m long, 50 mm diameter test section.
Manolis established the following correlation from his findings:
[( ) ] (2.17)
is the slug front velocity,
is the liquid film velocity and is the interfacial
perimeter.
2.2.2 Slug flow models incorporating gas entrainment
The prediction of gas entrainment rate into liquid slugs in horizontal and inclined pipes is an
important part of the modelling of gas-liquid two-phase slug flow. Gas entrainment rate has
been incorporated into a number of generic models for slug flows and these are exemplified
here by the models of Bonizzi & Issa (2003) and Brauner & Ullman (2004).
2.2.2.1 Model of Bonizzi and Issa (2003)
Bonizzi & Issa (2003) proposed a mathematical model based on the two-fluid model
framework that accounts for the entrainment of gas bubbles into liquid slugs. Essentially,
the slug front gas entrainment rate is not calculated separately but follows from the
assumptions of the model. The model includes a scalar equation for the transport for the
dispersed gas bubbles concentration within the liquid. The model well predicted slug front
velocity, slug frequency, pressure drop and film holdup.
Bonizzi and Issa expressed the liquid and bubble velocities as:
(2.18)
and
(2.19)
Chapter 2: Gas entrainment in slug flows
Slug front gas entrainment in gas-liquid two-phase flow in horizontal and near horizontal pipes
PhD Thesis (MK Abdullahi, 2013) 107
where the subscripts , and refer to liquid, gas bubble and mixture respectively while
represents the slip velocity between the gas bubbles and the liquid.
(2.20)
The void fractions are given by:
(2.21)
where is the volume fraction of the mixture of liquid and the entrained gas bubbles, is
the volume fraction of the gas phase flowing separately in the stratified region. In the slug
body and
The mixture, liquid and dispersed bubble fractions are related as:
(2.22)
where is the volume fraction of the gas bubbles entrained in the slug body and is the
volume fraction of the un-aerated liquid. The gas is treated as a compressible fluid and its
density calculated from the ideal gas law. The liquid assumed to be incompressible.
The governing equations for an isothermal transient one-dimensional stratified and aerated
slug flow are:
Gas continuity equation:
( )
( )
(2.23)
Mixture continuity equation:
( )
( )
(2.24)
Gas momentum equation:
( )
( )
(2.25)
Chapter 2: Gas entrainment in slug flows
Slug front gas entrainment in gas-liquid two-phase flow in horizontal and near horizontal pipes
PhD Thesis (MK Abdullahi, 2013) 108
Mixture momentum equation:
( )
( )
(2.26)
where and are the forces exerted by the pipe walls on the gas and liquid-mixture
phases, is the interfacial force, is the gas-liquid interface pressure, is the height of the
mixture layer, and represent the spatial and time coordinate respectively, is the pipe
inclination and is in kg.s-1.m-3.
The scalar-transport equation for the conservation of mass of the gas bubbles entrained
within the liquid slug is given by,
( )
( )
(2.27)
Closure relations are required for , , and .
The inter-phase and gas-wall shear forces are:
(2.28)
and
(2.29)
where is the pipe cross-sectional area, and are the interfacial width and gas wetted
perimeter respectively. The interfacial shear stress is based on the model of Taitel and
Dukler (1976).
The relative velocity between the gas and liquid phases is:
(2.30)
The liquid-wall (or mixture-wall within an aerated slug) shear force is:
(2.31)
| | (2.32)
Chapter 2: Gas entrainment in slug flows
Slug front gas entrainment in gas-liquid two-phase flow in horizontal and near horizontal pipes
PhD Thesis (MK Abdullahi, 2013) 109
is an effective friction factor that takes into account the correction proposed by Malnes
(1982) and is given by,
(2.33)
where for the whole flow domain except within the aerated slug.
For the aerated slug, the Malnes correction gives:
[
√( )
] (2.34)
is the terminal velocity of an isolated bubble rising in an infinite medium and is given by:
[ ( )
]
(2.35)
is the gas-liquid surface tension.
The correlations of Hand (1991) and Spedding & Hand (1997) are used for the liquid-wall
friction factor:
If the liquid flow is turbulent ( ) then:
( ) (2.36)
where is the Reynolds number based on the liquid superficial velocity.
The forces encountered by a moving bubble are pressure and drag forces, assuming a steady
motion of the bubble, the balance of these forces is:
(2.37)
where and are the cross-sectional area and volume of the gas bubble respectively.
By rearranging the Equation (2.37):
√ ( ⁄ )
(2.38)
Chapter 2: Gas entrainment in slug flows
Slug front gas entrainment in gas-liquid two-phase flow in horizontal and near horizontal pipes
PhD Thesis (MK Abdullahi, 2013) 110
Therefore, the bubble velocity can be obtained as:
√ ( ⁄ )
(2.39)
where is the bubble diameter and is equal to 1 mm (Andreussi et al. (1993).
The drag coefficient calculated from the correlation of Tomiyama (1995) is expressed as:
√ (2.40)
Where,
[
(
)
(
)] (2.41)
and are the bubble Reynolds and Eötvös numbers respectively and are given by:
| |
(2.42)
and
( )
(2.43)
By assuming that all the bubbles arriving at the tail leave the slug and enter the large bubble
behind it, then the rate of shedding of dispersed bubbles at the tail is:
( ) (2.44)
where is in kg.s-1.m-1, bu is the local velocity at which the tail of the slug propagates and
is given by:
(2.45)
with the distribution coefficient and drift velocity being 1.2 and 0, or 1.05 and
√ depending on whether the Froude number is greater or smaller than the critical
value of 3.5 respectively.
Chapter 2: Gas entrainment in slug flows
Slug front gas entrainment in gas-liquid two-phase flow in horizontal and near horizontal pipes
PhD Thesis (MK Abdullahi, 2013) 111
2.2.2.2 Model of Brauner and Ullmann (2004)
Brauner and Ullmann (2004) developed a model that attributes the aeration of the liquid
slug to the entrainment of small gas bubbles from the tails of the large gas bubble regions
separating the slugs. This bubble fragmentation, they argued was related to the turbulent
kinetic energy of the wall jet and shear layer which are formed at the slug front as the liquid
film from the large bubble region plunges into the slug front. The bubble fragmentation
model was built into a unified slug flow model that predicts slug characteristics. The model
is summarized below.
Brauner and Ullmann calculated the rate of production of surface energy ( ) due to the
fragmentation of the large bubble tail into smaller bubbles at the rate , using the
following expression,
(2.46)
Where is the surface tension and is the Sauter mean bubble diameter.
Scaling the mean bubble diameter to the maximum bubble size:
(2.47)
The flux of surface energy is proportional to the flux of turbulence energy supply by the
penetrating liquid jet at a rate and calculated as:
(
)
(2.48)
where
( )(
) (2.49)
is constant and embodies the scaling constant , ( ), is the velocity of
unfragmented gas in the large bubble. The maximum values reported for compound shear
stress, Rajaratnam (1976) is .
Chapter 2: Gas entrainment in slug flows
Slug front gas entrainment in gas-liquid two-phase flow in horizontal and near horizontal pipes
PhD Thesis (MK Abdullahi, 2013) 112
By taking conservative values of, gives:
(
) (2.50)
Where is the liquid slug velocity and
is the liquid film velocity at front of the wake.
( )
( ) (2.51)
The maximum bubble size in a swarm is estimated on the critical size of deformable
bubbles as:
[
( ) ]
( ) (2.52)
; {
| | | |
| | | | } (2.53)
In capillary systems, where Eqn. (2.53) gives
For the minimal distance required for maintaining separated bubbles in dispersed pattern,
Brauner and Ullmann used .
( ) (2.54)
(
)
(2.55)
Where is Weber number and is the critical Weber number.
Applying the drift flux model to describe the bubbly flow in the slug region, the bubble and
liquid velocities are:
(2.56)
Where the distribution parameter
( )
, and are local gas fraction and
mixture respectively.
Chapter 2: Gas entrainment in slug flows
Slug front gas entrainment in gas-liquid two-phase flow in horizontal and near horizontal pipes
PhD Thesis (MK Abdullahi, 2013) 113
The liquid velocity in the long bubble wake is calculated from,
( )
(2.57)
For the drift velocity, Brauner and Ullman applied the Harmathy’s (1960) model corrected
for the effect of the bubble concentration in the swarm and for the effect of tube inclination
as follows:
[
( )
]
( ) (2.58)
The wake effects diminish upstream of the large bubble wake region, and the liquid and gas
velocities become;
(2.59)
and
( )
(2.60)
The model suggests that the average gas velocity in the large bubble region is unaffected by
small bubbles absorbed at the large bubble interface and by re-entrainment at the large
bubble tail. Therefore, it is determined by the large bubble velocity expressed by Nicklin et
al. (1962) equation:
(2.61)
In gravity dominated systems and in the inertia controlled regime (where the surface
tension and viscosity effects are small) the results for the vertical and horizontal cases are as
follows:
(
)
(2.62)
(
)
(2.63)
Chapter 2: Gas entrainment in slug flows
Slug front gas entrainment in gas-liquid two-phase flow in horizontal and near horizontal pipes
PhD Thesis (MK Abdullahi, 2013) 114
In an inclined pipe, the weighted value suggested by Bendiksen (1984) is used:
(
)
(2.64)
For horizontal pipes and in the inertia controlled regime, Brauner and Ullmann used the
correlations of Weber (1989), which is:
(2.65)
Where is Eötvös number.
For vertical pipes, Brauner and Ullmann used:
for
(2.66)
Estimating the bubble back-flow based on the difference between the drift velocity of the
large bubble and that of the bubbles in the swarm:
{(
)
} (2.67)
For most practical applications, the large bubble drift velocity is higher than that of the
bubbles in the swarm; the above back-flow model has a minimal or zero effect on the
predicted slug flow structure. There is a need for a more rigorous model for the back-flow
that represents in more detail the flow phenomena in the large bubble wake.
For , the net averaged rate of gas loss from the large bubble tail, which is shed out
of the large bubble wake region into the liquid slug is:
{
} (2.68)
For a non-negligible slip between the liquid and the gas in the slug, is dependent on the
in situ gas fraction, therefore, the equations are written in the implicit form as:
(2.69)
Chapter 2: Gas entrainment in slug flows
Slug front gas entrainment in gas-liquid two-phase flow in horizontal and near horizontal pipes
PhD Thesis (MK Abdullahi, 2013) 115
(2.70)
For a developed slug flow and in a case the film at the large bubble tail is un-aerated:
( ) (2.71)
Since then,
(2.72)
Or combining, Eqn. (2.72) with Eqns. (2.60) and (2.71) gives:
[ (
)
]
(2.73)
Liquid film velocity is required in the gas entrainment rate, Eqn. (2.55). The volumetric flow
rate in the adjacent film is obtained from the overall mass balance:
(2.74)
The local average velocity in the film is related to its local fraction and the flow as:
(2.75)
At the large bubble nose, the film consists of liquid and gas bubbles, therefore the gas
fraction is:
( )
( ) (2.76)
The liquid film holdup as a function of position along the large bubble is determined by
momentum balances on the film zone. For an annular flow (as occurs in a vertical slug flow),
the gradient of the film holdup is given by:
( )
( ) [
]
( )( )
( ) (
)
(2.77)
Chapter 2: Gas entrainment in slug flows
Slug front gas entrainment in gas-liquid two-phase flow in horizontal and near horizontal pipes
PhD Thesis (MK Abdullahi, 2013) 116
with
at where ; (2.78)
and
( ) (2.79)
For horizontal and inclined slug flow, the gradient of the film holdup is given by:
[
]
[
( )( )
( ) (
)
]
(2.80)
with at (2.81)
Integrating Eqn. (2.77) or Eqn. (2.80) up to a prescribed large bubble length
gives the in situ holdup at the large bubble tail and the corresponding velocity in the
liquid film:
;
for (2.82)
For a long large bubble, the fully developed film thickness corresponds to
where the numerator of Eqn. (2.77) or (2.80) equals zero. This produces an algebraic
equation for the film thickness.
Slug length
( ) ∫ ( ) ( )
(2.83)
Chapter 2: Gas entrainment in slug flows
Slug front gas entrainment in gas-liquid two-phase flow in horizontal and near horizontal pipes
PhD Thesis (MK Abdullahi, 2013) 117
or
(
)
(2.84)
is the length of the LB wake, where
, the calculations are made assuming a
wake length of , is the gas volume per unit tube cross section in the LB, by integrating
the following differential equation in the range , :
(2.85)
and ( )
Calculations procedure
For a fully developed liquid film, and , the model requires solution of 4
non-linear algebraic equations for the unknowns: (or ), , and
.
In case of a large bubble of finite length, the model requires integration of the differential
equation (2.80) for the film thickness up to a specified length the problem is a
boundary value one since the gas entrainment rate and the slug translational velocity are
dependent on the condition at the large bubble tail.
For a short large bubble for which, , gas is not entrained into the slug,
hence .
Integration of Eqn. (2.80) with and is valid for large bubbles shorter than
critical length, correspond to the onset of gas entrainment.
For a longer large bubble, corresponds to a certain bubble length .
The integration of Eqn. (2.80) requires a tedious iteration procedure; it is therefore, easier
to replace the momentum Equation (2.80) by a prescribed value of liquid film holdup at the
bubble tail, in the range
( ) ( ). Equations (2.73), (2.70) and
(2.71) are then solved to obtain , ,
and . Alternatively, the net gas
entrainment rate, can be calculated using Eqn. (2.69), the entrainment into the slug
Chapter 2: Gas entrainment in slug flows
Slug front gas entrainment in gas-liquid two-phase flow in horizontal and near horizontal pipes
PhD Thesis (MK Abdullahi, 2013) 118
front from Eqn. (2.54) while the release of the entrained bubble back into the bubble
region from Eqn. (2.68).
In order to calculate volumetric gas entrainment, the entrainment calculated from Brauner
& Ullmann which is the velocity of the entrained gas, needs to be expressed in the form of
Manolis (1995) correlation.
Therefore, Eqn. (2.69) becomes,
( ) (2.86)
2.3 Conclusion
The review of earlier work presented in this Chapter shows how measurement of slug front
gas entrainment rate presents considerable difficulty and is not surprising that there is
diversity in the results obtained. It is clear that experiments with hydraulic jumps are not
very representative of the real situation of a moving slug. Experiments with moving slugs are
to be preferred but the way in which the film is set up ahead of the slug is of crucial
importance. In the work described in this thesis, this problem has been addressed in a
number of ways.
Bearing in mind the uncertainties in the measurements, it is perhaps not too surprising that
prediction of entrainment rate also presents great difficulty. One approach (followed by
Nydal and Andreussi, 1991) and Manolis, 1995) is to correlate the gas entrainment rate in
terms of relative velocity of the slug front and liquid film and the liquid film width. The
generality of such an approach is obviously questionable. An alternative approach (followed
by Bonizza and Issa, 2003 and Brauner and Ullmann, 2004) is to attempt to treat the
entrainment process in a framework of overall models for slug flow. Though these models
are interesting, their generality is yet to be established. For additional material on gas
entrainment model see also Skartlien et al (2012) work on gas entrainment model for
hydraulic jumps.
Chapter 3: Experimental facilities and methods
Slug front gas entrainment in gas-liquid two-phase flow in horizontal and near horizontal pipes PhD Thesis (MK Abdullahi, 2013)
119
Chapter 3: Experimental Facilities and Methods
Summary: A major part of the current work was to carry out new experiments on slug front
gas entrainment using the “push in” principle employed by Manolis (1995) and Hale (2007).
The experiment starts with a film of known thickness and velocity being set up in the pipe
and then introducing (i.e. “pushing in”) a purely liquid slug into one end of the pipe. The
introduced slug moves along the tube at a rate which depends on the liquid velocity in the
upstream part of the slug, the liquid layer thickness and film velocity ahead of the slug and
the rate of gas entrainment at the slug front. Measurement of the slug front velocity allows
the slug front gas entrainment rate to be determined.
Major differences between the new experiments described here and the earlier ones by
Manolis and Hale are in the way the slug is driven along the pipe, the initial flow condition in
the pipe and the manner in which the slug was introduced. In the earlier experiments, the
slug was driven along the pipe by applying gas pressure at the inlet. The fluid velocity way
upstream of the slug front was calculated from the gas inlet flow rate; the transient
pressure history near the inlet was measured and a correction made for the compressibility
of the gas in the inlet zone. This compressibility correction was quite complex and has been
avoided in the present work by the direct measurement of the liquid injection rate. In the
experiments of Manolis liquid film was flowing downwards towards the front and in those of
Hale, the film was stationary. In the present work, a more realistic initial condition of a pre-
existing stratified flow was possible (though the Manolis and Hale initial conditions were
also investigated). In the present experiments, the slug was introduced into the pipe by the
operation of a 3-way valve.
The “push in” experiments reported here were carried out for 32.8 mm internal diameter
tubes using an existing air-water flow rig in the Pilot Plant area of the Department of
Chemical Engineering at Imperial College. This rig (LOTUS - LOngTUbe System) was
subsequently dismantled due to the refurbishment of the Pilot Plant area.
Chapter 3: Experimental facilities and methods
Slug front gas entrainment in gas-liquid two-phase flow in horizontal and near horizontal pipes PhD Thesis (MK Abdullahi, 2013)
120
The LOTUS facility is described in Section 3.1 below. The results from the LOTUS “push-in”
experiments are presented in Chapter 4. A more limited set of “push-in” experiments was
carried out for a 78 mm diameter tube in the WASP (Water Air Sand and Petroleum) facility
at Imperial College. The WASP facility is described in Section 3.2 below and the results
obtained are presented in Chapter 5.
After the dismantling of the LOTUS facility, work on this project was continued in another
low pressure air-water facility (LOWPRESS) situated in Laboratory 111 in the Department of
Chemical Engineering. Again, tubes of 32.8 mm internal diameter were employed. The
LOWPRESS facility is described in Section 3.3 below; this facility was used for two types of
experiments as follows:
(1) A new type of gas entrainment measurement (the “bubble method”) was
investigated using the LOWPRESS facility and the bases of this methodology and
the results obtained using it are described in Chapter 6.
(2) Experiments were carried out in LOWPRESS to make video photography of slug
flows in this system and the results are presented in Chapter 7.
In what follows in this Chapter, a description is given of the LOTUS, WASP and LOWPRESS
facilities. In all the experiments, the thickness of the liquid layer ahead of the slug and the
motion of the slug front were monitored using twin-wire conductance probes and this
Chapter also contains a description of this probe system and the data acquisition system
then followed by some concluding remarks.
The contents of the remainder of this Chapter are as follows:
3.1 The LOTUS Facility
3.2 The WASP High Pressure Facility
3.3 The LOWPRESS Facility
3.4 Twin-wire Conductance Probes
3.5 Data Acquisition and Processing
3.6 Conclusion
Chapter 3: Experimental facilities and methods
Slug front gas entrainment in gas-liquid two-phase flow in horizontal and near horizontal pipes PhD Thesis (MK Abdullahi, 2013)
121
3.1 The LOTUS Facility
The LOng Tube System (LOTUS) rig was situated in the pilot plant laboratory of the
Department of Chemical Engineering, Imperial College London. LOTUS was a general
purpose air-water flow facility with test section of 32.8 mm ID and a length of 6.3 m and has
been used for a very wide range of experiments. A general flow diagram of LOTUS is shown
in Figure 3.1. For the “push-in” experiments which formed part of the current work, the
principal elements of the rig which were employed are shown in the sketch in Figure 3.2;
Figure 3.3 shows some photographs of some key components of the present experiments.
A typical experiment begins with the setting up of a stratified flow. The air and water
streams used to set up the stratified flow in the (typically horizontal) 32.8 mm tube are
drawn from the LOTUS rig. This stratified flow passes through the three-way ball valve. The
other connection to this three-way valve is to a vessel containing water which is pressurised
by rig air pressure. In the LOTUS experiments, this vessel consisted simply of a vertical 3 m
length of 76.2 mm internal diameter stainless steel tube. When the three-way valve was
operated, water from this vessel rapidly flowed into the test section and the rate of water
ingress was measured using the venturi as indicated. The injected water flowed over the
pre-existing stratified layer as a “pushed-in” slug and the rate of gas entrainment at the slug
front could be determined. When the three-way valve is operated, the feed for the initial
stratified flow is shut off.
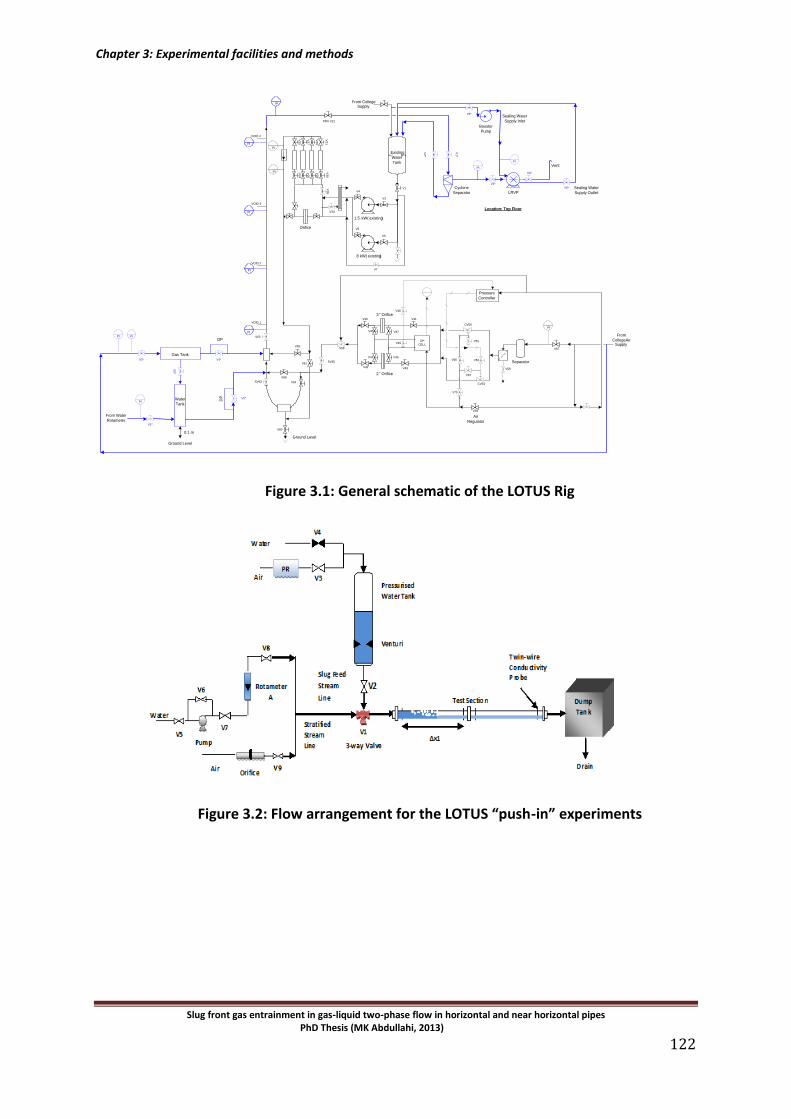
Chapter 3: Experimental facilities and methods
Slug front gas entrainment in gas-liquid two-phase flow in horizontal and near horizontal pipes PhD Thesis (MK Abdullahi, 2013)
122
1.5. kW ( existing)
8 kW ( existing)
From College Supply
PI
PI
DP
CELL
PI
3" Orifice
2" Orifice
Ground Level
From
CollegeAirSupply
E-13Existing
Water
Tank
PI
Location: Top Floor
V1
V3
V4
V5
V6
V34
V7
V3
5V
30
V3
1
V2
8V
29
V2
6V
27
V2
4V
25
V63
V54
V58
V59
V60
V61SV55
V56
V43
V47V45
V44
V42
V40
V46
PRV V21
V57
PI
CV50
V51
V52
V67
CV53
Air
Regulator
V41
V58
V49
V48
V70
V66
SV62
VOID 1
VOID 2
VOID 3
VOID 4
Pressure
Controller
V59
Vent
V3*
V4*
PI
Sealing Water
Supply Inlet
FI
Cyclone
Separator
Sealing Water
Supply Outlet
Booster
Pump
V1
*
V2
*
V5*
V6*
PI
PI
PI
Orifice
LRVP
From Water
Rotameter
Water
Tank
Gas Tank
DP
DP
FI
PI
PI
0.1 m
V1*
V2*
V3* V4*
V5*
Ground Level
Separator
Figure 3.1: General schematic of the LOTUS Rig
Figure 3.2: Flow arrangement for the LOTUS “push-in” experiments
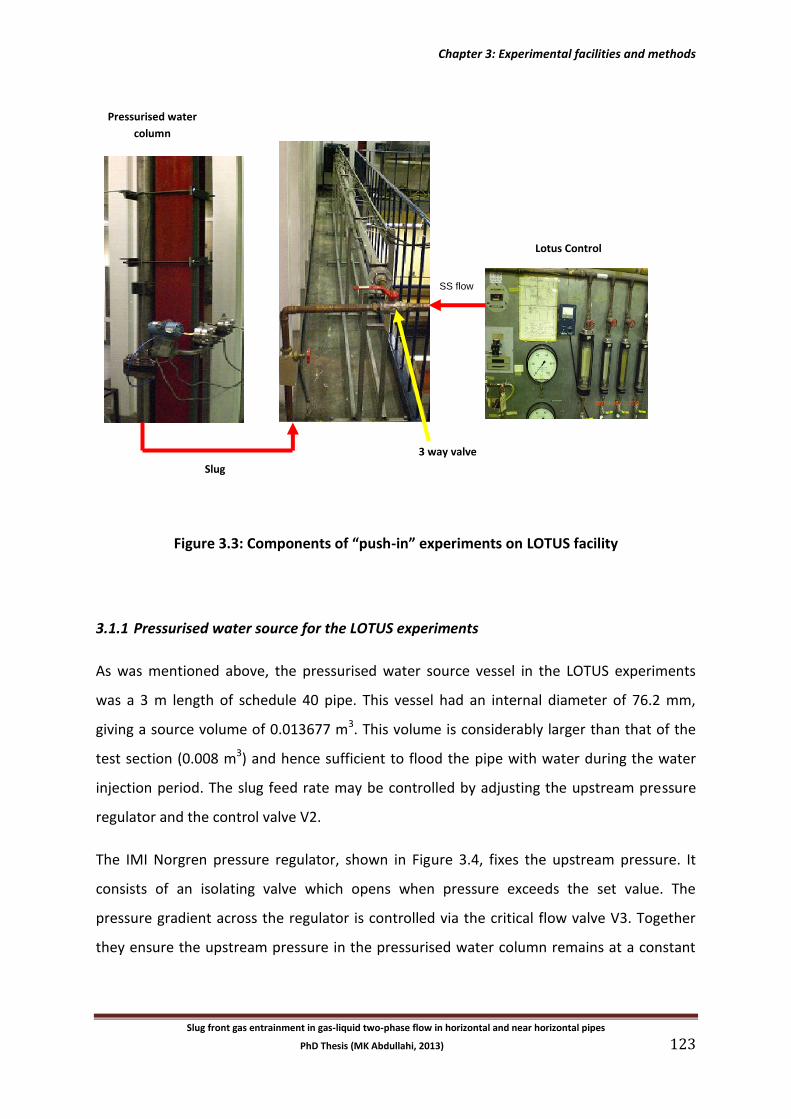
Chapter 3: Experimental facilities and methods
Slug front gas entrainment in gas-liquid two-phase flow in horizontal and near horizontal pipes
PhD Thesis (MK Abdullahi, 2013) 123
Figure 3.3: Components of “push-in” experiments on LOTUS facility
3.1.1 Pressurised water source for the LOTUS experiments
As was mentioned above, the pressurised water source vessel in the LOTUS experiments
was a 3 m length of schedule 40 pipe. This vessel had an internal diameter of 76.2 mm,
giving a source volume of 0.013677 m3. This volume is considerably larger than that of the
test section (0.008 m3) and hence sufficient to flood the pipe with water during the water
injection period. The slug feed rate may be controlled by adjusting the upstream pressure
regulator and the control valve V2.
The IMI Norgren pressure regulator, shown in Figure 3.4, fixes the upstream pressure. It
consists of an isolating valve which opens when pressure exceeds the set value. The
pressure gradient across the regulator is controlled via the critical flow valve V3. Together
they ensure the upstream pressure in the pressurised water column remains at a constant
Pressurised water
column
Lotus Control
SS flow
Slug
3 way valve
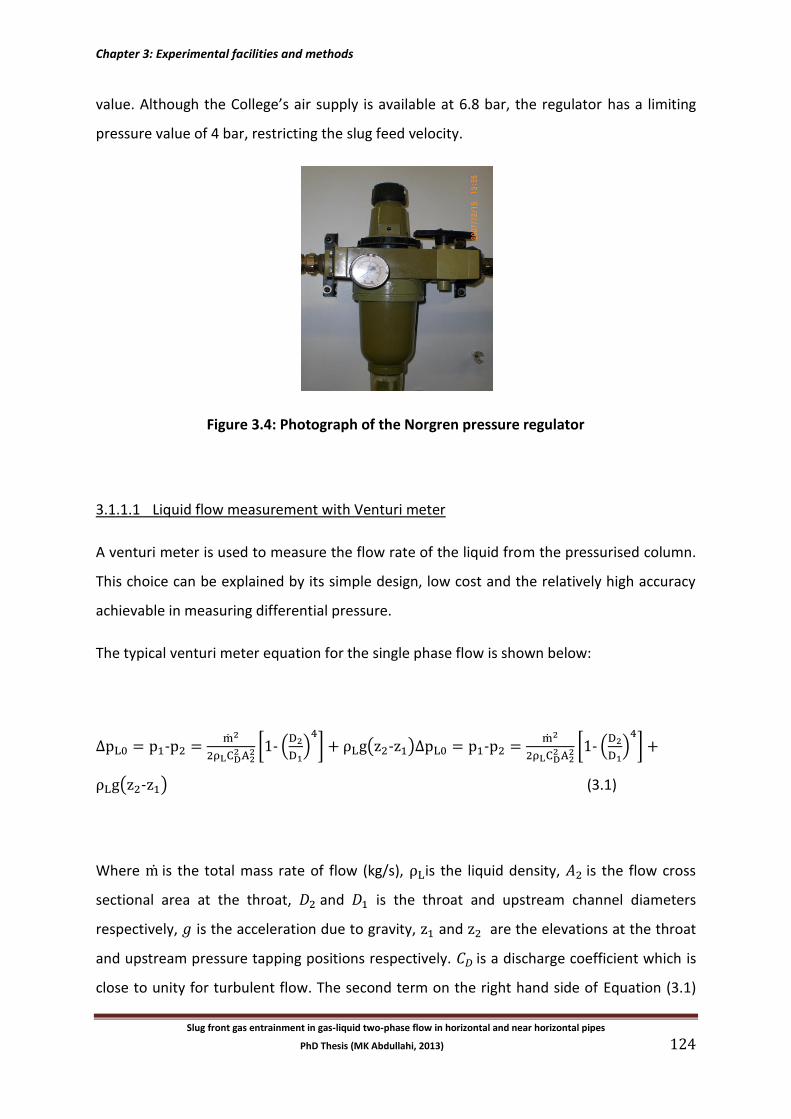
Chapter 3: Experimental facilities and methods
Slug front gas entrainment in gas-liquid two-phase flow in horizontal and near horizontal pipes
PhD Thesis (MK Abdullahi, 2013) 124
value. Although the College’s air supply is available at 6.8 bar, the regulator has a limiting
pressure value of 4 bar, restricting the slug feed velocity.
Figure 3.4: Photograph of the Norgren pressure regulator
3.1.1.1 Liquid flow measurement with Venturi meter
A venturi meter is used to measure the flow rate of the liquid from the pressurised column.
This choice can be explained by its simple design, low cost and the relatively high accuracy
achievable in measuring differential pressure.
The typical venturi meter equation for the single phase flow is shown below:
-
[ - (
)
] ( - ) -
[ - (
)
]
( - ) (3.1)
Where is the total mass rate of flow (kg/s), is the liquid density, is the flow cross
sectional area at the throat, and is the throat and upstream channel diameters
respectively, is the acceleration due to gravity, and are the elevations at the throat
and upstream pressure tapping positions respectively. is a discharge coefficient which is
close to unity for turbulent flow. The second term on the right hand side of Equation (3.1)
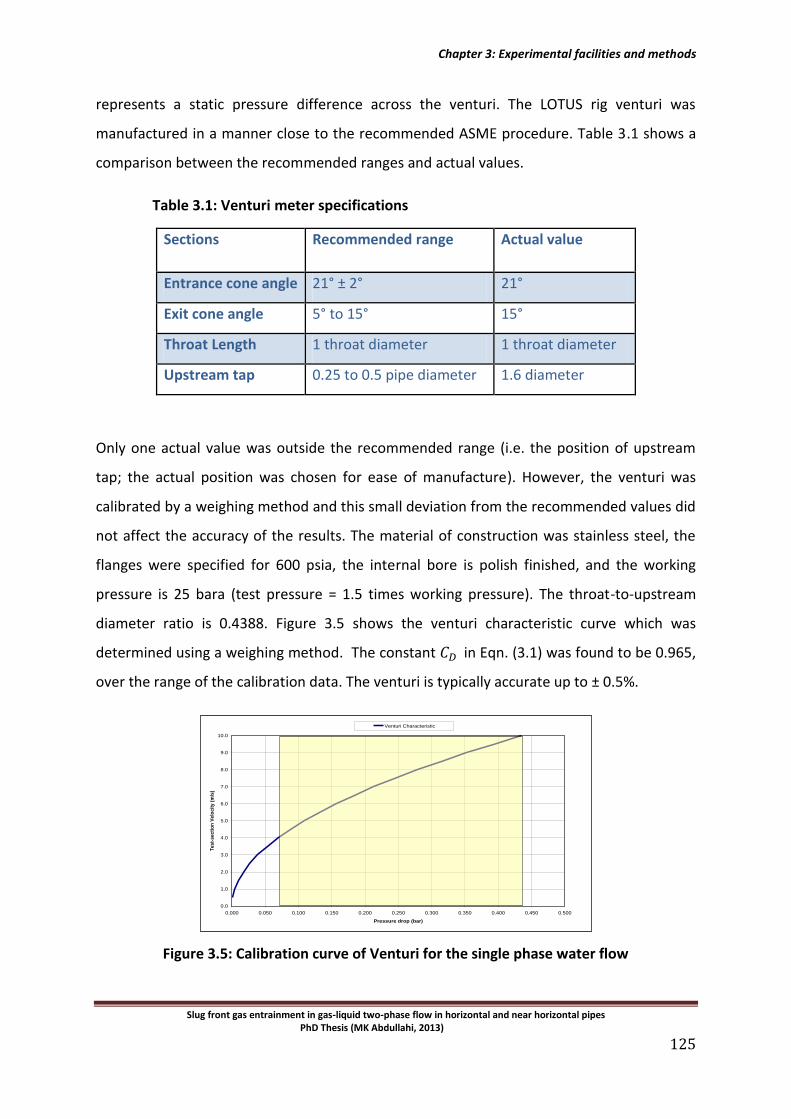
Chapter 3: Experimental facilities and methods
Slug front gas entrainment in gas-liquid two-phase flow in horizontal and near horizontal pipes PhD Thesis (MK Abdullahi, 2013)
125
represents a static pressure difference across the venturi. The LOTUS rig venturi was
manufactured in a manner close to the recommended ASME procedure. Table 3.1 shows a
comparison between the recommended ranges and actual values.
Table 3.1: Venturi meter specifications
Sections Recommended range Actual value
Entrance cone angle 21° ± 2° 21°
Exit cone angle 5° to 15° 15°
Throat Length 1 throat diameter 1 throat diameter
Upstream tap 0.25 to 0.5 pipe diameter 1.6 diameter
Only one actual value was outside the recommended range (i.e. the position of upstream
tap; the actual position was chosen for ease of manufacture). However, the venturi was
calibrated by a weighing method and this small deviation from the recommended values did
not affect the accuracy of the results. The material of construction was stainless steel, the
flanges were specified for 600 psia, the internal bore is polish finished, and the working
pressure is 25 bara (test pressure = 1.5 times working pressure). The throat-to-upstream
diameter ratio is 0.4388. Figure 3.5 shows the venturi characteristic curve which was
determined using a weighing method. The constant in Eqn. (3.1) was found to be 0.965,
over the range of the calibration data. The venturi is typically accurate up to ± 0.5%.
Figure 3.5: Calibration curve of Venturi for the single phase water flow
0.0
1.0
2.0
3.0
4.0
5.0
6.0
7.0
8.0
9.0
10.0
0.000 0.050 0.100 0.150 0.200 0.250 0.300 0.350 0.400 0.450 0.500
Pressure drop (bar)
Test-
secti
on
Velo
cit
y (
m/s
)
Venturi Characteristic
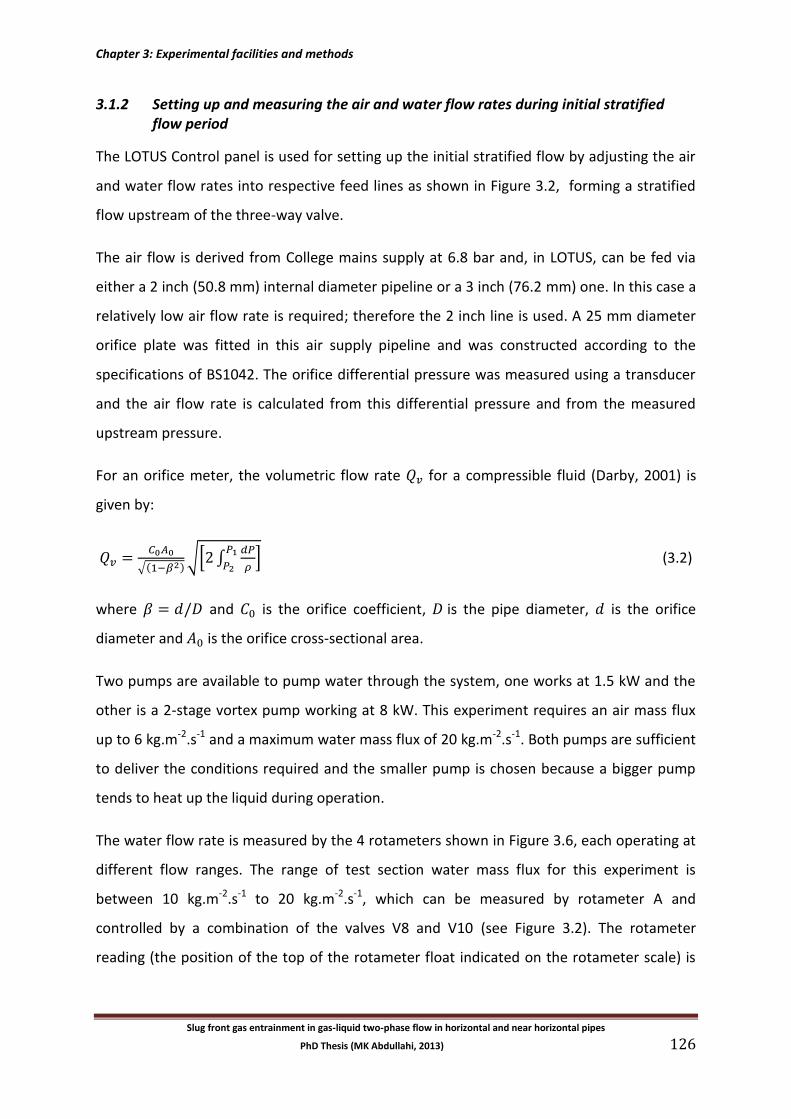
Chapter 3: Experimental facilities and methods
Slug front gas entrainment in gas-liquid two-phase flow in horizontal and near horizontal pipes
PhD Thesis (MK Abdullahi, 2013) 126
3.1.2 Setting up and measuring the air and water flow rates during initial stratified flow period
The LOTUS Control panel is used for setting up the initial stratified flow by adjusting the air
and water flow rates into respective feed lines as shown in Figure 3.2, forming a stratified
flow upstream of the three-way valve.
The air flow is derived from College mains supply at 6.8 bar and, in LOTUS, can be fed via
either a 2 inch (50.8 mm) internal diameter pipeline or a 3 inch (76.2 mm) one. In this case a
relatively low air flow rate is required; therefore the 2 inch line is used. A 25 mm diameter
orifice plate was fitted in this air supply pipeline and was constructed according to the
specifications of BS1042. The orifice differential pressure was measured using a transducer
and the air flow rate is calculated from this differential pressure and from the measured
upstream pressure.
For an orifice meter, the volumetric flow rate for a compressible fluid (Darby, 2001) is
given by:
√( )√[ ∫
] (3.2)
where and is the orifice coefficient, is the pipe diameter, is the orifice
diameter and is the orifice cross-sectional area.
Two pumps are available to pump water through the system, one works at 1.5 kW and the
other is a 2-stage vortex pump working at 8 kW. This experiment requires an air mass flux
up to 6 kg.m-2.s-1 and a maximum water mass flux of 20 kg.m-2.s-1. Both pumps are sufficient
to deliver the conditions required and the smaller pump is chosen because a bigger pump
tends to heat up the liquid during operation.
The water flow rate is measured by the 4 rotameters shown in Figure 3.6, each operating at
different flow ranges. The range of test section water mass flux for this experiment is
between 10 kg.m-2.s-1 to 20 kg.m-2.s-1, which can be measured by rotameter A and
controlled by a combination of the valves V8 and V10 (see Figure 3.2). The rotameter
reading (the position of the top of the rotameter float indicated on the rotameter scale) is
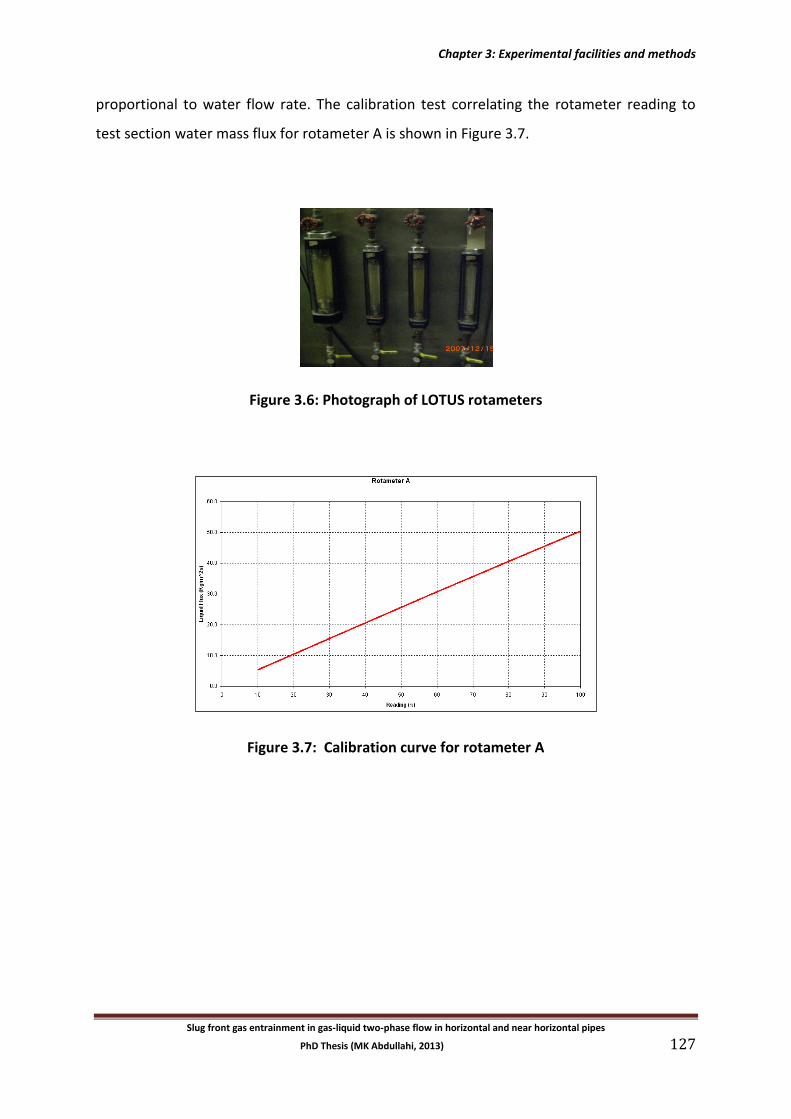
Chapter 3: Experimental facilities and methods
Slug front gas entrainment in gas-liquid two-phase flow in horizontal and near horizontal pipes
PhD Thesis (MK Abdullahi, 2013) 127
proportional to water flow rate. The calibration test correlating the rotameter reading to
test section water mass flux for rotameter A is shown in Figure 3.7.
Figure 3.6: Photograph of LOTUS rotameters
Figure 3.7: Calibration curve for rotameter A
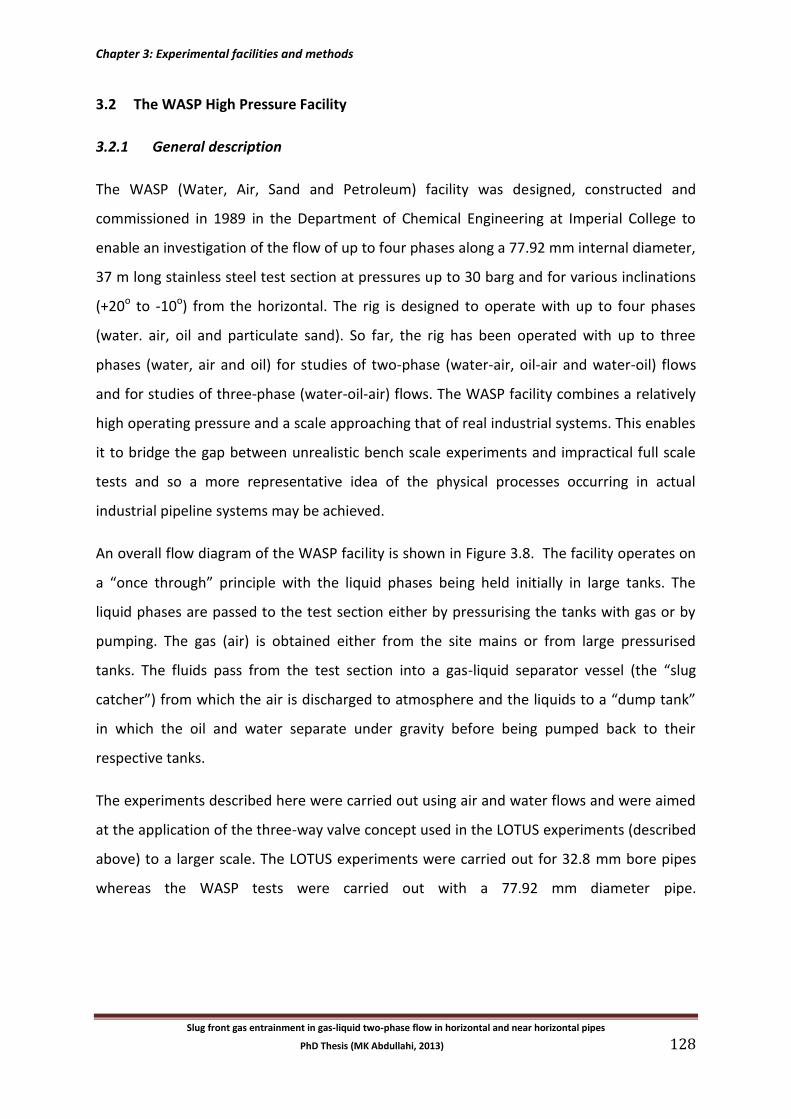
Chapter 3: Experimental facilities and methods
Slug front gas entrainment in gas-liquid two-phase flow in horizontal and near horizontal pipes
PhD Thesis (MK Abdullahi, 2013) 128
3.2 The WASP High Pressure Facility
3.2.1 General description
The WASP (Water, Air, Sand and Petroleum) facility was designed, constructed and
commissioned in 1989 in the Department of Chemical Engineering at Imperial College to
enable an investigation of the flow of up to four phases along a 77.92 mm internal diameter,
37 m long stainless steel test section at pressures up to 30 barg and for various inclinations
(+20o to -10o) from the horizontal. The rig is designed to operate with up to four phases
(water. air, oil and particulate sand). So far, the rig has been operated with up to three
phases (water, air and oil) for studies of two-phase (water-air, oil-air and water-oil) flows
and for studies of three-phase (water-oil-air) flows. The WASP facility combines a relatively
high operating pressure and a scale approaching that of real industrial systems. This enables
it to bridge the gap between unrealistic bench scale experiments and impractical full scale
tests and so a more representative idea of the physical processes occurring in actual
industrial pipeline systems may be achieved.
An overall flow diagram of the WASP facility is shown in Figure 3.8. The facility operates on
a “once through” principle with the liquid phases being held initially in large tanks. The
liquid phases are passed to the test section either by pressurising the tanks with gas or by
pumping. The gas (air) is obtained either from the site mains or from large pressurised
tanks. The fluids pass from the test section into a gas-liquid separator vessel (the “slug
catcher”) from which the air is discharged to atmosphere and the liquids to a “dump tank”
in which the oil and water separate under gravity before being pumped back to their
respective tanks.
The experiments described here were carried out using air and water flows and were aimed
at the application of the three-way valve concept used in the LOTUS experiments (described
above) to a larger scale. The LOTUS experiments were carried out for 32.8 mm bore pipes
whereas the WASP tests were carried out with a 77.92 mm diameter pipe.
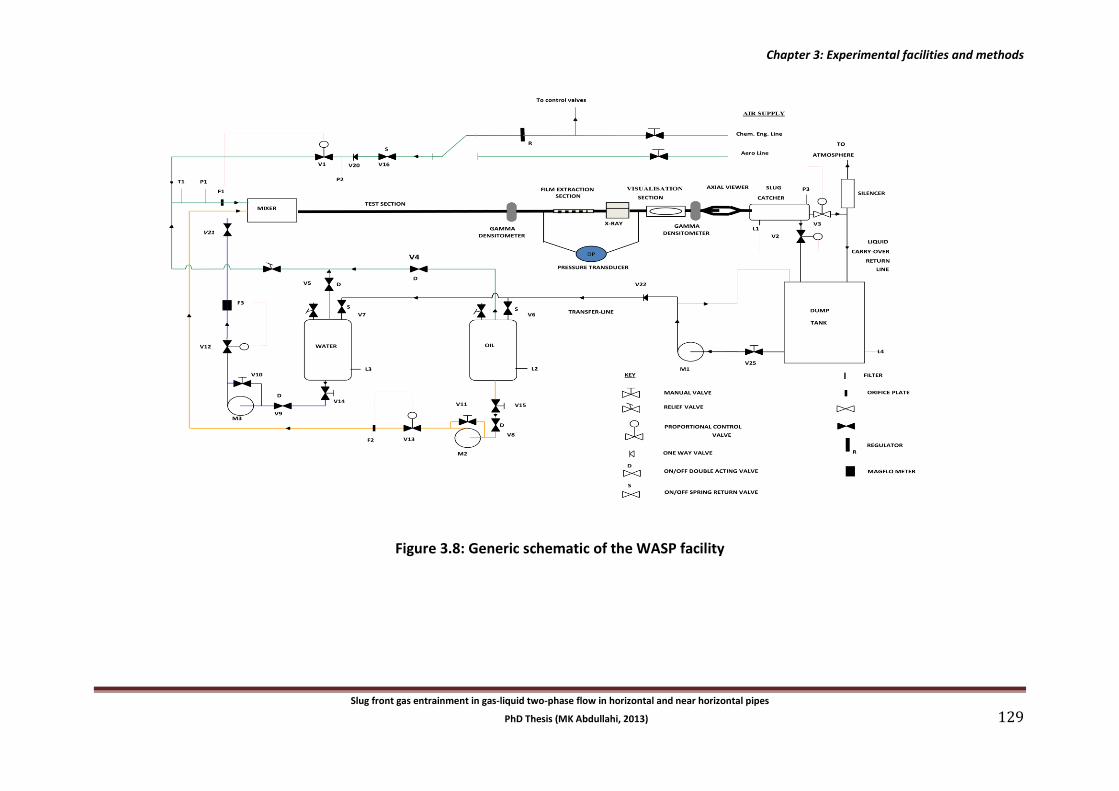
Chapter 3: Experimental facilities and methods
Slug front gas entrainment in gas-liquid two-phase flow in horizontal and near horizontal pipes
PhD Thesis (MK Abdullahi, 2013) 129
Figure 3.8: Generic schematic of the WASP facility
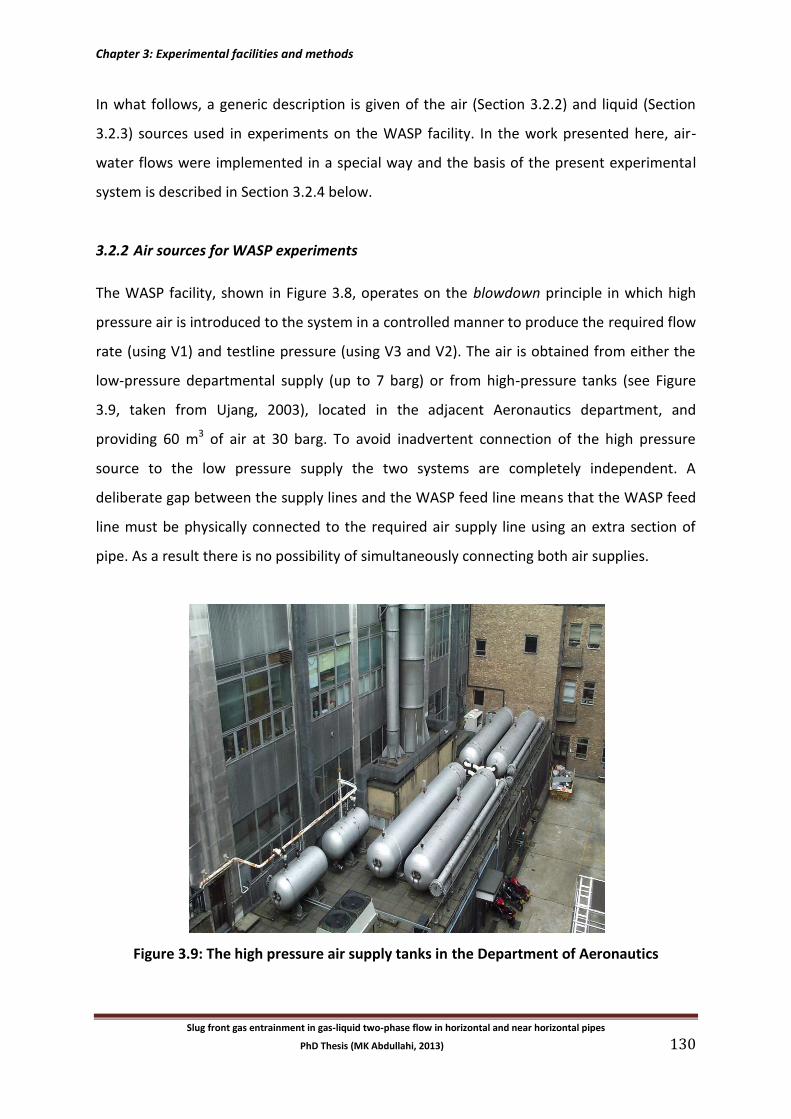
Chapter 3: Experimental facilities and methods
Slug front gas entrainment in gas-liquid two-phase flow in horizontal and near horizontal pipes
PhD Thesis (MK Abdullahi, 2013) 130
In what follows, a generic description is given of the air (Section 3.2.2) and liquid (Section
3.2.3) sources used in experiments on the WASP facility. In the work presented here, air-
water flows were implemented in a special way and the basis of the present experimental
system is described in Section 3.2.4 below.
3.2.2 Air sources for WASP experiments
The WASP facility, shown in Figure 3.8, operates on the blowdown principle in which high
pressure air is introduced to the system in a controlled manner to produce the required flow
rate (using V1) and testline pressure (using V3 and V2). The air is obtained from either the
low-pressure departmental supply (up to 7 barg) or from high-pressure tanks (see Figure
3.9, taken from Ujang, 2003), located in the adjacent Aeronautics department, and
providing 60 m3 of air at 30 barg. To avoid inadvertent connection of the high pressure
source to the low pressure supply the two systems are completely independent. A
deliberate gap between the supply lines and the WASP feed line means that the WASP feed
line must be physically connected to the required air supply line using an extra section of
pipe. As a result there is no possibility of simultaneously connecting both air supplies.
Figure 3.9: The high pressure air supply tanks in the Department of Aeronautics
Chapter 3: Experimental facilities and methods
Slug front gas entrainment in gas-liquid two-phase flow in horizontal and near horizontal pipes
PhD Thesis (MK Abdullahi, 2013) 131
After this connection, the air feeds into a tee-piece via several non-return valves (V201, V20)
and control valves (V16, V1). One branch of this tee connects, through isolation valves (V4
or V5 respectively), to the top of the oil and water storage vessels, enabling the tanks to be
pressurised so that the liquid phases can be introduced into the test section without pumps.
Alternatively, pressurising the tanks can be used to assist the pumps by providing an
additional driving force for the liquid supply. The other branch of the tee feeds into the
mixer section, via a corner tapping orifice plate flow meter (F1) built to BS1042: 1991, and
provides the air flow through the testline.
3.2.3 Liquid sources for WASP experiments
The WASP facility is designed to provide oil or water (or both) to the test section, though in
the present work, a special inlet arrangement was used with only the water flow (see
Section 3.2.4). In the normal arrangement (not used in the present experiments), if oil is
used then this is supplied from a 5 m3 storage vessel (Figure 3.10, Ujang, 2003). From the
base of this tank it drains by natural head, or pressure assisted driving force, through
isolation valves (V15 and V8) and into a pump (M2). Most of the oil is then pumped, via a
flow control valve (V13) and a corner tapping orifice plate flow meter (F2) built to
BS1042:1991, into the mixer section at the entrance to the test section. . However, a small
proportion may be allowed to flow through the manual control valve (V11) and around a
short pump recycle loop. This recycle loop is intended to enable stable low liquid flow rates
to be obtained. For extremely low flow rates the tank is pre-pressurised and the liquid
blown through the system without the use of the pump.
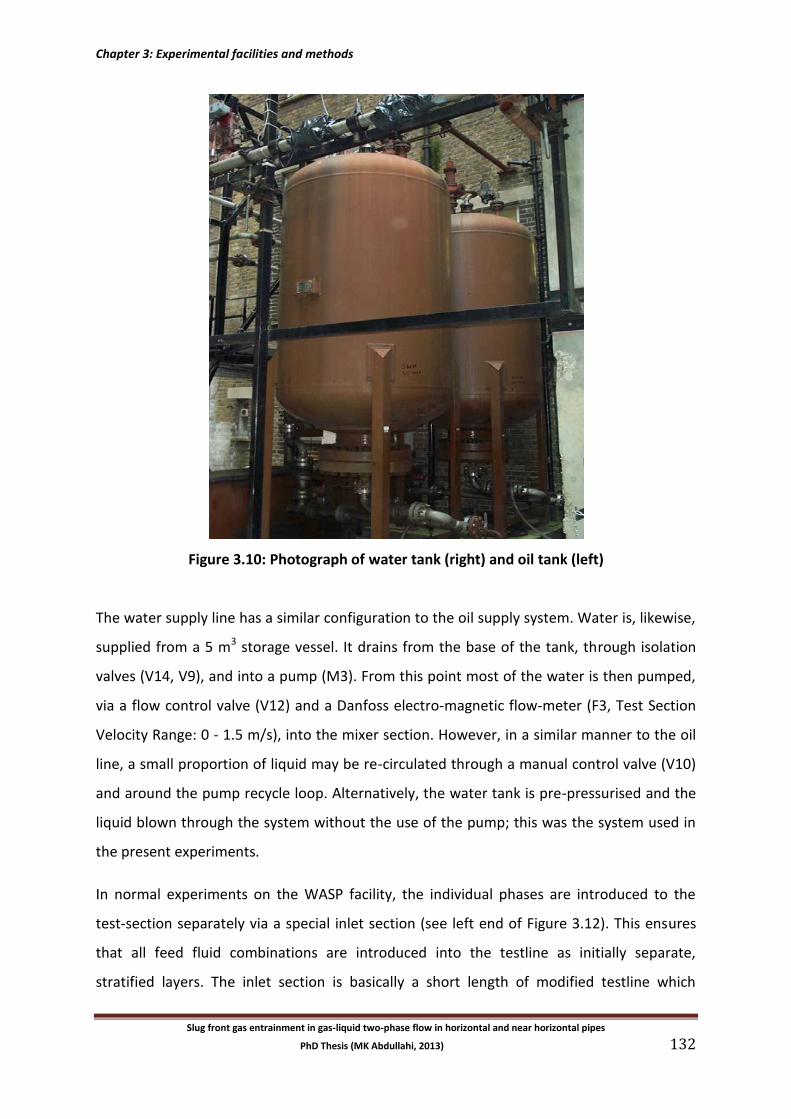
Chapter 3: Experimental facilities and methods
Slug front gas entrainment in gas-liquid two-phase flow in horizontal and near horizontal pipes
PhD Thesis (MK Abdullahi, 2013) 132
Figure 3.10: Photograph of water tank (right) and oil tank (left)
The water supply line has a similar configuration to the oil supply system. Water is, likewise,
supplied from a 5 m3 storage vessel. It drains from the base of the tank, through isolation
valves (V14, V9), and into a pump (M3). From this point most of the water is then pumped,
via a flow control valve (V12) and a Danfoss electro-magnetic flow-meter (F3, Test Section
Velocity Range: 0 - 1.5 m/s), into the mixer section. However, in a similar manner to the oil
line, a small proportion of liquid may be re-circulated through a manual control valve (V10)
and around the pump recycle loop. Alternatively, the water tank is pre-pressurised and the
liquid blown through the system without the use of the pump; this was the system used in
the present experiments.
In normal experiments on the WASP facility, the individual phases are introduced to the
test-section separately via a special inlet section (see left end of Figure 3.12). This ensures
that all feed fluid combinations are introduced into the testline as initially separate,
stratified layers. The inlet section is basically a short length of modified testline which
Chapter 3: Experimental facilities and methods
Slug front gas entrainment in gas-liquid two-phase flow in horizontal and near horizontal pipes
PhD Thesis (MK Abdullahi, 2013) 133
connects smoothly into the main test section and contains a specially designed stratification
piece. The three-phase inlet section is fed separately via three individual inlets by the air, oil
and water supplies. To enhance the initial stratification of the feed, these inlets are
arranged so that each phase is introduced at a point governed by its relative density. Hence,
air is fed perpendicularly into the top of the mixer, oil axially into the middle and water
perpendicularly into the bottom. For the two-phase gas-liquid case, a simpler inlet design
may be used in which the liquid is introduced below a stratification plate at the bottom of
the testline and the gas is introduced above it. This arrangement was used in setting up the
initial stratified air-water flows in the current experiments.
The main test section of WASP enables investigation of the co-current flow of air, oil and
water in a horizontal or inclined pipeline. It is principally a 77.92 mm internal (nominal 3")
diameter stainless steel pipe, which has measuring instruments fitted along its entire 37 m
length. Three principal types of information are provided by these instruments: line
pressure, liquid hold-up and interfacial velocity. Pressure measurement may be achieved via
several tappings, which are situated at various locations along the testline. Instantaneous
hold-up measurements can be obtained using a dual-beam gamma densitometer or, for the
case of air-water flow only, using one of several sets of conductivity probes. For air-water
flow, interfacial velocities may be obtained in addition to hold-up data if two, or more, pairs
of conductivity probes are used simultaneously. Once this information has been collected it
may be supplemented by observations and video footage obtained through a specially
constructed visualisation section. This section is a 0.8 m length of polycarbonate tube, of 31
mm wall thickness, mounted in a steel containment jacket with visualisation windows; the
visualisation section has been hydraulically tested to a pressure of 60 bar g.
3.2.4 Modification of WASP test section for 3-way valve gas entrainment experiments
For the experiments on WASP in the present work, the circuit was modified as shown in
Figure 3.11. The water tank was partially filled with water and pressurised using the
connection to the site mains. The experiment was started by setting up a stratified flow in
the test section by feeding air and water streams to the injector (see above) at the entrance
to the test section. The air feed was derived from the main high pressure tanks (see Figure
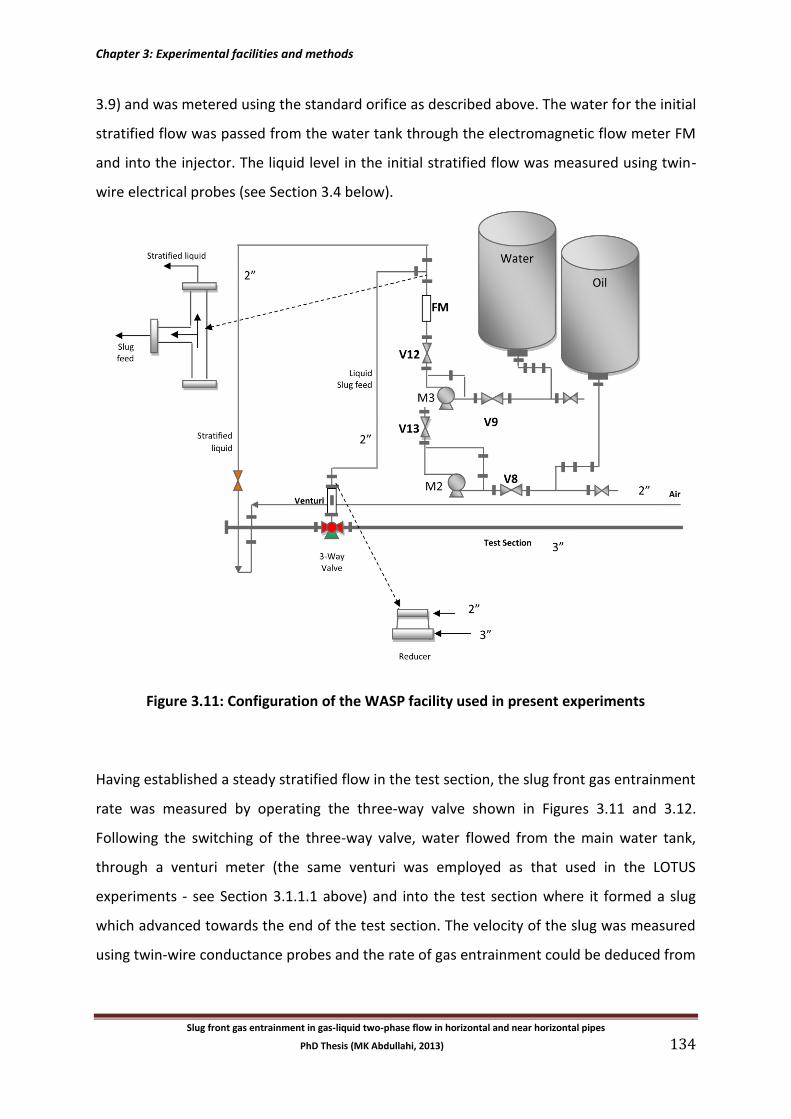
Chapter 3: Experimental facilities and methods
Slug front gas entrainment in gas-liquid two-phase flow in horizontal and near horizontal pipes
PhD Thesis (MK Abdullahi, 2013) 134
3.9) and was metered using the standard orifice as described above. The water for the initial
stratified flow was passed from the water tank through the electromagnetic flow meter FM
and into the injector. The liquid level in the initial stratified flow was measured using twin-
wire electrical probes (see Section 3.4 below).
Figure 3.11: Configuration of the WASP facility used in present experiments
Having established a steady stratified flow in the test section, the slug front gas entrainment
rate was measured by operating the three-way valve shown in Figures 3.11 and 3.12.
Following the switching of the three-way valve, water flowed from the main water tank,
through a venturi meter (the same venturi was employed as that used in the LOTUS
experiments - see Section 3.1.1.1 above) and into the test section where it formed a slug
which advanced towards the end of the test section. The velocity of the slug was measured
using twin-wire conductance probes and the rate of gas entrainment could be deduced from
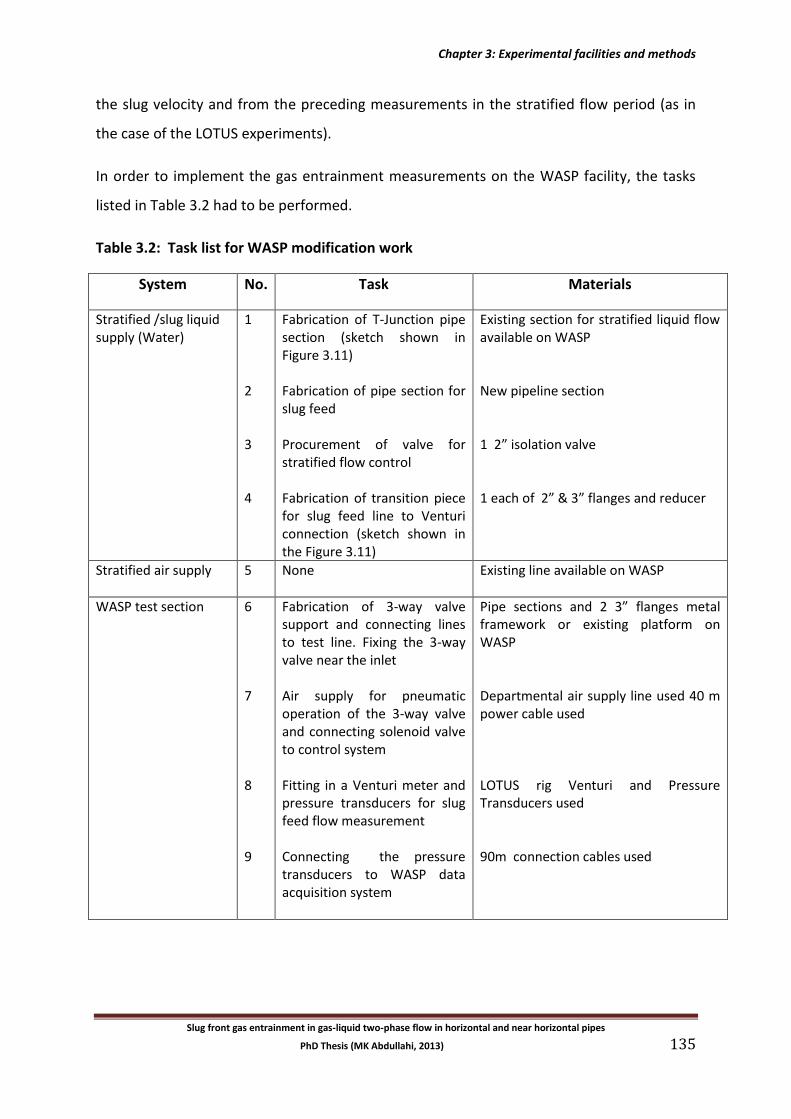
Chapter 3: Experimental facilities and methods
Slug front gas entrainment in gas-liquid two-phase flow in horizontal and near horizontal pipes
PhD Thesis (MK Abdullahi, 2013) 135
the slug velocity and from the preceding measurements in the stratified flow period (as in
the case of the LOTUS experiments).
In order to implement the gas entrainment measurements on the WASP facility, the tasks
listed in Table 3.2 had to be performed.
Table 3.2: Task list for WASP modification work
System No. Task Materials
Stratified /slug liquid supply (Water)
1 2 3 4
Fabrication of T-Junction pipe section (sketch shown in Figure 3.11) Fabrication of pipe section for slug feed Procurement of valve for stratified flow control Fabrication of transition piece for slug feed line to Venturi connection (sketch shown in the Figure 3.11)
Existing section for stratified liquid flow available on WASP New pipeline section 1 2” isolation valve 1 each of 2” & 3” flanges and reducer
Stratified air supply 5 None Existing line available on WASP
WASP test section 6 7 8 9
Fabrication of 3-way valve support and connecting lines to test line. Fixing the 3-way valve near the inlet Air supply for pneumatic operation of the 3-way valve and connecting solenoid valve to control system Fitting in a Venturi meter and pressure transducers for slug feed flow measurement Connecting the pressure transducers to WASP data acquisition system
Pipe sections and 2 3” flanges metal framework or existing platform on WASP Departmental air supply line used 40 m power cable used LOTUS rig Venturi and Pressure Transducers used 90m connection cables used
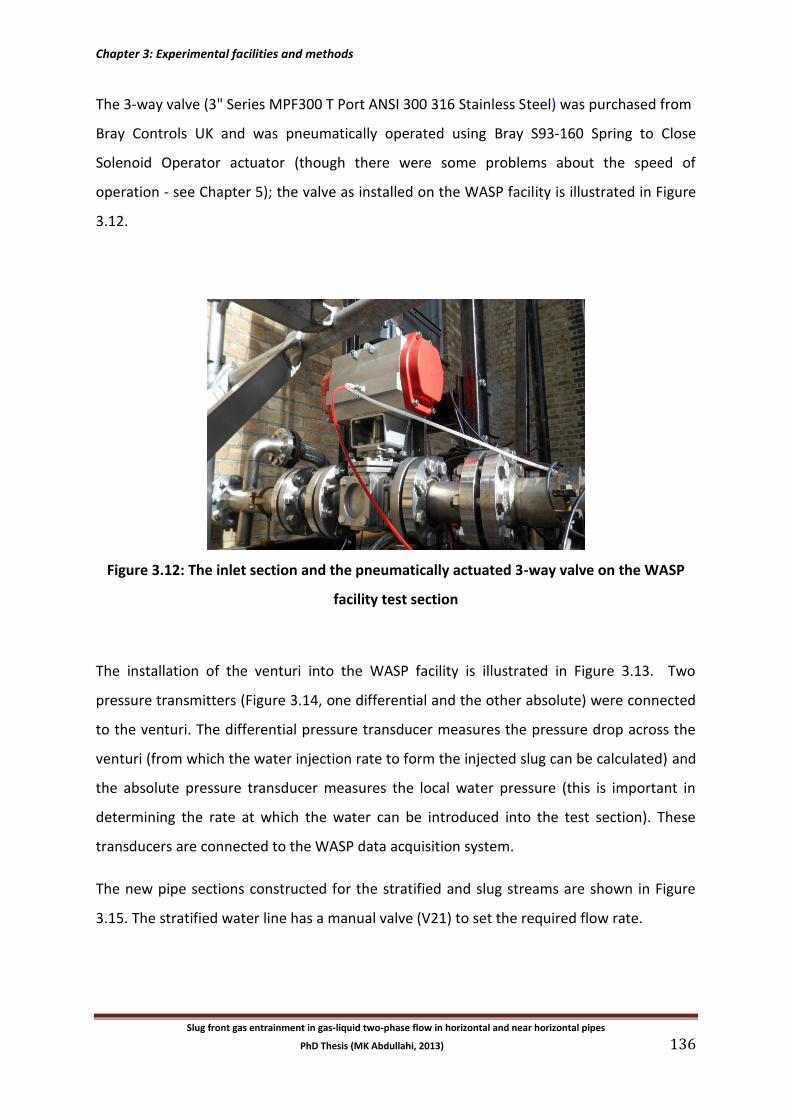
Chapter 3: Experimental facilities and methods
Slug front gas entrainment in gas-liquid two-phase flow in horizontal and near horizontal pipes
PhD Thesis (MK Abdullahi, 2013) 136
The 3-way valve (3" Series MPF300 T Port ANSI 300 316 Stainless Steel) was purchased from
Bray Controls UK and was pneumatically operated using Bray S93-160 Spring to Close
Solenoid Operator actuator (though there were some problems about the speed of
operation - see Chapter 5); the valve as installed on the WASP facility is illustrated in Figure
3.12.
Figure 3.12: The inlet section and the pneumatically actuated 3-way valve on the WASP
facility test section
The installation of the venturi into the WASP facility is illustrated in Figure 3.13. Two
pressure transmitters (Figure 3.14, one differential and the other absolute) were connected
to the venturi. The differential pressure transducer measures the pressure drop across the
venturi (from which the water injection rate to form the injected slug can be calculated) and
the absolute pressure transducer measures the local water pressure (this is important in
determining the rate at which the water can be introduced into the test section). These
transducers are connected to the WASP data acquisition system.
The new pipe sections constructed for the stratified and slug streams are shown in Figure
3.15. The stratified water line has a manual valve (V21) to set the required flow rate.
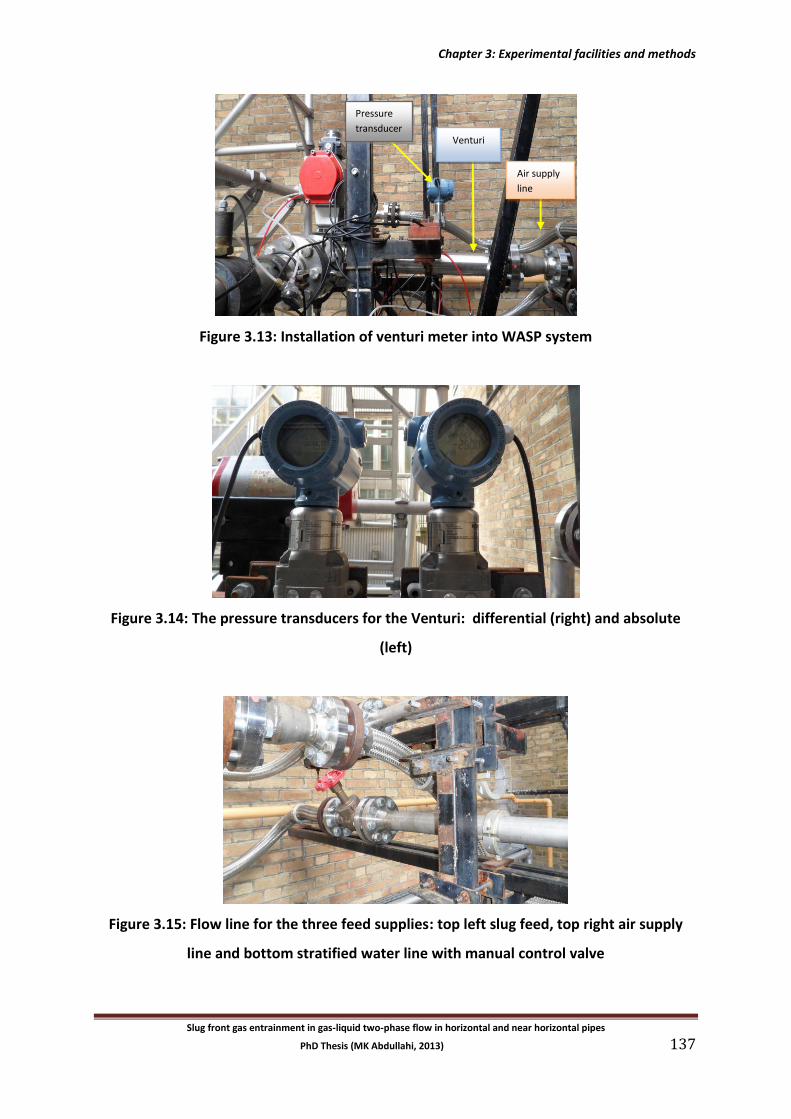
Chapter 3: Experimental facilities and methods
Slug front gas entrainment in gas-liquid two-phase flow in horizontal and near horizontal pipes
PhD Thesis (MK Abdullahi, 2013) 137
Figure 3.13: Installation of venturi meter into WASP system
Figure 3.14: The pressure transducers for the Venturi: differential (right) and absolute
(left)
Figure 3.15: Flow line for the three feed supplies: top left slug feed, top right air supply
line and bottom stratified water line with manual control valve
Venturi
Pressure
transducer
Air supply
line
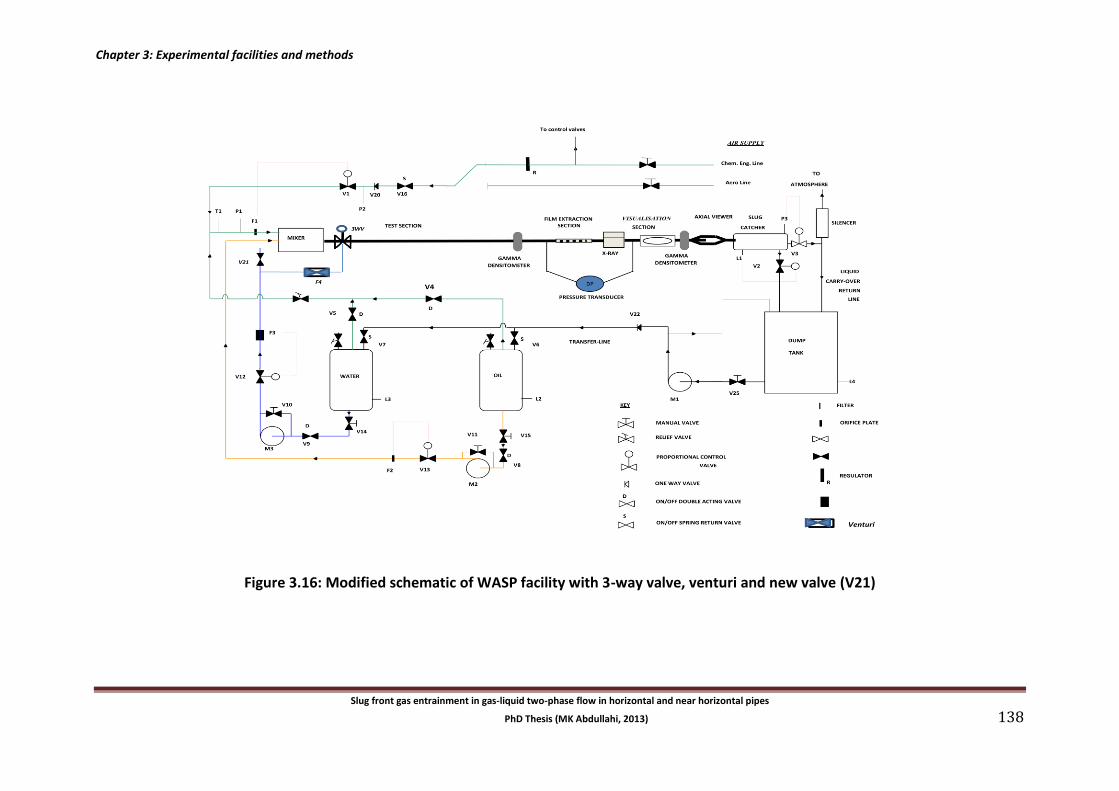
Chapter 3: Experimental facilities and methods
Slug front gas entrainment in gas-liquid two-phase flow in horizontal and near horizontal pipes
PhD Thesis (MK Abdullahi, 2013) 138
Figure 3.16: Modified schematic of WASP facility with 3-way valve, venturi and new valve (V21)
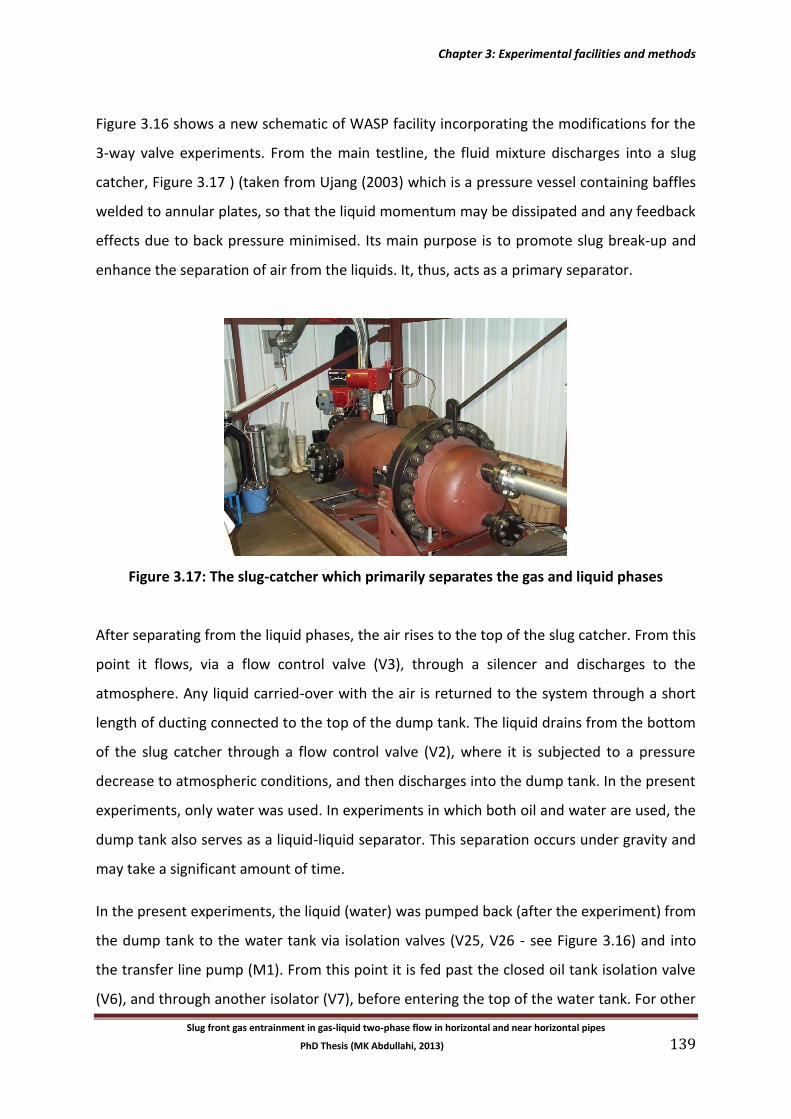
Chapter 3: Experimental facilities and methods
Slug front gas entrainment in gas-liquid two-phase flow in horizontal and near horizontal pipes
PhD Thesis (MK Abdullahi, 2013) 139
Figure 3.16 shows a new schematic of WASP facility incorporating the modifications for the
3-way valve experiments. From the main testline, the fluid mixture discharges into a slug
catcher, Figure 3.17 ) (taken from Ujang (2003) which is a pressure vessel containing baffles
welded to annular plates, so that the liquid momentum may be dissipated and any feedback
effects due to back pressure minimised. Its main purpose is to promote slug break-up and
enhance the separation of air from the liquids. It, thus, acts as a primary separator.
Figure 3.17: The slug-catcher which primarily separates the gas and liquid phases
After separating from the liquid phases, the air rises to the top of the slug catcher. From this
point it flows, via a flow control valve (V3), through a silencer and discharges to the
atmosphere. Any liquid carried-over with the air is returned to the system through a short
length of ducting connected to the top of the dump tank. The liquid drains from the bottom
of the slug catcher through a flow control valve (V2), where it is subjected to a pressure
decrease to atmospheric conditions, and then discharges into the dump tank. In the present
experiments, only water was used. In experiments in which both oil and water are used, the
dump tank also serves as a liquid-liquid separator. This separation occurs under gravity and
may take a significant amount of time.
In the present experiments, the liquid (water) was pumped back (after the experiment) from
the dump tank to the water tank via isolation valves (V25, V26 - see Figure 3.16) and into
the transfer line pump (M1). From this point it is fed past the closed oil tank isolation valve
(V6), and through another isolator (V7), before entering the top of the water tank. For other
Chapter 3: Experimental facilities and methods
Slug front gas entrainment in gas-liquid two-phase flow in horizontal and near horizontal pipes
PhD Thesis (MK Abdullahi, 2013) 140
(i.e. not the present) experiments in which oil is also used, pumping of oil from the dump
tank to the oil tank takes place after the water from the dump tank has been discharged,
with valve V6 open and valve V7 closed. Once the water storage vessel was filled to the
required level the transfer line is isolated and the water may be reused in the experiments.
3.3 The Low Pressure (LOWPRESS) Facility
As was mentioned above, after the completion of the LOTUS “push-in” experiments” the
LOTUS facility was dismantled and the low pressure two-phase flow studies were
transferred to another facility (LOWPRESS) which was located in Room 111 in the
Department of Chemical Engineering. Two test sections were available on the LOWPRESS
facility, namely one 9 m long and 74 mm in diameter and the other 8 m long and 32.8 mm in
diameter. Only the 32.8 mm test section was used in the new “bubble” experiments
described in Chapter 6 and the slug flow visualisations described in Chapter 7.
The testline consists of several pipe sections joined together using tongue and groove
flanges. These are machined to the exact internal diameter of the pipe to ensure geometric
continuity so that disturbances to the flow are minimised. The sections of pipe are
supported by ring supports attached to a steel framework, which is inclinable. Along the
testline, conductivity probes are fitted at various locations (5.74 m,6.52 m, 6.72, 7.5 m
downstream from the inlet) and a 0 - 10 bar g absolute pressure transducer is mounted to
the pipe wall to measure the testline pressure at a position 5.7 m downstream from the
inlet.
A sketch of the LOWPRESS facility is shown in Figure 3.18 and a photograph of part of the rig
is shown in Figure 3.19.
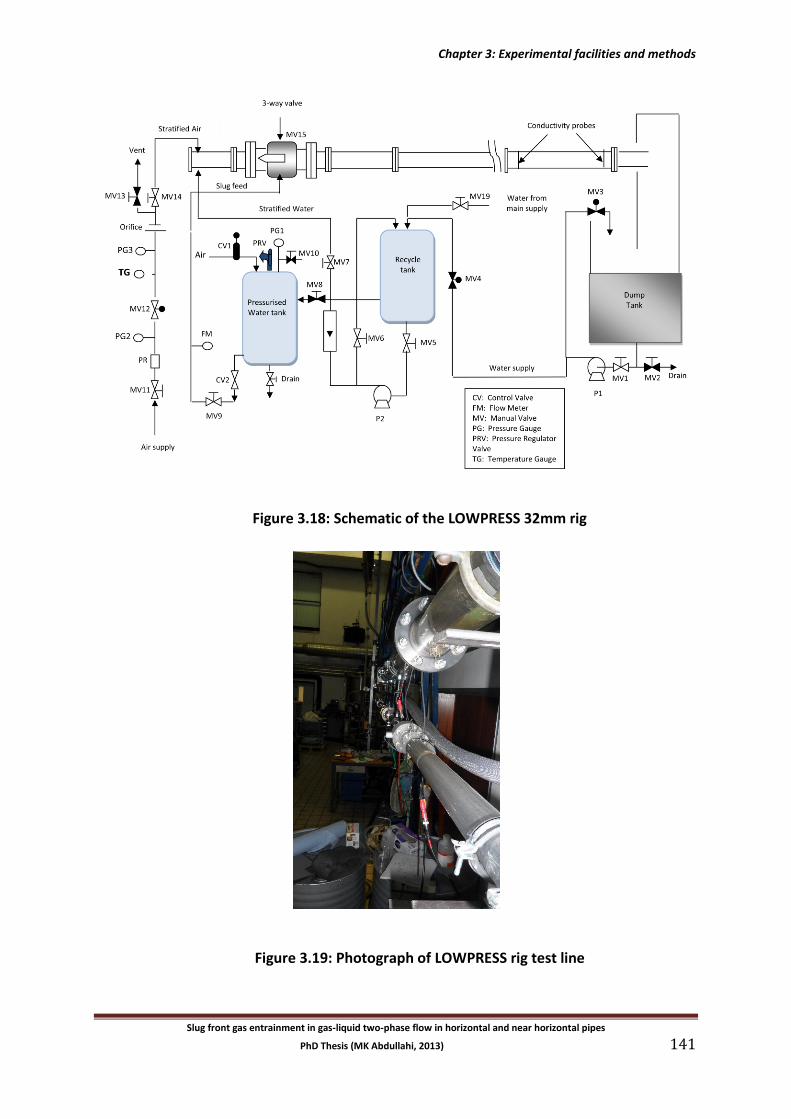
Chapter 3: Experimental facilities and methods
Slug front gas entrainment in gas-liquid two-phase flow in horizontal and near horizontal pipes
PhD Thesis (MK Abdullahi, 2013) 141
Figure 3.18: Schematic of the LOWPRESS 32mm rig
Figure 3.19: Photograph of LOWPRESS rig test line
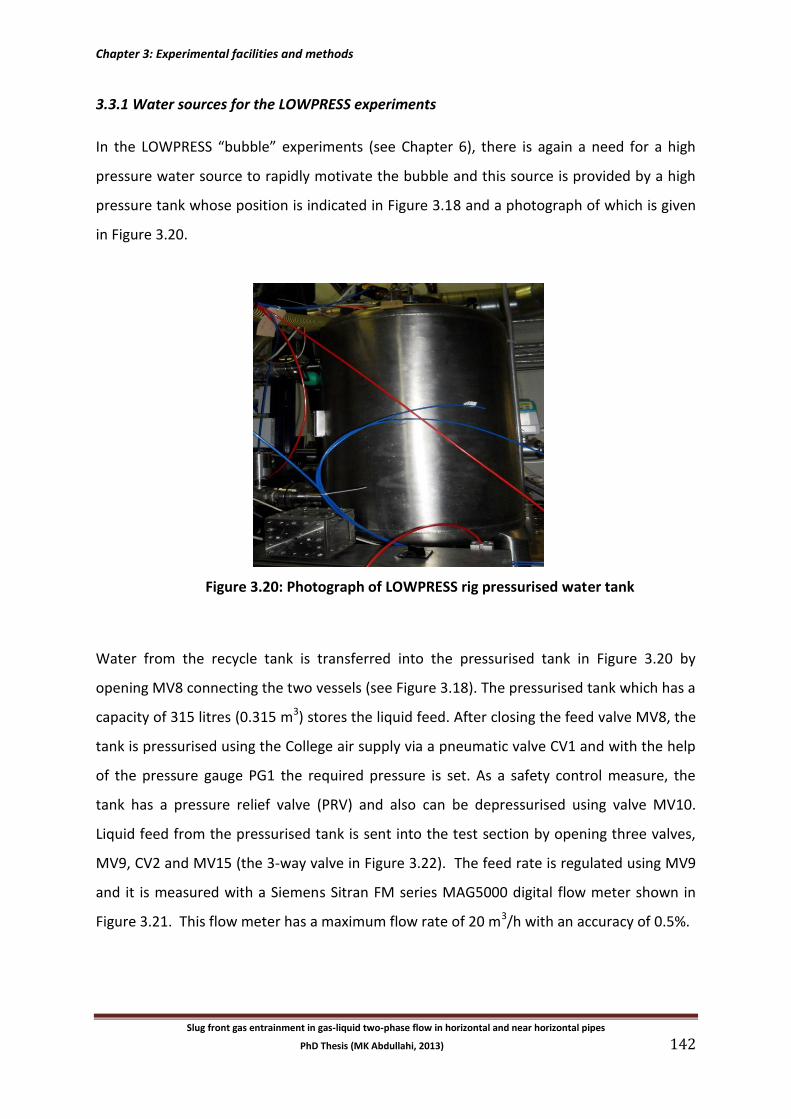
Chapter 3: Experimental facilities and methods
Slug front gas entrainment in gas-liquid two-phase flow in horizontal and near horizontal pipes
PhD Thesis (MK Abdullahi, 2013) 142
3.3.1 Water sources for the LOWPRESS experiments
In the LOWPRESS “bubble” experiments (see Chapter 6), there is again a need for a high
pressure water source to rapidly motivate the bubble and this source is provided by a high
pressure tank whose position is indicated in Figure 3.18 and a photograph of which is given
in Figure 3.20.
Figure 3.20: Photograph of LOWPRESS rig pressurised water tank
Water from the recycle tank is transferred into the pressurised tank in Figure 3.20 by
opening MV8 connecting the two vessels (see Figure 3.18). The pressurised tank which has a
capacity of 315 litres (0.315 m3) stores the liquid feed. After closing the feed valve MV8, the
tank is pressurised using the College air supply via a pneumatic valve CV1 and with the help
of the pressure gauge PG1 the required pressure is set. As a safety control measure, the
tank has a pressure relief valve (PRV) and also can be depressurised using valve MV10.
Liquid feed from the pressurised tank is sent into the test section by opening three valves,
MV9, CV2 and MV15 (the 3-way valve in Figure 3.22). The feed rate is regulated using MV9
and it is measured with a Siemens Sitran FM series MAG5000 digital flow meter shown in
Figure 3.21. This flow meter has a maximum flow rate of 20 m3/h with an accuracy of 0.5%.
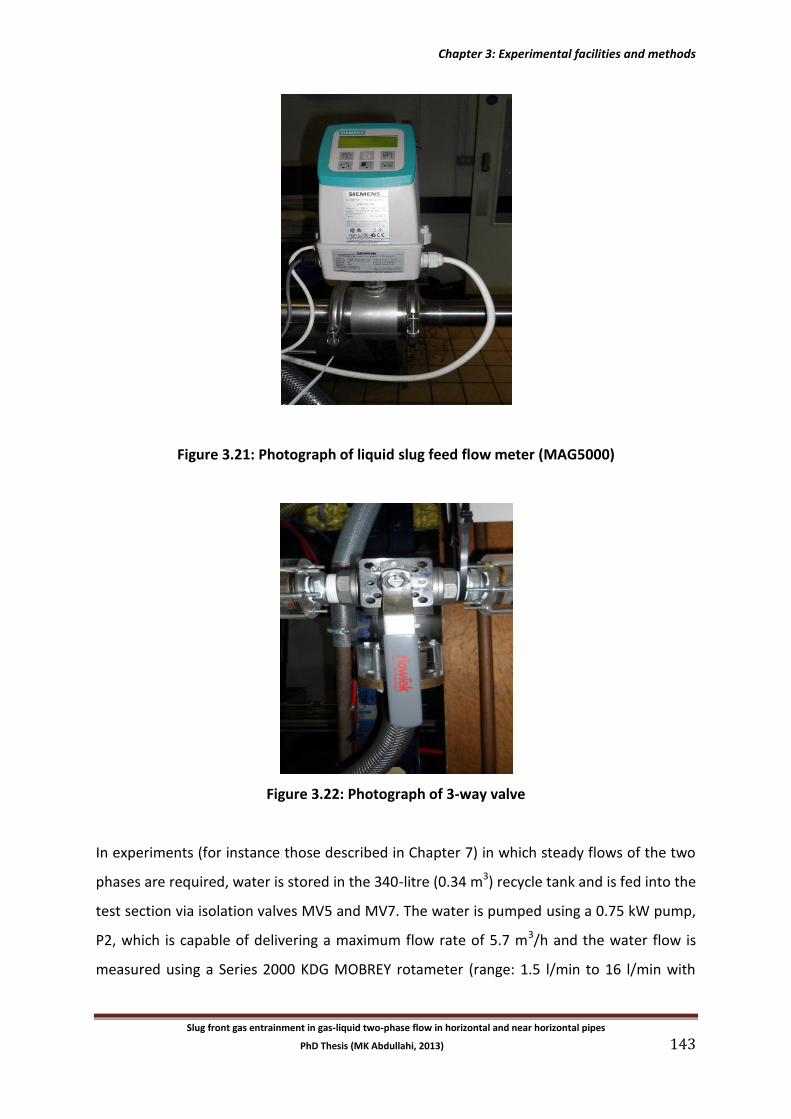
Chapter 3: Experimental facilities and methods
Slug front gas entrainment in gas-liquid two-phase flow in horizontal and near horizontal pipes
PhD Thesis (MK Abdullahi, 2013) 143
Figure 3.21: Photograph of liquid slug feed flow meter (MAG5000)
Figure 3.22: Photograph of 3-way valve
In experiments (for instance those described in Chapter 7) in which steady flows of the two
phases are required, water is stored in the 340-litre (0.34 m3) recycle tank and is fed into the
test section via isolation valves MV5 and MV7. The water is pumped using a 0.75 kW pump,
P2, which is capable of delivering a maximum flow rate of 5.7 m3/h and the water flow is
measured using a Series 2000 KDG MOBREY rotameter (range: 1.5 l/min to 16 l/min with
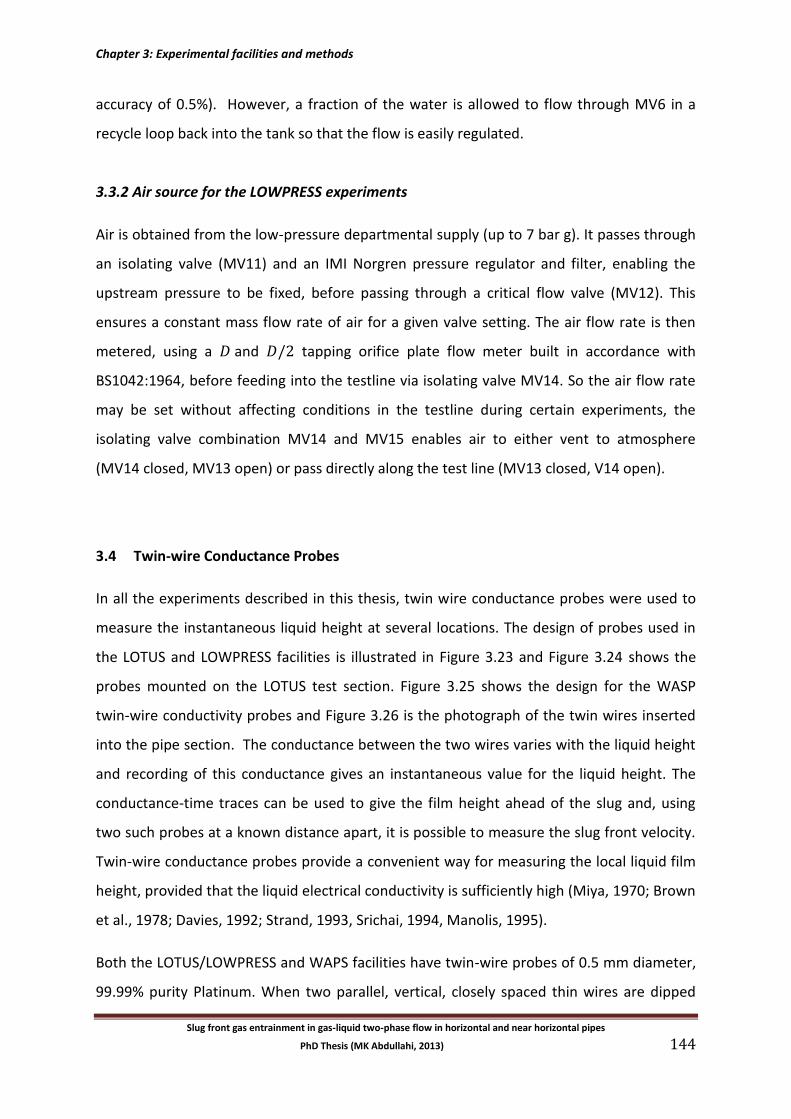
Chapter 3: Experimental facilities and methods
Slug front gas entrainment in gas-liquid two-phase flow in horizontal and near horizontal pipes
PhD Thesis (MK Abdullahi, 2013) 144
accuracy of 0.5%). However, a fraction of the water is allowed to flow through MV6 in a
recycle loop back into the tank so that the flow is easily regulated.
3.3.2 Air source for the LOWPRESS experiments
Air is obtained from the low-pressure departmental supply (up to 7 bar g). It passes through
an isolating valve (MV11) and an IMI Norgren pressure regulator and filter, enabling the
upstream pressure to be fixed, before passing through a critical flow valve (MV12). This
ensures a constant mass flow rate of air for a given valve setting. The air flow rate is then
metered, using a and tapping orifice plate flow meter built in accordance with
BS1042:1964, before feeding into the testline via isolating valve MV14. So the air flow rate
may be set without affecting conditions in the testline during certain experiments, the
isolating valve combination MV14 and MV15 enables air to either vent to atmosphere
(MV14 closed, MV13 open) or pass directly along the test line (MV13 closed, V14 open).
3.4 Twin-wire Conductance Probes
In all the experiments described in this thesis, twin wire conductance probes were used to
measure the instantaneous liquid height at several locations. The design of probes used in
the LOTUS and LOWPRESS facilities is illustrated in Figure 3.23 and Figure 3.24 shows the
probes mounted on the LOTUS test section. Figure 3.25 shows the design for the WASP
twin-wire conductivity probes and Figure 3.26 is the photograph of the twin wires inserted
into the pipe section. The conductance between the two wires varies with the liquid height
and recording of this conductance gives an instantaneous value for the liquid height. The
conductance-time traces can be used to give the film height ahead of the slug and, using
two such probes at a known distance apart, it is possible to measure the slug front velocity.
Twin-wire conductance probes provide a convenient way for measuring the local liquid film
height, provided that the liquid electrical conductivity is sufficiently high (Miya, 1970; Brown
et al., 1978; Davies, 1992; Strand, 1993, Srichai, 1994, Manolis, 1995).
Both the LOTUS/LOWPRESS and WAPS facilities have twin-wire probes of 0.5 mm diameter,
99.99% purity Platinum. When two parallel, vertical, closely spaced thin wires are dipped
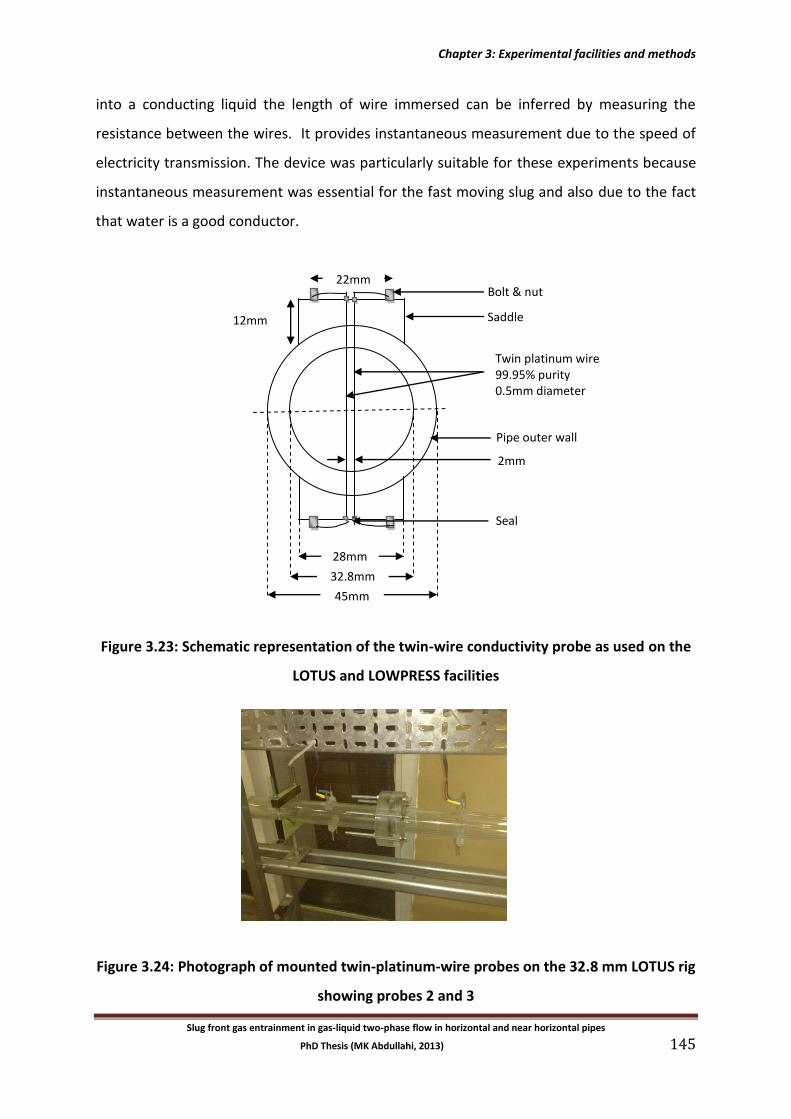
Chapter 3: Experimental facilities and methods
Slug front gas entrainment in gas-liquid two-phase flow in horizontal and near horizontal pipes
PhD Thesis (MK Abdullahi, 2013) 145
into a conducting liquid the length of wire immersed can be inferred by measuring the
resistance between the wires. It provides instantaneous measurement due to the speed of
electricity transmission. The device was particularly suitable for these experiments because
instantaneous measurement was essential for the fast moving slug and also due to the fact
that water is a good conductor.
Figure 3.23: Schematic representation of the twin-wire conductivity probe as used on the
LOTUS and LOWPRESS facilities
Figure 3.24: Photograph of mounted twin-platinum-wire probes on the 32.8 mm LOTUS rig
showing probes 2 and 3
12mm
45mm
28mm
32.8mm
22mm
2mm
Bolt & nut
Saddle
Twin platinum wire 99.95% purity 0.5mm diameter
Pipe outer wall
Seal
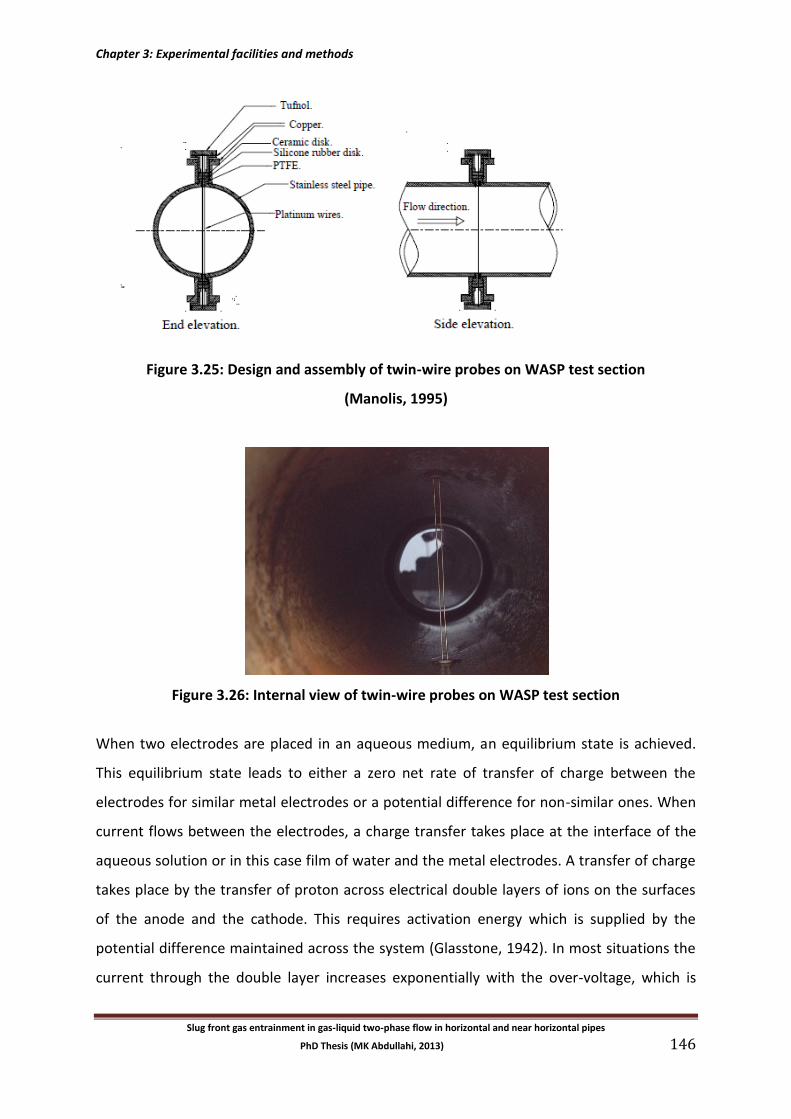
Chapter 3: Experimental facilities and methods
Slug front gas entrainment in gas-liquid two-phase flow in horizontal and near horizontal pipes
PhD Thesis (MK Abdullahi, 2013) 146
Figure 3.25: Design and assembly of twin-wire probes on WASP test section
(Manolis, 1995)
Figure 3.26: Internal view of twin-wire probes on WASP test section
When two electrodes are placed in an aqueous medium, an equilibrium state is achieved.
This equilibrium state leads to either a zero net rate of transfer of charge between the
electrodes for similar metal electrodes or a potential difference for non-similar ones. When
current flows between the electrodes, a charge transfer takes place at the interface of the
aqueous solution or in this case film of water and the metal electrodes. A transfer of charge
takes place by the transfer of proton across electrical double layers of ions on the surfaces
of the anode and the cathode. This requires activation energy which is supplied by the
potential difference maintained across the system (Glasstone, 1942). In most situations the
current through the double layer increases exponentially with the over-voltage, which is
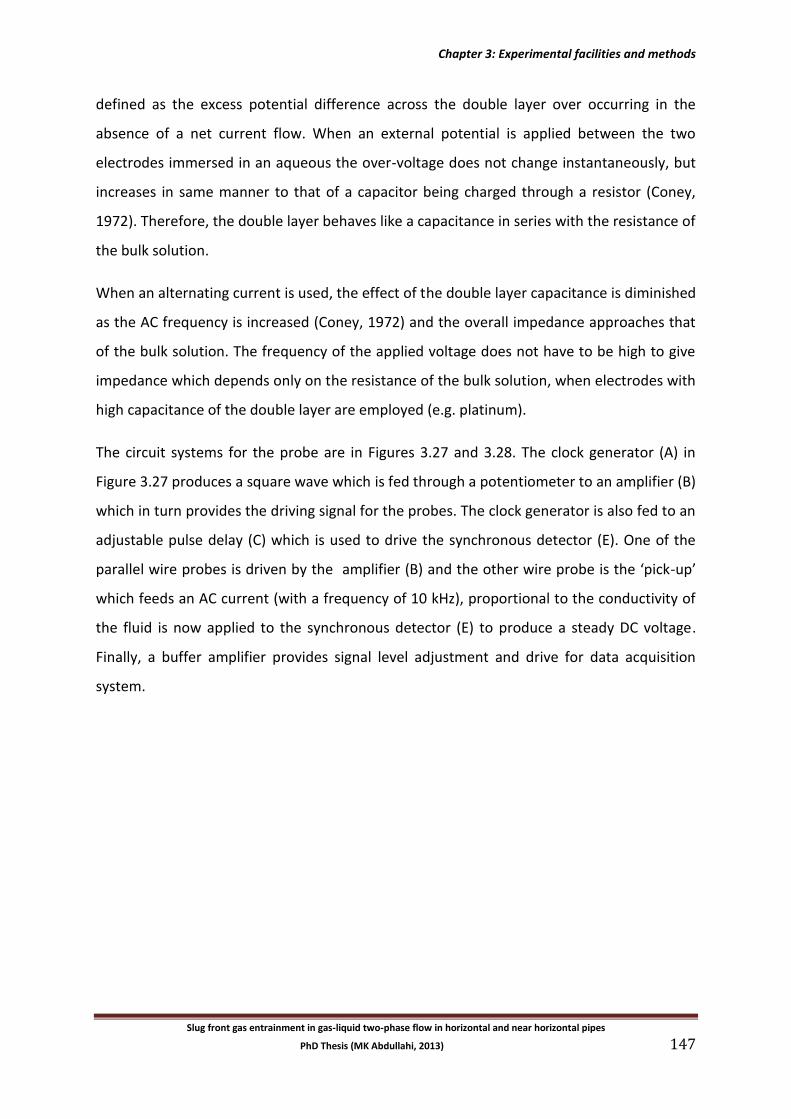
Chapter 3: Experimental facilities and methods
Slug front gas entrainment in gas-liquid two-phase flow in horizontal and near horizontal pipes
PhD Thesis (MK Abdullahi, 2013) 147
defined as the excess potential difference across the double layer over occurring in the
absence of a net current flow. When an external potential is applied between the two
electrodes immersed in an aqueous the over-voltage does not change instantaneously, but
increases in same manner to that of a capacitor being charged through a resistor (Coney,
1972). Therefore, the double layer behaves like a capacitance in series with the resistance of
the bulk solution.
When an alternating current is used, the effect of the double layer capacitance is diminished
as the AC frequency is increased (Coney, 1972) and the overall impedance approaches that
of the bulk solution. The frequency of the applied voltage does not have to be high to give
impedance which depends only on the resistance of the bulk solution, when electrodes with
high capacitance of the double layer are employed (e.g. platinum).
The circuit systems for the probe are in Figures 3.27 and 3.28. The clock generator (A) in
Figure 3.27 produces a square wave which is fed through a potentiometer to an amplifier (B)
which in turn provides the driving signal for the probes. The clock generator is also fed to an
adjustable pulse delay (C) which is used to drive the synchronous detector (E). One of the
parallel wire probes is driven by the amplifier (B) and the other wire probe is the ‘pick-up’
which feeds an AC current (with a frequency of 10 kHz), proportional to the conductivity of
the fluid is now applied to the synchronous detector (E) to produce a steady DC voltage.
Finally, a buffer amplifier provides signal level adjustment and drive for data acquisition
system.
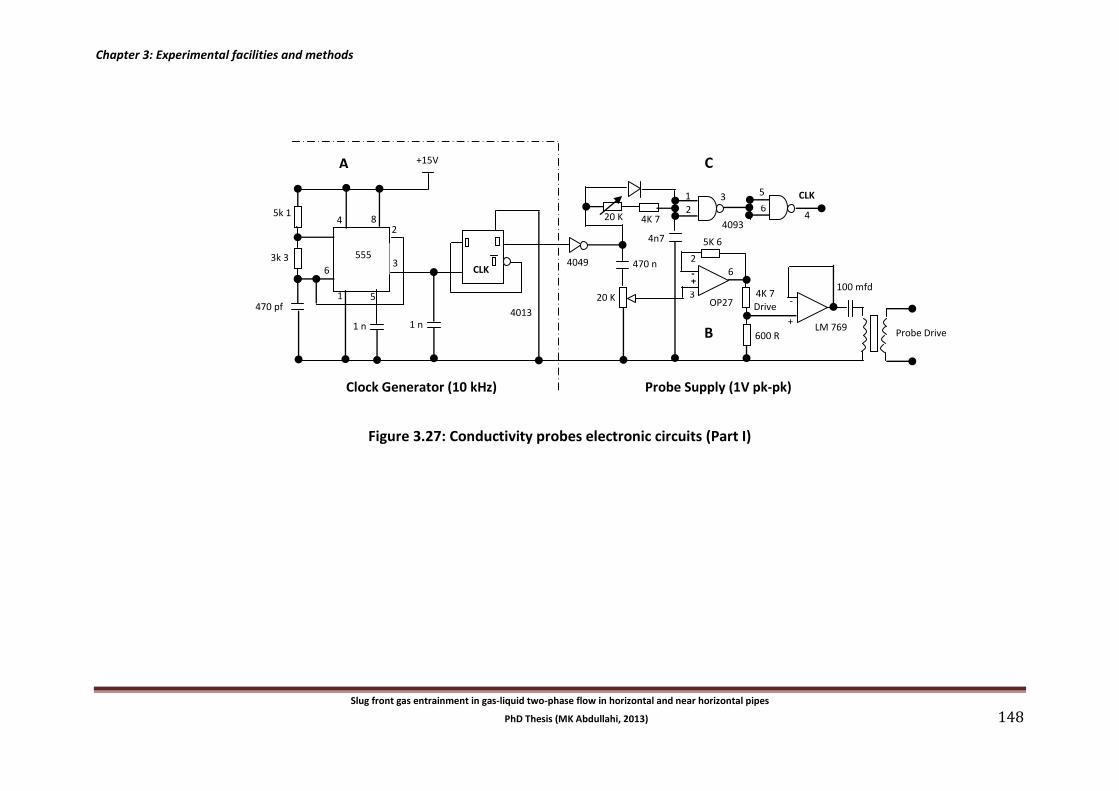
Chapter 3: Experimental facilities and methods
Slug front gas entrainment in gas-liquid two-phase flow in horizontal and near horizontal pipes
PhD Thesis (MK Abdullahi, 2013) 148
Figure 3.27: Conductivity probes electronic circuits (Part I)
+
-
Probe Drive
100 mfd
LM 769 600 R
4K 7 Drive
6
5K 6
OP27 3
2
+ -
4093
CLK 6
5
4
3 2
1
4n7
4K 7 20 K
CLK 470 n
20 K
4049
4013 1 n
+15V
1 n
8
5
6
4
3
2
1 470 pf
3k 3
5k 1
A
B
C
Clock Generator (10 kHz) Probe Supply (1V pk-pk)
555
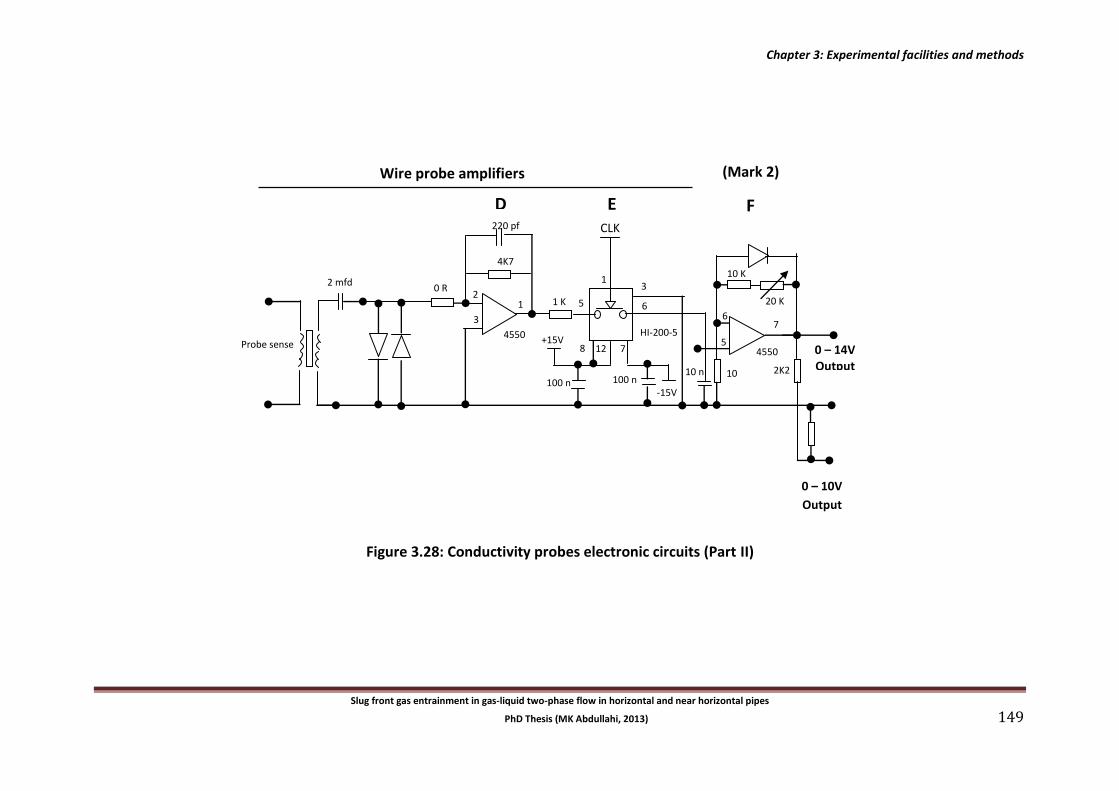
Chapter 3: Experimental facilities and methods
Slug front gas entrainment in gas-liquid two-phase flow in horizontal and near horizontal pipes
PhD Thesis (MK Abdullahi, 2013) 149
Figure 3.28: Conductivity probes electronic circuits (Part II)
CLK
E D
0 – 14V Output
4550
2K2
7
20 K
10 K
6
5
10
K
10 n 100 n 100 n
HI-200-5
-15V
+15V 7 8 12
5 6
3 1
1 K
4550
1
3
2
4K7
220 pf
0 R 2 mfd
Probe sense
0 – 10V
Output
Wire probe amplifiers
F
(Mark 2)
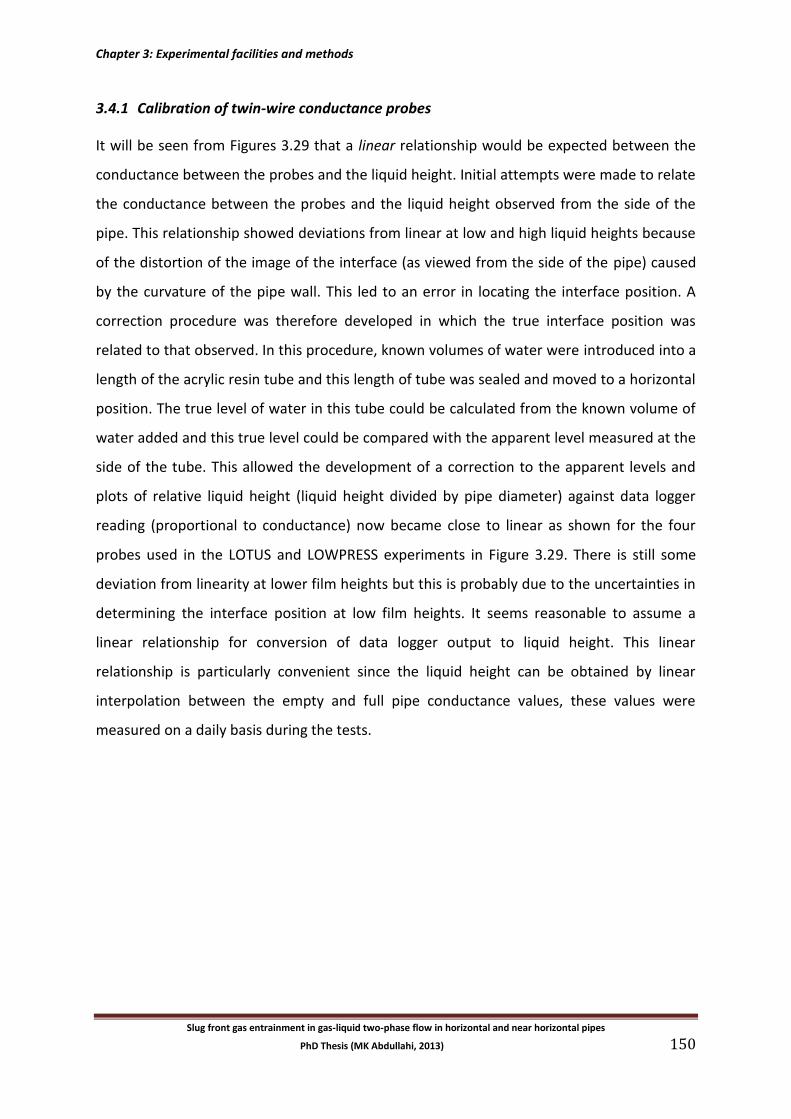
Chapter 3: Experimental facilities and methods
Slug front gas entrainment in gas-liquid two-phase flow in horizontal and near horizontal pipes
PhD Thesis (MK Abdullahi, 2013) 150
3.4.1 Calibration of twin-wire conductance probes
It will be seen from Figures 3.29 that a linear relationship would be expected between the
conductance between the probes and the liquid height. Initial attempts were made to relate
the conductance between the probes and the liquid height observed from the side of the
pipe. This relationship showed deviations from linear at low and high liquid heights because
of the distortion of the image of the interface (as viewed from the side of the pipe) caused
by the curvature of the pipe wall. This led to an error in locating the interface position. A
correction procedure was therefore developed in which the true interface position was
related to that observed. In this procedure, known volumes of water were introduced into a
length of the acrylic resin tube and this length of tube was sealed and moved to a horizontal
position. The true level of water in this tube could be calculated from the known volume of
water added and this true level could be compared with the apparent level measured at the
side of the tube. This allowed the development of a correction to the apparent levels and
plots of relative liquid height (liquid height divided by pipe diameter) against data logger
reading (proportional to conductance) now became close to linear as shown for the four
probes used in the LOTUS and LOWPRESS experiments in Figure 3.29. There is still some
deviation from linearity at lower film heights but this is probably due to the uncertainties in
determining the interface position at low film heights. It seems reasonable to assume a
linear relationship for conversion of data logger output to liquid height. This linear
relationship is particularly convenient since the liquid height can be obtained by linear
interpolation between the empty and full pipe conductance values, these values were
measured on a daily basis during the tests.
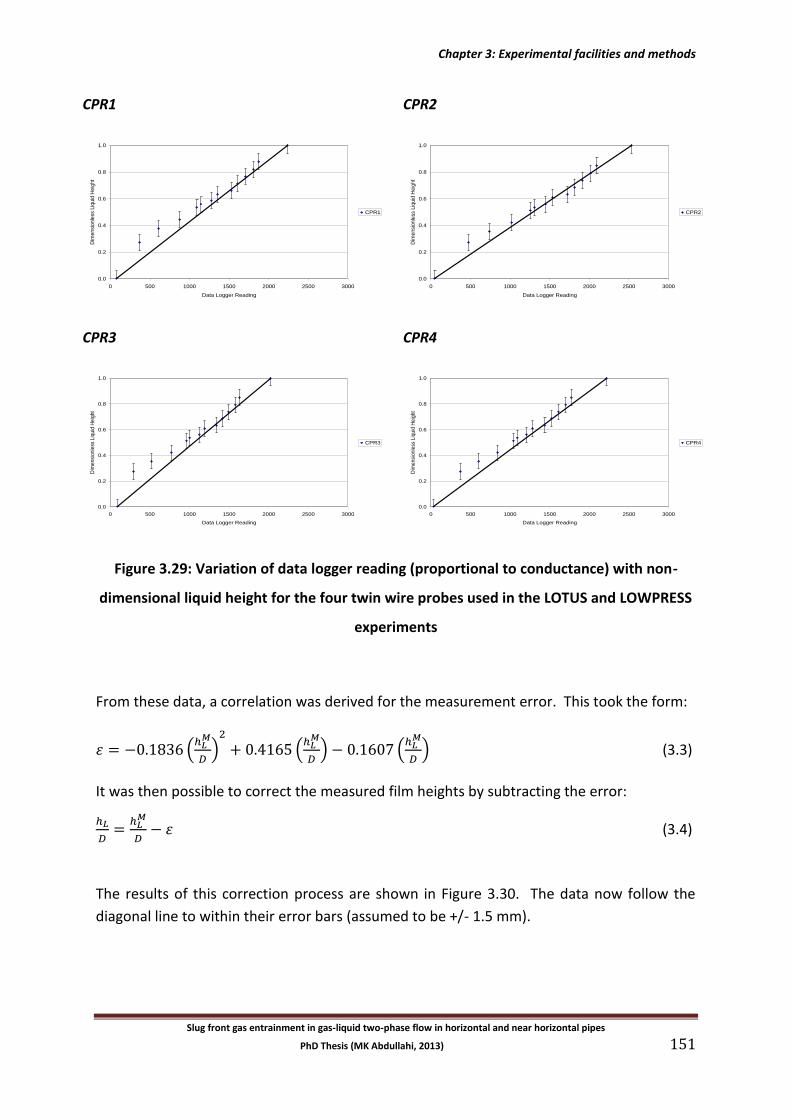
Chapter 3: Experimental facilities and methods
Slug front gas entrainment in gas-liquid two-phase flow in horizontal and near horizontal pipes
PhD Thesis (MK Abdullahi, 2013) 151
CPR1 CPR2
CPR3 CPR4
Figure 3.29: Variation of data logger reading (proportional to conductance) with non-
dimensional liquid height for the four twin wire probes used in the LOTUS and LOWPRESS
experiments
From these data, a correlation was derived for the measurement error. This took the form:
(
)
(
) (
) (3.3)
It was then possible to correct the measured film heights by subtracting the error:
(3.4)
The results of this correction process are shown in Figure 3.30. The data now follow the
diagonal line to within their error bars (assumed to be +/- 1.5 mm).
0.0
0.2
0.4
0.6
0.8
1.0
0 500 1000 1500 2000 2500 3000
Data Logger Reading
Dim
ensi
onle
ss L
iquid
Heig
ht
CPR1
0.0
0.2
0.4
0.6
0.8
1.0
0 500 1000 1500 2000 2500 3000
Data Logger Reading
Dim
ensi
onle
ss L
iquid
Heig
ht
CPR2
0.0
0.2
0.4
0.6
0.8
1.0
0 500 1000 1500 2000 2500 3000
Data Logger Reading
Dim
ensi
onle
ss L
iquid
He
ight
CPR3
0.0
0.2
0.4
0.6
0.8
1.0
0 500 1000 1500 2000 2500 3000
Data Logger Reading
Dim
ensi
onle
ss L
iquid
He
ight
CPR4
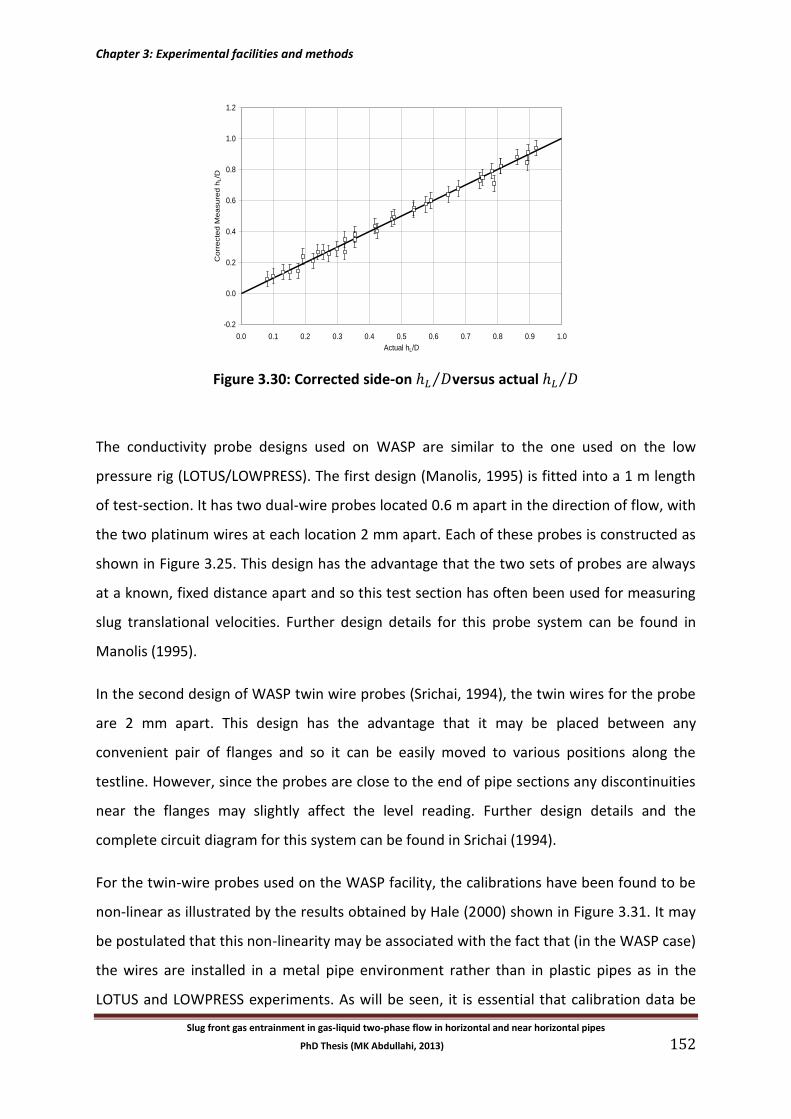
Chapter 3: Experimental facilities and methods
Slug front gas entrainment in gas-liquid two-phase flow in horizontal and near horizontal pipes
PhD Thesis (MK Abdullahi, 2013) 152
Figure 3.30: Corrected side-on ⁄ versus actual ⁄
The conductivity probe designs used on WASP are similar to the one used on the low
pressure rig (LOTUS/LOWPRESS). The first design (Manolis, 1995) is fitted into a 1 m length
of test-section. It has two dual-wire probes located 0.6 m apart in the direction of flow, with
the two platinum wires at each location 2 mm apart. Each of these probes is constructed as
shown in Figure 3.25. This design has the advantage that the two sets of probes are always
at a known, fixed distance apart and so this test section has often been used for measuring
slug translational velocities. Further design details for this probe system can be found in
Manolis (1995).
In the second design of WASP twin wire probes (Srichai, 1994), the twin wires for the probe
are 2 mm apart. This design has the advantage that it may be placed between any
convenient pair of flanges and so it can be easily moved to various positions along the
testline. However, since the probes are close to the end of pipe sections any discontinuities
near the flanges may slightly affect the level reading. Further design details and the
complete circuit diagram for this system can be found in Srichai (1994).
For the twin-wire probes used on the WASP facility, the calibrations have been found to be
non-linear as illustrated by the results obtained by Hale (2000) shown in Figure 3.31. It may
be postulated that this non-linearity may be associated with the fact that (in the WASP case)
the wires are installed in a metal pipe environment rather than in plastic pipes as in the
LOTUS and LOWPRESS experiments. As will be seen, it is essential that calibration data be
-0.2
0.0
0.2
0.4
0.6
0.8
1.0
1.2
0.0 0.1 0.2 0.3 0.4 0.5 0.6 0.7 0.8 0.9 1.0
Actual hL/D
Co
rrecte
d M
easure
d h
L/D
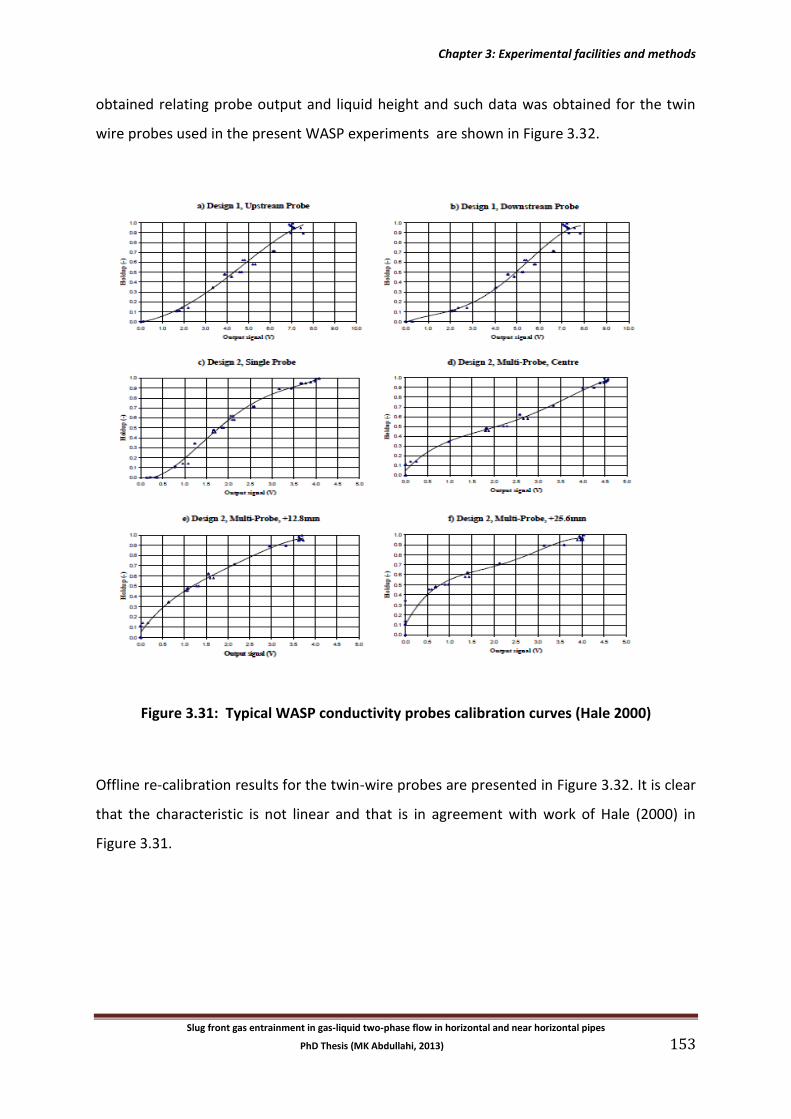
Chapter 3: Experimental facilities and methods
Slug front gas entrainment in gas-liquid two-phase flow in horizontal and near horizontal pipes
PhD Thesis (MK Abdullahi, 2013) 153
obtained relating probe output and liquid height and such data was obtained for the twin
wire probes used in the present WASP experiments are shown in Figure 3.32.
Figure 3.31: Typical WASP conductivity probes calibration curves (Hale 2000)
Offline re-calibration results for the twin-wire probes are presented in Figure 3.32. It is clear
that the characteristic is not linear and that is in agreement with work of Hale (2000) in
Figure 3.31.
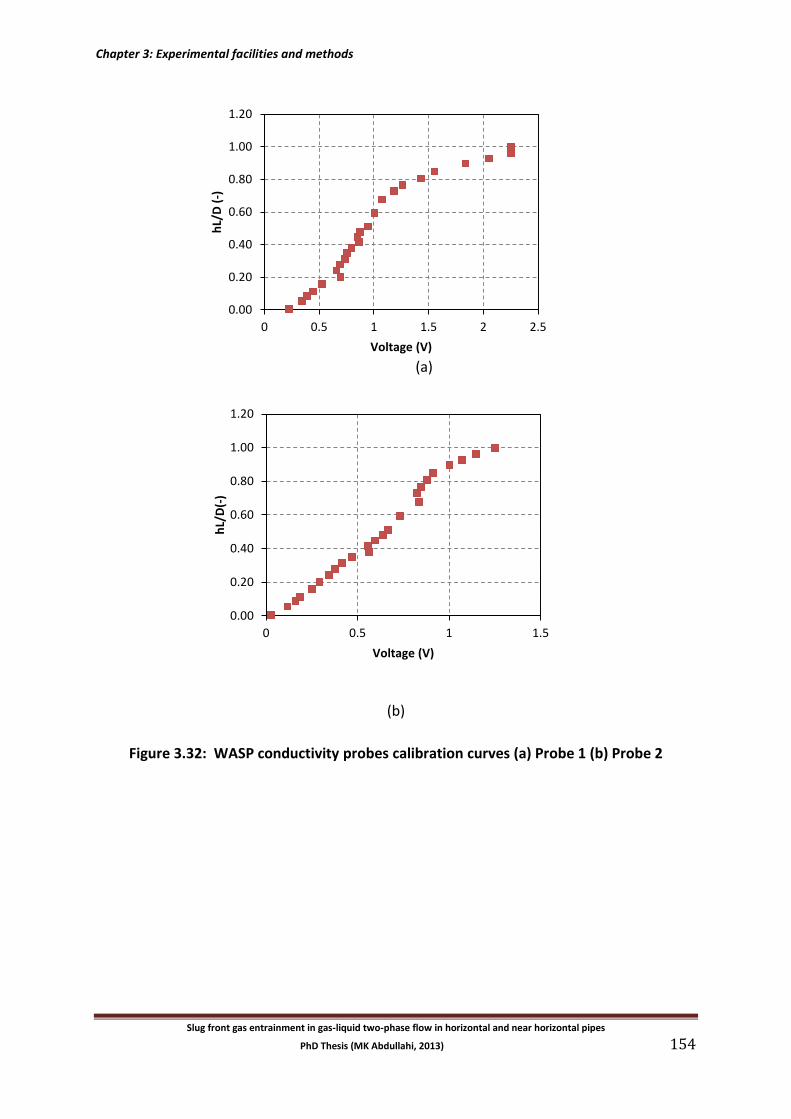
Chapter 3: Experimental facilities and methods
Slug front gas entrainment in gas-liquid two-phase flow in horizontal and near horizontal pipes
PhD Thesis (MK Abdullahi, 2013) 154
(a)
(b)
Figure 3.32: WASP conductivity probes calibration curves (a) Probe 1 (b) Probe 2
0.00
0.20
0.40
0.60
0.80
1.00
1.20
0 0.5 1 1.5
hL/
D(-
)
Voltage (V)
0.00
0.20
0.40
0.60
0.80
1.00
1.20
0 0.5 1 1.5 2 2.5
hL/
D (
-)
Voltage (V)
Chapter 3: Experimental facilities and methods
Slug front gas entrainment in gas-liquid two-phase flow in horizontal and near horizontal pipes
PhD Thesis (MK Abdullahi, 2013) 155
3.5 Data Acquisition and Processing
3.5.1 Data acquisition and processing on LOTUS and LOWPRESS rigs
To enable continuous monitoring of the air flow rate, pressure transducers are used to
measure the absolute pressure at the upstream tapping of the orifice plate and the pressure
drop across it. The upstream tapping is connected to a 0 to 10 barg absolute pressure
transducer that has been found to be accurate to within +/- 4 mbar in checks against a
previously calibrated transducer of known characteristics. The pressure drop across the
orifice plate is measured using a 0 to 1 bar differential pressure cell. To allow periodic
checks of its accuracy, a water filled manometer is also connected in parallel.
The output signals from these transducers and the one mounted on the testline are
converted to digital form and stored on an Amstrad PC1512 (8088) Personal Computer. The
analogue to digital (A/D) conversion is performed by a Scientific Solutions Inc. Lab master
data acquisition unit which is capable of handling up to 16 channels and may be set to read
a signal range of either -10 to +10V or 0 to 10V. In the experiments described here the range
was set to 0 to 10V to correspond with the output from the transducers. A computer
program written in Quick BASIC by Manolis (1995) controls the A/D conversion and records
the converted data. To reduce the risk of slowing down the data acquisition speed, only
output voltage signals are stored during a run. These data are then converted to pressures
and air flow rate after the test is complete. For all the experiments performed on the
LOTUS-LOWPRESS rig a data acquisition frequency of 10 Hz is used for this card.
To obtain more detailed pressure profiles, and to record the conductivity probe output
signals, a more rapid acquisition system may also be connected in parallel. This system uses
an Amplicon-Liveline PC30AT analogue to digital conversion card installed in the expansion
slot of a NAGA 80486 DX-33 personal computer. It enables rapid acquisition of signals from
up to 16 channels. To control the A/D conversion and record the converted data, a program
written in Quick BASIC is employed. Using this program sampling frequencies of 0 to 1000
Hz may be specified. However, a sampling frequency of 500 Hz is generally chosen as the
best compromise between the necessity for high sampling rates and the ease of handling
large, unwieldy data files. From the sampling theorem (Lynn, 1982) it is possible to estimate
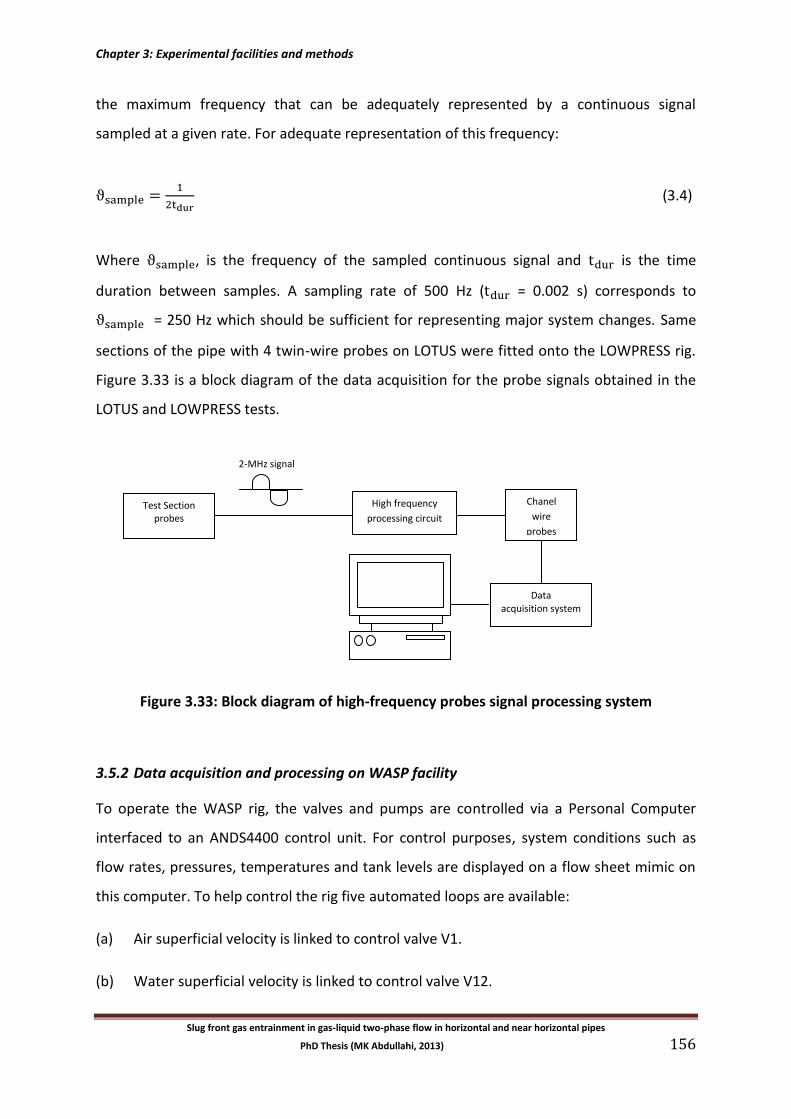
Chapter 3: Experimental facilities and methods
Slug front gas entrainment in gas-liquid two-phase flow in horizontal and near horizontal pipes
PhD Thesis (MK Abdullahi, 2013) 156
the maximum frequency that can be adequately represented by a continuous signal
sampled at a given rate. For adequate representation of this frequency:
(3.4)
Where , is the frequency of the sampled continuous signal and is the time
duration between samples. A sampling rate of 500 Hz ( = 0.002 s) corresponds to
= 250 Hz which should be sufficient for representing major system changes. Same
sections of the pipe with 4 twin-wire probes on LOTUS were fitted onto the LOWPRESS rig.
Figure 3.33 is a block diagram of the data acquisition for the probe signals obtained in the
LOTUS and LOWPRESS tests.
Figure 3.33: Block diagram of high-frequency probes signal processing system
3.5.2 Data acquisition and processing on WASP facility
To operate the WASP rig, the valves and pumps are controlled via a Personal Computer
interfaced to an ANDS4400 control unit. For control purposes, system conditions such as
flow rates, pressures, temperatures and tank levels are displayed on a flow sheet mimic on
this computer. To help control the rig five automated loops are available:
(a) Air superficial velocity is linked to control valve V1.
(b) Water superficial velocity is linked to control valve V12.
2-MHz signal
Test Section probes
High frequency
processing circuit
Data acquisition system
Chanel
wire
probes
amplifier
Chapter 3: Experimental facilities and methods
Slug front gas entrainment in gas-liquid two-phase flow in horizontal and near horizontal pipes
PhD Thesis (MK Abdullahi, 2013) 157
(c) Oil superficial velocity is linked to control valve V13.
(d) Rig outlet pressure is linked to control valve V3.
(e) Slug catcher liquid level is linked to control valve V2.
In addition to the main control system there are several computers for data acquisition. A
main acquisition computer is connected in parallel to the control computer and enables
flow rate and system pressures to be recorded over the video recordings of the flow at
frequencies of up to 10 Hz. For the conductivity probes, a separate computer is used. This is
identical to the one employed on the low pressure rig with sampling at a frequency of 500
Hz.
3.6 Conclusion
Three independent facilities were used in the present work. The LOTUS and WASP facilities
were used for a new form of “push-in” experiment in which a slug was injected into a
stratified flow using a three-way valve system for the cases of a 32.8 mm and a 77.92 mm
pipes respectively. The LOWPRESS system was used for a new form of gas entrainment
measurement (the “bubble experiment” – see Chapter 6) and for slug flow visualisation
using high speed camera (see Chapter 7); both sets of measurements in the LOWPRESS
facility were for a pipe diameter of 32.8 mm.
Chapter 4: Measurements of slug front gas entrainment rate on LOTUS facility
Slug front gas entrainment in gas-liquid two-phase flow in horizontal and near horizontal pipes
PhD Thesis (MK Abdullahi, 2013) 158
Chapter 4: Measurements of Slug Front Gas Entrainment Rates on the LOTUS
Facility (32.8 mm diameter pipe)
Summary: This chapter describes the measurements of slug front gas entrainment made on
a 32.8 mm internal diameter pipe using the LOTUS facility. This facility and the physical
bases for the experiment are described in Chapter 3. In this present Chapter, the analytical
bases of the experiment are described and experimental results are presented. The main
series of experiments were with the propagation of a slug front over a pre-existing stratified
flow in a horizontal pipe. However, experiments were also done with a stationary film ahead
of the slug (simulating those of Hale – see Chapter 2), with an upwards inclined pipe with a
film falling towards the slug front (simulating those of Manolis – see Chapter 2) and with a
dry pipe ahead of the slug.
The contents of this Chapter are as follows:
4.1 Basis of Push-in Gas Entrainment Measurements
4.2 Experiments with Stratified Flow ahead of the Advancing Slug in a Horizontal Pipe
4.3 Experiments with a Stationary Liquid Film ahead of the Advancing Slug in a Horizontal
Pipe.
4.4 Experiments with an Upwards Inclined Pipe and a Film Moving Down Towards the
Advancing Slug Front
4.5 Experiments with a Dry Pipe ahead of the Advancing Slug Front in a Horizontal Pipe
4.6 Conclusion
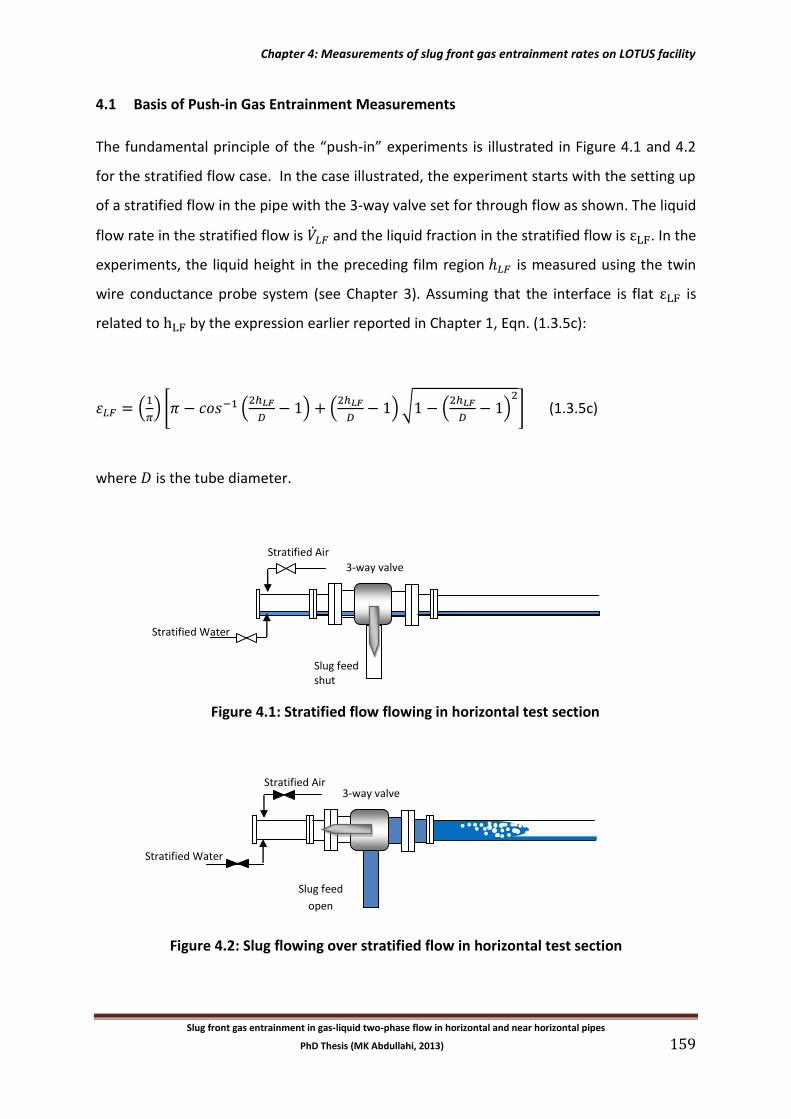
Chapter 4: Measurements of slug front gas entrainment rates on LOTUS facility
Slug front gas entrainment in gas-liquid two-phase flow in horizontal and near horizontal pipes
PhD Thesis (MK Abdullahi, 2013) 159
4.1 Basis of Push-in Gas Entrainment Measurements
The fundamental principle of the “push-in” experiments is illustrated in Figure 4.1 and 4.2
for the stratified flow case. In the case illustrated, the experiment starts with the setting up
of a stratified flow in the pipe with the 3-way valve set for through flow as shown. The liquid
flow rate in the stratified flow is and the liquid fraction in the stratified flow is . In the
experiments, the liquid height in the preceding film region is measured using the twin
wire conductance probe system (see Chapter 3). Assuming that the interface is flat is
related to by the expression earlier reported in Chapter 1, Eqn. (1.3.5c):
(
) [ (
) (
)√ (
)
] (1.3.5c)
where is the tube diameter.
Figure 4.1: Stratified flow flowing in horizontal test section
Figure 4.2: Slug flowing over stratified flow in horizontal test section
Slug feed
open
Stratified Water
3-way valve Stratified Air
Slug feed shut
3-way valve
Stratified Air
Stratified Water
Chapter 4: Measurements of slug front gas entrainment rate on LOTUS facility
Slug front gas entrainment in gas-liquid two-phase flow in horizontal and near horizontal pipes
PhD Thesis (MK Abdullahi, 2013) 160
To understand the interpretation of the experiments, it is appropriate to use here an
adaptation of the derivation of Manolis (1995). If the liquid flow rate in the slug feed is
(m3/s) and the liquid fraction in the downstream region is then, following Manolis
(1995), three cases can be recognised as follows:
Case 1: Slug front advancing over a stationary liquid layer. Here, the translational velocity of
the slug front is given as:
( ) (4.1)
where A is the cross sectional area of the flow channel ( ) where is the pipe
diameter.
Case 2: When the slug front is moving over a layer with a flow of liquid in front of the slug
front of then the translational velocity of the slug front is given by:
( ) (4.2)
Case 3: When the slug front is moving over a layer with a flow of liquid in front of the slug
front of and there is a volumetric gas entrainment rate at the slug front of , then the
slug translational velocity is:
( ) (4.3)
Rearranging Eqn. (4.3) gives,
( ) (4.4)
In the experiments described here, where there was a film ahead of the advancing slug
front, it was found that and did not change greatly from the initial conditions in the
(short) period of time between the initiation of the slug and the passage of the slug front
over the twin wire conductance probes. Obviously, from the above equation it is possible to
estimate the gas entrainment rate if , and are known. The estimation of
Chapter 4: Measurements of slug front gas entrainment rates on LOTUS facility
Slug front gas entrainment in gas-liquid two-phase flow in horizontal and near horizontal pipes
PhD Thesis (MK Abdullahi, 2013) 161
is, of course, the objective of the experiment! In all the experiments, is measured
using the venturi meter in the slug feed line. In all but one of the cases, is measured
ahead of the slug using the twin-wire conductance probes (the exception is the case where
there is a dry wall ahead of the advancing slug front, in which case - see Section 4.5).
The remaining quantity required to calculate is the flow rate of liquid in the film
towards the slug front in the Manolis experiments (and in the present experiments with
the inclined pipe - see Section 4.4). is simply the rate at which liquid is introduced to
form a film which falls towards the advancing front. For the present experiments with a
stationary film (see Section 4.3) and with a dry pipe ahead of the advancing slug front (see
Section 4.5), then . The remaining case is where a stratified flow is set up before the
introduction of the slug. In this case, where is the liquid volume flow
rate in the initial stratified flow. Note that it follows that:
(4.5)
where is the velocity of the liquid in the film ahead of the slug.
Manolis (1995) correlated the gas entrainment rate per unit width of the liquid film
with the relative velocity of the slug front (
) and observed a linear
relationship. Note that, in the upwards inclined tube experiments of Manolis (and in the
similar experiments reported here – see Section 4.4) is negative. was calculated from
assuming the interface was flat and using the relationship in Eqn. (1.3.6c). In what
follows, the present results are compared with those of Manolis in terms of a correlation of
and relative velocity.
The data acquisition was in terms of velocity rather than volumetric flow rate; therefore, for
further clarity on the concept, Figure 4.3 and the control volume in Figure 4.4 are in velocity
terms. Therefore, Eqn. (4.4) become,
[ ( ) ] (4.6)
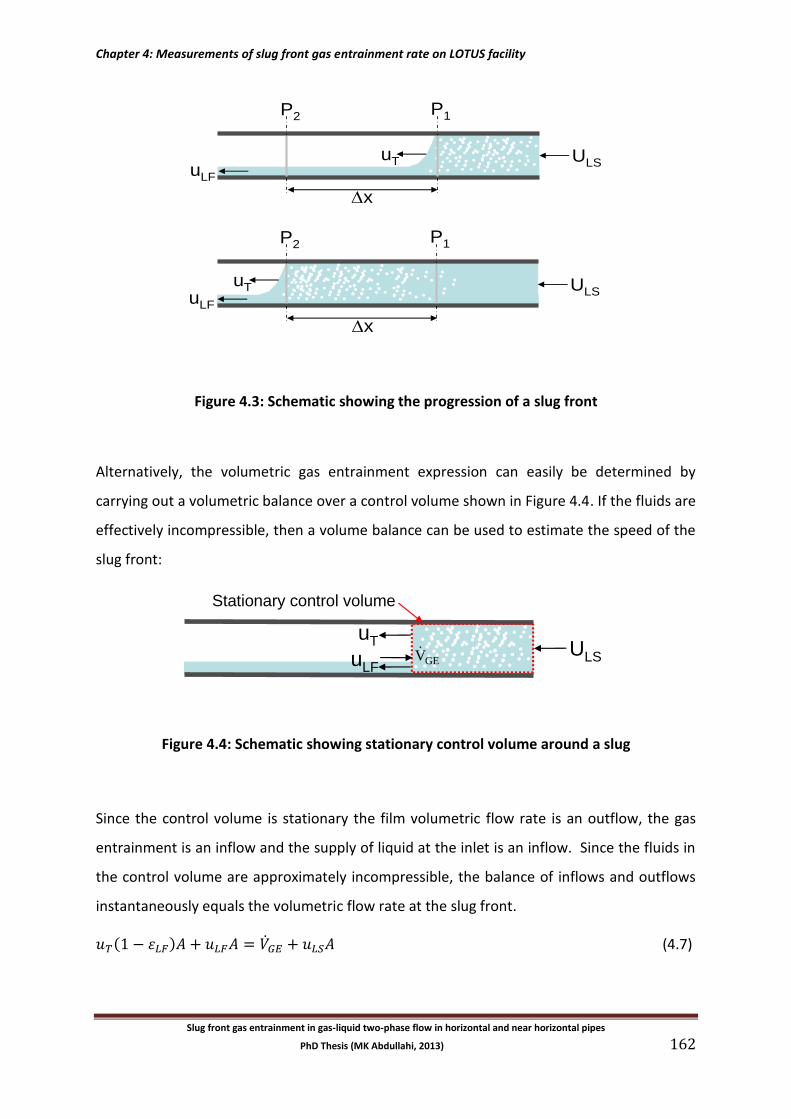
Chapter 4: Measurements of slug front gas entrainment rate on LOTUS facility
Slug front gas entrainment in gas-liquid two-phase flow in horizontal and near horizontal pipes
PhD Thesis (MK Abdullahi, 2013) 162
Figure 4.3: Schematic showing the progression of a slug front
Alternatively, the volumetric gas entrainment expression can easily be determined by
carrying out a volumetric balance over a control volume shown in Figure 4.4. If the fluids are
effectively incompressible, then a volume balance can be used to estimate the speed of the
slug front:
Figure 4.4: Schematic showing stationary control volume around a slug
Since the control volume is stationary the film volumetric flow rate is an outflow, the gas
entrainment is an inflow and the supply of liquid at the inlet is an inflow. Since the fluids in
the control volume are approximately incompressible, the balance of inflows and outflows
instantaneously equals the volumetric flow rate at the slug front.
( ) (4.7)
P1P2
P1P2
uT
uT
ULS
ULS
uLF
uLF
x
x
uTULSuLF
Stationary control volume
GEV
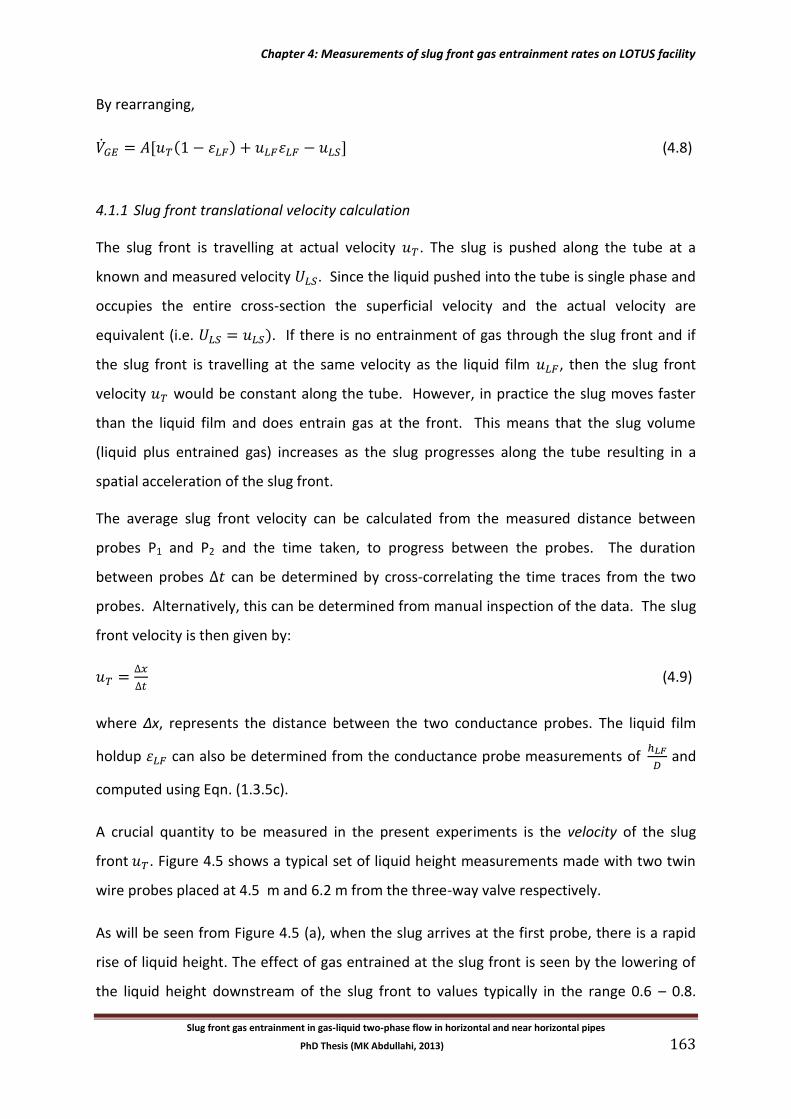
Chapter 4: Measurements of slug front gas entrainment rates on LOTUS facility
Slug front gas entrainment in gas-liquid two-phase flow in horizontal and near horizontal pipes
PhD Thesis (MK Abdullahi, 2013) 163
By rearranging,
[ ( ) ] (4.8)
4.1.1 Slug front translational velocity calculation
The slug front is travelling at actual velocity . The slug is pushed along the tube at a
known and measured velocity . Since the liquid pushed into the tube is single phase and
occupies the entire cross-section the superficial velocity and the actual velocity are
equivalent (i.e. ). If there is no entrainment of gas through the slug front and if
the slug front is travelling at the same velocity as the liquid film , then the slug front
velocity would be constant along the tube. However, in practice the slug moves faster
than the liquid film and does entrain gas at the front. This means that the slug volume
(liquid plus entrained gas) increases as the slug progresses along the tube resulting in a
spatial acceleration of the slug front.
The average slug front velocity can be calculated from the measured distance between
probes P1 and P2 and the time taken, to progress between the probes. The duration
between probes can be determined by cross-correlating the time traces from the two
probes. Alternatively, this can be determined from manual inspection of the data. The slug
front velocity is then given by:
(4.9)
where Δx, represents the distance between the two conductance probes. The liquid film
holdup can also be determined from the conductance probe measurements of
and
computed using Eqn. (1.3.5c).
A crucial quantity to be measured in the present experiments is the velocity of the slug
front . Figure 4.5 shows a typical set of liquid height measurements made with two twin
wire probes placed at 4.5 m and 6.2 m from the three-way valve respectively.
As will be seen from Figure 4.5 (a), when the slug arrives at the first probe, there is a rapid
rise of liquid height. The effect of gas entrained at the slug front is seen by the lowering of
the liquid height downstream of the slug front to values typically in the range 0.6 – 0.8.
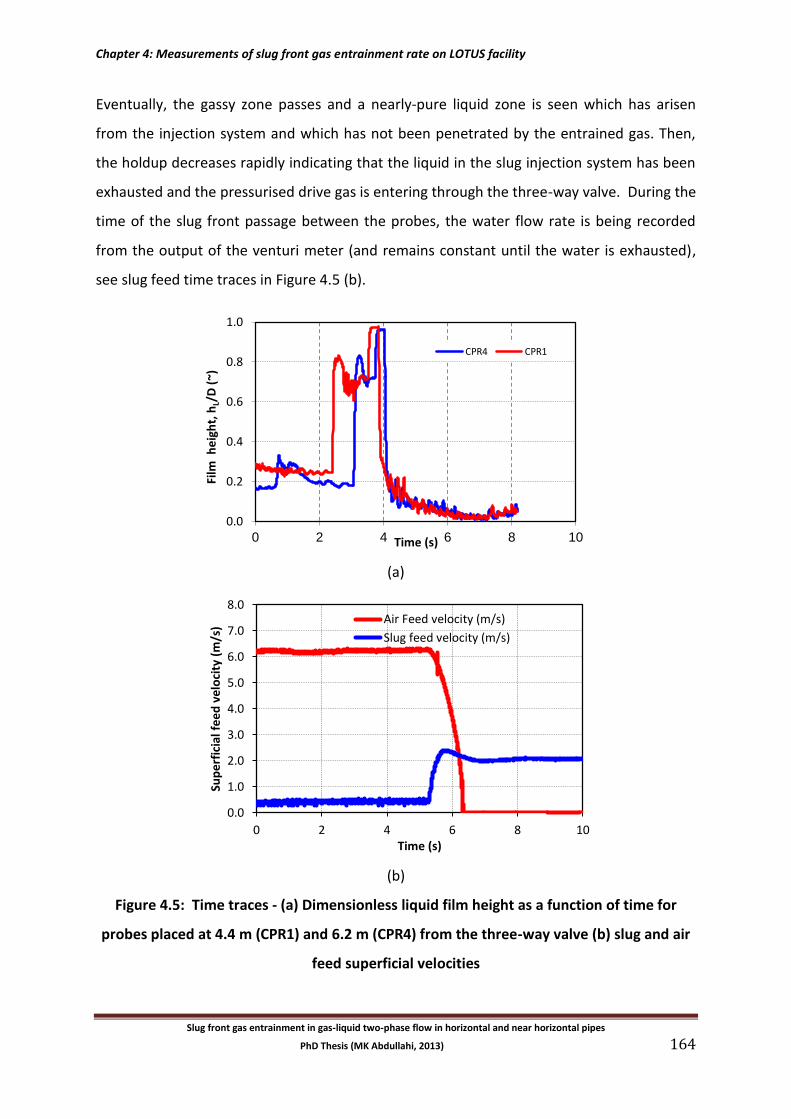
Chapter 4: Measurements of slug front gas entrainment rate on LOTUS facility
Slug front gas entrainment in gas-liquid two-phase flow in horizontal and near horizontal pipes
PhD Thesis (MK Abdullahi, 2013) 164
Eventually, the gassy zone passes and a nearly-pure liquid zone is seen which has arisen
from the injection system and which has not been penetrated by the entrained gas. Then,
the holdup decreases rapidly indicating that the liquid in the slug injection system has been
exhausted and the pressurised drive gas is entering through the three-way valve. During the
time of the slug front passage between the probes, the water flow rate is being recorded
from the output of the venturi meter (and remains constant until the water is exhausted),
see slug feed time traces in Figure 4.5 (b).
(a)
(b)
Figure 4.5: Time traces - (a) Dimensionless liquid film height as a function of time for
probes placed at 4.4 m (CPR1) and 6.2 m (CPR4) from the three-way valve (b) slug and air
feed superficial velocities
0.0
0.2
0.4
0.6
0.8
1.0
0 2 4 6 8 10
Film
he
igh
t, h
L/D
(~)
Time (s)
CPR4 CPR1
0.0
1.0
2.0
3.0
4.0
5.0
6.0
7.0
8.0
0 2 4 6 8 10
Sup
erf
icia
l fe
ed
ve
loci
ty (
m/s
)
Time (s)
Air Feed velocity (m/s)
Slug feed velocity (m/s)
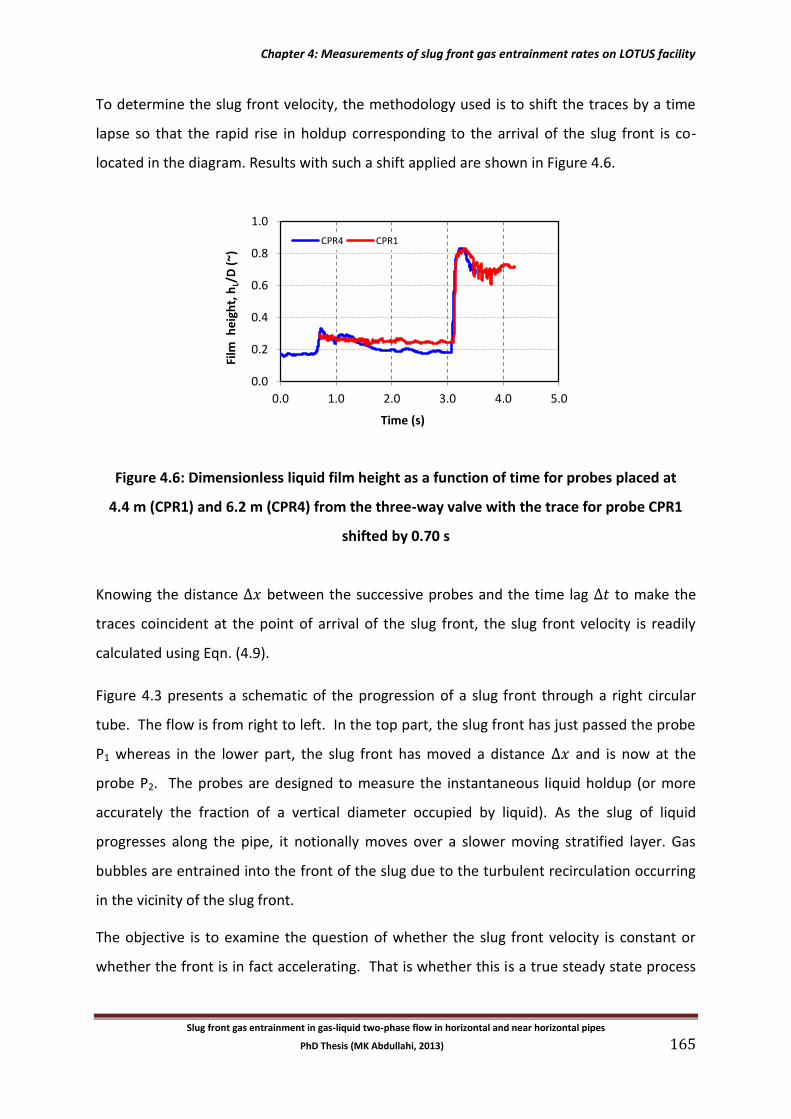
Chapter 4: Measurements of slug front gas entrainment rates on LOTUS facility
Slug front gas entrainment in gas-liquid two-phase flow in horizontal and near horizontal pipes
PhD Thesis (MK Abdullahi, 2013) 165
To determine the slug front velocity, the methodology used is to shift the traces by a time
lapse so that the rapid rise in holdup corresponding to the arrival of the slug front is co-
located in the diagram. Results with such a shift applied are shown in Figure 4.6.
Figure 4.6: Dimensionless liquid film height as a function of time for probes placed at
4.4 m (CPR1) and 6.2 m (CPR4) from the three-way valve with the trace for probe CPR1
shifted by 0.70 s
Knowing the distance between the successive probes and the time lag to make the
traces coincident at the point of arrival of the slug front, the slug front velocity is readily
calculated using Eqn. (4.9).
Figure 4.3 presents a schematic of the progression of a slug front through a right circular
tube. The flow is from right to left. In the top part, the slug front has just passed the probe
P1 whereas in the lower part, the slug front has moved a distance and is now at the
probe P2. The probes are designed to measure the instantaneous liquid holdup (or more
accurately the fraction of a vertical diameter occupied by liquid). As the slug of liquid
progresses along the pipe, it notionally moves over a slower moving stratified layer. Gas
bubbles are entrained into the front of the slug due to the turbulent recirculation occurring
in the vicinity of the slug front.
The objective is to examine the question of whether the slug front velocity is constant or
whether the front is in fact accelerating. That is whether this is a true steady state process
0.0
0.2
0.4
0.6
0.8
1.0
0.0 1.0 2.0 3.0 4.0 5.0
Film
he
igh
t, h
L/D
(~)
Time (s)
CPR4 CPR1
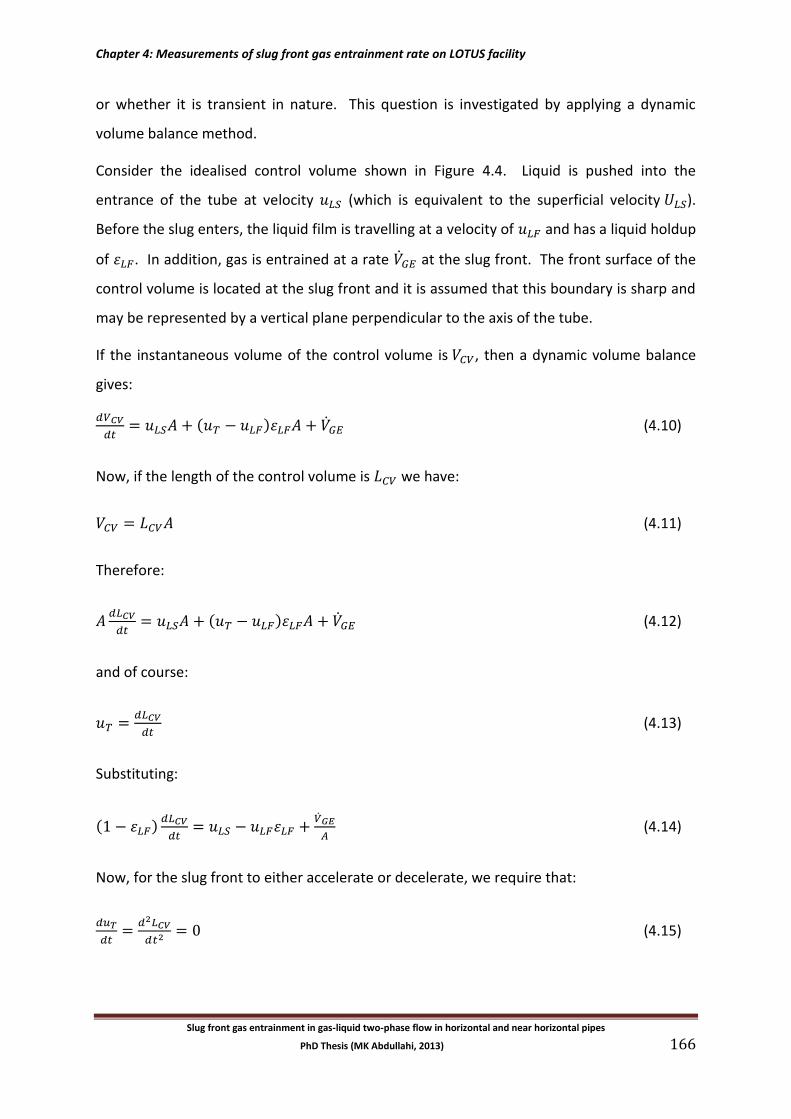
Chapter 4: Measurements of slug front gas entrainment rate on LOTUS facility
Slug front gas entrainment in gas-liquid two-phase flow in horizontal and near horizontal pipes
PhD Thesis (MK Abdullahi, 2013) 166
or whether it is transient in nature. This question is investigated by applying a dynamic
volume balance method.
Consider the idealised control volume shown in Figure 4.4. Liquid is pushed into the
entrance of the tube at velocity (which is equivalent to the superficial velocity ).
Before the slug enters, the liquid film is travelling at a velocity of and has a liquid holdup
of . In addition, gas is entrained at a rate at the slug front. The front surface of the
control volume is located at the slug front and it is assumed that this boundary is sharp and
may be represented by a vertical plane perpendicular to the axis of the tube.
If the instantaneous volume of the control volume is , then a dynamic volume balance
gives:
( ) (4.10)
Now, if the length of the control volume is we have:
(4.11)
Therefore:
( ) (4.12)
and of course:
(4.13)
Substituting:
( )
(4.14)
Now, for the slug front to either accelerate or decelerate, we require that:
(4.15)
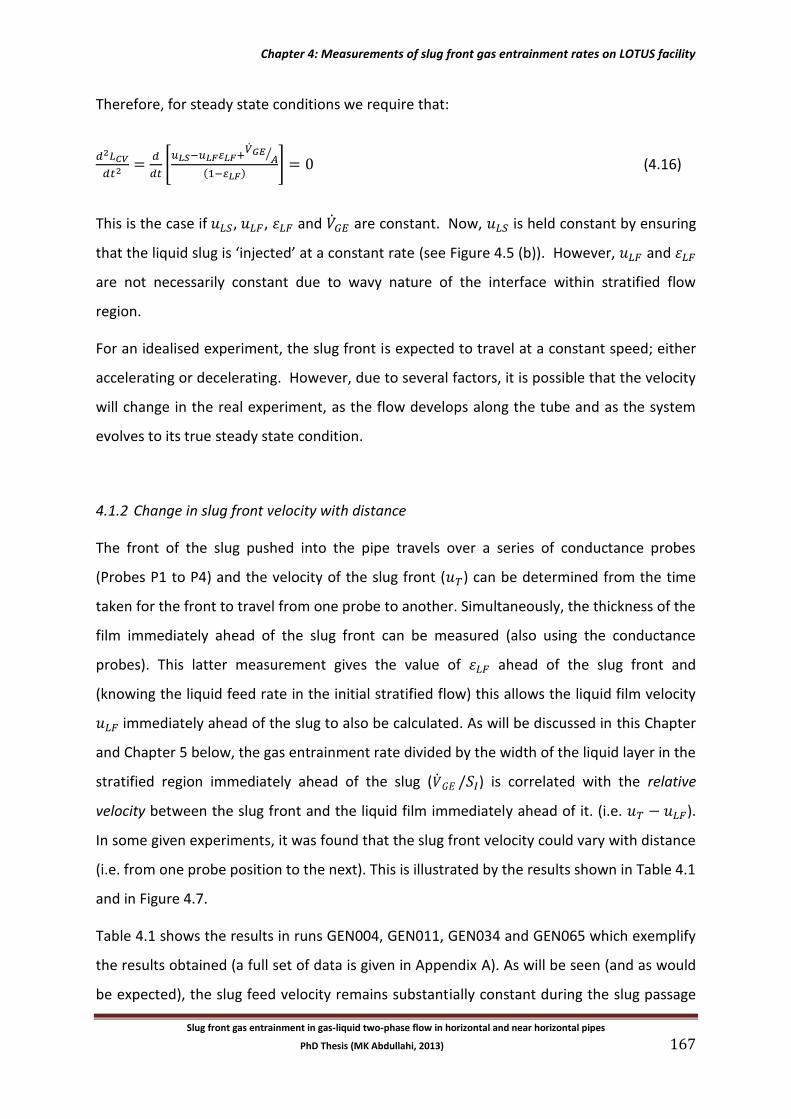
Chapter 4: Measurements of slug front gas entrainment rates on LOTUS facility
Slug front gas entrainment in gas-liquid two-phase flow in horizontal and near horizontal pipes
PhD Thesis (MK Abdullahi, 2013) 167
Therefore, for steady state conditions we require that:
[
⁄
( )] (4.16)
This is the case if , , and are constant. Now, is held constant by ensuring
that the liquid slug is ‘injected’ at a constant rate (see Figure 4.5 (b)). However, and
are not necessarily constant due to wavy nature of the interface within stratified flow
region.
For an idealised experiment, the slug front is expected to travel at a constant speed; either
accelerating or decelerating. However, due to several factors, it is possible that the velocity
will change in the real experiment, as the flow develops along the tube and as the system
evolves to its true steady state condition.
4.1.2 Change in slug front velocity with distance
The front of the slug pushed into the pipe travels over a series of conductance probes
(Probes P1 to P4) and the velocity of the slug front ( ) can be determined from the time
taken for the front to travel from one probe to another. Simultaneously, the thickness of the
film immediately ahead of the slug front can be measured (also using the conductance
probes). This latter measurement gives the value of ahead of the slug front and
(knowing the liquid feed rate in the initial stratified flow) this allows the liquid film velocity
immediately ahead of the slug to also be calculated. As will be discussed in this Chapter
and Chapter 5 below, the gas entrainment rate divided by the width of the liquid layer in the
stratified region immediately ahead of the slug ( ) is correlated with the relative
velocity between the slug front and the liquid film immediately ahead of it. (i.e. ).
In some given experiments, it was found that the slug front velocity could vary with distance
(i.e. from one probe position to the next). This is illustrated by the results shown in Table 4.1
and in Figure 4.7.
Table 4.1 shows the results in runs GEN004, GEN011, GEN034 and GEN065 which exemplify
the results obtained (a full set of data is given in Appendix A). As will be seen (and as would
be expected), the slug feed velocity remains substantially constant during the slug passage
Chapter 4: Measurements of slug front gas entrainment rate on LOTUS facility
Slug front gas entrainment in gas-liquid two-phase flow in horizontal and near horizontal pipes
PhD Thesis (MK Abdullahi, 2013) 168
along the channel (there is a slight decrease with slug front position - i.e, with time - as the
driving pressure decreases slightly as the liquids feed reservoir is depleted). However, the
slug front velocity increases significantly with distance travelled by the slug front,
particularly at high gas velocity in the initial stratified flow condition (Azzopardi and Wren
(2004) also observed, after careful examination of previous work on annular flow, that
entrained fraction increases with gas flow rate). However, when the results shown in Table
4.1 are plotted in terms of the parameters used in the new correlation for gas entrainment
(i.e. plotting against ) they fall close to the correlating line as is indicated in
Figure 4.8. The explanation of the effect of distance is that the slug front accelerates along
the pipe and this increases the gas entrainment rate. The relative velocity between the slug
front and the liquid layer ahead of the slug also increases and the correlation between
and is maintained. Therefore, the flows may be transient in nature.
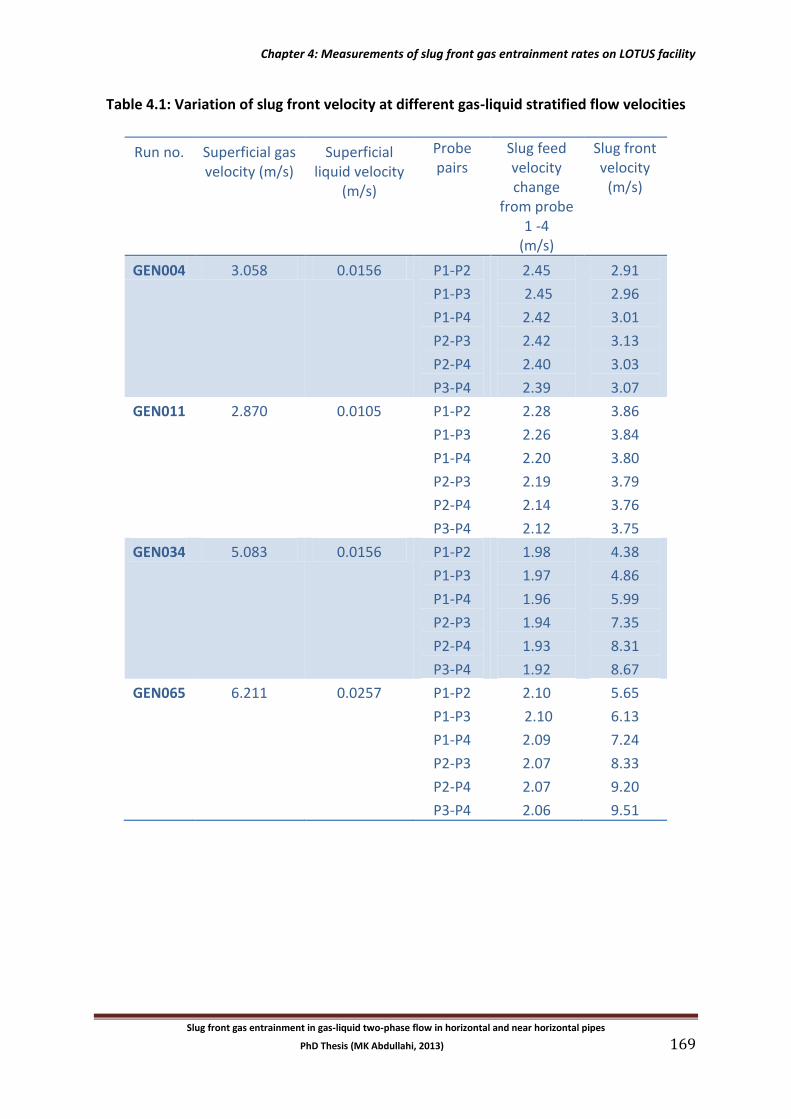
Chapter 4: Measurements of slug front gas entrainment rates on LOTUS facility
Slug front gas entrainment in gas-liquid two-phase flow in horizontal and near horizontal pipes
PhD Thesis (MK Abdullahi, 2013) 169
Table 4.1: Variation of slug front velocity at different gas-liquid stratified flow velocities
Run no. Superficial gas velocity (m/s)
Superficial liquid velocity
(m/s)
Probe pairs
Slug feed velocity change
from probe 1 -4
(m/s)
Slug front velocity
(m/s)
GEN004 3.058 0.0156 P1-P2
P1-P3
P1-P4
P2-P3
P2-P4
P3-P4
2.45
2.45
2.42
2.42
2.40
2.39
2.91
2.96
3.01
3.13
3.03
3.07
GEN011 2.870 0.0105 P1-P2
P1-P3
P1-P4
P2-P3
P2-P4
P3-P4
2.28
2.26
2.20
2.19
2.14
2.12
3.86
3.84
3.80
3.79
3.76
3.75
GEN034 5.083 0.0156 P1-P2
P1-P3
P1-P4
P2-P3
P2-P4
P3-P4
1.98
1.97
1.96
1.94
1.93
1.92
4.38
4.86
5.99
7.35
8.31
8.67
GEN065 6.211 0.0257 P1-P2
P1-P3
P1-P4
P2-P3
P2-P4
P3-P4
2.10
2.10
2.09
2.07
2.07
2.06
5.65
6.13
7.24
8.33
9.20
9.51
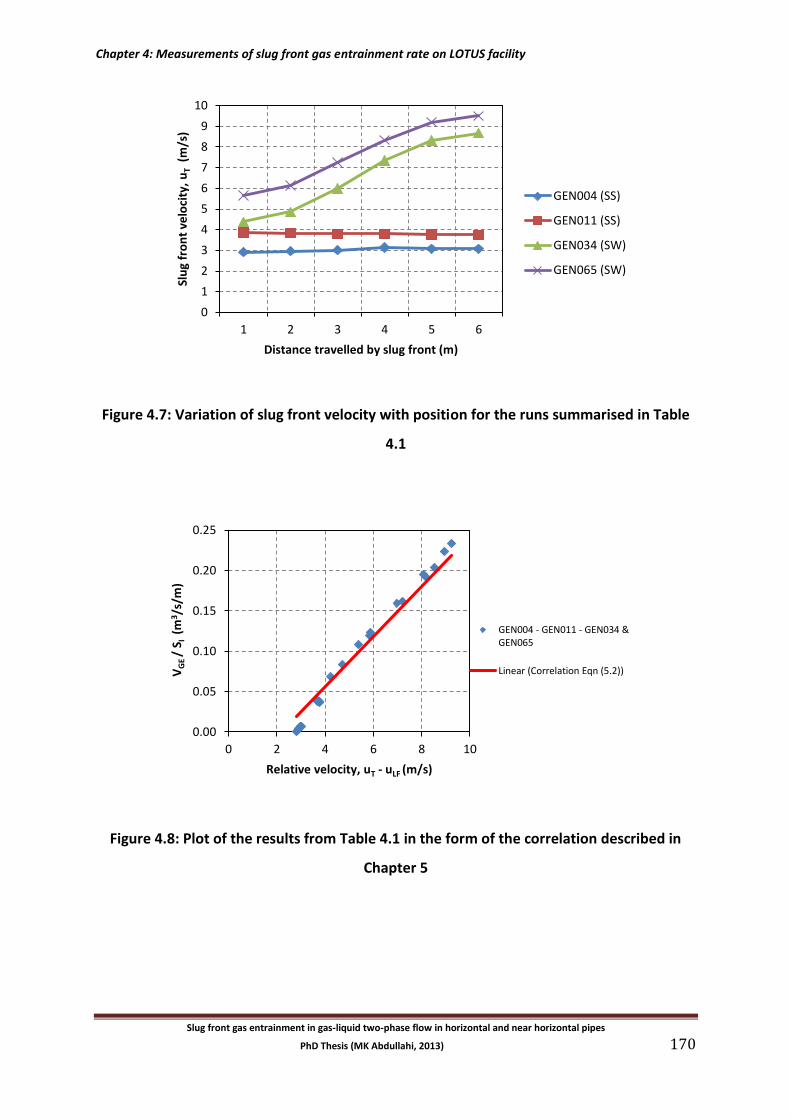
Chapter 4: Measurements of slug front gas entrainment rate on LOTUS facility
Slug front gas entrainment in gas-liquid two-phase flow in horizontal and near horizontal pipes
PhD Thesis (MK Abdullahi, 2013) 170
Figure 4.7: Variation of slug front velocity with position for the runs summarised in Table
4.1
Figure 4.8: Plot of the results from Table 4.1 in the form of the correlation described in
Chapter 5
0
1
2
3
4
5
6
7
8
9
10
1 2 3 4 5 6
Slu
g fr
on
t ve
loci
ty,
uT
(m
/s)
Distance travelled by slug front (m)
GEN004 (SS)
GEN011 (SS)
GEN034 (SW)
GEN065 (SW)
0.00
0.05
0.10
0.15
0.20
0.25
0 2 4 6 8 10
VG
E /
S I (
m3/s
/m)
Relative velocity, uT - uLF (m/s)
GEN004 - GEN011 - GEN034 &GEN065
Linear (Correlation Eqn (5.2))
Chapter 4: Measurements of slug front gas entrainment rates on LOTUS facility
Slug front gas entrainment in gas-liquid two-phase flow in horizontal and near horizontal pipes
PhD Thesis (MK Abdullahi, 2013) 171
4.1.3 Error analysis of experimental measurements
The measured variables all have measurement error associated with them. The overall
maximum error in the calculated gas entrainment rate can be determined using the
chain rule.
Using Eqn. (4.8), the error in first term is estimated by partial differentiation as:
[ ( )]
[ ( ) ( ) ] (4.17)
The second term, slug feed velocity is given by,
[ ] (4.18)
The third term, liquid film velocity is given by,
[ ] (4.19)
Therefore, the overall error in the calculated gas entrainment rate is,
[ ( ) ( )
] (4.20)
The error bars in the abscissa direction are calculated from:
(4.21)
Similarly, the maximum error in the velocity difference ( ) can be calculated from
errors in , , and .
(4.22)
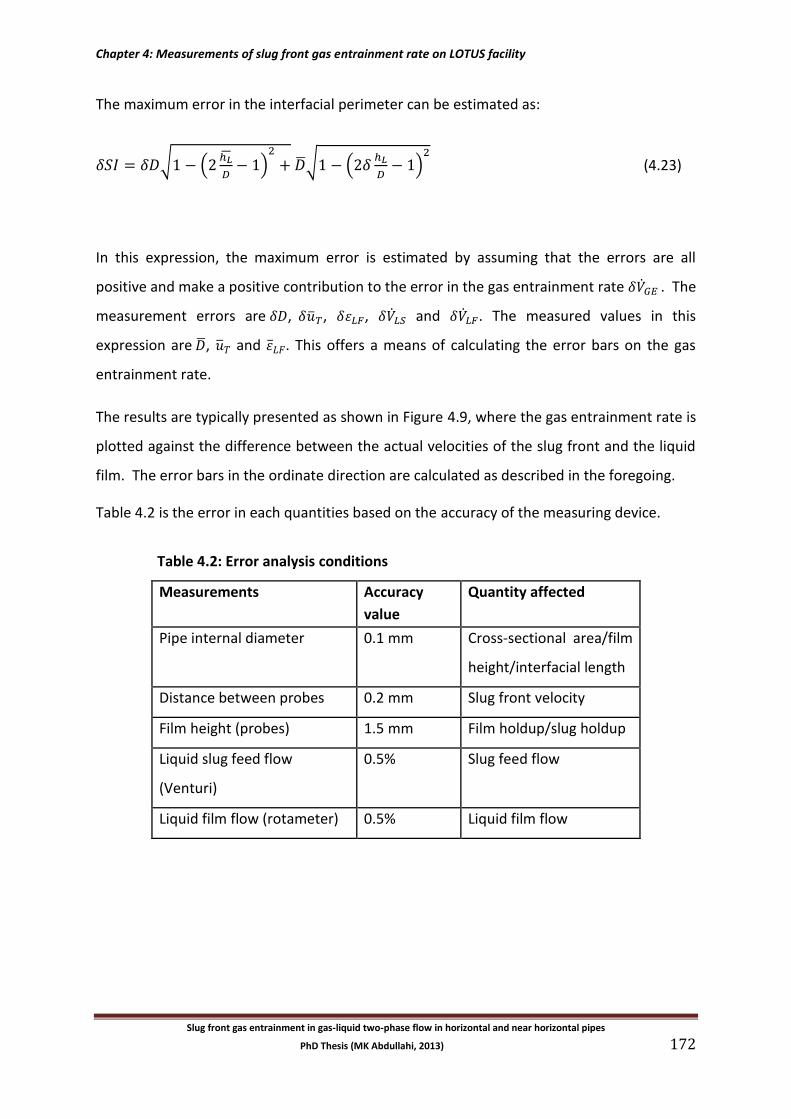
Chapter 4: Measurements of slug front gas entrainment rate on LOTUS facility
Slug front gas entrainment in gas-liquid two-phase flow in horizontal and near horizontal pipes
PhD Thesis (MK Abdullahi, 2013) 172
The maximum error in the interfacial perimeter can be estimated as:
√ (
)
√ (
)
(4.23)
In this expression, the maximum error is estimated by assuming that the errors are all
positive and make a positive contribution to the error in the gas entrainment rate . The
measurement errors are , , , and . The measured values in this
expression are , and . This offers a means of calculating the error bars on the gas
entrainment rate.
The results are typically presented as shown in Figure 4.9, where the gas entrainment rate is
plotted against the difference between the actual velocities of the slug front and the liquid
film. The error bars in the ordinate direction are calculated as described in the foregoing.
Table 4.2 is the error in each quantities based on the accuracy of the measuring device.
Table 4.2: Error analysis conditions
Measurements Accuracy
value
Quantity affected
Pipe internal diameter 0.1 mm Cross-sectional area/film
height/interfacial length
Distance between probes 0.2 mm Slug front velocity
Film height (probes) 1.5 mm Film holdup/slug holdup
Liquid slug feed flow
(Venturi)
0.5% Slug feed flow
Liquid film flow (rotameter) 0.5% Liquid film flow
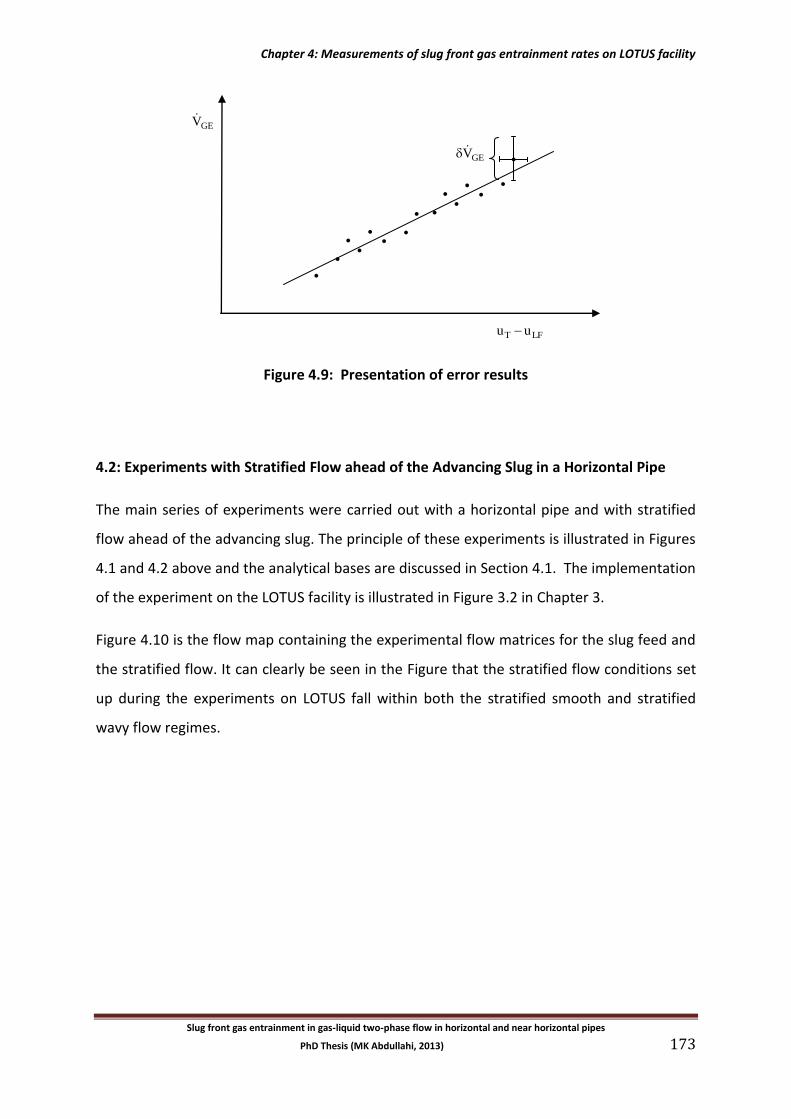
Chapter 4: Measurements of slug front gas entrainment rates on LOTUS facility
Slug front gas entrainment in gas-liquid two-phase flow in horizontal and near horizontal pipes
PhD Thesis (MK Abdullahi, 2013) 173
Figure 4.9: Presentation of error results
4.2: Experiments with Stratified Flow ahead of the Advancing Slug in a Horizontal Pipe
The main series of experiments were carried out with a horizontal pipe and with stratified
flow ahead of the advancing slug. The principle of these experiments is illustrated in Figures
4.1 and 4.2 above and the analytical bases are discussed in Section 4.1. The implementation
of the experiment on the LOTUS facility is illustrated in Figure 3.2 in Chapter 3.
Figure 4.10 is the flow map containing the experimental flow matrices for the slug feed and
the stratified flow. It can clearly be seen in the Figure that the stratified flow conditions set
up during the experiments on LOTUS fall within both the stratified smooth and stratified
wavy flow regimes.
GEV
LFT uu
GEV
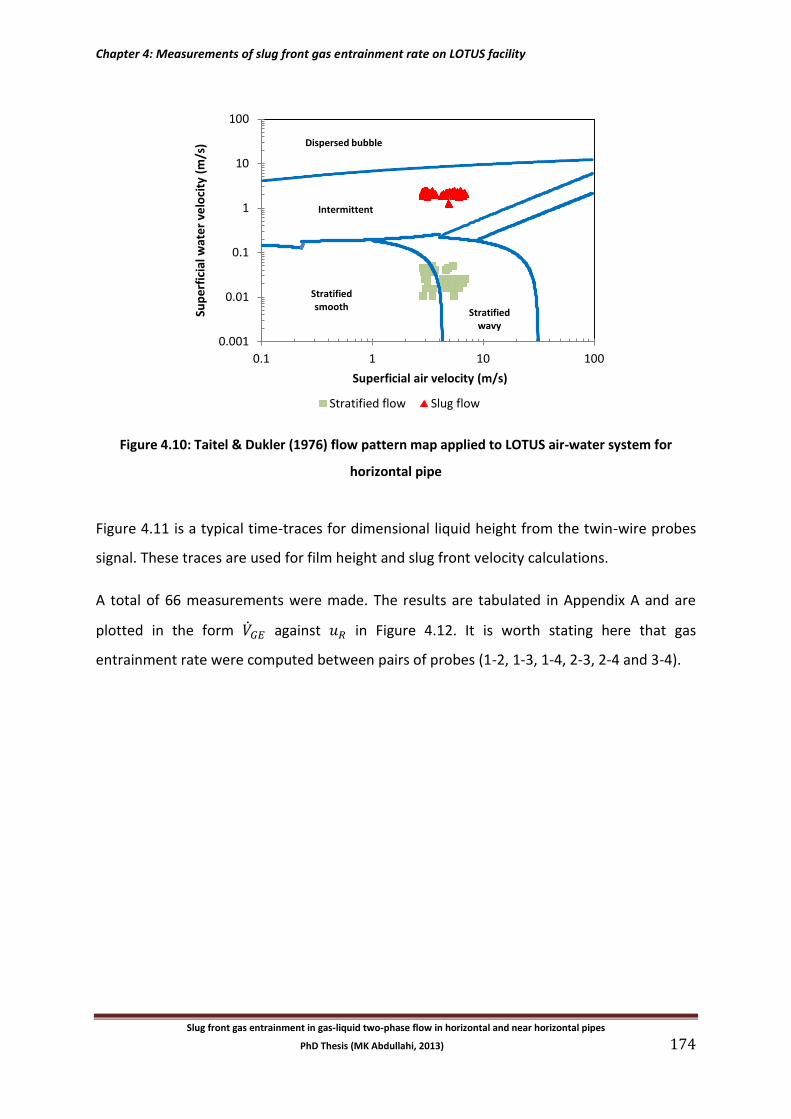
Chapter 4: Measurements of slug front gas entrainment rate on LOTUS facility
Slug front gas entrainment in gas-liquid two-phase flow in horizontal and near horizontal pipes
PhD Thesis (MK Abdullahi, 2013) 174
Figure 4.10: Taitel & Dukler (1976) flow pattern map applied to LOTUS air-water system for
horizontal pipe
Figure 4.11 is a typical time-traces for dimensional liquid height from the twin-wire probes
signal. These traces are used for film height and slug front velocity calculations.
A total of 66 measurements were made. The results are tabulated in Appendix A and are
plotted in the form against in Figure 4.12. It is worth stating here that gas
entrainment rate were computed between pairs of probes (1-2, 1-3, 1-4, 2-3, 2-4 and 3-4).
0.001
0.01
0.1
1
10
100
0.1 1 10 100
Sup
erf
icia
l wat
er
velo
city
(m
/s)
Superficial air velocity (m/s)
Stratified flow Slug flow
Dispersed bubble
Intermittent
Stratified smooth
Stratified wavy
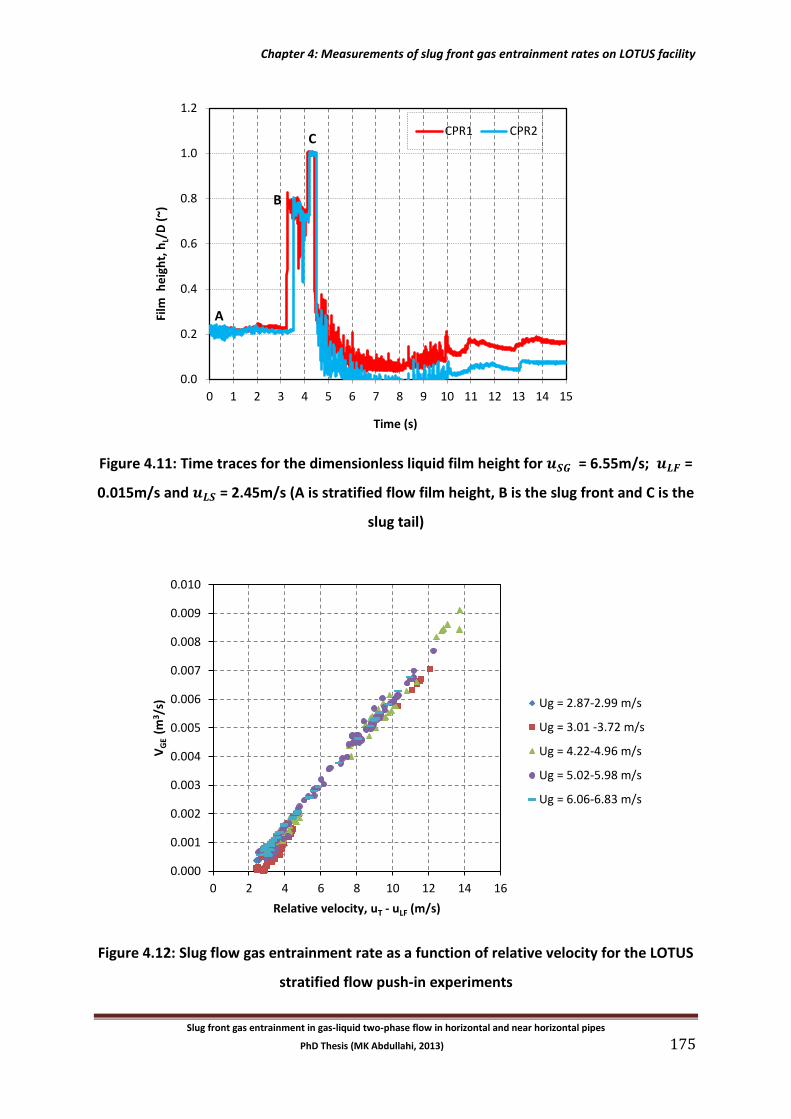
Chapter 4: Measurements of slug front gas entrainment rates on LOTUS facility
Slug front gas entrainment in gas-liquid two-phase flow in horizontal and near horizontal pipes
PhD Thesis (MK Abdullahi, 2013) 175
Figure 4.11: Time traces for the dimensionless liquid film height for = 6.55m/s; =
0.015m/s and = 2.45m/s (A is stratified flow film height, B is the slug front and C is the
slug tail)
Figure 4.12: Slug flow gas entrainment rate as a function of relative velocity for the LOTUS
stratified flow push-in experiments
0.0
0.2
0.4
0.6
0.8
1.0
1.2
0 1 2 3 4 5 6 7 8 9 10 11 12 13 14 15
Film
he
igh
t, h
L/D
(~)
Time (s)
CPR1 CPR2
A
B
C
0.000
0.001
0.002
0.003
0.004
0.005
0.006
0.007
0.008
0.009
0.010
0 2 4 6 8 10 12 14 16
VG
E (m
3 /s)
Relative velocity, uT - uLF (m/s)
Ug = 2.87-2.99 m/s
Ug = 3.01 -3.72 m/s
Ug = 4.22-4.96 m/s
Ug = 5.02-5.98 m/s
Ug = 6.06-6.83 m/s
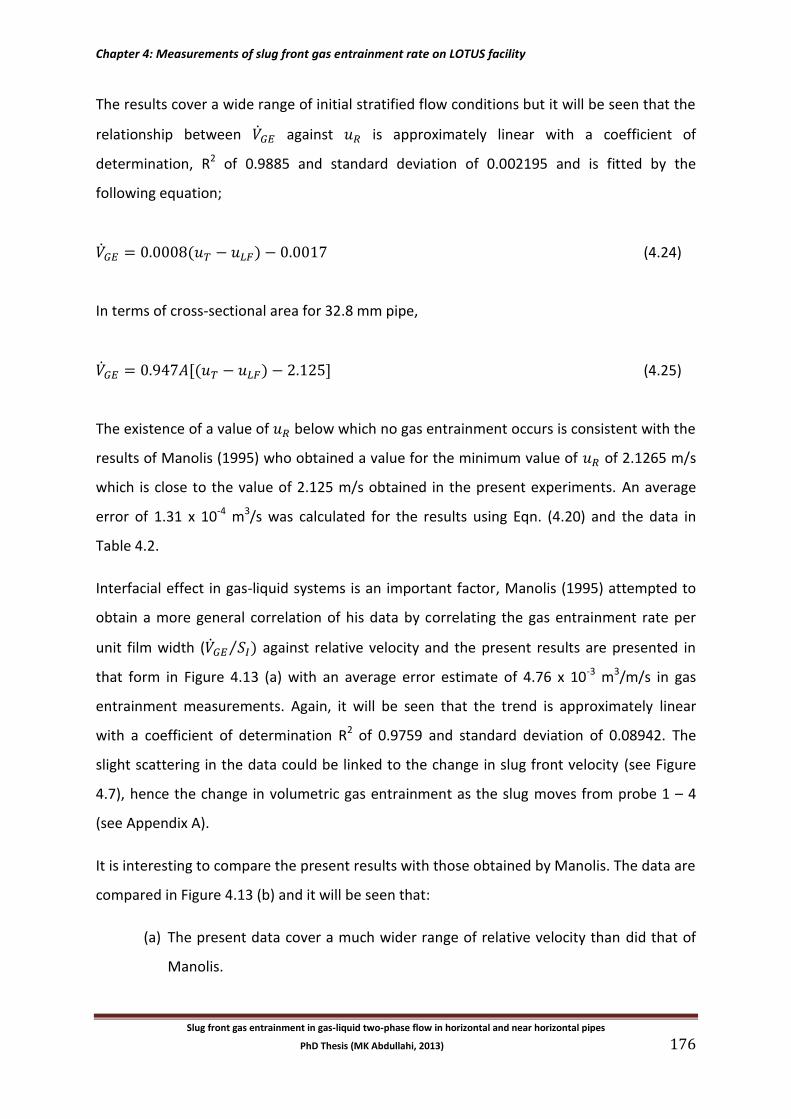
Chapter 4: Measurements of slug front gas entrainment rate on LOTUS facility
Slug front gas entrainment in gas-liquid two-phase flow in horizontal and near horizontal pipes
PhD Thesis (MK Abdullahi, 2013) 176
The results cover a wide range of initial stratified flow conditions but it will be seen that the
relationship between against is approximately linear with a coefficient of
determination, R2 of 0.9885 and standard deviation of 0.002195 and is fitted by the
following equation;
( ) (4.24)
In terms of cross-sectional area for 32.8 mm pipe,
[( ) ] (4.25)
The existence of a value of below which no gas entrainment occurs is consistent with the
results of Manolis (1995) who obtained a value for the minimum value of of 2.1265 m/s
which is close to the value of 2.125 m/s obtained in the present experiments. An average
error of 1.31 x 10⁻⁴ m3/s was calculated for the results using Eqn. (4.20) and the data in
Table 4.2.
Interfacial effect in gas-liquid systems is an important factor, Manolis (1995) attempted to
obtain a more general correlation of his data by correlating the gas entrainment rate per
unit film width ( )⁄ against relative velocity and the present results are presented in
that form in Figure 4.13 (a) with an average error estimate of 4.76 x 10⁻³ m3/m/s in gas
entrainment measurements. Again, it will be seen that the trend is approximately linear
with a coefficient of determination R2 of 0.9759 and standard deviation of 0.08942. The
slight scattering in the data could be linked to the change in slug front velocity (see Figure
4.7), hence the change in volumetric gas entrainment as the slug moves from probe 1 – 4
(see Appendix A).
It is interesting to compare the present results with those obtained by Manolis. The data are
compared in Figure 4.13 (b) and it will be seen that:
(a) The present data cover a much wider range of relative velocity than did that of
Manolis.
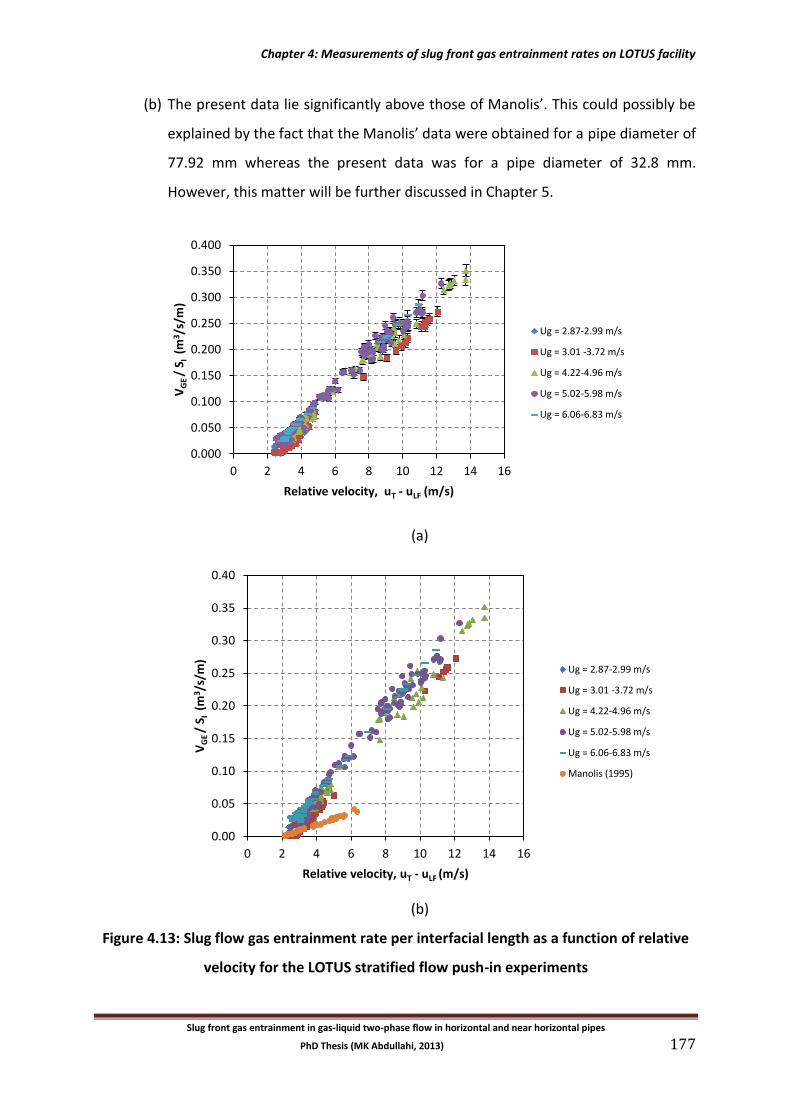
Chapter 4: Measurements of slug front gas entrainment rates on LOTUS facility
Slug front gas entrainment in gas-liquid two-phase flow in horizontal and near horizontal pipes
PhD Thesis (MK Abdullahi, 2013) 177
(b) The present data lie significantly above those of Manolis’. This could possibly be
explained by the fact that the Manolis’ data were obtained for a pipe diameter of
77.92 mm whereas the present data was for a pipe diameter of 32.8 mm.
However, this matter will be further discussed in Chapter 5.
(a)
(b)
Figure 4.13: Slug flow gas entrainment rate per interfacial length as a function of relative
velocity for the LOTUS stratified flow push-in experiments
0.000
0.050
0.100
0.150
0.200
0.250
0.300
0.350
0.400
0 2 4 6 8 10 12 14 16
VG
E /
S I (
m3 /
s/m
)
Relative velocity, uT - uLF (m/s)
Ug = 2.87-2.99 m/s
Ug = 3.01 -3.72 m/s
Ug = 4.22-4.96 m/s
Ug = 5.02-5.98 m/s
Ug = 6.06-6.83 m/s
0.00
0.05
0.10
0.15
0.20
0.25
0.30
0.35
0.40
0 2 4 6 8 10 12 14 16
VG
E /
S I (
m3 /
s/m
)
Relative velocity, uT - uLF (m/s)
Ug = 2.87-2.99 m/s
Ug = 3.01 -3.72 m/s
Ug = 4.22-4.96 m/s
Ug = 5.02-5.98 m/s
Ug = 6.06-6.83 m/s
Manolis (1995)
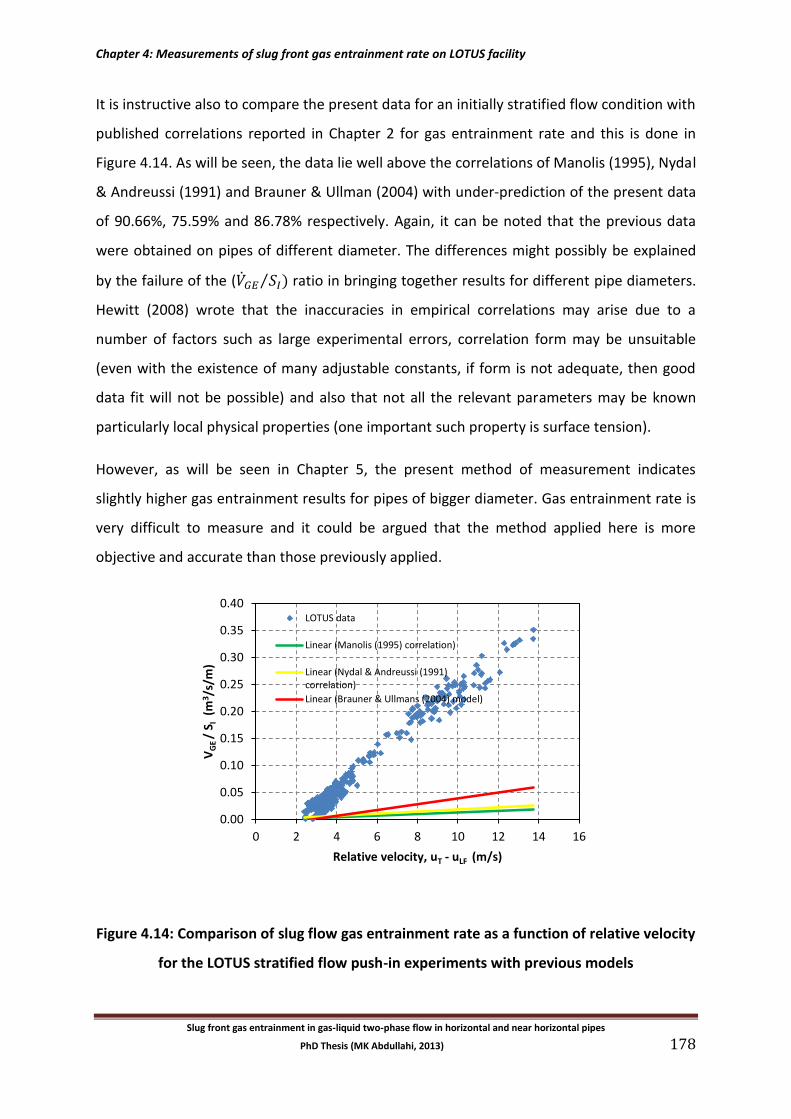
Chapter 4: Measurements of slug front gas entrainment rate on LOTUS facility
Slug front gas entrainment in gas-liquid two-phase flow in horizontal and near horizontal pipes
PhD Thesis (MK Abdullahi, 2013) 178
It is instructive also to compare the present data for an initially stratified flow condition with
published correlations reported in Chapter 2 for gas entrainment rate and this is done in
Figure 4.14. As will be seen, the data lie well above the correlations of Manolis (1995), Nydal
& Andreussi (1991) and Brauner & Ullman (2004) with under-prediction of the present data
of 90.66%, 75.59% and 86.78% respectively. Again, it can be noted that the previous data
were obtained on pipes of different diameter. The differences might possibly be explained
by the failure of the ( )⁄ ratio in bringing together results for different pipe diameters.
Hewitt (2008) wrote that the inaccuracies in empirical correlations may arise due to a
number of factors such as large experimental errors, correlation form may be unsuitable
(even with the existence of many adjustable constants, if form is not adequate, then good
data fit will not be possible) and also that not all the relevant parameters may be known
particularly local physical properties (one important such property is surface tension).
However, as will be seen in Chapter 5, the present method of measurement indicates
slightly higher gas entrainment results for pipes of bigger diameter. Gas entrainment rate is
very difficult to measure and it could be argued that the method applied here is more
objective and accurate than those previously applied.
Figure 4.14: Comparison of slug flow gas entrainment rate as a function of relative velocity
for the LOTUS stratified flow push-in experiments with previous models
0.00
0.05
0.10
0.15
0.20
0.25
0.30
0.35
0.40
0 2 4 6 8 10 12 14 16
VG
E /
S I (
m3 /
s/m
)
Relative velocity, uT - uLF (m/s)
LOTUS data
Linear (Manolis (1995) correlation)
Linear (Nydal & Andreussi (1991)correlation)
Linear (Brauner & Ullmans (2004) model)
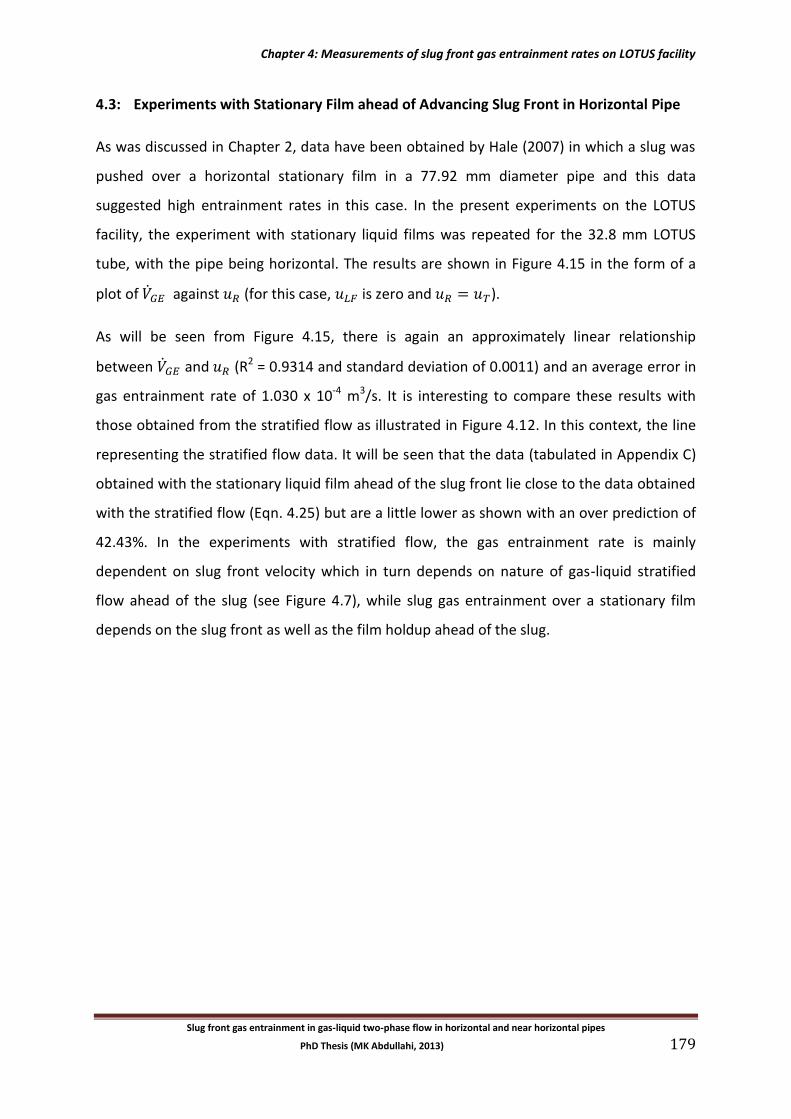
Chapter 4: Measurements of slug front gas entrainment rates on LOTUS facility
Slug front gas entrainment in gas-liquid two-phase flow in horizontal and near horizontal pipes
PhD Thesis (MK Abdullahi, 2013) 179
4.3: Experiments with Stationary Film ahead of Advancing Slug Front in Horizontal Pipe
As was discussed in Chapter 2, data have been obtained by Hale (2007) in which a slug was
pushed over a horizontal stationary film in a 77.92 mm diameter pipe and this data
suggested high entrainment rates in this case. In the present experiments on the LOTUS
facility, the experiment with stationary liquid films was repeated for the 32.8 mm LOTUS
tube, with the pipe being horizontal. The results are shown in Figure 4.15 in the form of a
plot of against (for this case, is zero and ).
As will be seen from Figure 4.15, there is again an approximately linear relationship
between and (R2 = 0.9314 and standard deviation of 0.0011) and an average error in
gas entrainment rate of 1.030 x 10⁻⁴ m3/s. It is interesting to compare these results with
those obtained from the stratified flow as illustrated in Figure 4.12. In this context, the line
representing the stratified flow data. It will be seen that the data (tabulated in Appendix C)
obtained with the stationary liquid film ahead of the slug front lie close to the data obtained
with the stratified flow (Eqn. 4.25) but are a little lower as shown with an over prediction of
42.43%. In the experiments with stratified flow, the gas entrainment rate is mainly
dependent on slug front velocity which in turn depends on nature of gas-liquid stratified
flow ahead of the slug (see Figure 4.7), while slug gas entrainment over a stationary film
depends on the slug front as well as the film holdup ahead of the slug.
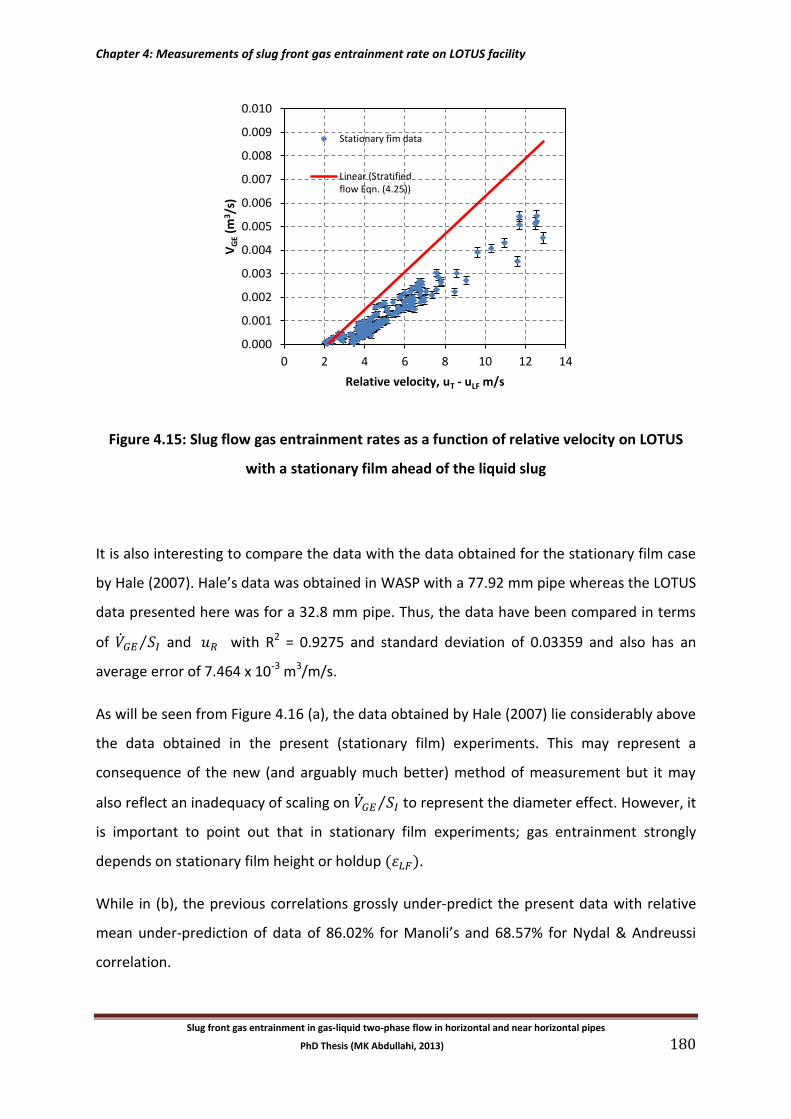
Chapter 4: Measurements of slug front gas entrainment rate on LOTUS facility
Slug front gas entrainment in gas-liquid two-phase flow in horizontal and near horizontal pipes
PhD Thesis (MK Abdullahi, 2013) 180
Figure 4.15: Slug flow gas entrainment rates as a function of relative velocity on LOTUS
with a stationary film ahead of the liquid slug
It is also interesting to compare the data with the data obtained for the stationary film case
by Hale (2007). Hale’s data was obtained in WASP with a 77.92 mm pipe whereas the LOTUS
data presented here was for a 32.8 mm pipe. Thus, the data have been compared in terms
of ⁄ and with R2 = 0.9275 and standard deviation of 0.03359 and also has an
average error of 7.464 x 10⁻³ m3/m/s.
As will be seen from Figure 4.16 (a), the data obtained by Hale (2007) lie considerably above
the data obtained in the present (stationary film) experiments. This may represent a
consequence of the new (and arguably much better) method of measurement but it may
also reflect an inadequacy of scaling on ⁄ to represent the diameter effect. However, it
is important to point out that in stationary film experiments; gas entrainment strongly
depends on stationary film height or holdup ( ).
While in (b), the previous correlations grossly under-predict the present data with relative
mean under-prediction of data of 86.02% for Manoli’s and 68.57% for Nydal & Andreussi
correlation.
0.000
0.001
0.002
0.003
0.004
0.005
0.006
0.007
0.008
0.009
0.010
0 2 4 6 8 10 12 14
VG
E (m
3 /s)
Relative velocity, uT - uLF m/s
Stationary fim data
Linear (Stratifiedflow Eqn. (4.25))
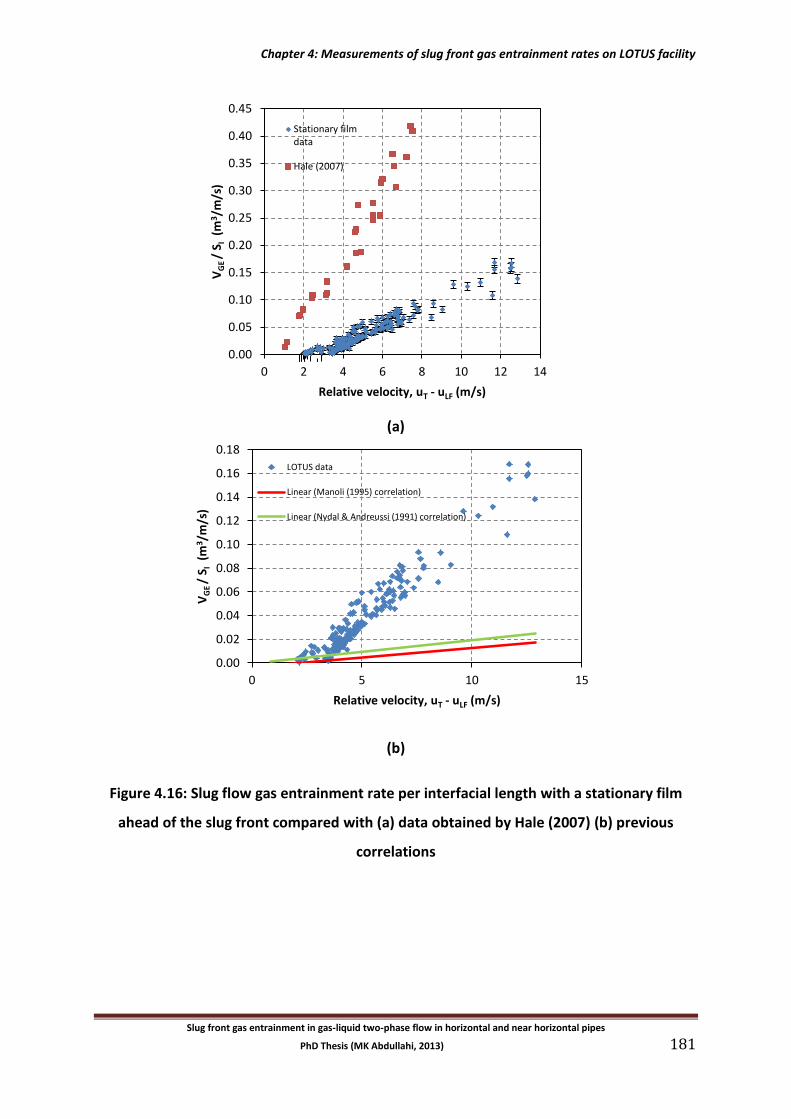
Chapter 4: Measurements of slug front gas entrainment rates on LOTUS facility
Slug front gas entrainment in gas-liquid two-phase flow in horizontal and near horizontal pipes
PhD Thesis (MK Abdullahi, 2013) 181
(a)
(b)
Figure 4.16: Slug flow gas entrainment rate per interfacial length with a stationary film
ahead of the slug front compared with (a) data obtained by Hale (2007) (b) previous
correlations
0.00
0.02
0.04
0.06
0.08
0.10
0.12
0.14
0.16
0.18
0 5 10 15
VG
E /
S I (
m3 /
m/s
)
Relative velocity, uT - uLF (m/s)
LOTUS data
Linear (Manoli (1995) correlation)
Linear (Nydal & Andreussi (1991) correlation)
0.00
0.05
0.10
0.15
0.20
0.25
0.30
0.35
0.40
0.45
0 2 4 6 8 10 12 14
VG
E /
S I (
m3/m
/s)
Relative velocity, uT - uLF (m/s)
Stationary filmdata
Hale (2007)
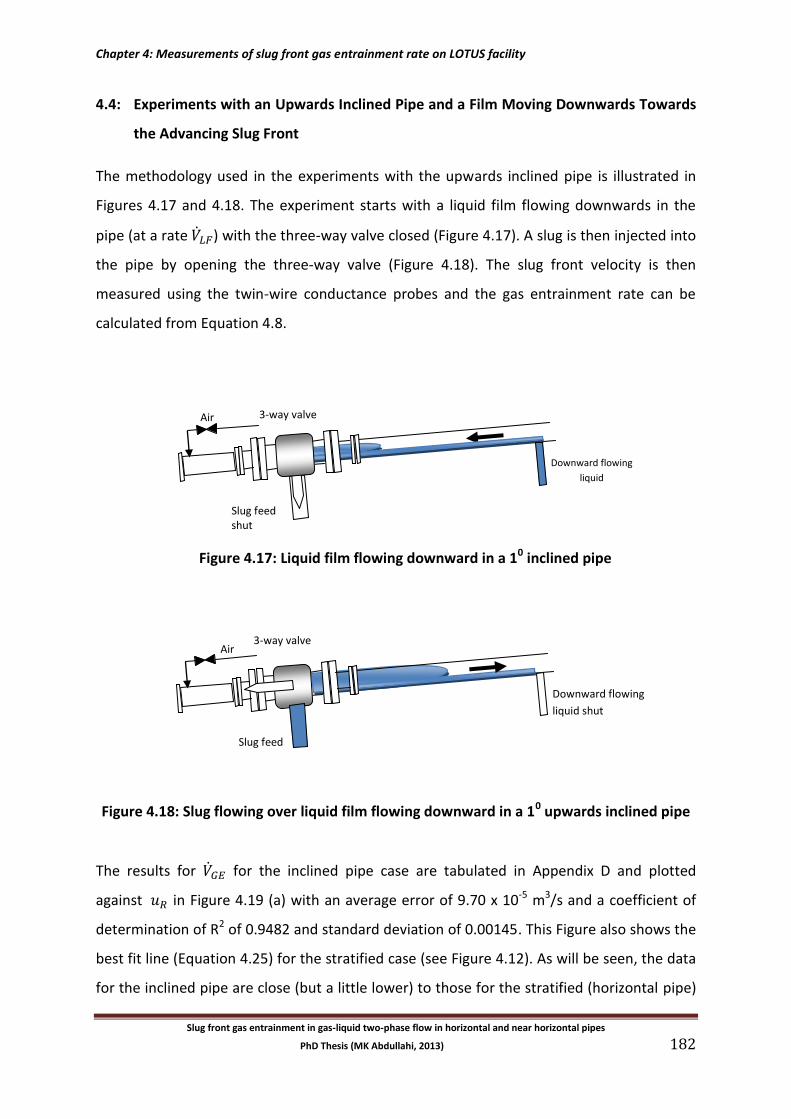
Chapter 4: Measurements of slug front gas entrainment rate on LOTUS facility
Slug front gas entrainment in gas-liquid two-phase flow in horizontal and near horizontal pipes
PhD Thesis (MK Abdullahi, 2013) 182
4.4: Experiments with an Upwards Inclined Pipe and a Film Moving Downwards Towards
the Advancing Slug Front
The methodology used in the experiments with the upwards inclined pipe is illustrated in
Figures 4.17 and 4.18. The experiment starts with a liquid film flowing downwards in the
pipe (at a rate ) with the three-way valve closed (Figure 4.17). A slug is then injected into
the pipe by opening the three-way valve (Figure 4.18). The slug front velocity is then
measured using the twin-wire conductance probes and the gas entrainment rate can be
calculated from Equation 4.8.
Figure 4.17: Liquid film flowing downward in a 10 inclined pipe
Figure 4.18: Slug flowing over liquid film flowing downward in a 10 upwards inclined pipe
The results for for the inclined pipe case are tabulated in Appendix D and plotted
against in Figure 4.19 (a) with an average error of 9.70 x 10⁻⁵ m3/s and a coefficient of
determination of R2 of 0.9482 and standard deviation of 0.00145. This Figure also shows the
best fit line (Equation 4.25) for the stratified case (see Figure 4.12). As will be seen, the data
for the inclined pipe are close (but a little lower) to those for the stratified (horizontal pipe)
Downward flowing
liquid shut
Downward flowing
liquid
3-way valve
Slug feed shut
Air
Air
Slug feed
3-way valve
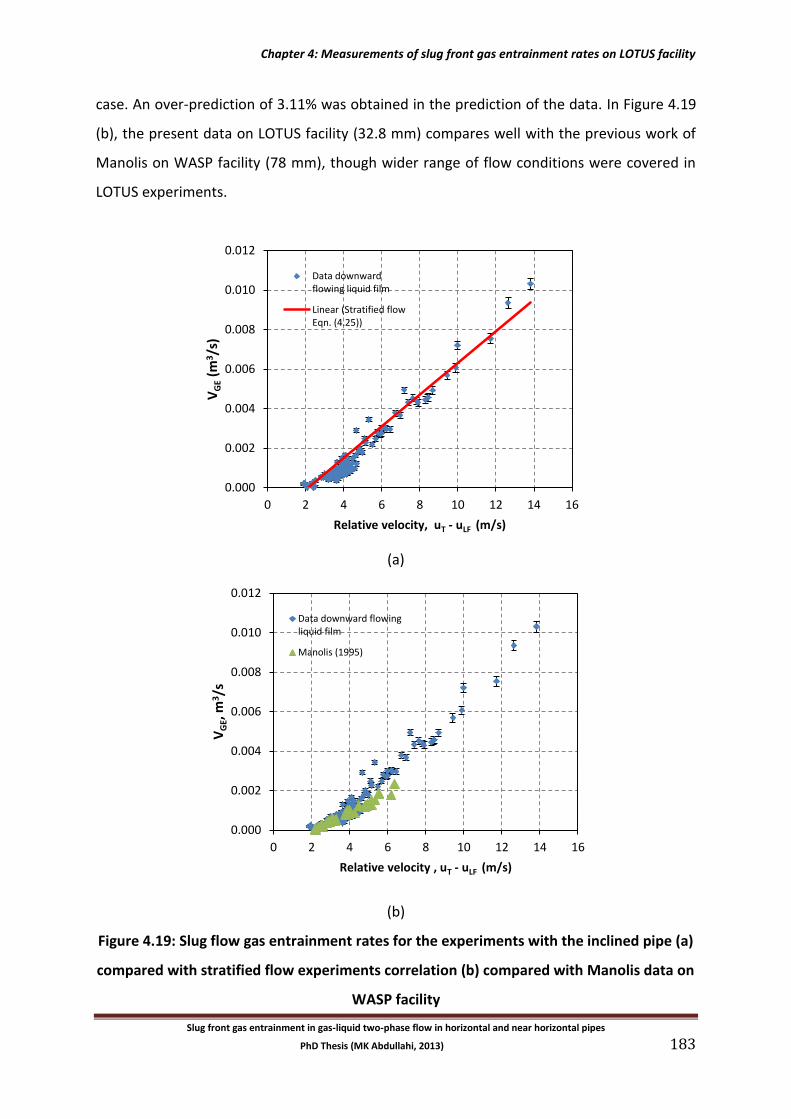
Chapter 4: Measurements of slug front gas entrainment rates on LOTUS facility
Slug front gas entrainment in gas-liquid two-phase flow in horizontal and near horizontal pipes
PhD Thesis (MK Abdullahi, 2013) 183
case. An over-prediction of 3.11% was obtained in the prediction of the data. In Figure 4.19
(b), the present data on LOTUS facility (32.8 mm) compares well with the previous work of
Manolis on WASP facility (78 mm), though wider range of flow conditions were covered in
LOTUS experiments.
(a)
(b)
Figure 4.19: Slug flow gas entrainment rates for the experiments with the inclined pipe (a)
compared with stratified flow experiments correlation (b) compared with Manolis data on
WASP facility
0.000
0.002
0.004
0.006
0.008
0.010
0.012
0 2 4 6 8 10 12 14 16
VG
E, m
3/s
Relative velocity , uT - uLF (m/s)
Data downward flowingliquid film
Manolis (1995)
0.000
0.002
0.004
0.006
0.008
0.010
0.012
0 2 4 6 8 10 12 14 16
VG
E (m
3/s
)
Relative velocity, uT - uLF (m/s)
Data downwardflowing liquid film
Linear (Stratified flowEqn. (4.25))
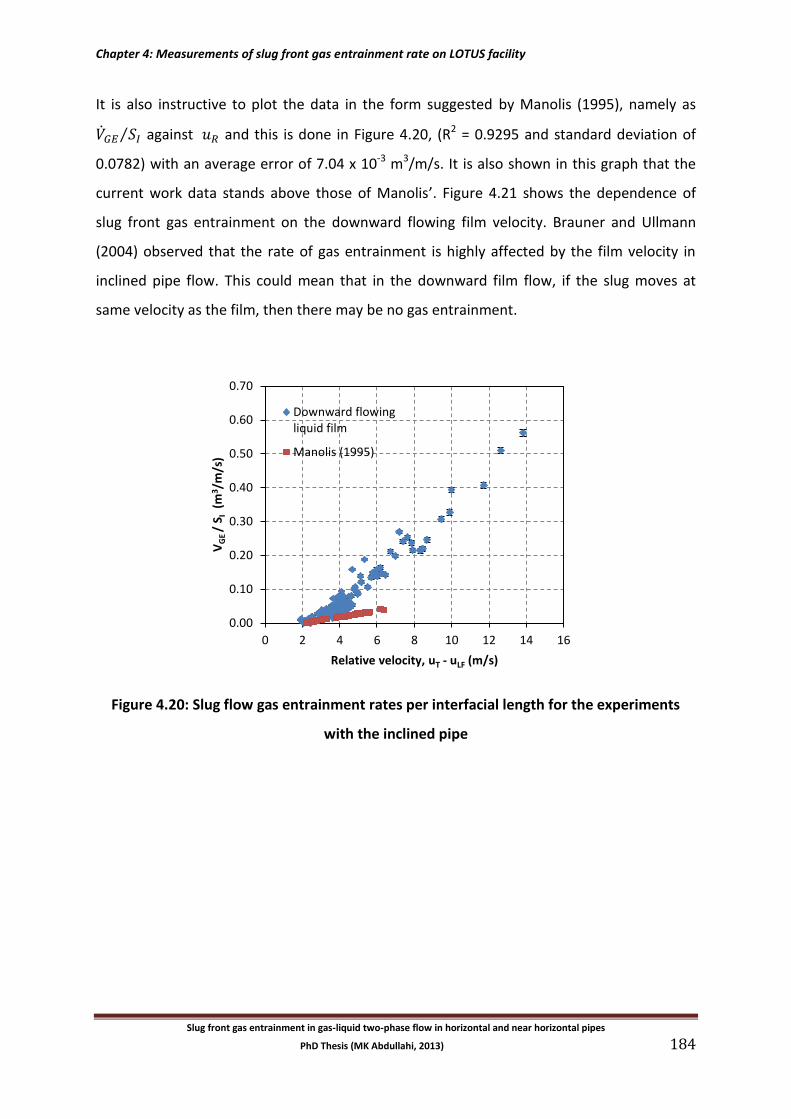
Chapter 4: Measurements of slug front gas entrainment rate on LOTUS facility
Slug front gas entrainment in gas-liquid two-phase flow in horizontal and near horizontal pipes
PhD Thesis (MK Abdullahi, 2013) 184
It is also instructive to plot the data in the form suggested by Manolis (1995), namely as
⁄ against and this is done in Figure 4.20, (R2 = 0.9295 and standard deviation of
0.0782) with an average error of 7.04 x 10⁻³ m3/m/s. It is also shown in this graph that the
current work data stands above those of Manolis’. Figure 4.21 shows the dependence of
slug front gas entrainment on the downward flowing film velocity. Brauner and Ullmann
(2004) observed that the rate of gas entrainment is highly affected by the film velocity in
inclined pipe flow. This could mean that in the downward film flow, if the slug moves at
same velocity as the film, then there may be no gas entrainment.
Figure 4.20: Slug flow gas entrainment rates per interfacial length for the experiments
with the inclined pipe
0.00
0.10
0.20
0.30
0.40
0.50
0.60
0.70
0 2 4 6 8 10 12 14 16
VG
E /
S I (
m3/m
/s)
Relative velocity, uT - uLF (m/s)
Downward flowingliquid film
Manolis (1995)
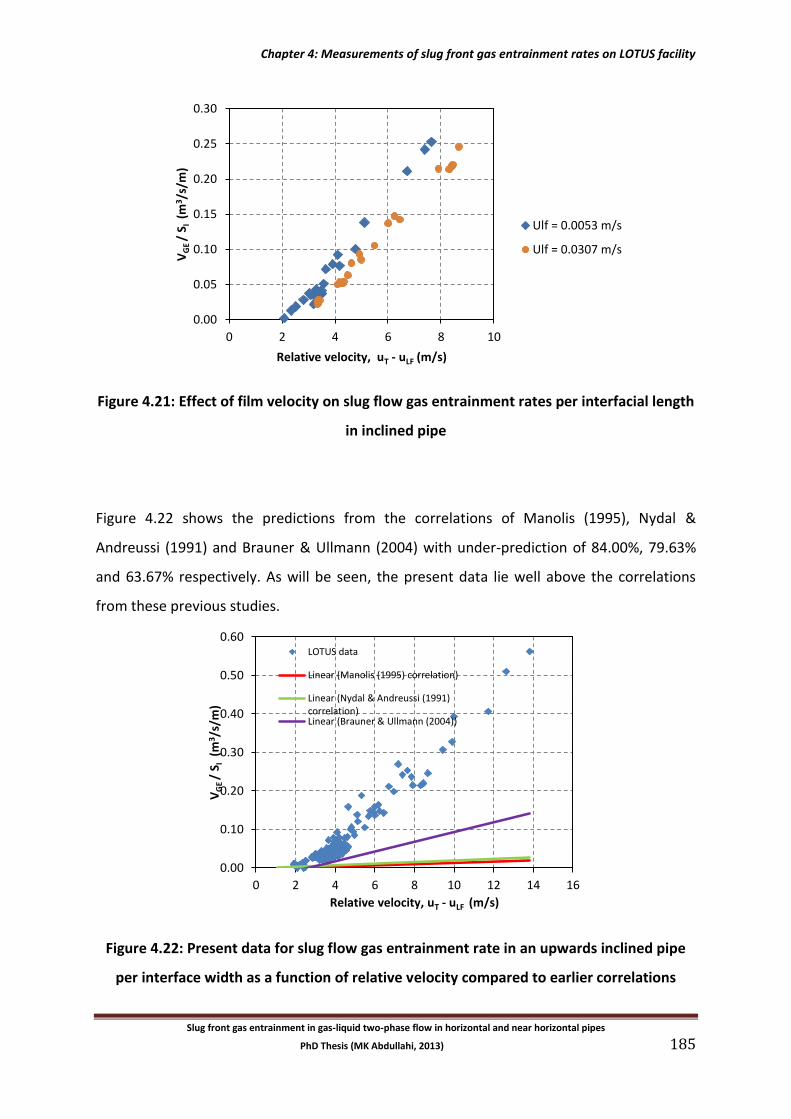
Chapter 4: Measurements of slug front gas entrainment rates on LOTUS facility
Slug front gas entrainment in gas-liquid two-phase flow in horizontal and near horizontal pipes
PhD Thesis (MK Abdullahi, 2013) 185
Figure 4.21: Effect of film velocity on slug flow gas entrainment rates per interfacial length
in inclined pipe
Figure 4.22 shows the predictions from the correlations of Manolis (1995), Nydal &
Andreussi (1991) and Brauner & Ullmann (2004) with under-prediction of 84.00%, 79.63%
and 63.67% respectively. As will be seen, the present data lie well above the correlations
from these previous studies.
Figure 4.22: Present data for slug flow gas entrainment rate in an upwards inclined pipe
per interface width as a function of relative velocity compared to earlier correlations
0.00
0.05
0.10
0.15
0.20
0.25
0.30
0 2 4 6 8 10
VG
E /
S I (
m3/s
/m)
Relative velocity, uT - uLF (m/s)
Ulf = 0.0053 m/s
Ulf = 0.0307 m/s
0.00
0.10
0.20
0.30
0.40
0.50
0.60
0 2 4 6 8 10 12 14 16
VG
E /
S I (
m3 /
s/m
)
Relative velocity, uT - uLF (m/s)
LOTUS data
Linear (Manolis (1995) correlation)
Linear (Nydal & Andreussi (1991)correlation)Linear (Brauner & Ullmann (2004))
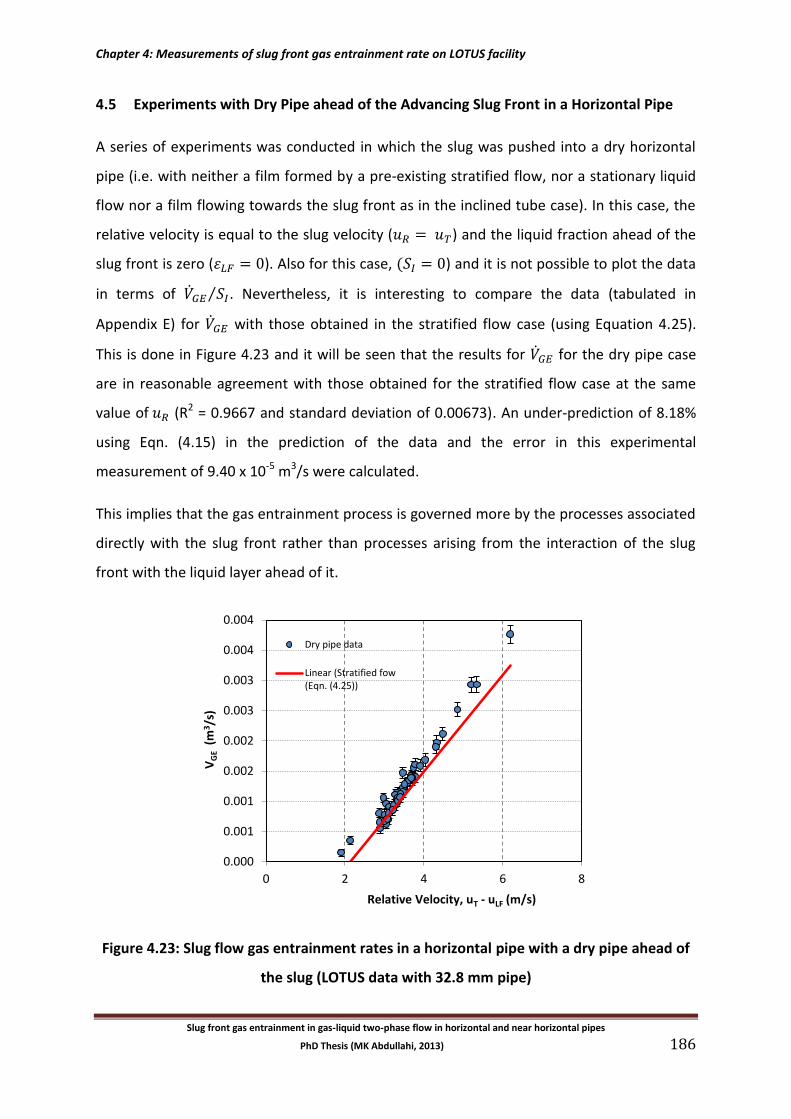
Chapter 4: Measurements of slug front gas entrainment rate on LOTUS facility
Slug front gas entrainment in gas-liquid two-phase flow in horizontal and near horizontal pipes
PhD Thesis (MK Abdullahi, 2013) 186
4.5 Experiments with Dry Pipe ahead of the Advancing Slug Front in a Horizontal Pipe
A series of experiments was conducted in which the slug was pushed into a dry horizontal
pipe (i.e. with neither a film formed by a pre-existing stratified flow, nor a stationary liquid
flow nor a film flowing towards the slug front as in the inclined tube case). In this case, the
relative velocity is equal to the slug velocity ( ) and the liquid fraction ahead of the
slug front is zero ( ). Also for this case, ( ) and it is not possible to plot the data
in terms of ⁄ . Nevertheless, it is interesting to compare the data (tabulated in
Appendix E) for with those obtained in the stratified flow case (using Equation 4.25).
This is done in Figure 4.23 and it will be seen that the results for for the dry pipe case
are in reasonable agreement with those obtained for the stratified flow case at the same
value of (R2 = 0.9667 and standard deviation of 0.00673). An under-prediction of 8.18%
using Eqn. (4.15) in the prediction of the data and the error in this experimental
measurement of 9.40 x 10⁻⁵ m3/s were calculated.
This implies that the gas entrainment process is governed more by the processes associated
directly with the slug front rather than processes arising from the interaction of the slug
front with the liquid layer ahead of it.
Figure 4.23: Slug flow gas entrainment rates in a horizontal pipe with a dry pipe ahead of
the slug (LOTUS data with 32.8 mm pipe)
0.000
0.001
0.001
0.002
0.002
0.003
0.003
0.004
0.004
0 2 4 6 8
VG
E (
m3 /
s)
Relative Velocity, uT - uLF (m/s)
Dry pipe data
Linear (Stratified fow(Eqn. (4.25))
Chapter 4: Measurements of slug front gas entrainment rates on LOTUS facility
Slug front gas entrainment in gas-liquid two-phase flow in horizontal and near horizontal pipes
PhD Thesis (MK Abdullahi, 2013) 187
4.6 Conclusion
A new methodology for the determination of slug front gas entrainment rate was developed
and applied in an air-water flow system to the following cases:
(1) Slug front advancing over a previously set-up flowing stratified layer in a
horizontal pipe (see Section 4.2).
(2) Slug front advancing over a stationary liquid layer in a horizontal pipe (see
Section 4.3).
(3) Slug front advancing over a falling liquid layer in an inclined pipe (see section
4.4)
(4) Slug front advancing into a dry horizontal pipe (see Section 4.5).
Experiments to measure gas entrainment rates were carried out using three different
methodologies in horizontal and inclined pipes. In horizontal slug flow experiments the slug
front velocity which is far greater than the film velocity dominates the gas entrainment rate
and this velocity (which in turn depends on the nature of the stratified flow ahead of the
slug front) is approximately equal to 1.2 the mixture velocity in gas-liquid two-phase slug
flows. However, in upward inclined flow, as Brauner and Ullmann (2004) also observed, the
rate of gas entrainment is highly affected by the film velocity. In the stationary film
experiments, the rate of gas entrainment depends on the film height. It is also important to
point out that gas entrainment do occur in an empty pipe with no liquid flowing ahead of
the slug front.
However, the new methodology proved robust and reproducible and, in general, gave
higher gas entrainment rates than had been expected from previous correlations. The
nature and flow of the liquid film ahead of the slug has surprisingly little effect on gas
entrainment rate which implies that it is the behaviour and structure of the slug front itself
rather than the interaction of the slug front with liquid ahead of it which is governing gas
entrainment.
Chapter 5: Measurements of slug front gas entrainment rates on WASP facility
Slug front gas entrainment in gas-liquid two-phase flow in horizontal and near horizontal pipes
PhD Thesis (MK Abdullahi, 2013) 188
Chapter 5: Measurements of Slug Front Gas Entrainment Rates on the WASP
Facility (77.92 mm diameter pipe)
Summary: This chapter presents the results from the slug front gas entrainment
measurements carried out on the WASP facility. This facility has a 37 m long, 78 mm
diameter test section which was set up in the horizontal configuration for the present
experiments. To carry out the present experiments, major changes were required in the
WASP facility and these are described in Chapter 3 (Section 3.2). The present Chapter begins
with a discussion of the general background to the experiments and continues with a
discussion of the problems encountered in the implementation of these experiments. The
results are then presented and comparisons with other work described. The Chapter
contains the following Sections:
5.1 Introduction
5.2 Implementation of the WASP experiments
5.3 Experiments with Stratified Flow ahead of Slug Front in Horizontal Pipe using the
WASP facility
5.4 Conclusion
Chapter 5: Measurements of slug front gas entrainment rates on WASP facility
Slug front gas entrainment in gas-liquid two-phase flow in horizontal and near horizontal pipes
PhD Thesis (MK Abdullahi, 2013) 189
5.1 Introduction
In the work presented in Chapter 4, results obtained using a new procedure for measuring
slug front gas entrainment rate were presented. These experiments were carried out on the
LOTUS facility and were for a 32.8 mm diameter pipe. Though the results obtained with the
32.8 mm pipe are of interest in themselves, it was considered important to also apply the
new methodology to the determination of slug front gas entrainment rates in a 78 mm
diameter pipe to obtain results which would be directly comparable to previous
measurements (using different techniques) on the WASP facility.
The conceptual design of the new experimental approach was described in Chapter 3 and (in
the context of the LOTUS experiments) in Chapter 4. Chapter 4 also detailed the processing
of the data to obtain the gas entrainment rate ( ) For completeness, the experimental
method is again described in the context of the WASP facility.
The experiments were performed in an air-water system shown in Figures 3.8 in Chapter 3,
the WASP facility. The horizontal test section is made of 37.0 m length of stainless steel pipe
of 78 mm inside diameter. The push-in liquid is stored in a high pressure water tank. The
instrumentations on the tank are discussed in Section 3.2. The experimental layout is shown
in Figure 5.1.
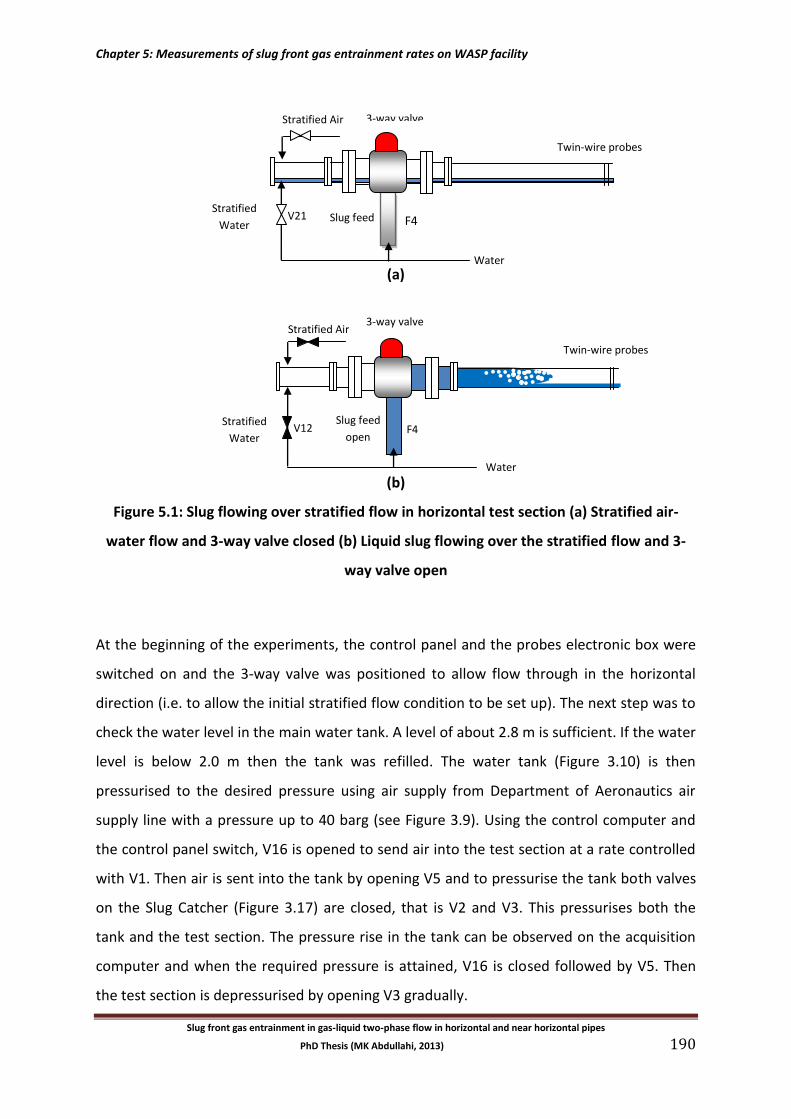
Chapter 5: Measurements of slug front gas entrainment rates on WASP facility
Slug front gas entrainment in gas-liquid two-phase flow in horizontal and near horizontal pipes
PhD Thesis (MK Abdullahi, 2013) 190
(a)
(a)
(b)
(b)
Figure 5.1: Slug flowing over stratified flow in horizontal test section (a) Stratified air-
water flow and 3-way valve closed (b) Liquid slug flowing over the stratified flow and 3-
way valve open
At the beginning of the experiments, the control panel and the probes electronic box were
switched on and the 3-way valve was positioned to allow flow through in the horizontal
direction (i.e. to allow the initial stratified flow condition to be set up). The next step was to
check the water level in the main water tank. A level of about 2.8 m is sufficient. If the water
level is below 2.0 m then the tank was refilled. The water tank (Figure 3.10) is then
pressurised to the desired pressure using air supply from Department of Aeronautics air
supply line with a pressure up to 40 barg (see Figure 3.9). Using the control computer and
the control panel switch, V16 is opened to send air into the test section at a rate controlled
with V1. Then air is sent into the tank by opening V5 and to pressurise the tank both valves
on the Slug Catcher (Figure 3.17) are closed, that is V2 and V3. This pressurises both the
tank and the test section. The pressure rise in the tank can be observed on the acquisition
computer and when the required pressure is attained, V16 is closed followed by V5. Then
the test section is depressurised by opening V3 gradually.
Twin-wire probes
Water
F4 V21 Slug feed
Rotamet
er
Rotamete
rRotamet
er
3-way valve
dump
tank
Stratified Air
Pumps
Stratified
Water
V12 F4
Water
Slug feed
open
Stratified
Water
3-way valve Stratified Air
Twin-wire probes
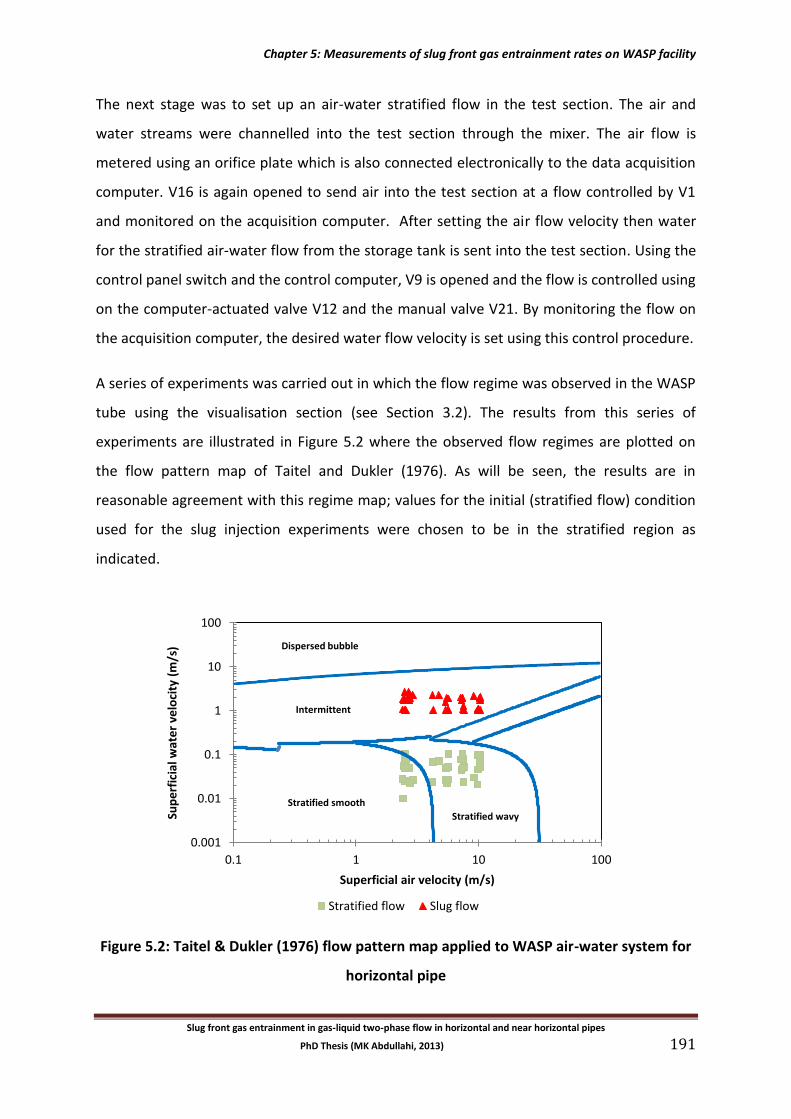
Chapter 5: Measurements of slug front gas entrainment rates on WASP facility
Slug front gas entrainment in gas-liquid two-phase flow in horizontal and near horizontal pipes
PhD Thesis (MK Abdullahi, 2013) 191
The next stage was to set up an air-water stratified flow in the test section. The air and
water streams were channelled into the test section through the mixer. The air flow is
metered using an orifice plate which is also connected electronically to the data acquisition
computer. V16 is again opened to send air into the test section at a flow controlled by V1
and monitored on the acquisition computer. After setting the air flow velocity then water
for the stratified air-water flow from the storage tank is sent into the test section. Using the
control panel switch and the control computer, V9 is opened and the flow is controlled using
on the computer-actuated valve V12 and the manual valve V21. By monitoring the flow on
the acquisition computer, the desired water flow velocity is set using this control procedure.
A series of experiments was carried out in which the flow regime was observed in the WASP
tube using the visualisation section (see Section 3.2). The results from this series of
experiments are illustrated in Figure 5.2 where the observed flow regimes are plotted on
the flow pattern map of Taitel and Dukler (1976). As will be seen, the results are in
reasonable agreement with this regime map; values for the initial (stratified flow) condition
used for the slug injection experiments were chosen to be in the stratified region as
indicated.
Figure 5.2: Taitel & Dukler (1976) flow pattern map applied to WASP air-water system for
horizontal pipe
0.001
0.01
0.1
1
10
100
0.1 1 10 100
Sup
erf
icia
l wat
er
velo
city
(m
/s)
Superficial air velocity (m/s)
Stratified flow Slug flow
Dispersed bubble
Intermittent
Stratified smooth
Stratified wavy
Chapter 5: Measurements of slug front gas entrainment rates on WASP facility
Slug front gas entrainment in gas-liquid two-phase flow in horizontal and near horizontal pipes
PhD Thesis (MK Abdullahi, 2013) 192
At the commencement of the experiment, a steady flow of the stratified flow is observed
through the camera output on a Sony TV screen. The 3-way valve (Figure 3.12) is then
turned to allow the water (slug) stream to enter the test section. At the same time the
acquisition programmes for both the flow and twin-wire probes are run. The opening of the
3-way valve pushes liquid slugs through the Venturi (F4) and into the test section over the
slower stratified flow as depicted in Figure 5.1b. There are two pressure transducers
connected to the Venturi, one is absolute and the other is differential type. The absolute
pressure transducer gives the pressure in the tank and the flow line while the pressure
difference measured by the differential pressure transducer is used in calculating the slug
feed flow velocity using Eqn. (3.1). Both transducers are connected to the flow data
acquisition computer. As in the case of the LOTUS experiments, the slug picked up the
slower flowing liquid film and entrained air at its front. Two twin-wire conductivity probes
were fitted towards the end of the test section (Figures 3.25 and 3.26). The probes
measured the liquid film height, the slug height and the time of arrival of the slug front. The
slug was collected into a Slug Catcher (Figure 3.17) connected to the exit of the test section.
Both V2 and V3 are kept open to allow water and air respectively to escape from the Slug
Catcher.
At the end of each run, air trapped between V1 and the 3-way valve is bled through the
orifice bleed valves in order to avoid severe slugging when the 3-way valve is rotated to
close off the slug feed line and to open up the stratified flow line in preparation for the next
experimental run. When the 3-way is rotated back to the stratified flow position, an air flow
is used to flush any water remaining in the test section into the slug catcher in order to have
an empty pipe for another run to commence.
Chapter 5: Measurements of slug front gas entrainment rates on WASP facility
Slug front gas entrainment in gas-liquid two-phase flow in horizontal and near horizontal pipes
PhD Thesis (MK Abdullahi, 2013) 193
5.2 Implementation of the WASP Experiments
A major problem was encountered in operating the slug front gas entrainment experiments
on the WASP facility. In the LOTUS experiments, the three-way valve was switched by hand
in a fraction of a second. In the early experiments on WASP, the time required to switch the
valve using a solenoid coupled to a pneumatic actuator at a pressure of 6 bar, was about 4
seconds. During this extended switching period, an intermittent injection of the slug feed
into the test section occurred and created instability in the stratified flow ahead of the slug.
This led to the formation of liquid bridges (”precursory slugs”) ahead of the main slug front.
The solenoid valve that came with the actuator failed and it was replaced but the second
one also failed. Therefore, a manual air actuation system to open the valve was constructed.
An air supply loop was constructed to feed in air through an inch hose and controlled
from the control room. Two manual valves were attached to the air supply line one to send
air in and the other to release air out of the actuator. This arrangement helped in opening
and closing the valve. However, this manual operation of the actuator further slowed the
opening of the valve due to the length of the air supply tube and this exacerbated the
problem of precursory slug formation. The problem was solved (at least for a limited range
of conditions) by modifying the actuator and valve configurations.
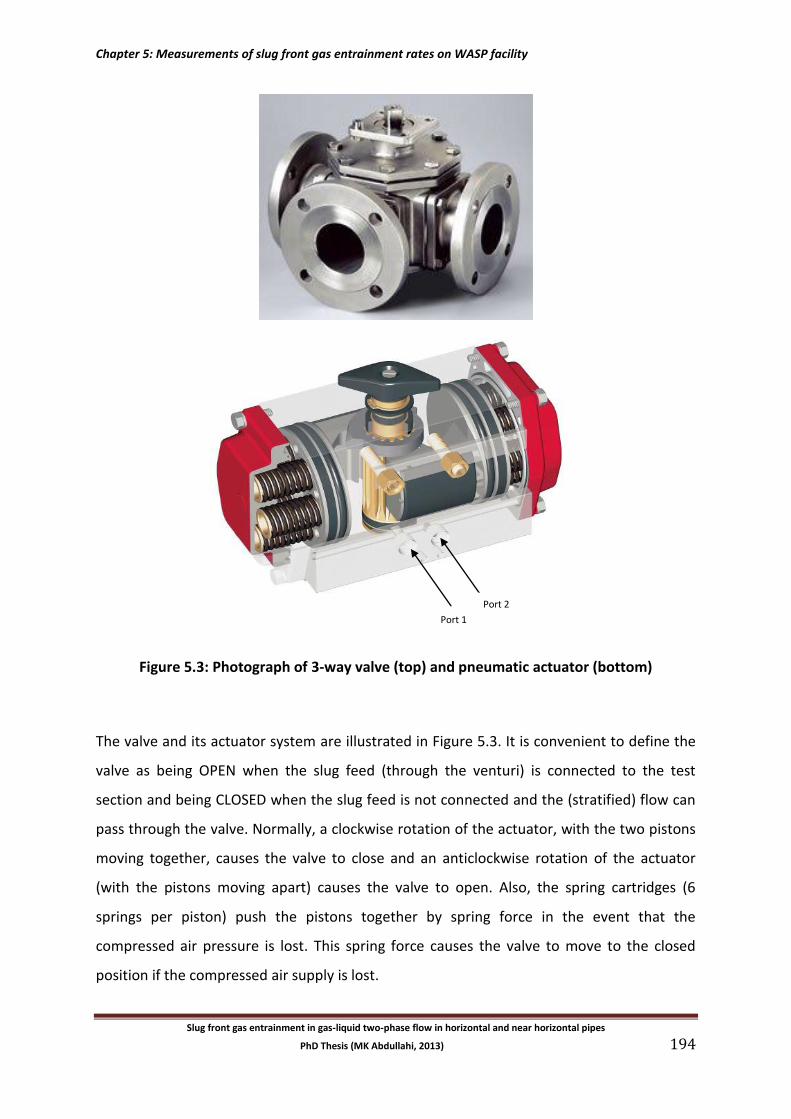
Chapter 5: Measurements of slug front gas entrainment rates on WASP facility
Slug front gas entrainment in gas-liquid two-phase flow in horizontal and near horizontal pipes
PhD Thesis (MK Abdullahi, 2013) 194
Figure 5.3: Photograph of 3-way valve (top) and pneumatic actuator (bottom)
The valve and its actuator system are illustrated in Figure 5.3. It is convenient to define the
valve as being OPEN when the slug feed (through the venturi) is connected to the test
section and being CLOSED when the slug feed is not connected and the (stratified) flow can
pass through the valve. Normally, a clockwise rotation of the actuator, with the two pistons
moving together, causes the valve to close and an anticlockwise rotation of the actuator
(with the pistons moving apart) causes the valve to open. Also, the spring cartridges (6
springs per piston) push the pistons together by spring force in the event that the
compressed air pressure is lost. This spring force causes the valve to move to the closed
position if the compressed air supply is lost.
Port 1
Port 2
out
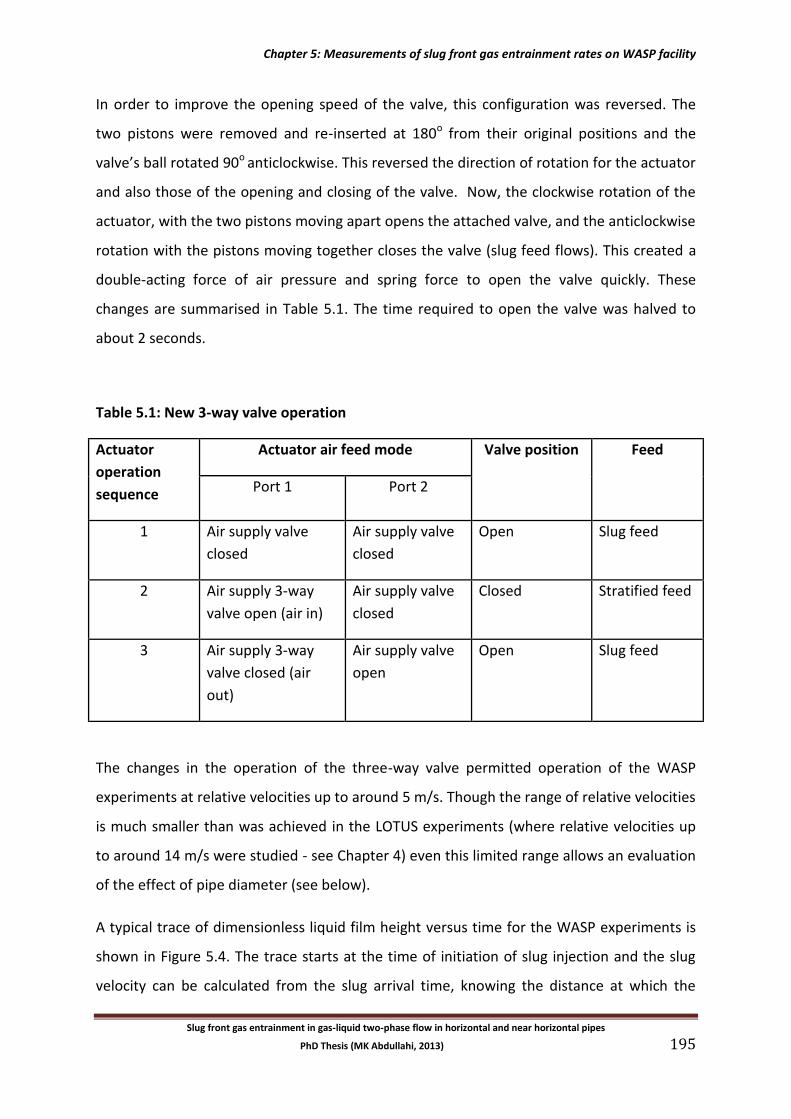
Chapter 5: Measurements of slug front gas entrainment rates on WASP facility
Slug front gas entrainment in gas-liquid two-phase flow in horizontal and near horizontal pipes
PhD Thesis (MK Abdullahi, 2013) 195
In order to improve the opening speed of the valve, this configuration was reversed. The
two pistons were removed and re-inserted at 180o from their original positions and the
valve’s ball rotated 90o anticlockwise. This reversed the direction of rotation for the actuator
and also those of the opening and closing of the valve. Now, the clockwise rotation of the
actuator, with the two pistons moving apart opens the attached valve, and the anticlockwise
rotation with the pistons moving together closes the valve (slug feed flows). This created a
double-acting force of air pressure and spring force to open the valve quickly. These
changes are summarised in Table 5.1. The time required to open the valve was halved to
about 2 seconds.
Table 5.1: New 3-way valve operation
Actuator
operation
sequence
Actuator air feed mode Valve position Feed
Port 1 Port 2
1 Air supply valve
closed
Air supply valve
closed
Open Slug feed
2 Air supply 3-way
valve open (air in)
Air supply valve
closed
Closed Stratified feed
3 Air supply 3-way
valve closed (air
out)
Air supply valve
open
Open Slug feed
The changes in the operation of the three-way valve permitted operation of the WASP
experiments at relative velocities up to around 5 m/s. Though the range of relative velocities
is much smaller than was achieved in the LOTUS experiments (where relative velocities up
to around 14 m/s were studied - see Chapter 4) even this limited range allows an evaluation
of the effect of pipe diameter (see below).
A typical trace of dimensionless liquid film height versus time for the WASP experiments is
shown in Figure 5.4. The trace starts at the time of initiation of slug injection and the slug
velocity can be calculated from the slug arrival time, knowing the distance at which the
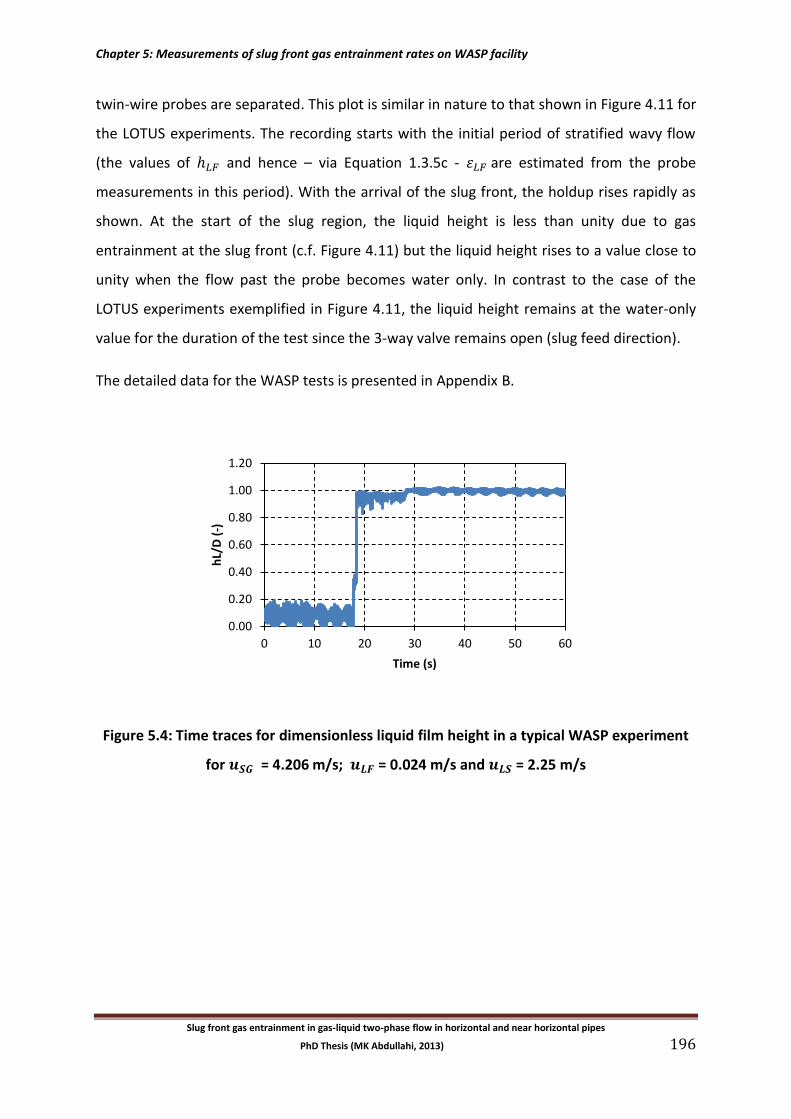
Chapter 5: Measurements of slug front gas entrainment rates on WASP facility
Slug front gas entrainment in gas-liquid two-phase flow in horizontal and near horizontal pipes
PhD Thesis (MK Abdullahi, 2013) 196
twin-wire probes are separated. This plot is similar in nature to that shown in Figure 4.11 for
the LOTUS experiments. The recording starts with the initial period of stratified wavy flow
(the values of and hence – via Equation 1.3.5c - are estimated from the probe
measurements in this period). With the arrival of the slug front, the holdup rises rapidly as
shown. At the start of the slug region, the liquid height is less than unity due to gas
entrainment at the slug front (c.f. Figure 4.11) but the liquid height rises to a value close to
unity when the flow past the probe becomes water only. In contrast to the case of the
LOTUS experiments exemplified in Figure 4.11, the liquid height remains at the water-only
value for the duration of the test since the 3-way valve remains open (slug feed direction).
The detailed data for the WASP tests is presented in Appendix B.
Figure 5.4: Time traces for dimensionless liquid film height in a typical WASP experiment
for = 4.206 m/s; = 0.024 m/s and = 2.25 m/s
0.00
0.20
0.40
0.60
0.80
1.00
1.20
0 10 20 30 40 50 60
hL/
D (
-)
Time (s)
Chapter 5: Measurements of slug front gas entrainment rates on WASP facility
Slug front gas entrainment in gas-liquid two-phase flow in horizontal and near horizontal pipes
PhD Thesis (MK Abdullahi, 2013) 197
5.3 Experiments with Stratified Flow ahead of Slug Front in Horizontal Pipe using the
WASP Facility
The value of was calculated for each test via Equation 4.8 using the measured values of
and . The values of for the WASP experiments are plotted against relative
velocity in Figure 5.5. As will be seen the result is similar to that obtained
from the LOTUS (32.8 mm diameter pipe) tests; the value of increases linearly with
relative velocity above a value of relative velocity below which there is no gas entrainment
(R2 = 0.9813 and standard deviation of 0.00174).
Figure 5.5: Slug flow gas entrainment rate in horizontal pipe on WASP
The minimum relative velocity required for gas entrainment (1.476 m/s) is similar (though
somewhat smaller) than the value obtained for the 32.8 mm tube (2.125 m/s). As would be
expected, the gas entrainment rates in Figure 5.5 are higher than those (at the same relative
velocity) for the 32.8 mm LOTUS pipe (see Figure 4.12). However it is interesting to compare
the ratio / for the two cases where is the film width (calculated from Equation
1.3.6c). Such a comparison is presented in Figure 5.6 and it will be seen that the results from
the LOTUS experiments (32.8 mm diameter pipe) are in reasonable agreement with those
0.000
0.001
0.002
0.003
0.004
0.005
0.006
0.007
0.008
0 1 2 3 4 5
VG
E (
m3 /
s)
Relative velocity, uT -uLF (m/s)
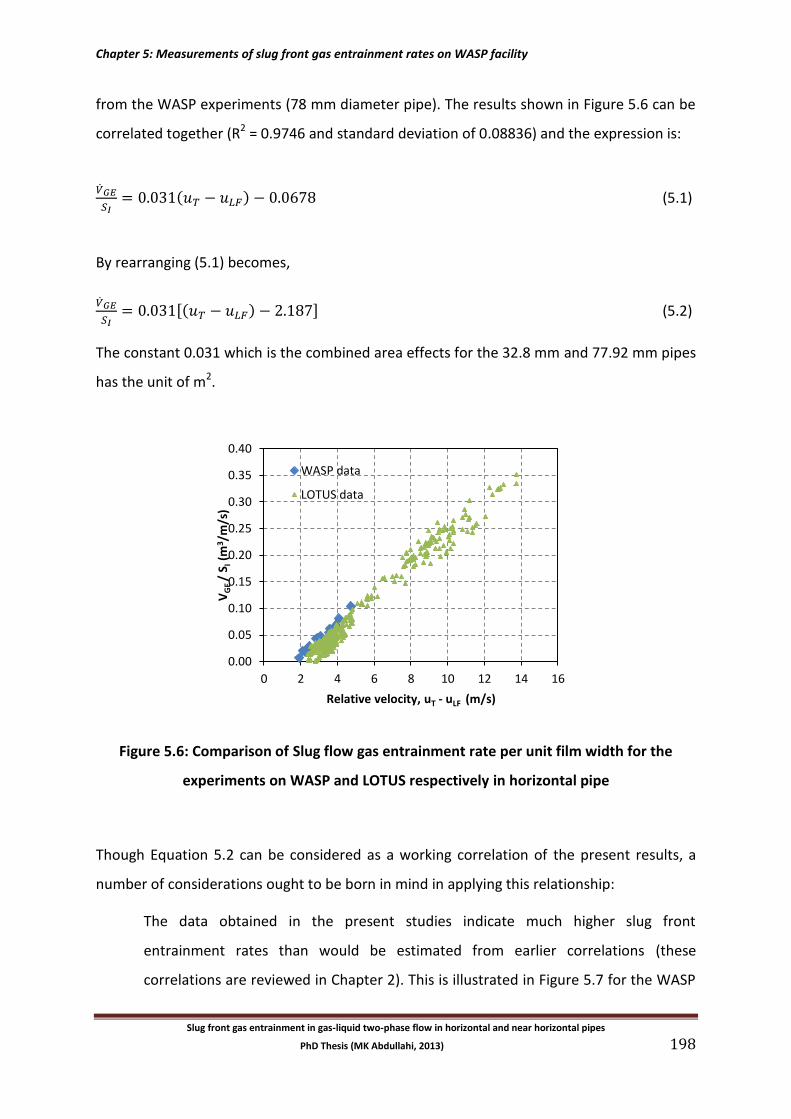
Chapter 5: Measurements of slug front gas entrainment rates on WASP facility
Slug front gas entrainment in gas-liquid two-phase flow in horizontal and near horizontal pipes
PhD Thesis (MK Abdullahi, 2013) 198
from the WASP experiments (78 mm diameter pipe). The results shown in Figure 5.6 can be
correlated together (R2 = 0.9746 and standard deviation of 0.08836) and the expression is:
( ) (5.1)
By rearranging (5.1) becomes,
[( ) ] (5.2)
The constant 0.031 which is the combined area effects for the 32.8 mm and 77.92 mm pipes
has the unit of m2.
Figure 5.6: Comparison of Slug flow gas entrainment rate per unit film width for the
experiments on WASP and LOTUS respectively in horizontal pipe
Though Equation 5.2 can be considered as a working correlation of the present results, a
number of considerations ought to be born in mind in applying this relationship:
The data obtained in the present studies indicate much higher slug front
entrainment rates than would be estimated from earlier correlations (these
correlations are reviewed in Chapter 2). This is illustrated in Figure 5.7 for the WASP
0.00
0.05
0.10
0.15
0.20
0.25
0.30
0.35
0.40
0 2 4 6 8 10 12 14 16
VG
E /
S I (
m3 /
m/s
)
Relative velocity, uT - uLF (m/s)
WASP data
LOTUS data
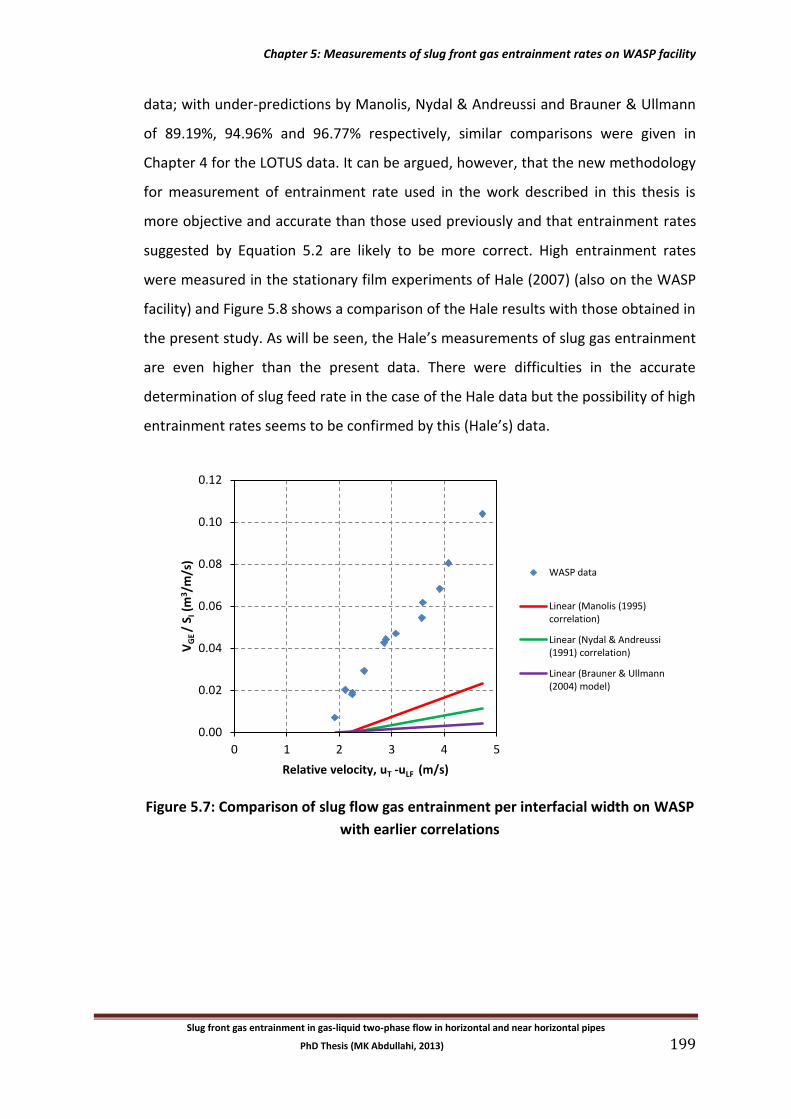
Chapter 5: Measurements of slug front gas entrainment rates on WASP facility
Slug front gas entrainment in gas-liquid two-phase flow in horizontal and near horizontal pipes
PhD Thesis (MK Abdullahi, 2013) 199
data; with under-predictions by Manolis, Nydal & Andreussi and Brauner & Ullmann
of 89.19%, 94.96% and 96.77% respectively, similar comparisons were given in
Chapter 4 for the LOTUS data. It can be argued, however, that the new methodology
for measurement of entrainment rate used in the work described in this thesis is
more objective and accurate than those used previously and that entrainment rates
suggested by Equation 5.2 are likely to be more correct. High entrainment rates
were measured in the stationary film experiments of Hale (2007) (also on the WASP
facility) and Figure 5.8 shows a comparison of the Hale results with those obtained in
the present study. As will be seen, the Hale’s measurements of slug gas entrainment
are even higher than the present data. There were difficulties in the accurate
determination of slug feed rate in the case of the Hale data but the possibility of high
entrainment rates seems to be confirmed by this (Hale’s) data.
Figure 5.7: Comparison of slug flow gas entrainment per interfacial width on WASP
with earlier correlations
0.00
0.02
0.04
0.06
0.08
0.10
0.12
0 1 2 3 4 5
VG
E /
S I (
m3 /
m/s
)
Relative velocity, uT -uLF (m/s)
WASP data
Linear (Manolis (1995)correlation)
Linear (Nydal & Andreussi(1991) correlation)
Linear (Brauner & Ullmann(2004) model)
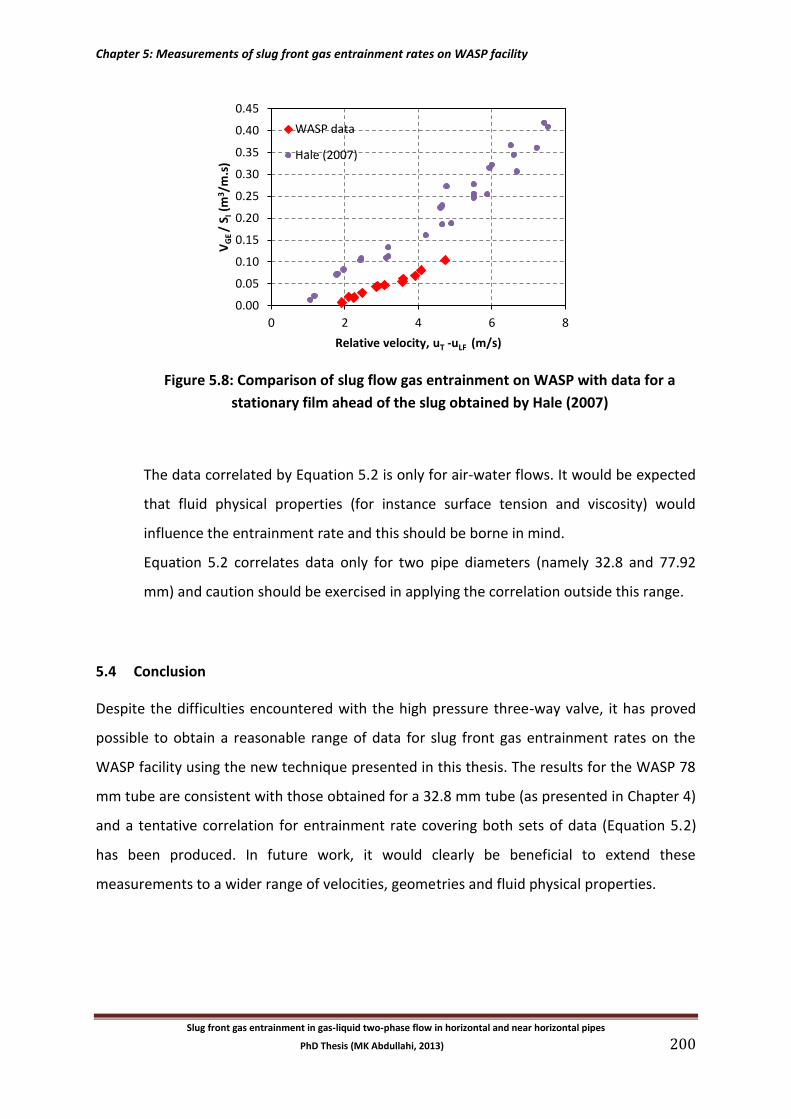
Chapter 5: Measurements of slug front gas entrainment rates on WASP facility
Slug front gas entrainment in gas-liquid two-phase flow in horizontal and near horizontal pipes
PhD Thesis (MK Abdullahi, 2013) 200
Figure 5.8: Comparison of slug flow gas entrainment on WASP with data for a
stationary film ahead of the slug obtained by Hale (2007)
The data correlated by Equation 5.2 is only for air-water flows. It would be expected
that fluid physical properties (for instance surface tension and viscosity) would
influence the entrainment rate and this should be borne in mind.
Equation 5.2 correlates data only for two pipe diameters (namely 32.8 and 77.92
mm) and caution should be exercised in applying the correlation outside this range.
5.4 Conclusion
Despite the difficulties encountered with the high pressure three-way valve, it has proved
possible to obtain a reasonable range of data for slug front gas entrainment rates on the
WASP facility using the new technique presented in this thesis. The results for the WASP 78
mm tube are consistent with those obtained for a 32.8 mm tube (as presented in Chapter 4)
and a tentative correlation for entrainment rate covering both sets of data (Equation 5.2)
has been produced. In future work, it would clearly be beneficial to extend these
measurements to a wider range of velocities, geometries and fluid physical properties.
0.00
0.05
0.10
0.15
0.20
0.25
0.30
0.35
0.40
0.45
0 2 4 6 8
VG
E /
S I (
m3 /
m.s
)
Relative velocity, uT -uLF (m/s)
WASP data
Hale (2007)
Chapter 6: Bubble experiments on LOWPRESS facility
Slug front gas entrainment in gas-liquid two-phase flow in horizontal and near horizontal pipes
PhD Thesis (MK Abdullahi, 2013) 201
Chapter 6: Bubble Experiments on LOWPRESS Facility
(32.8 mm diameter pipe)
Summary: In the new methodology for the determination of slug front gas entrainment rate
(the “three-way valve” method) described in Chapters 3-5, the motion of a slug front over a
pre-set liquid film is studied and the entrainment rate is deduced from a knowledge of the
water (slug) injection rate, the pre-set film characteristics and the slug front propagation
rate. Though it is believed that this method gives accurate and consistent results, an
alternative method was also investigated which uses a quite different principle, namely the
“bubble method”. In this alternative method, the motion of a large gas bubble (simulating
the elongated bubble between the slug tail and slug front in slug flow) is studied. This single
bubble shrinks due to fragmentation and its entrainment at the slug front; for the single
bubble case, this entrainment is not compensated by the release of gas at the slug tail as
would be the case in fully developed slug flow. For the single bubble experiment, the gas
entrainment rate can in principle be deduced from the rate of the bubble shrinkage with
distance. In the development work described here, a variety of methods were investigated
for trapping the initial bubble. It was found that the tube in the LOWPRESS facility was not
sufficiently long to allow accurate measurement of the bubble shrinkage rate. However, by
studying the slug front motion, it was possible to establish consistency between the bubble
experiments and the three-way valve experiments described in Chapters 4 and 5.
Recommendations for the future implementation of this new technique are also given.
This Chapter consists of the following Sections:
6.1 The Principle of the Bubble Experiment
6.2 Methods of Bubble Entrapment
6.2.1 Bubble entrapment using pairs of valves
6.2.2 Bubble entrapment using a dog-leg pipe section
6.2.3 Bubble entrapment using a pipe bridge
Chapter 6: Bubble experiments on LOWPRESS facility
Slug front gas entrainment in gas-liquid two-phase flow in horizontal and near horizontal pipes
PhD Thesis (MK Abdullahi, 2013) 202
6.3 Consistency between Bubble and Three-way Valve Experiments
6.4 Conclusion
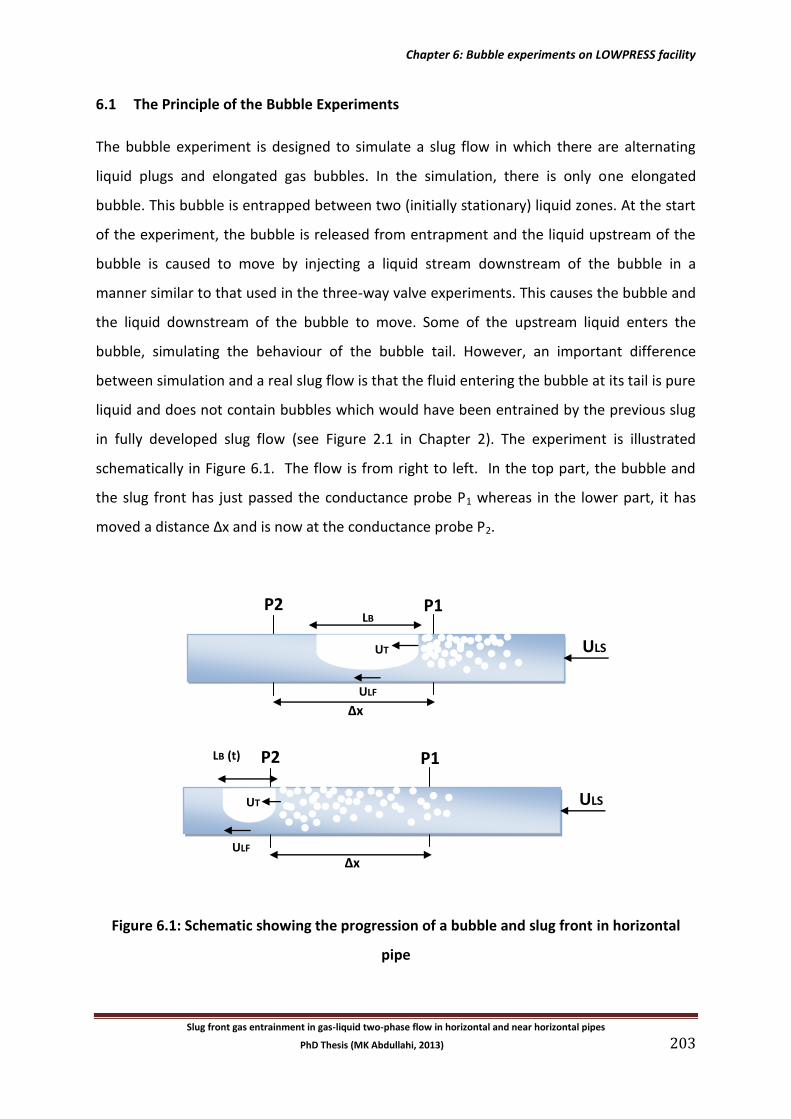
Chapter 6: Bubble experiments on LOWPRESS facility
Slug front gas entrainment in gas-liquid two-phase flow in horizontal and near horizontal pipes
PhD Thesis (MK Abdullahi, 2013) 203
6.1 The Principle of the Bubble Experiments
The bubble experiment is designed to simulate a slug flow in which there are alternating
liquid plugs and elongated gas bubbles. In the simulation, there is only one elongated
bubble. This bubble is entrapped between two (initially stationary) liquid zones. At the start
of the experiment, the bubble is released from entrapment and the liquid upstream of the
bubble is caused to move by injecting a liquid stream downstream of the bubble in a
manner similar to that used in the three-way valve experiments. This causes the bubble and
the liquid downstream of the bubble to move. Some of the upstream liquid enters the
bubble, simulating the behaviour of the bubble tail. However, an important difference
between simulation and a real slug flow is that the fluid entering the bubble at its tail is pure
liquid and does not contain bubbles which would have been entrained by the previous slug
in fully developed slug flow (see Figure 2.1 in Chapter 2). The experiment is illustrated
schematically in Figure 6.1. The flow is from right to left. In the top part, the bubble and
the slug front has just passed the conductance probe P1 whereas in the lower part, it has
moved a distance ∆x and is now at the conductance probe P2.
Figure 6.1: Schematic showing the progression of a bubble and slug front in horizontal
pipe
Δx
ULS
P2 P1
ULF
UT
LB (t)
Δx
ULS
P2 P1
ULF
LB
equ
atio
n
her
e.
UT
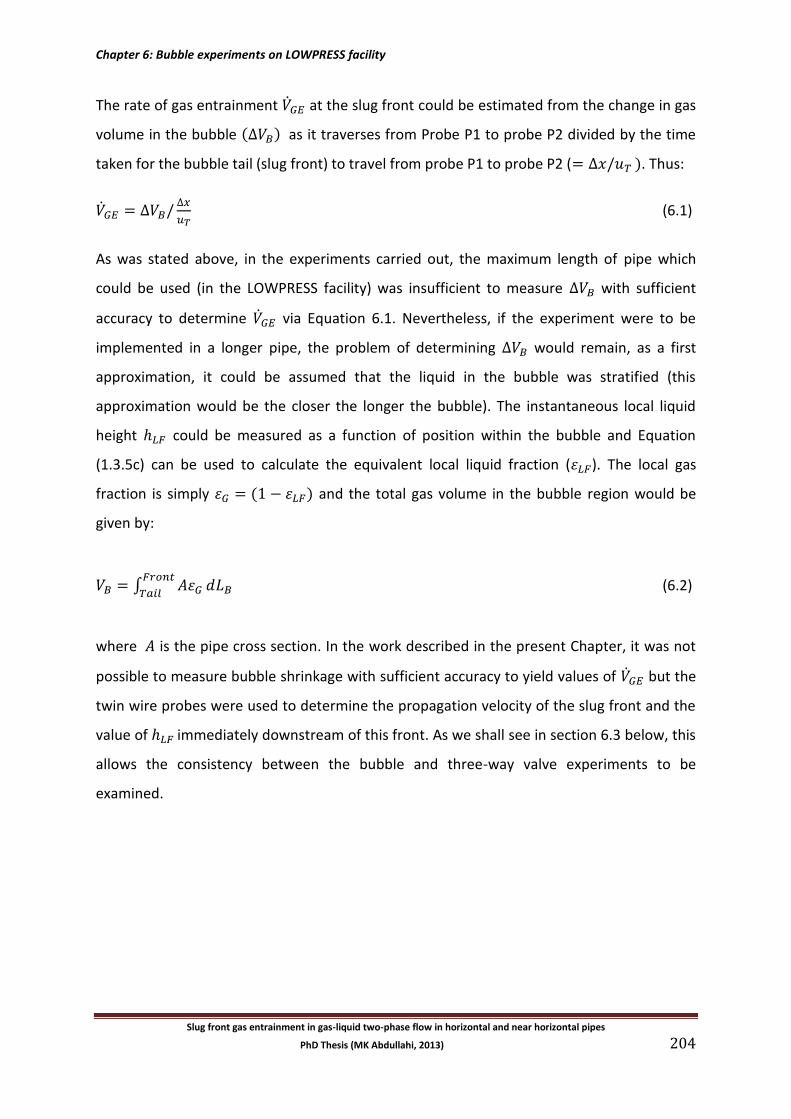
Chapter 6: Bubble experiments on LOWPRESS facility
Slug front gas entrainment in gas-liquid two-phase flow in horizontal and near horizontal pipes
PhD Thesis (MK Abdullahi, 2013) 204
The rate of gas entrainment at the slug front could be estimated from the change in gas
volume in the bubble ( ) as it traverses from Probe P1 to probe P2 divided by the time
taken for the bubble tail (slug front) to travel from probe P1 to probe P2 ( ). Thus:
(6.1)
As was stated above, in the experiments carried out, the maximum length of pipe which
could be used (in the LOWPRESS facility) was insufficient to measure with sufficient
accuracy to determine via Equation 6.1. Nevertheless, if the experiment were to be
implemented in a longer pipe, the problem of determining would remain, as a first
approximation, it could be assumed that the liquid in the bubble was stratified (this
approximation would be the closer the longer the bubble). The instantaneous local liquid
height could be measured as a function of position within the bubble and Equation
(1.3.5c) can be used to calculate the equivalent local liquid fraction ( ). The local gas
fraction is simply ( ) and the total gas volume in the bubble region would be
given by:
∫
(6.2)
where is the pipe cross section. In the work described in the present Chapter, it was not
possible to measure bubble shrinkage with sufficient accuracy to yield values of but the
twin wire probes were used to determine the propagation velocity of the slug front and the
value of immediately downstream of this front. As we shall see in section 6.3 below, this
allows the consistency between the bubble and three-way valve experiments to be
examined.
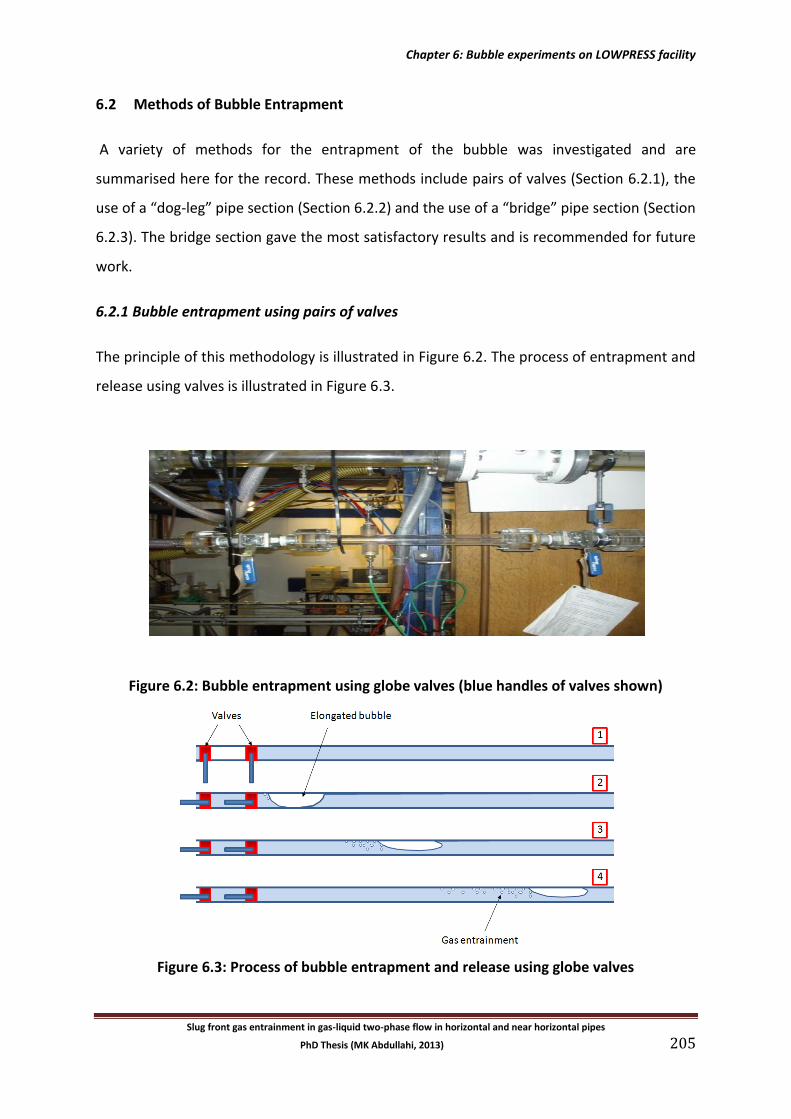
Chapter 6: Bubble experiments on LOWPRESS facility
Slug front gas entrainment in gas-liquid two-phase flow in horizontal and near horizontal pipes
PhD Thesis (MK Abdullahi, 2013) 205
6.2 Methods of Bubble Entrapment
A variety of methods for the entrapment of the bubble was investigated and are
summarised here for the record. These methods include pairs of valves (Section 6.2.1), the
use of a “dog-leg” pipe section (Section 6.2.2) and the use of a “bridge” pipe section (Section
6.2.3). The bridge section gave the most satisfactory results and is recommended for future
work.
6.2.1 Bubble entrapment using pairs of valves
The principle of this methodology is illustrated in Figure 6.2. The process of entrapment and
release using valves is illustrated in Figure 6.3.
Figure 6.2: Bubble entrapment using globe valves (blue handles of valves shown)
Figure 6.3: Process of bubble entrapment and release using globe valves
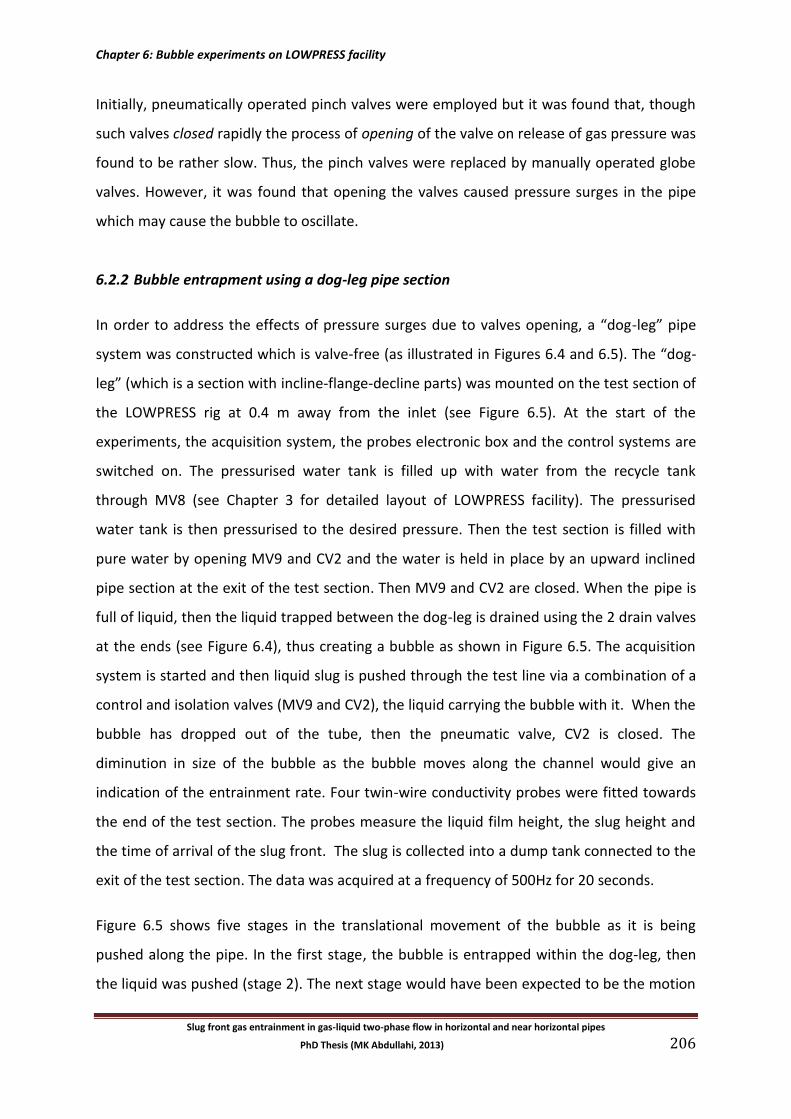
Chapter 6: Bubble experiments on LOWPRESS facility
Slug front gas entrainment in gas-liquid two-phase flow in horizontal and near horizontal pipes
PhD Thesis (MK Abdullahi, 2013) 206
Initially, pneumatically operated pinch valves were employed but it was found that, though
such valves closed rapidly the process of opening of the valve on release of gas pressure was
found to be rather slow. Thus, the pinch valves were replaced by manually operated globe
valves. However, it was found that opening the valves caused pressure surges in the pipe
which may cause the bubble to oscillate.
6.2.2 Bubble entrapment using a dog-leg pipe section
In order to address the effects of pressure surges due to valves opening, a “dog-leg” pipe
system was constructed which is valve-free (as illustrated in Figures 6.4 and 6.5). The “dog-
leg” (which is a section with incline-flange-decline parts) was mounted on the test section of
the LOWPRESS rig at 0.4 m away from the inlet (see Figure 6.5). At the start of the
experiments, the acquisition system, the probes electronic box and the control systems are
switched on. The pressurised water tank is filled up with water from the recycle tank
through MV8 (see Chapter 3 for detailed layout of LOWPRESS facility). The pressurised
water tank is then pressurised to the desired pressure. Then the test section is filled with
pure water by opening MV9 and CV2 and the water is held in place by an upward inclined
pipe section at the exit of the test section. Then MV9 and CV2 are closed. When the pipe is
full of liquid, then the liquid trapped between the dog-leg is drained using the 2 drain valves
at the ends (see Figure 6.4), thus creating a bubble as shown in Figure 6.5. The acquisition
system is started and then liquid slug is pushed through the test line via a combination of a
control and isolation valves (MV9 and CV2), the liquid carrying the bubble with it. When the
bubble has dropped out of the tube, then the pneumatic valve, CV2 is closed. The
diminution in size of the bubble as the bubble moves along the channel would give an
indication of the entrainment rate. Four twin-wire conductivity probes were fitted towards
the end of the test section. The probes measure the liquid film height, the slug height and
the time of arrival of the slug front. The slug is collected into a dump tank connected to the
exit of the test section. The data was acquired at a frequency of 500Hz for 20 seconds.
Figure 6.5 shows five stages in the translational movement of the bubble as it is being
pushed along the pipe. In the first stage, the bubble is entrapped within the dog-leg, then
the liquid was pushed (stage 2). The next stage would have been expected to be the motion
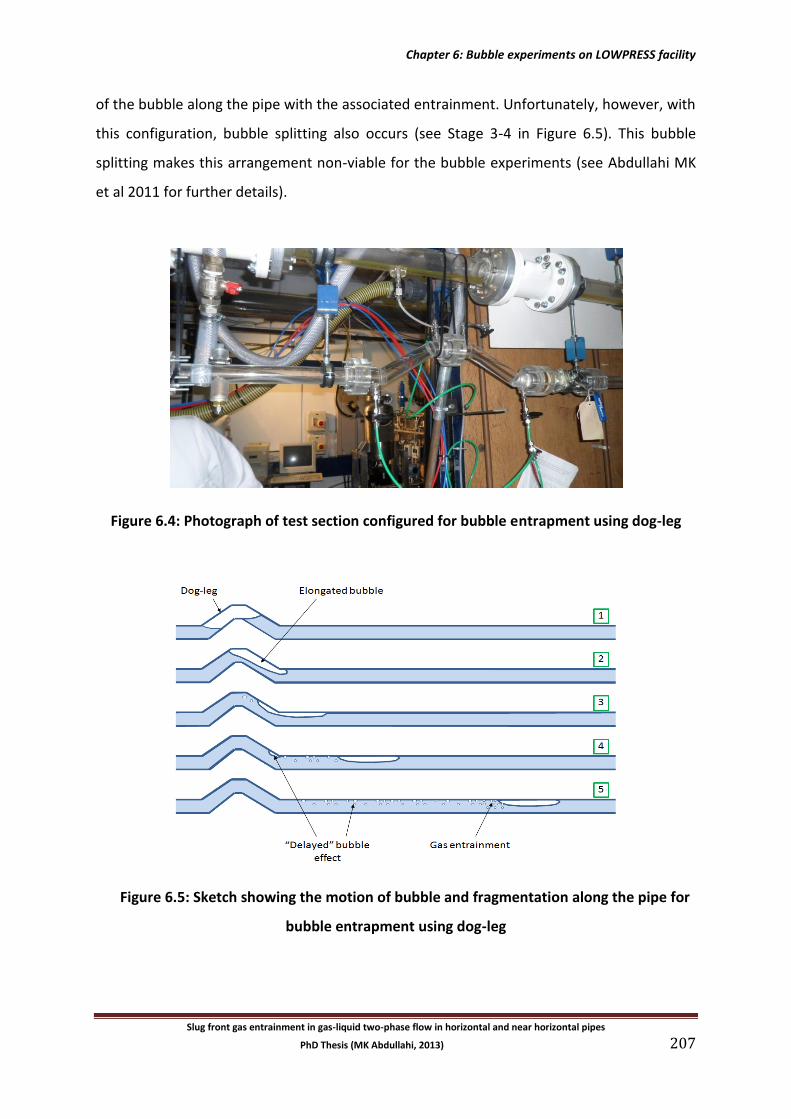
Chapter 6: Bubble experiments on LOWPRESS facility
Slug front gas entrainment in gas-liquid two-phase flow in horizontal and near horizontal pipes
PhD Thesis (MK Abdullahi, 2013) 207
of the bubble along the pipe with the associated entrainment. Unfortunately, however, with
this configuration, bubble splitting also occurs (see Stage 3-4 in Figure 6.5). This bubble
splitting makes this arrangement non-viable for the bubble experiments (see Abdullahi MK
et al 2011 for further details).
Figure 6.4: Photograph of test section configured for bubble entrapment using dog-leg
Figure 6.5: Sketch showing the motion of bubble and fragmentation along the pipe for
bubble entrapment using dog-leg
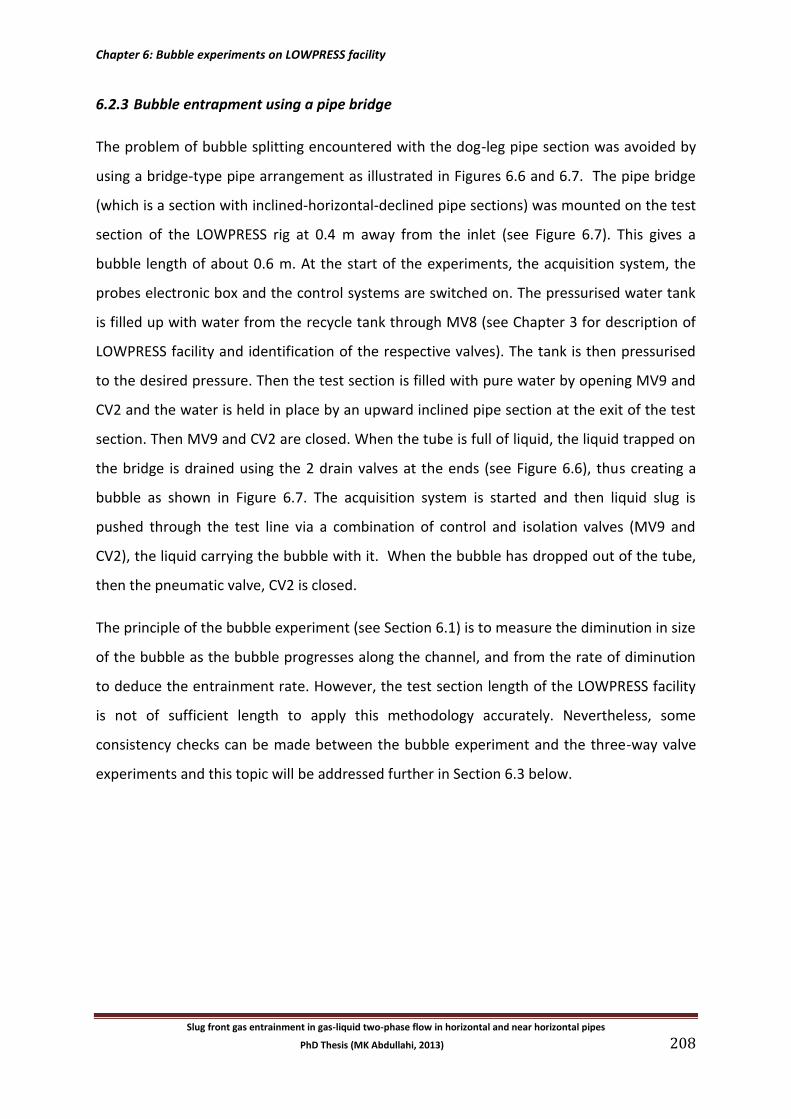
Chapter 6: Bubble experiments on LOWPRESS facility
Slug front gas entrainment in gas-liquid two-phase flow in horizontal and near horizontal pipes
PhD Thesis (MK Abdullahi, 2013) 208
6.2.3 Bubble entrapment using a pipe bridge
The problem of bubble splitting encountered with the dog-leg pipe section was avoided by
using a bridge-type pipe arrangement as illustrated in Figures 6.6 and 6.7. The pipe bridge
(which is a section with inclined-horizontal-declined pipe sections) was mounted on the test
section of the LOWPRESS rig at 0.4 m away from the inlet (see Figure 6.7). This gives a
bubble length of about 0.6 m. At the start of the experiments, the acquisition system, the
probes electronic box and the control systems are switched on. The pressurised water tank
is filled up with water from the recycle tank through MV8 (see Chapter 3 for description of
LOWPRESS facility and identification of the respective valves). The tank is then pressurised
to the desired pressure. Then the test section is filled with pure water by opening MV9 and
CV2 and the water is held in place by an upward inclined pipe section at the exit of the test
section. Then MV9 and CV2 are closed. When the tube is full of liquid, the liquid trapped on
the bridge is drained using the 2 drain valves at the ends (see Figure 6.6), thus creating a
bubble as shown in Figure 6.7. The acquisition system is started and then liquid slug is
pushed through the test line via a combination of control and isolation valves (MV9 and
CV2), the liquid carrying the bubble with it. When the bubble has dropped out of the tube,
then the pneumatic valve, CV2 is closed.
The principle of the bubble experiment (see Section 6.1) is to measure the diminution in size
of the bubble as the bubble progresses along the channel, and from the rate of diminution
to deduce the entrainment rate. However, the test section length of the LOWPRESS facility
is not of sufficient length to apply this methodology accurately. Nevertheless, some
consistency checks can be made between the bubble experiment and the three-way valve
experiments and this topic will be addressed further in Section 6.3 below.
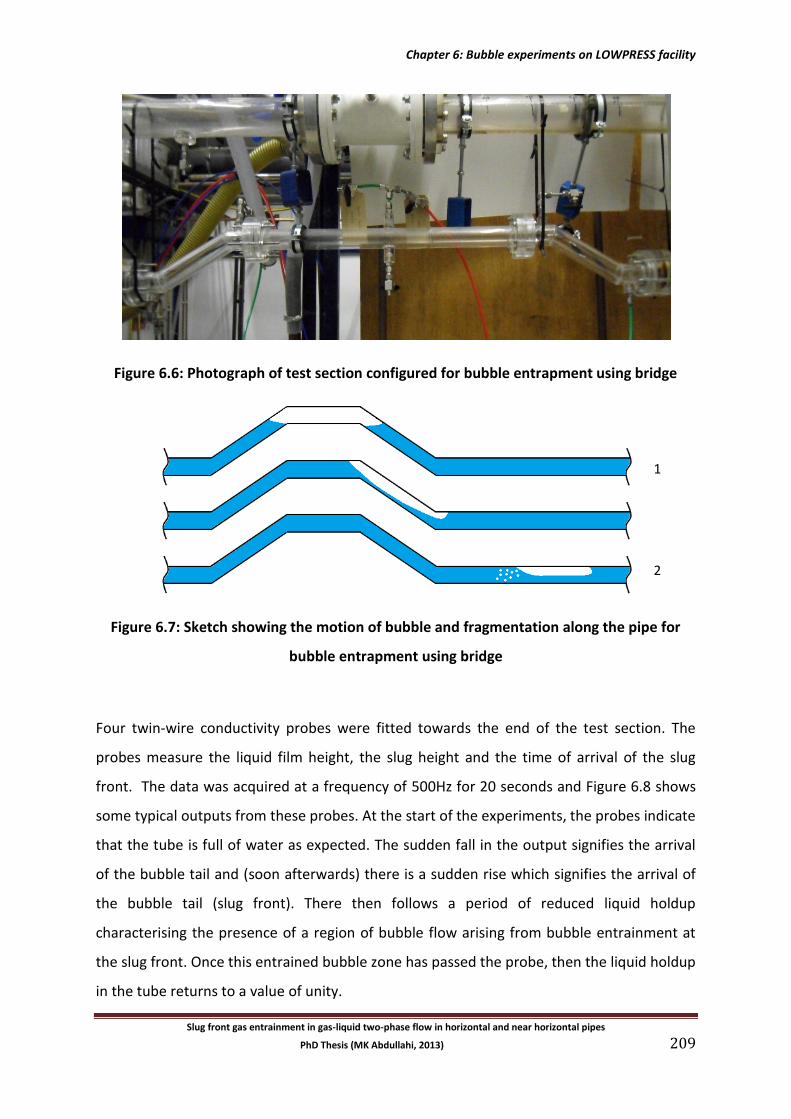
Chapter 6: Bubble experiments on LOWPRESS facility
Slug front gas entrainment in gas-liquid two-phase flow in horizontal and near horizontal pipes
PhD Thesis (MK Abdullahi, 2013) 209
Figure 6.6: Photograph of test section configured for bubble entrapment using bridge
Figure 6.7: Sketch showing the motion of bubble and fragmentation along the pipe for
bubble entrapment using bridge
Four twin-wire conductivity probes were fitted towards the end of the test section. The
probes measure the liquid film height, the slug height and the time of arrival of the slug
front. The data was acquired at a frequency of 500Hz for 20 seconds and Figure 6.8 shows
some typical outputs from these probes. At the start of the experiments, the probes indicate
that the tube is full of water as expected. The sudden fall in the output signifies the arrival
of the bubble tail and (soon afterwards) there is a sudden rise which signifies the arrival of
the bubble tail (slug front). There then follows a period of reduced liquid holdup
characterising the presence of a region of bubble flow arising from bubble entrainment at
the slug front. Once this entrained bubble zone has passed the probe, then the liquid holdup
in the tube returns to a value of unity.
1
2
3
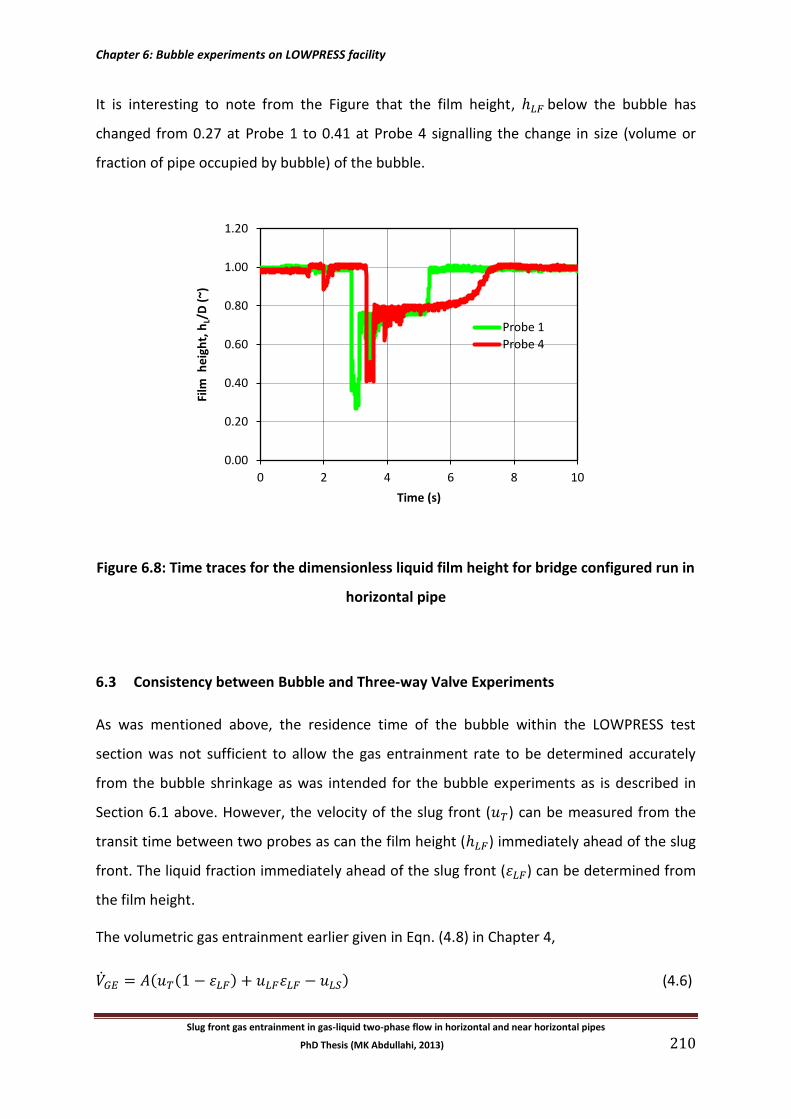
Chapter 6: Bubble experiments on LOWPRESS facility
Slug front gas entrainment in gas-liquid two-phase flow in horizontal and near horizontal pipes
PhD Thesis (MK Abdullahi, 2013) 210
It is interesting to note from the Figure that the film height, below the bubble has
changed from 0.27 at Probe 1 to 0.41 at Probe 4 signalling the change in size (volume or
fraction of pipe occupied by bubble) of the bubble.
Figure 6.8: Time traces for the dimensionless liquid film height for bridge configured run in
horizontal pipe
6.3 Consistency between Bubble and Three-way Valve Experiments
As was mentioned above, the residence time of the bubble within the LOWPRESS test
section was not sufficient to allow the gas entrainment rate to be determined accurately
from the bubble shrinkage as was intended for the bubble experiments as is described in
Section 6.1 above. However, the velocity of the slug front ( ) can be measured from the
transit time between two probes as can the film height ( ) immediately ahead of the slug
front. The liquid fraction immediately ahead of the slug front ( ) can be determined from
the film height.
The volumetric gas entrainment earlier given in Eqn. (4.8) in Chapter 4,
( ( ) ) (4.6)
0.00
0.20
0.40
0.60
0.80
1.00
1.20
0 2 4 6 8 10
Film
he
igh
t, h
L/D
(~)
Time (s)
Probe 1
Probe 4
Chapter 6: Bubble experiments on LOWPRESS facility
Slug front gas entrainment in gas-liquid two-phase flow in horizontal and near horizontal pipes
PhD Thesis (MK Abdullahi, 2013) 211
where is the film velocity. In the bubble experiments, is not known. It is convenient
to relate to the slug front velocity Tu by the expression:
(6.3)
It could be reasonably argued that must lie in the range 0 – 1. From the above, it follows
that:
( ) (6.4)
Thus, the calculated entrainment rate will depend on the value assumed for . The data for
gas entrainment rate have been correlated (see Equation 5.2) in the form (where
is the film width – see Equation 1.3.6c) against relative velocity which is defined as:
( ) (6.5)
Thus, for Since, in the bubble experiments, and have been measured
and the liquid feed rate ( ) is known, then (and hence ) and can be
calculated if a value of is specified. It is interesting to compare the results from the bubble
experiments (using the bridge system) with the results for the three-way valve system as
given in Chapters 4 and 5 and represented by Equation 5.2. Such a comparison is shown in
Figure 6.9 (data tabulated in Appendix F); in contrast to the three-way valve experiments,
the film velocity upstream of the slug front is not known but the range of possible values
can be investigated by varying and it will be seen from Figure 6.9 that agreement between
the bridge experiments and Equation 5.2 is achieved for a value in the range of about 0.3
to 0.4.
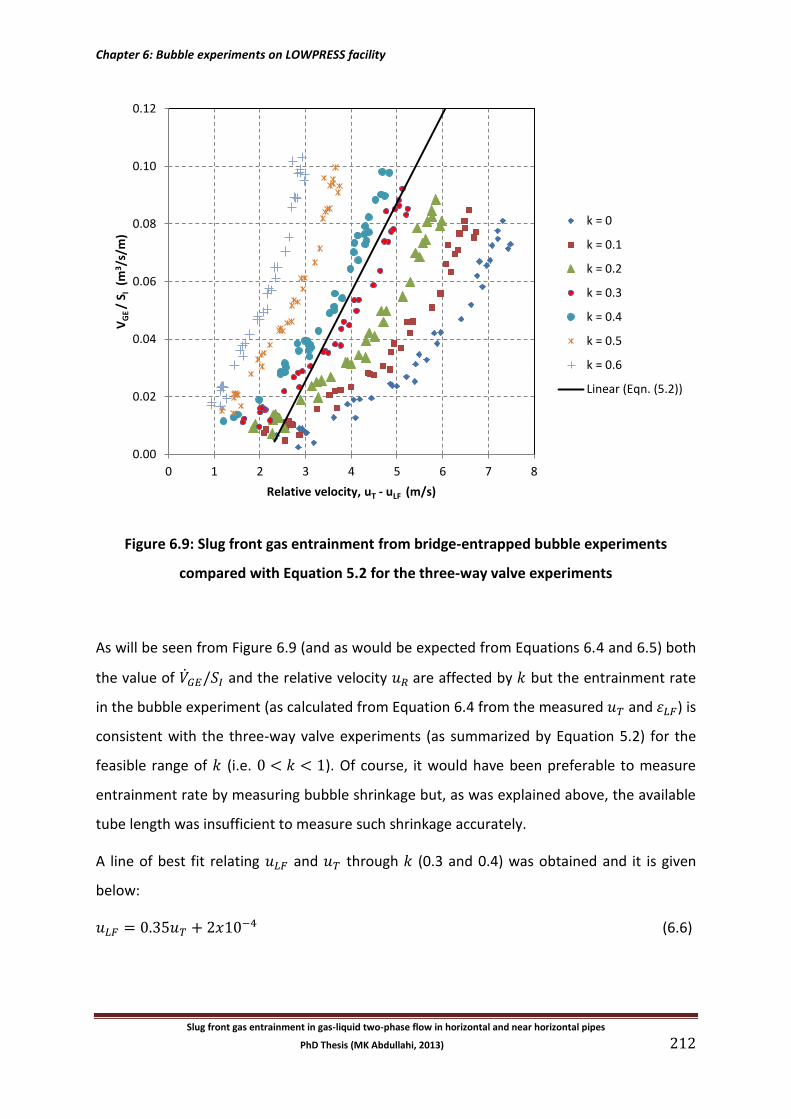
Chapter 6: Bubble experiments on LOWPRESS facility
Slug front gas entrainment in gas-liquid two-phase flow in horizontal and near horizontal pipes
PhD Thesis (MK Abdullahi, 2013) 212
Figure 6.9: Slug front gas entrainment from bridge-entrapped bubble experiments
compared with Equation 5.2 for the three-way valve experiments
As will be seen from Figure 6.9 (and as would be expected from Equations 6.4 and 6.5) both
the value of and the relative velocity are affected by but the entrainment rate
in the bubble experiment (as calculated from Equation 6.4 from the measured and ) is
consistent with the three-way valve experiments (as summarized by Equation 5.2) for the
feasible range of (i.e. ). Of course, it would have been preferable to measure
entrainment rate by measuring bubble shrinkage but, as was explained above, the available
tube length was insufficient to measure such shrinkage accurately.
A line of best fit relating and through (0.3 and 0.4) was obtained and it is given
below:
(6.6)
0.00
0.02
0.04
0.06
0.08
0.10
0.12
0 1 2 3 4 5 6 7 8
VG
E /
S I (
m3/s
/m)
Relative velocity, uT - uLF (m/s)
k = 0
k = 0.1
k = 0.2
k = 0.3
k = 0.4
k = 0.5
k = 0.6
Linear (Eqn. (5.2))
Chapter 6: Bubble experiments on LOWPRESS facility
Slug front gas entrainment in gas-liquid two-phase flow in horizontal and near horizontal pipes
PhD Thesis (MK Abdullahi, 2013) 213
6.4 Conclusion
An alternative method for measuring gas entrainment rate at the slug front in slug flow has
been investigated. In this “bubble method” the behaviour of a long bubble (simulating the
long bubble between the slug front and the slug tail in slug flow) has been investigated and
shows considerable promise. Following investigation of several alternative techniques, a
satisfactory methodology (the “bridge method”) has been demonstrated for the
entrapment of the initial bubble. It was not possible to obtain accurate measurements of
the bubble shrinkage rate because of the restricted length of the LOWPRESS facility.
However, measurements of slug front velocity and of liquid holdup upstream of the slug
front allowed estimates of entrainment rate to be made if a value of , the ratio of the
liquid film velocity upstream of the slug front to the slug translational velocity, is assumed.
Range values of k were used and it was shown that the bubble experiments were consistent
with the three-way valve experiments within the feasible range of (i.e. ).
Clearly, it would be a natural future development to carry out the bubble experiments in a
test section which had sufficient length for the accurate determination of bubble shrinkage.
Though this would give objective direct measurements of the entrainment rate (i.e. the
estimate of entrainment rate would not depend on measurements of front velocity etc),
there would still remain the problem of measuring the velocity of the film upstream of the
slug front if the entrainment rate were to be related to relative velocity. Two possible
methods for obtaining upstream of the slug front might be:
(1) Direct measurement of the velocity distribution in the film (and hence mean film
velocity) using Particle Image Velocimetry (PIV)
(2) Use of Computational Fluid Dynamics (CFD) to predict the film profile from the tail
and hence . Since small bubbles are not present from the slug tail to the slug
front in this experiment, this would make such a calculation easier
(3) There is the need to monitor the pressure along the pipeline to check if bubble was
compressed.
Chapter 7: Visualisation of slug front advance using high speed video photography on LOWPRESS facility
Slug front gas entrainment in gas-liquid two-phase flow in horizontal and near horizontal pipes
PhD Thesis (MK Abdullahi, 2013) 214
Chapter 7: Visualisation of Slug Front Advance Using High Speed Video
Photography on LOWPRESS Facility (32.8 mm diameter pipe)
Summary: In Chapters 4-6, experiments are described in which the rate of slug front
advance was used (in conjunction with other parameters) to calculate the rate of gas
entrainment at the slug front. The actual processes involved in slug front advance and the
associated gas entrainment are very complex indeed and, to gain insight into these
processes, a number of high speed video sequences were taken using an Olympus i-SPEED 3
video camera. The results from these studies are summarised in this present Chapter.
This Chapter consists of the following Sections:
7.1 Recording and Processing the Video Images
7.2 Slug Front Progression over Liquid Layer in Stratified Flow in a Horizontal Pipe
7.3 Slug Front Progression over a Downwards Flowing Liquid Film in a Slightly Upwards
Inclined Pipe
7.4 Slug Front Progression over a Stationary Liquid Film in a Horizontal Pipe
7.5 Comparison of Slug Front Progression over Stratified Layer, Downward Flowing Film
and Stationary Film
7.6 Conclusion
Chapter 7: Visualisation of slug front advance using high speed video photography on LOWPRESS facility
Slug front gas entrainment in gas-liquid two-phase flow in horizontal and near horizontal pipes
PhD Thesis (MK Abdullahi, 2013) 215
7.1 Recording and Processing the Video Images
The videos were recorded using an in-house Olympus high speed (i-SPEED 3) camera. A full
resolution recording at 2,000 fps (frames per second) was used throughout the experiments.
The Olympus i-SPEED 3 high speed video camera provides high resolution and light
sensitivity. It is the latest addition to the Olympus i-SPEED range and it can record up to
150,000 fps. Recorded movies are saved in a removable micro memory disk or to a PC.
Images are converted into movies using i-SPEED Suite software. Experiments for slug flow
visualisation were conducted on the LOWPRESS rig described in Chapter 3. The camera was
fixed to the tripod stand with the lens in place and then set to focus on the centre of the
pipe cross section at 3.5 m from the pipe inlet. The flow was set into the test section and
with the recording speed set at 2,000 fps the movie was made by pressing the record trigger
function. Recorded movies were replayed and viewed on the display unit. The Images were
saved in a removable card and then later converted into movies using i-SPEED Suite
software.
7.2 Slug front Progression over Liquid Layer in Stratified Flow in a Horizontal Pipe
Instantaneous images (a) to (c) in Figure 7.1 are for an advancing slug flowing over a
stratified flow at different stages. Images (a) and (b) show an aerated slug with the front
lifted above the stratified flow. This sequence shows the complexity of the interaction
between the advancing slug front and the liquid layer ahead of it. In this run, the stratified
flow set up before the slug was injected was for superficial velocities of 1.54 m/s and
0.0395m/s for air and water respectively; the slug feed rate was 3.727 m/s. In image (c),
the slug has bridged the first part of the pipe cross section exhibiting very large gas
entrainment. The stratified ahead of the slug was smooth (see Figure 4.10).
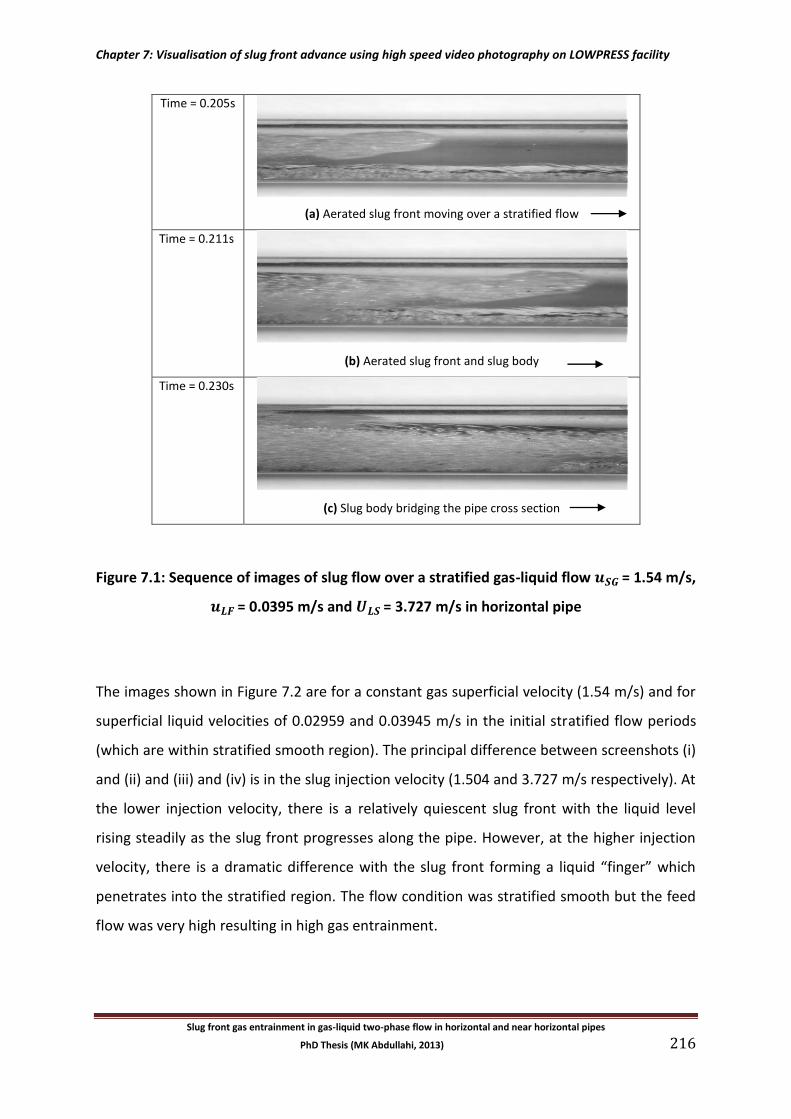
Chapter 7: Visualisation of slug front advance using high speed video photography on LOWPRESS facility
Slug front gas entrainment in gas-liquid two-phase flow in horizontal and near horizontal pipes
PhD Thesis (MK Abdullahi, 2013) 216
Time = 0.205s
(a) Aerated slug front moving over a stratified flow
Time = 0.211s
(b) Aerated slug front and slug body
Time = 0.230s
(c) Slug body bridging the pipe cross section
Figure 7.1: Sequence of images of slug flow over a stratified gas-liquid flow = 1.54 m/s,
= 0.0395 m/s and = 3.727 m/s in horizontal pipe
The images shown in Figure 7.2 are for a constant gas superficial velocity (1.54 m/s) and for
superficial liquid velocities of 0.02959 and 0.03945 m/s in the initial stratified flow periods
(which are within stratified smooth region). The principal difference between screenshots (i)
and (ii) and (iii) and (iv) is in the slug injection velocity (1.504 and 3.727 m/s respectively). At
the lower injection velocity, there is a relatively quiescent slug front with the liquid level
rising steadily as the slug front progresses along the pipe. However, at the higher injection
velocity, there is a dramatic difference with the slug front forming a liquid “finger” which
penetrates into the stratified region. The flow condition was stratified smooth but the feed
flow was very high resulting in high gas entrainment.
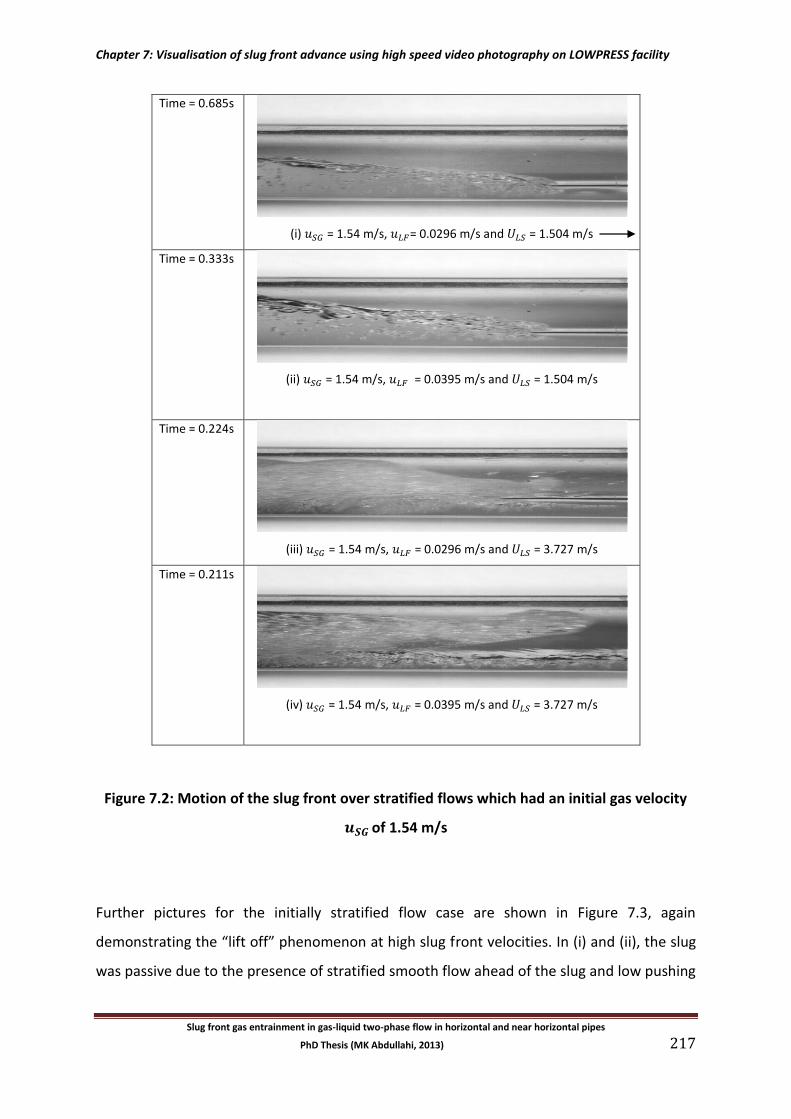
Chapter 7: Visualisation of slug front advance using high speed video photography on LOWPRESS facility
Slug front gas entrainment in gas-liquid two-phase flow in horizontal and near horizontal pipes
PhD Thesis (MK Abdullahi, 2013) 217
Time = 0.685s
(i) = 1.54 m/s, = 0.0296 m/s and = 1.504 m/s
Time = 0.333s
(ii) = 1.54 m/s, = 0.0395 m/s and = 1.504 m/s
Time = 0.224s
(iii) = 1.54 m/s, = 0.0296 m/s and = 3.727 m/s
Time = 0.211s
(iv) = 1.54 m/s, = 0.0395 m/s and = 3.727 m/s
Figure 7.2: Motion of the slug front over stratified flows which had an initial gas velocity
of 1.54 m/s
Further pictures for the initially stratified flow case are shown in Figure 7.3, again
demonstrating the “lift off” phenomenon at high slug front velocities. In (i) and (ii), the slug
was passive due to the presence of stratified smooth flow ahead of the slug and low pushing
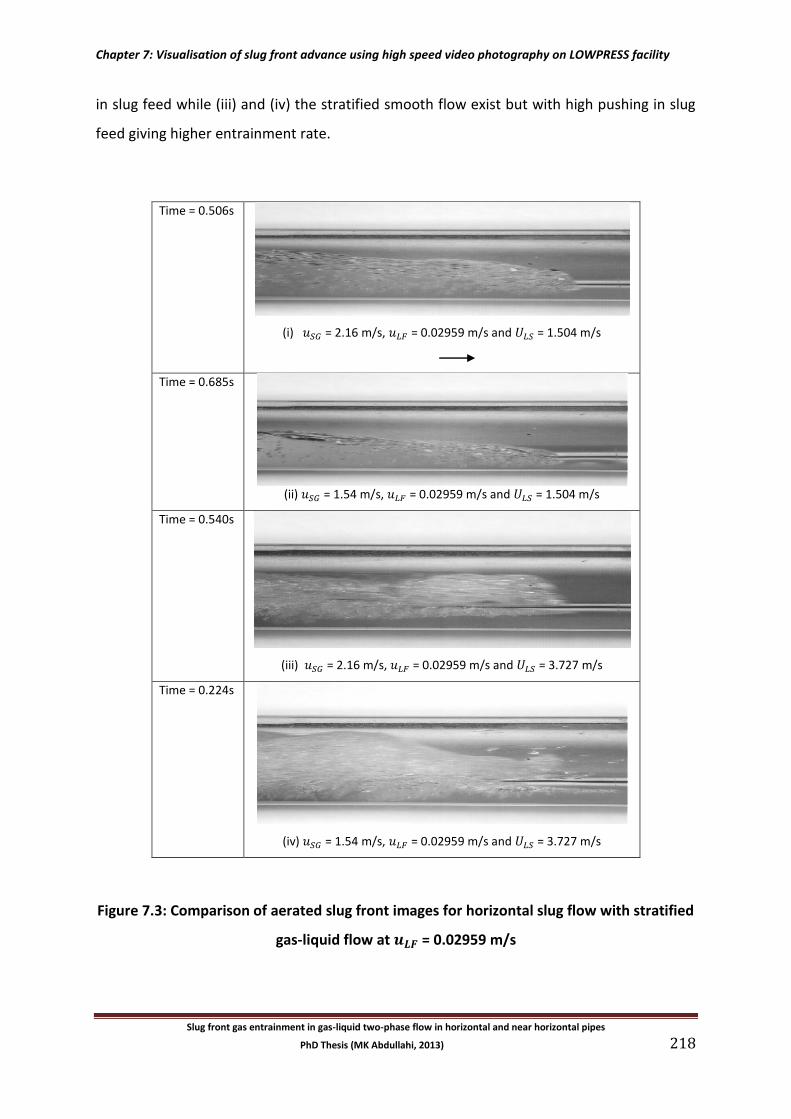
Chapter 7: Visualisation of slug front advance using high speed video photography on LOWPRESS facility
Slug front gas entrainment in gas-liquid two-phase flow in horizontal and near horizontal pipes
PhD Thesis (MK Abdullahi, 2013) 218
in slug feed while (iii) and (iv) the stratified smooth flow exist but with high pushing in slug
feed giving higher entrainment rate.
Time = 0.506s
(i) = 2.16 m/s, = 0.02959 m/s and = 1.504 m/s
Time = 0.685s
(ii) = 1.54 m/s, = 0.02959 m/s and = 1.504 m/s
Time = 0.540s
(iii) = 2.16 m/s, = 0.02959 m/s and = 3.727 m/s
Time = 0.224s
(iv) = 1.54 m/s, = 0.02959 m/s and = 3.727 m/s
Figure 7.3: Comparison of aerated slug front images for horizontal slug flow with stratified
gas-liquid flow at = 0.02959 m/s
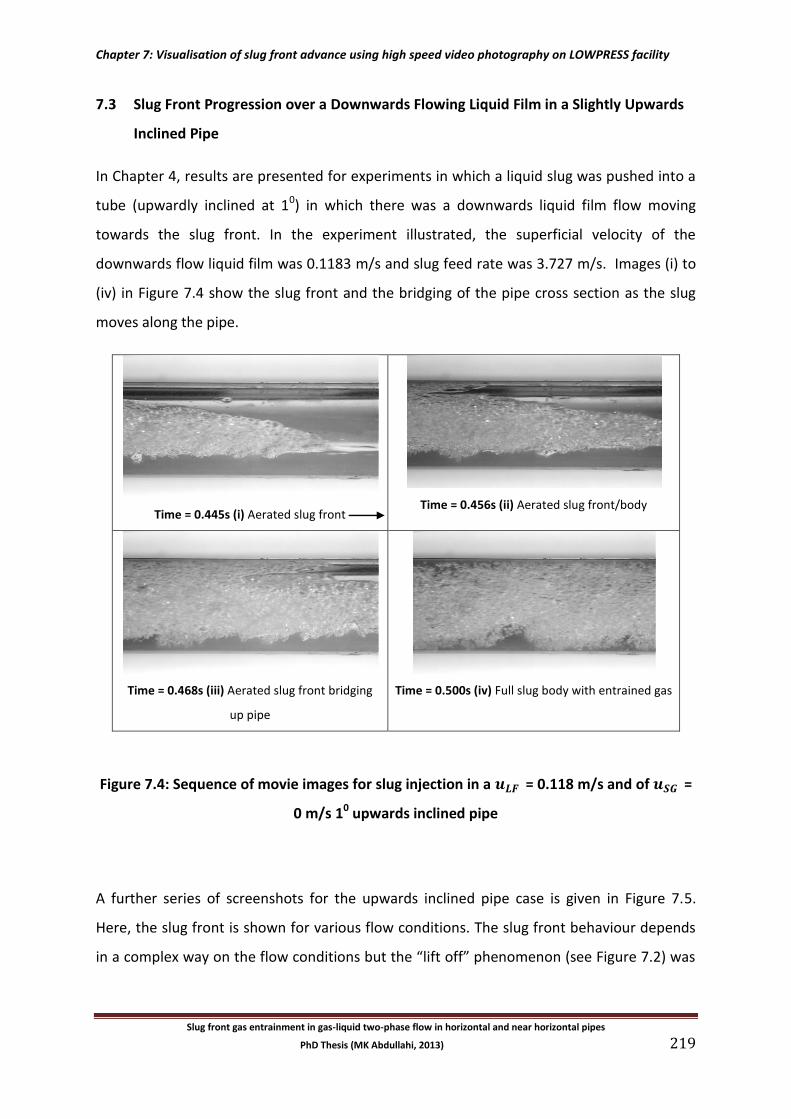
Chapter 7: Visualisation of slug front advance using high speed video photography on LOWPRESS facility
Slug front gas entrainment in gas-liquid two-phase flow in horizontal and near horizontal pipes
PhD Thesis (MK Abdullahi, 2013) 219
7.3 Slug Front Progression over a Downwards Flowing Liquid Film in a Slightly Upwards
Inclined Pipe
In Chapter 4, results are presented for experiments in which a liquid slug was pushed into a
tube (upwardly inclined at 10) in which there was a downwards liquid film flow moving
towards the slug front. In the experiment illustrated, the superficial velocity of the
downwards flow liquid film was 0.1183 m/s and slug feed rate was 3.727 m/s. Images (i) to
(iv) in Figure 7.4 show the slug front and the bridging of the pipe cross section as the slug
moves along the pipe.
Time = 0.445s (i) Aerated slug front
Time = 0.456s (ii) Aerated slug front/body
Time = 0.468s (iii) Aerated slug front bridging
up pipe
Time = 0.500s (iv) Full slug body with entrained gas
Figure 7.4: Sequence of movie images for slug injection in a = 0.118 m/s and of =
0 m/s 10 upwards inclined pipe
A further series of screenshots for the upwards inclined pipe case is given in Figure 7.5.
Here, the slug front is shown for various flow conditions. The slug front behaviour depends
in a complex way on the flow conditions but the “lift off” phenomenon (see Figure 7.2) was
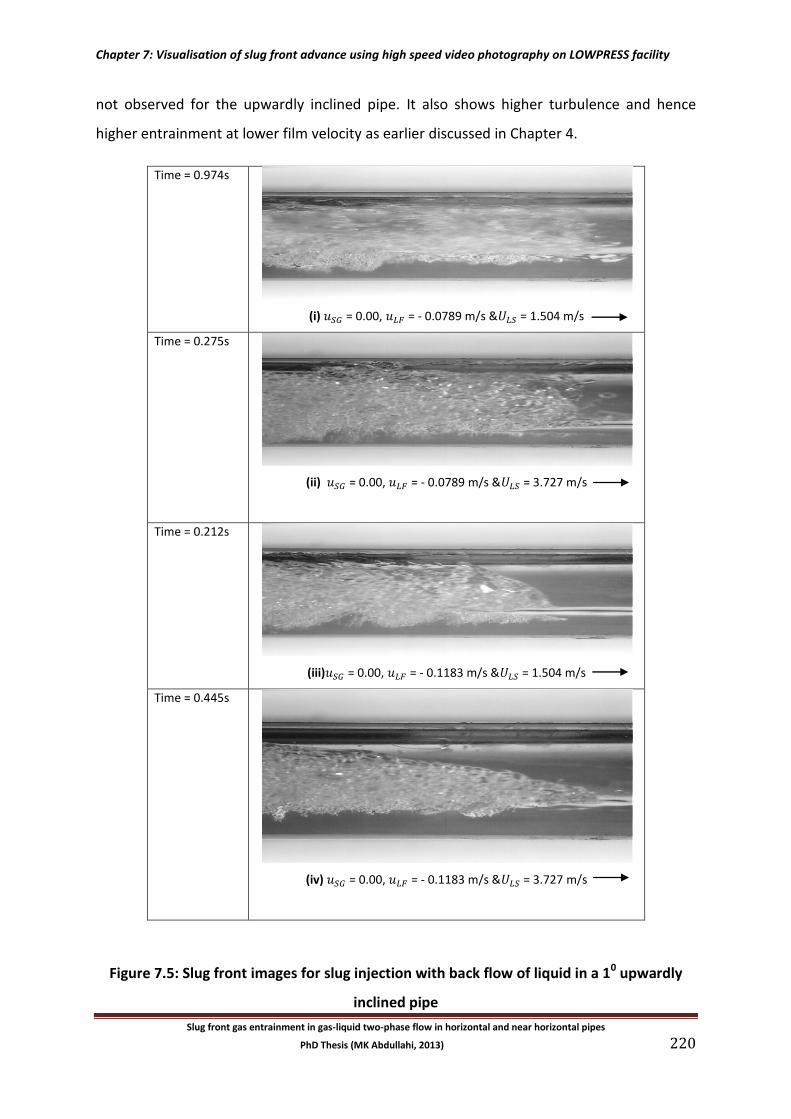
Chapter 7: Visualisation of slug front advance using high speed video photography on LOWPRESS facility
Slug front gas entrainment in gas-liquid two-phase flow in horizontal and near horizontal pipes
PhD Thesis (MK Abdullahi, 2013) 220
not observed for the upwardly inclined pipe. It also shows higher turbulence and hence
higher entrainment at lower film velocity as earlier discussed in Chapter 4.
Time = 0.974s
(i) = 0.00, = - 0.0789 m/s & = 1.504 m/s
Time = 0.275s
(ii) = 0.00, = - 0.0789 m/s & = 3.727 m/s
Time = 0.212s
(iii) = 0.00, = - 0.1183 m/s & = 1.504 m/s
Time = 0.445s
(iv) = 0.00, = - 0.1183 m/s & = 3.727 m/s
Figure 7.5: Slug front images for slug injection with back flow of liquid in a 10 upwardly
inclined pipe
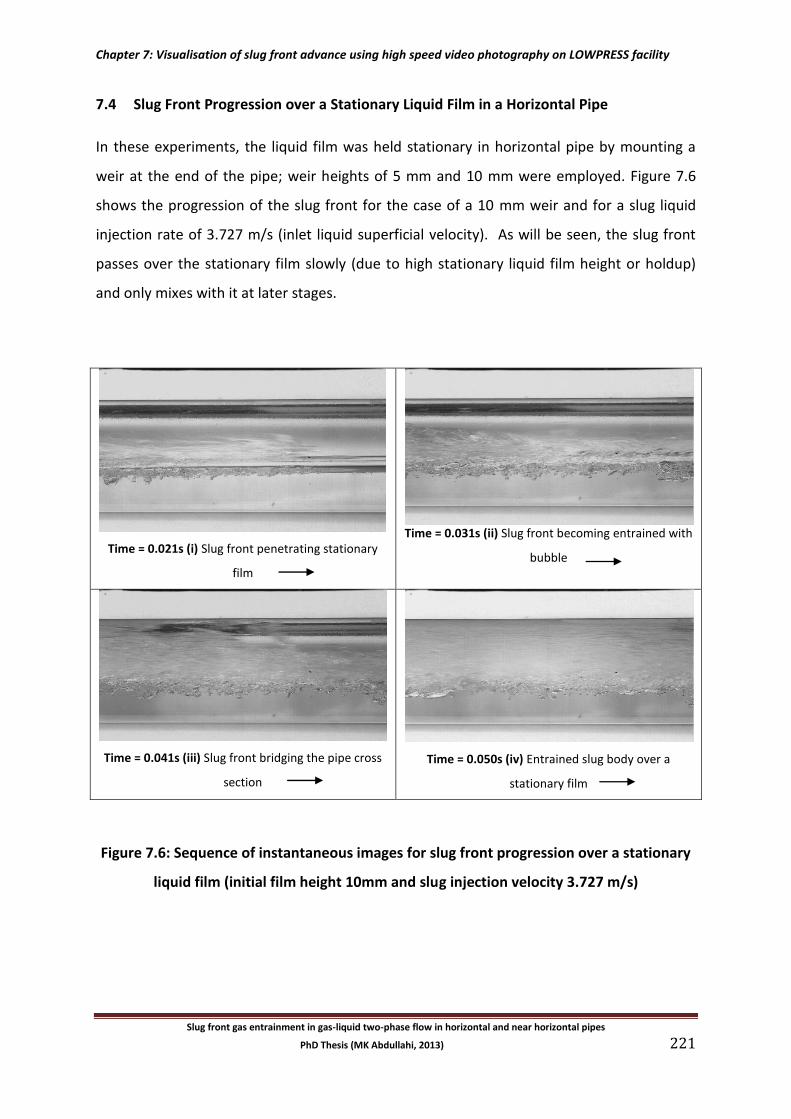
Chapter 7: Visualisation of slug front advance using high speed video photography on LOWPRESS facility
Slug front gas entrainment in gas-liquid two-phase flow in horizontal and near horizontal pipes
PhD Thesis (MK Abdullahi, 2013) 221
7.4 Slug Front Progression over a Stationary Liquid Film in a Horizontal Pipe
In these experiments, the liquid film was held stationary in horizontal pipe by mounting a
weir at the end of the pipe; weir heights of 5 mm and 10 mm were employed. Figure 7.6
shows the progression of the slug front for the case of a 10 mm weir and for a slug liquid
injection rate of 3.727 m/s (inlet liquid superficial velocity). As will be seen, the slug front
passes over the stationary film slowly (due to high stationary liquid film height or holdup)
and only mixes with it at later stages.
Time = 0.021s (i) Slug front penetrating stationary
film
Time = 0.031s (ii) Slug front becoming entrained with
bubble
Time = 0.041s (iii) Slug front bridging the pipe cross
section
Time = 0.050s (iv) Entrained slug body over a
stationary film
Figure 7.6: Sequence of instantaneous images for slug front progression over a stationary
liquid film (initial film height 10mm and slug injection velocity 3.727 m/s)
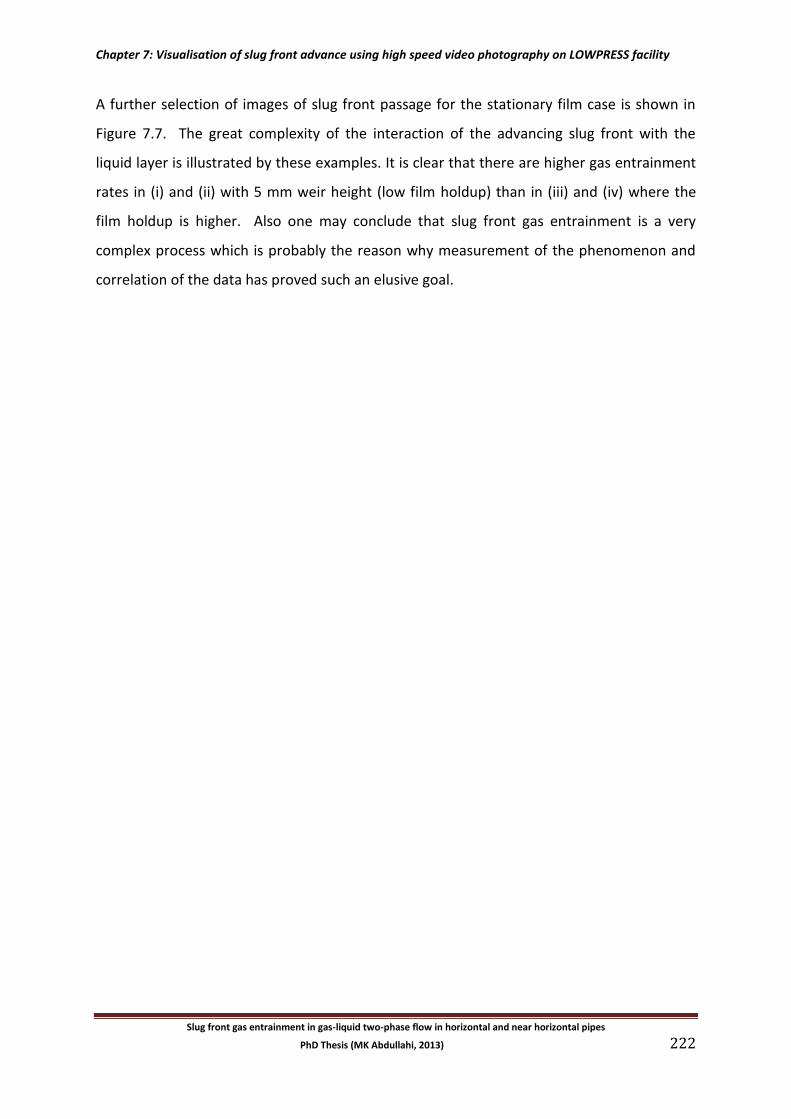
Chapter 7: Visualisation of slug front advance using high speed video photography on LOWPRESS facility
Slug front gas entrainment in gas-liquid two-phase flow in horizontal and near horizontal pipes
PhD Thesis (MK Abdullahi, 2013) 222
A further selection of images of slug front passage for the stationary film case is shown in
Figure 7.7. The great complexity of the interaction of the advancing slug front with the
liquid layer is illustrated by these examples. It is clear that there are higher gas entrainment
rates in (i) and (ii) with 5 mm weir height (low film holdup) than in (iii) and (iv) where the
film holdup is higher. Also one may conclude that slug front gas entrainment is a very
complex process which is probably the reason why measurement of the phenomenon and
correlation of the data has proved such an elusive goal.
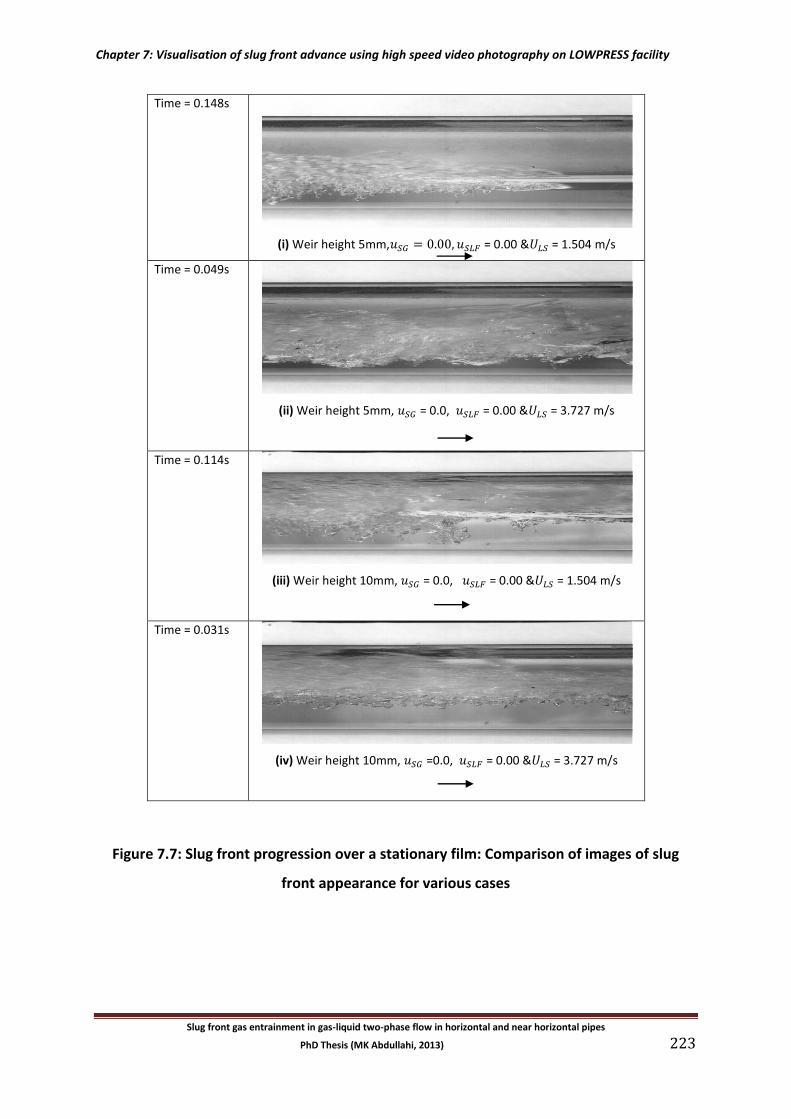
Chapter 7: Visualisation of slug front advance using high speed video photography on LOWPRESS facility
Slug front gas entrainment in gas-liquid two-phase flow in horizontal and near horizontal pipes
PhD Thesis (MK Abdullahi, 2013) 223
Time = 0.148s
(i) Weir height 5mm, = 0.00 & = 1.504 m/s
Time = 0.049s
(ii) Weir height 5mm, = 0.0, = 0.00 & = 3.727 m/s
Time = 0.114s
(iii) Weir height 10mm, = 0.0, = 0.00 & = 1.504 m/s
Time = 0.031s
(iv) Weir height 10mm, =0.0, = 0.00 & = 3.727 m/s
Figure 7.7: Slug front progression over a stationary film: Comparison of images of slug
front appearance for various cases
Chapter 7: Visualisation of slug front advance using high speed video photography on LOWPRESS facility
Slug front gas entrainment in gas-liquid two-phase flow in horizontal and near horizontal pipes
PhD Thesis (MK Abdullahi, 2013) 224
7.5 Comparison of Slug Front Progression over Stratified Layer, Downward Flowing Film
and Stationary Liquid Film.
Figure 7.8 compares images of the slug front passing the point of observation for three
cases, all of which had the same slug injection superficial velocity (1.504 m/s). The
respective cases are (a) slug passage over an initially stratified flow in a horizontal tube, (b)
slug passage over a falling liquid layer in a slightly upwards inclined pipe and (c) slug front
passage over a stationary liquid layer. As will be seen from Figure 7.8, the detailed
progression of the slug front is different for the three cases.
Chapter 7: Visualisation of slug front advance using high speed video photography on LOWPRESS facility
Slug front gas entrainment in gas-liquid two-phase flow in horizontal and near horizontal pipes
PhD Thesis (MK Abdullahi, 2013) 225
Time = 0.285s
(a) Stratified flow: = 2.16 m/s, = 0.03945 m/s & = 1.504
m/s
Time = 0.898s
(b) Down-flow of Liquid Film: = 0.00 m/s, = -0.03945 m/s &
= 1.504 m/s
Time = 0.148s
(c) Stationary Liquid Film: = 0.00, = 0.0 & = 1.504 m/s
Figure 7.8: Comparison of slug front progression for stratified flow, downwards film flow
and stationary film cases (slug feed superficial velocity = 1.504 m/s)
Chapter 7: Visualisation of slug front advance using high speed video photography on LOWPRESS facility
Slug front gas entrainment in gas-liquid two-phase flow in horizontal and near horizontal pipes
PhD Thesis (MK Abdullahi, 2013) 226
7.6 Conclusion
Detailed observation of the slug front progression using high definition, high speed video
recording has demonstrated the complexity of the phenomena involved. The differences
observed between slug progression over films in various conditions (moving stratified layer,
downward flowing film and stationary film) perhaps explains some of the differences
between results for slug front gas entrainment as discussed in Chapter 2. Also as shown in
Chapter 4, these differences are as result of the differences on the main parameters
controlling gas entrainment for the three experiments (stratified flow type, film velocity in
inclined flow and film holdup in stationary film). It is believed that the results from the new
three-way valve experiments described in Chapters 4 and 5 (and their correlation in
Equation 5.2) give a reasonably close simulation of the situation which would be
encountered in slug flow, but more studies are required, particularly on the effects of fluid
physical properties, before general relationships can be established for slug front gas
entrainment.
Chapter 8: Conclusions and recommendations
Slug front gas entrainment in gas-liquid two-phase flow in horizontal and near horizontal pipes
PhD Thesis (MK Abdullahi, 2013) 227
Chapter 8: Conclusions and Recommendations
Summary: In this chapter, the principal conclusions from the work described in this thesis are
summarised (in Section 8.1) and the principal recommendations for further work are listed
(Section 8.2).
8.1 Conclusions
The following main conclusions are drawn:
(1) An examination of the previous literature on slug front gas entrainment in slug flow
indicates a large diversity in the results and in the correlations of these results. There was
a clear need for a more objective method for measurement of the entrainment rate and
for improved correlations for inclusion in slug flow models.
(2) The new three-way valve experiment as described in Chapter 4 has been applied to
measurement of slug front gas entrainment in 32.8 mm (Chapter 4) and in 78 mm
(Chapter 5) diameter tubes and gave reliable and reproducible results.
(3) The results using the three-way valve method for the 32.4 mm and 78 mm diameter tubes
are consistent when plotted as gas entrainment rate per unit film width against relative
velocity (difference between slug front velocity and film velocity). Thus, a correlation
representing this relationship (Equation 5.2) will serve as a working correlation for slug
front gas entrainment. One case which obviously cannot be represented by this
correlation is that of entrainment (which does occur) at the slug front where there is a dry
tube (no preceding film) ahead of the slug. This would imply infinite entrainment rate per
unit film width! However, this is rather an artificial case which would not occur in real slug
flows.
Chapter 8: Conclusions and recommendations
Slug front gas entrainment in gas-liquid two-phase flow in horizontal and near horizontal pipes
PhD Thesis (MK Abdullahi, 2013) 228
(4) The results indicated that there was not much difference between the gas entrainment
rates for horizontal and near-horizontal (1 0 upwards inclined) tubes.
(5) An alternative measurement method for slug front gas entrainment rate (the “bubble”
method) was also investigated. In this method an elongated bubble (representing the
elongated bubble between the slug tail and the slug front in slug flow) is trapped between
upstream and downstream liquid zones. This entrapped bubble is pushed along the tube
by motivating the downstream liquid zone. There is no gas addition to the bubble at the
tail; this contrasts with the case of a real slug flow where gas is being entrained at the
preceding slug front and released at the tail. Thus, in the bubble experiment, the bubble
shrinks as a result of gas entrainment at the front and the rate of entrainment can, in
principle, be determined from the bubble shrinkage. A successful method was developed
(the “bridge method” – see Chapter 6) for entrapment of the bubble but, unfortunately,
there was insufficient space in the laboratory to allow a sufficiently long tube to be
installed to obtain an accurate measurement of the shrinkage rate. However, by
measuring the propagation velocity of the bubble tail (slug front) it was possible to
establish the consistency between these experiments and the three-way valve
experiments.
(6) Using high speed video photography (see Chapter 7) it was possible to examine the
complex processes associated with slug front gas entrainment. There were significant
differences between the cases where the upstream liquid layer was moving forwards, or
moving backwards or was stationary.
8.2 Recommendations
The following recommendations are made for future work in this area:
(1) The three-way valve experiments with the 78 mm tube on the WASP facility should be
extended to higher velocities. To achieve this, more rapid closure of the three-way valve
will be needed (see Chapter 5 for discussion of this issue).
(2) The three-way valve experiments (with both the 32.8 mm and 78 mm tubes – and possibly
other tubes) should be extended to cover a wider range of fluid physical properties. Thus,
Chapter 8: Conclusions and recommendations
Slug front gas entrainment in gas-liquid two-phase flow in horizontal and near horizontal pipes
PhD Thesis (MK Abdullahi, 2013) 229
higher gas densities could be covered by increasing the operating pressure and liquid
surface tension and viscosity could be varied by the choice of suitable liquid phases (an
easy option here would be to use the Shell Tellus oil already available on the WASP
facility).
(3) The bubble experiments should be implemented with longer test sections to allow the
entrainment rate to be estimated from bubble shrinkage. Means would also ideally be
sought to measure the liquid film velocity immediately upstream of the bubble tail (slug
front). The experiment might possibly be extended to the study of two successive bubbles
to get a better understanding of the slug tail gas release as well as the slug front gas
entrainment mechanisms.
(4) The bubble experiments should also be conducted with a wider range of physical
properties, and particularly liquid physical properties.
(5) Both the three-way valve and the bubble experiments could be applied in inclined (and
even vertical) tubes. There has been considerable interest in gas entrainment rates in
vertical gas-liquid slug flow. In a typical experiment, the Taylor bubble is made stationary
by imposing a downwards liquid flow. Gas is entrained at the bubble skirt and this would
cause the stationary bubble to contract. However, a steady state may be maintained by
injecting gas into the stationary bubble, the injection rate being an indication of the
entrainment rate. However, there has to be some doubt as to whether the stationary
bubble experiment is truly representative of a real slug flow case and the form of bubble
experiment investigated in the present work may give more realistic answers.

Slug front gas entrainment in gas-liquid two-phase flow in horizontal and near horizontal pipes
PhD Thesis (MK Abdullahi, 2013) 230
References
Slug front gas entrainment in gas-liquid two-phase flow in horizontal and near horizontal pipes
PhD Thesis (MK Abdullahi, 2013) 231
REFERENCES
A
Abdullahi M.K., Pierre B., Hale C.P. and Hewitt G.F. (2011): Experiments on Gas Entrainment
in Two-phase Slug Flows using a Single Entrapped Gas Bubble. 15th International Conference
on Multiphase Production Technology organised by BHR Group, Cannes, France 15-17 June
2011, pp 359 – 370.
Abdul-Majeed G.H. (2000): Liquid slug holdup in horizontal and slightly inclined two-phase
slug flow. Journal of Petroleum Science & Engineering, vol. 27, pp. 27-32.
Abduvayt P., Arihara N. Manabe R. & Ikeda K (2003): Experimental and modeling studies for
gas-liquid two-phase flow at high pressure conditions. J. Japan Petroleum Inst., vol. 46, no.
2, pp. 111-125.
Andreussi P. & Bendiksen K. (1989): An investigation of void fraction in liquid slugs for
horizontal and inclined gas-liquid pipe flow. Int. J. Multiphase Flow, Vol. 15, No. 6, pp. 937-
946.
Azzopardi, B.J. & Wren, E. (2004): What is entrainment in vertical two-phase churn flow?
International Journal of Multiphase Flow, vol. 30, pp. 89-103.
B
Baker M. Jr. (2005): Nigliq Channel HDD Crossing White Paper. Prepared for ConocoPhillips.
Barnea D. (1987): A unified model for predicting Flow pattern transition for the whole pipe
inclinations. International Journal of Multiphase Flow, vol. 13, pp. 1-12.
Barnea D. & Brauner N. (1985): Holdup of the liquid slug in two-phase intermittent flow. Int.
J. Multiphase Flow, Vol. 11, No. 1, pp. 43-49.
Barnea D., Shoham O. & Taitel Y. (1982): Flow pattern transition for downward inclined two
phase flow; horizontal to vertical. Chemical Engineering Science” vol. 37, no. 5, pp. 735-740.
References
Slug front gas entrainment in gas-liquid two-phase flow in horizontal and near horizontal pipes
PhD Thesis (MK Abdullahi, 2013) 232
Beatie, D.R.H. & Whaley, P.B. (1982): A simple two-phase frictional pressure drop calculation
method. International Journal of Multiphase Flow, vol. 8, pp. 83-87.
Bendiksen K. H. (1984): An Experimental Investigation of the Motion of Long Bubbles in
Inclined Tubes. International Journal of Multiphase Flow, vol. 10, No. 4, Pages: 467-483,
1984.
Bonizzi M., Issa R. I. (2003): A Model for Simulating Gas Bubble Entrainment in Two-Phase
Horizontal Slug Flow. International Journal of Multiphase Flow, Volume 29, Issue 11,
November 2003, Pages: 1685-1717.
Bos A. & Du Chatinier J.G. (1994): The Front of a Sphere-Propelled Liquid Slug in a Natural-
Gas Pipeline. Int. J. Multiphase Flow, Vol. 20, pp. 535-546.
Brauner, N. & Ullmann, A. (2004): Modelling of gas entrainment from Taylor bubbles: Part A:
Slug flow. International Journal of Multiphase Flow, Volume 30, pp. 239-272.
Brown R.C., Andreussi P. & Zanelli S. (December 1978): The use of wire probes for the
measurement of liquid film thickness in annular gas-liquid flows. The Canadian Journal of
Chemical Engineering, Vol. 56, No. 6, pp.754-757.
C
Chanson, H. (March, 2002): Air-water flow measurements with intrusive, phase-detection
probes: Can we improve their interpretation? Journal of Hydraulic Engineering, pp. 252-255.
Cohen, L.S. & Hanratty, T.J. (1968): Effect of waves at gas-liquid interface on a turbulent air
flow. J Fluid MEch. Vol. 31, pp. 467-479.
Collier, J.G. & Hewitt, G.F. (1967): Brit Chem. Eng., vol 12, no. 5, 231-237.
Cook M.C & Behnia M. (2000): Pressure drop calculations and modeling of inclined
intermittent gas-liquid flow. Chemical Engineering Science, vol. 55, pp. 4699-4708.
Cook M.C. & Behnia M. (1997): Film profile behind liquid slugs in gas-liquid flow. AIChE
Journal, vol. 43, pp. 2180-2186.
References
Slug front gas entrainment in gas-liquid two-phase flow in horizontal and near horizontal pipes
PhD Thesis (MK Abdullahi, 2013) 233
Coney, M.W.E (1972): The application of conductivity probes to the measurements of liquid
film thickness in two-phase flow. Central Electricity Research Laboratories, Report no. rd/l/n
231/72.
D
Darby R (2001): Chemical engineering fluid mechanics. 2nd edition, CRC Press Taylor &
Francis Group, New York. Pp 304 – 307.
Davies S.R. (1992): Studies of two-phase intermittent flow in pipelines. PhD Thesis,
Department of Chemical Engineering And Chemical Technology, Imperial College of Science,
Technology & Medicine, London, England, June 1992, pp. 1-348.
Drahos J. & Cermak J. (1989): Diagnostics of gas-liquid flow patterns in chemical engineering
system. Chem. Eng. Process, vol. 26, pp. 147-164.
Dukler A.E. & Hubbard M.G. (1975): A model for gas-liquid slug flow in horizontal and near
horizontal tubes. I & EC Fundamentals, vol. 14, pp. 337-347.
E
Einstein, A. (1906): A new determination of molecular dimensions. Annal of Physics, vol. 19,
pp. 289.
F
Fabre J. & Line A. (1992): Modelling of two-phase slug flow. Annual Review Fluid Mech., vol.
24, pp. 21-46.
Fadipe A., Vivour M., (2006): Experimental study of the Air Entrainment mechanisms in a
hydraulic jump and slug flow. UG Thesis, Department of Chemical Engineering and Chemical
Technology, Imperial College London.
Fearn, R.M. (1988): Perturbed motions of a bubble rising in a vertical tube. Phys. Fluids, vol.
31, pp. 238-241.
References
Slug front gas entrainment in gas-liquid two-phase flow in horizontal and near horizontal pipes
PhD Thesis (MK Abdullahi, 2013) 234
G
Glasstone, S. (1942): Introduction to Electrochemistry. VanNostrand, New York.
Gomez L.E., Shoham O. & Taitel Y. (2000): Prediction of slug liquid holdup: horizontal to
upward vertical flow. Int. J. Multiphase flow, vol. 26, pp. 517-521.
Gregory G.A., Nicholson M.K. & Aziz K. (1978): Correlation of the liquid volume fraction in
the slug for horizontal gas-liquid slug flow. Int. J. Multiphase Flow, Vol. 4, pp. 33-39.
Gregory G.A. & Scott D.S. (1969): Correlation of liquid slug velocity and frequency in
horizontal co-current gas-liquid slug flow. AIChE Journal, vol. 15, pp. 833-835.
H
Hand, N.P. (1991): Gas–Liquid Co-current Flow in a Horizontal Pipe. PhD Thesis, Queen’s
University, Belfast.
Hale C.P., Hewitt G.F., Manolis I.G., Mendes M.A., Richardson S.M. & Wong W.L. (2005):
Experimental and analytical studies of gas entrainment phenomena in slug flow in horizontal
and near horizontal pipes. Multiphase Science & Tech. vol 17, no 1-3, pp. 1-22.
Hale C.P., Hewitt G.F., Manolis I.G., Mandes M.A., Richardson S.M. and Wong W.L., (2007):
Experimental and Analytical Studies of Gas Entrainment Phenomena in Slug Flow in
Horizontal and Near Horizontal Pipes. Multiphase Science and Technology, Volume 17, Nos.
1-3, pp. 1-22.
Hale C.P., (2007): Gas Entrainment Experiments for Stationary Liquid Film on WASP. Private
Communication, Imperial College London
Harmathy, T.Z. (1960): Velocity of large drops and bubbles in media of infinite or restricted
extent. AIChE J. 6, 281–288.
Hewitt G.F. (1978): Measurement of two phase flow parameters. Academic Press, New
York, 1978.
Hewitt G.F. & Hall-Taylor N.S. (1970): Annular two phase flow. Pergamon Press.
References
Slug front gas entrainment in gas-liquid two-phase flow in horizontal and near horizontal pipes
PhD Thesis (MK Abdullahi, 2013) 235
Hewitt G.F. (2005): Gas-liquid flow. Thermopedia A-Z Guide to Thermodynamic, Heat &
Mass Transfer and Fluid Engineering, Electronic Data Centre.
http://www.thermopedia.com/toc/chapt_g/ch07s36.html?cmd=print
Hewitt G.F. (2008): Empirical and Phenomenological Models for Multiphase Flows II –
Horizontal Flows. Section 4 25th Short Courses on Modelling and Computations of
Multiphase Flows, Zurich, Switzerland 11-15 February, Part I-Bases, pp 4-5.
Hulburt, E.T. and Hanratty T.J. (2002): Prediction of transition from stratified to slug flow
and plug flow for long pipes. Int. J. of Multiphase Flow, vol. 28, pp. 707-729.
I
Ishii Y.M. & Tsoukalas L.H. (2001): Flow regime identification methodology with neural
networks and two-phase flow models. Nuclear Eng. & Design, vol. 204, pp. 87-100.
Issa R.I. & Kempf M.H.W. (2003): Simulation of slug flow in horizontal and near horizontal
pipes with the two-fluid model. Int. J. of Multiphase Flow, vol. 29, pp. 69-95.
J
Jepson W. P. (1987): The Flow Characteristics in Horizontal Slug Flow. 3rd International
Conference on Multi-Phase Flow, The Hague, Netherlands.
K
Kadri, U., Zoeteweiji, M.L., Mudde, R.F. & Oliemans, R.V.A. (2009a): A growth model for
dynamic slug in gas-liquid horizontal pipes. Int. J. of Multiphase Flow, vol. 35, pp. 439-449.
Kirpalani D.M., Patel T., Mehrani P. & Macchi A. (2007): Experimental analysis of the unit cell
approach for two-phase flow dynamics in curved flow channels. Int. J. of Heat & Mass
Transfer, doi:10.106/j.ijheatmasstransfer.2007.05.020.
References
Slug front gas entrainment in gas-liquid two-phase flow in horizontal and near horizontal pipes
PhD Thesis (MK Abdullahi, 2013) 236
L
Lee H.J. & Lee S.Y. (2001): Pressure drop correlations for two-phase flow within horizontal
rectangular channels with small heights. Int. Journal of Multiphase Flow, vol. 27, pp. 783-
796.
Lin P.Y. & Hanratty T.J. (1986): Prediction of the initiation of slugs with linear stability
theory. Int. J. Multiphase Flow, Vol. 12, No. 1, pp. 79-98.
Lockhart R.W. & Martinelli R.C. (1949): Proposed correlation of data for isothermal two-
phase, two component flow in pipes. Chem. Engng. Prog., Vol. 45, No. 1, pp. 39-48.
Lynn P.A. (1982): An introduction to the analysis and processing of signals. MacMillan Press,
2ndedition. (1982).
M
Mahvash A. & Ross A. (2008): Two-phase flow pattern identification using continuous
hidden Markov model. Int. J. Multiphase flow, vol 34, pp. 303-311.
Malnes D. (1982): Slug flow in vertical, horizontal and inclined pipes. Report IFE/KR/E-
83/002, V. Inst. for Energy technology, Keller, Norway.
Mandhane J.M., Gregory G.A. & Aziz K. (1974): A flow pattern map for gas-liquid flow in
horizontal pipes. Int. J. Multiphase Flow, Vol. 1, pp. 537-553.
Manolis I. G. (October 1995): High Pressure Gas-Liquid Slug Flow. PhD Thesis, Department of
Chemical Engineering and Chemical Technology, Imperial College London
McNown, J.S. (1951): Particles in slow motion. La Houille Blanche, vol. 6, pp. 701-710.
Mi Y., Ishii M. & Tsoukalas L.H. (2001): Flow regime identification methodology with neural
networks and two-phase flow models. Nuclear Engineering & Design” vol. 204, pp. 87-100.
Miya M. (1970): Properties of roll waves. PhD thesis, University of Illinois. pp. 1-199.
References
Slug front gas entrainment in gas-liquid two-phase flow in horizontal and near horizontal pipes
PhD Thesis (MK Abdullahi, 2013) 237
N
Nicholson M.K., Aziz K. & Gregory G.A. (1978): Intermittent two-phase flow in horizontal
pipes: predictive models. Can. J. Chem. Eng, vol. 56, pp. 693-702.
Nicklin, D.J., Wilkes, J.O., Davidson, J.F. (1962): Two phase flow in vertical tubes. Trans. Inst.
Chem. Eng. 40, 61–68.
Nydal O. J. & Andreussi P. (1991): Gas entrainment in a long liquid slug advancing in a near
horizontal pipe. International Journal of Multiphase Flow, 17, Pages: 179-189.
O
Oddie G. & Pearson A.J.R.(2004): Flow-rate measurement in two-phase flow. Annual. Rev.
Fluid Mech vol. 36, pp. 149-172.
P
Pan J. (2010): Gas entrainment in two-phase gas-liquid slug flow. PhD Thesis, Department of
Chemical Engineering and Chemical Technology, Imperial College London.
Pan J., Hale C. P., Rhodes-Vivour M. T., Fadipe A. O., Hewitt G. F. & Richardson S. M., (2007):
Investigation of gas entrainment through hydraulic jump in a circular closed pipe. 6th
International Conference on Multiphase Flow, ICMF 2007, Leipzig, Germany, July 9-13, 2007.
Paglianti A., Andreussi P. & Nydal O. J. (1993): The Effect of Fluid Properties and Geometry
on Void Distribution in Slug Flow. 6th International Conference on Multiphase Production,
Cannes, France, 16-18 June, 1993, Pages: 193-203.
Press, W.H. Teukolsky, S.A., Vetterling, W.T. & Flannery, B.P. (2007): Numerical Recipes: The
Art of Scientific Computing, 3rd Edition, Cambridge University Press, NY, USA, pp. 600-648.
R
Rajaratnam, N., (1976): In: Turbulent Jets. Developments in Water Science. vol. 5. Elsevier,
Amsterdam.
References
Slug front gas entrainment in gas-liquid two-phase flow in horizontal and near horizontal pipes
PhD Thesis (MK Abdullahi, 2013) 238
S
Scott S.L., Shoham O. & Brill J.P. (April, 1986): Prediction of slug length in horizontal large
diameter pipes. Paper presented at the SPE 56th Annual California Regional Meeting,
Oakland, California, April, 1986.
Shoham O. (2006): Mechanistic modeling of gas-liquid two-phase flow in pipes. Society of
Petroleum Engineers Book Series, USA, pp. 87-113.
Simmons M.J.H. & Hanratty T.J. (2001): Transition from stratified to intermittent flows in
small angle upflows. Int. J. Multiphase Flow. Vol. 27, pp. 599-616.
Skartlein R., Julshamn J.A., Lawrence C.J & Liu L.: A gas entrainment model for hydraulic
jumps in near horizontal pipes. Int. J. Multiphase Flow. Vol. 43, pp. 39-55.
Spedding, P.L. & Hand, N.P.(1997): Prediction in stratified gas–liquid co-current flow in
horizontal pipelines. Int. J. Heat and Mass Transfer 40, 1923–1935.
Srichai S. (September 1994): High pressure separated two-phase flow. PhD Thesis,
Department of Chemical Engineering and Chemical Technology, Imperial College of Science,
Technology & Medicine, London, England, pp. 1-261.
Strand O. (1993): An experimental investigation of stratified two-phase flow in horizontal
pipes. Thesis presented for the degree of DOCTOR SCIENTIARUM, Mechanics division,
Department of Mathematics, University of Oslo.
T
Taitel Y. & Barnea (1990a): A consistent approach for calculating pressure drop in inclined
slug flow. Chem. Eng. Sci., vol 45, pp. 1199-1206.
Taitel Y. & Barnea (1990b): Two-phase slug flow. Advances in Heat Transfer, vol 20, pp. 83-
132.
Taitel Y. & Dukler A.E. (1977): A model for slug frequency during gas-liquid flow in horizontal
and near horizontal pipes. Int. J. Multiphase Flow, Vol. 3, No. 6, pp. 585-596
References
Slug front gas entrainment in gas-liquid two-phase flow in horizontal and near horizontal pipes
PhD Thesis (MK Abdullahi, 2013) 239
Taitel Y. & Dukler A.E. (Jan. 1976): A model for predicting flow regime transitions in
horizontal and near horizontal gas-liquid flow. AIChE Journal, Vol. 22, No. 1, pp. 47-55.
Taitel Y., Sarica C. & Brill J.P. (2000): Slug flow modeling for downward inclined pipe flow:
theoretical considerations. Int. J. Multiphase Flow, vol. 26, pp. 833-844.
Ternyik, J., Bilgesu H.I. & Mohghegh S. (1995): Virtual measurement in pipes, part 2: Liquid
holdup and flow pattern correlations. Society of Petroleum Engineers, Eastern Regional
Conference & Exhibition, Morgantown WV USA.
The ABB Group (2004): Oil & Gas: Transient/Slugging”
http://www.abb.com/cawp/seitp161/2cfdabece45786841256f500041089e.aspx
Tronconi E. (May 1990): Prediction of slug frequency in horizontal two-phase slug flow.
AIChE Journal, Vol. 36, No. 5, pp. 701-709.
Tomiyama, A., Kataoka, I., Fukuda, T. & Sakaguchi, T. (1995): Drag coefficient of bubbles
(2nd report, drag coefficient for a swarm of bubbles and its applicability to transient flow).
Trans. Jpn. Soc. Mech. Eng. B, 46–53.
W
Watson M.J. & Hewitt G.F. (1999): Pressure effects on the slug to churn transition. Int. J.
Multiphase Flow, vol. 25, pp. 1225-1241.
Weber, M.E. (1989): Drift in intermittent two-phase flow in horizontal pipes. Can. J. Chem.
Eng. 59, 398–399.
Whalley P.B. & Hewitt G.F. (1978): The correlation of liquid entrainment fraction and
entrainment rate in annular two-phase flow. Report AERE-R 9187, UKAEA Harwell, Oxon.
Woldesemayat M.A. & Ghajar A.J. (2007): Comparison of Void Fraction Correlations for
Different Flow Patterns in Horizontal and Upward Inclined Pipes. Int. Journal of Multiphase
Flow, vol. 33, pp. 347-370.
Woods B.D., Fan Z. & Hanratty T.J. (2006): Frequency and development of slugs in a
horizontal pipe at large liquid flows. Int. J. Multiphase Flow, vol. 32, pp. 902-925.
References
Slug front gas entrainment in gas-liquid two-phase flow in horizontal and near horizontal pipes
PhD Thesis (MK Abdullahi, 2013) 240
Wren E., Baker G., Azzopardi B.J. & Jones R. (2005): Slug flow in small diameter pipes and T-
junctions. Experimental Thermal and Fluid Science, vol. 29, pp. 893-899
X
Xu J., Wu Y., Shi Z., Lao L., & Li D. (2007): Studies of two-phase co-current air/non-
Newtonian shear-thinning fluid flows in inclined smooth pipes. Int. J. of Multiphase Flow,
vol. 33, pp. 948-969.
Z
Zabaras, G.J. (2000): Prediction of Slug Frequency for Gas-Liquid Flows. Society of Petroleum
Engineers Journal, 252.
Zhang H., Wang Q. Sarica C. & Brill J.P. (2003a): Unified Model for Gas-Liquid Pipe Flow via
Slug Dynamics – Part 1: Model Development. J. Energy Res Tech, vol. 125, pp. 266-273.
Zhang H., Wang Q. Sarica C. & Brill J.P. (2003b): Unified Model for Gas-Liquid Pipe Flow via
Slug Dynamics – Part 2: Model Validation. J. Energy Res Tech, vol. 125, pp. 274-283.

Slug front gas entrainment in gas-liquid two-phase flow in horizontal and near horizontal pipes
PhD Thesis (MK Abdullahi, 2013) 241
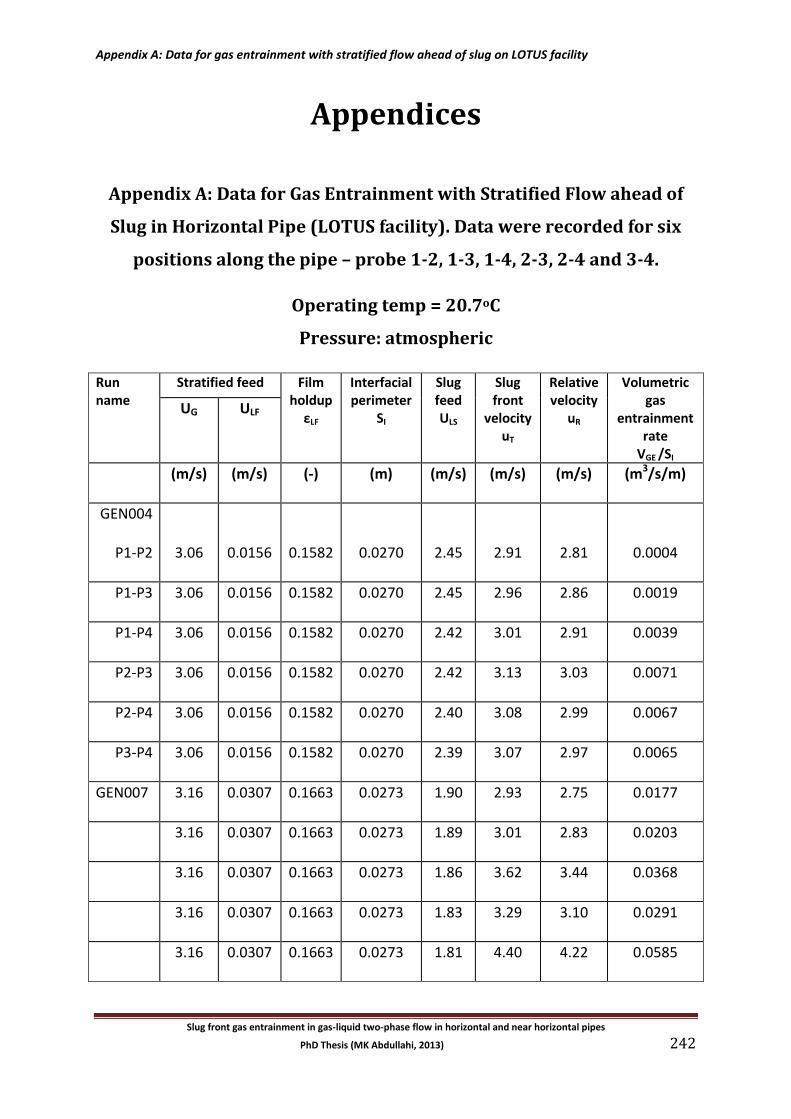
Appendix A: Data for gas entrainment with stratified flow ahead of slug on LOTUS facility
Slug front gas entrainment in gas-liquid two-phase flow in horizontal and near horizontal pipes
PhD Thesis (MK Abdullahi, 2013) 242
Appendices
Appendix A: Data for Gas Entrainment with Stratified Flow ahead of
Slug in Horizontal Pipe (LOTUS facility). Data were recorded for six
positions along the pipe – probe 1-2, 1-3, 1-4, 2-3, 2-4 and 3-4.
Operating temp = 20.7oC
Pressure: atmospheric
Run name
Stratified feed Film holdup
εLF
Interfacial perimeter
SI
Slug feed ULS
Slug front
velocity uT
Relative velocity
uR
Volumetric gas
entrainment rate
VGE /SI
UG ULF
(m/s) (m/s) (-) (m) (m/s) (m/s) (m/s) (m3/s/m)
GEN004
P1-P2 3.06 0.0156 0.1582 0.0270 2.45 2.91 2.81 0.0004
P1-P3 3.06 0.0156 0.1582 0.0270 2.45 2.96 2.86 0.0019
P1-P4 3.06 0.0156 0.1582 0.0270 2.42 3.01 2.91 0.0039
P2-P3 3.06 0.0156 0.1582 0.0270 2.42 3.13 3.03 0.0071
P2-P4 3.06 0.0156 0.1582 0.0270 2.40 3.08 2.99 0.0067
P3-P4 3.06 0.0156 0.1582 0.0270 2.39 3.07 2.97 0.0065
GEN007 3.16 0.0307 0.1663 0.0273 1.90 2.93 2.75 0.0177
3.16 0.0307 0.1663 0.0273 1.89 3.01 2.83 0.0203
3.16 0.0307 0.1663 0.0273 1.86 3.62 3.44 0.0368
3.16 0.0307 0.1663 0.0273 1.83 3.29 3.10 0.0291
3.16 0.0307 0.1663 0.0273 1.81 4.40 4.22 0.0585
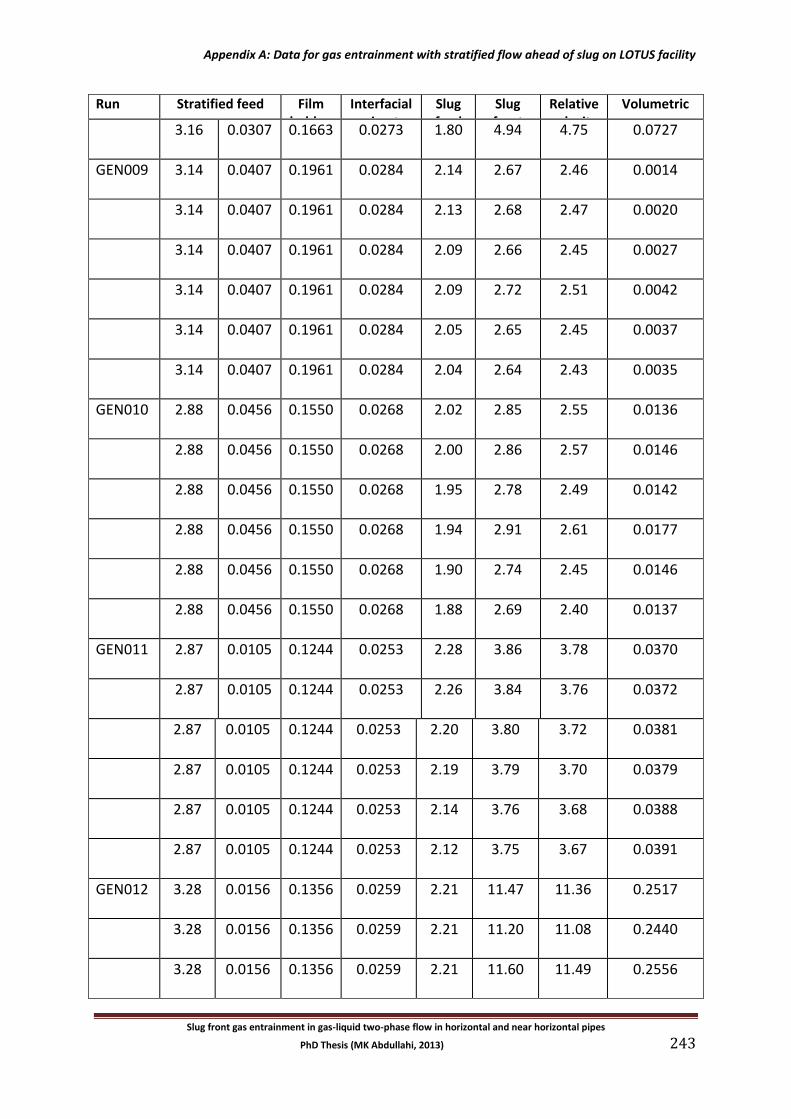
Appendix A: Data for gas entrainment with stratified flow ahead of slug on LOTUS facility
Slug front gas entrainment in gas-liquid two-phase flow in horizontal and near horizontal pipes
PhD Thesis (MK Abdullahi, 2013) 243
Run name
Stratified feed Film holdup
εLF
Interfacial perimeter
SI
Slug feed ULS
Slug front
velocity uT
Relative velocity
uR
Volumetric gas
entrainment rate
VGE /SI
3.16 0.0307 0.1663 0.0273 1.80 4.94 4.75 0.0727
GEN009 3.14 0.0407 0.1961 0.0284 2.14 2.67 2.46 0.0014
3.14 0.0407 0.1961 0.0284 2.13 2.68 2.47 0.0020
3.14 0.0407 0.1961 0.0284 2.09 2.66 2.45 0.0027
3.14 0.0407 0.1961 0.0284 2.09 2.72 2.51 0.0042
3.14 0.0407 0.1961 0.0284 2.05 2.65 2.45 0.0037
3.14 0.0407 0.1961 0.0284 2.04 2.64 2.43 0.0035
GEN010 2.88 0.0456 0.1550 0.0268 2.02 2.85 2.55 0.0136
2.88 0.0456 0.1550 0.0268 2.00 2.86 2.57 0.0146
2.88 0.0456 0.1550 0.0268 1.95 2.78 2.49 0.0142
2.88 0.0456 0.1550 0.0268 1.94 2.91 2.61 0.0177
2.88 0.0456 0.1550 0.0268 1.90 2.74 2.45 0.0146
2.88 0.0456 0.1550 0.0268 1.88 2.69 2.40 0.0137
GEN011 2.87 0.0105 0.1244 0.0253 2.28 3.86 3.78 0.0370
2.87 0.0105 0.1244 0.0253 2.26 3.84 3.76 0.0372
2.87 0.0105 0.1244 0.0253 2.20 3.80 3.72 0.0381
2.87 0.0105 0.1244 0.0253 2.19 3.79 3.70 0.0379
2.87 0.0105 0.1244 0.0253 2.14 3.76 3.68 0.0388
2.87 0.0105 0.1244 0.0253 2.12 3.75 3.67 0.0391
GEN012 3.28 0.0156 0.1356 0.0259 2.21 11.47 11.36 0.2517
3.28 0.0156 0.1356 0.0259 2.21 11.20 11.08 0.2440
3.28 0.0156 0.1356 0.0259 2.21 11.60 11.49 0.2556
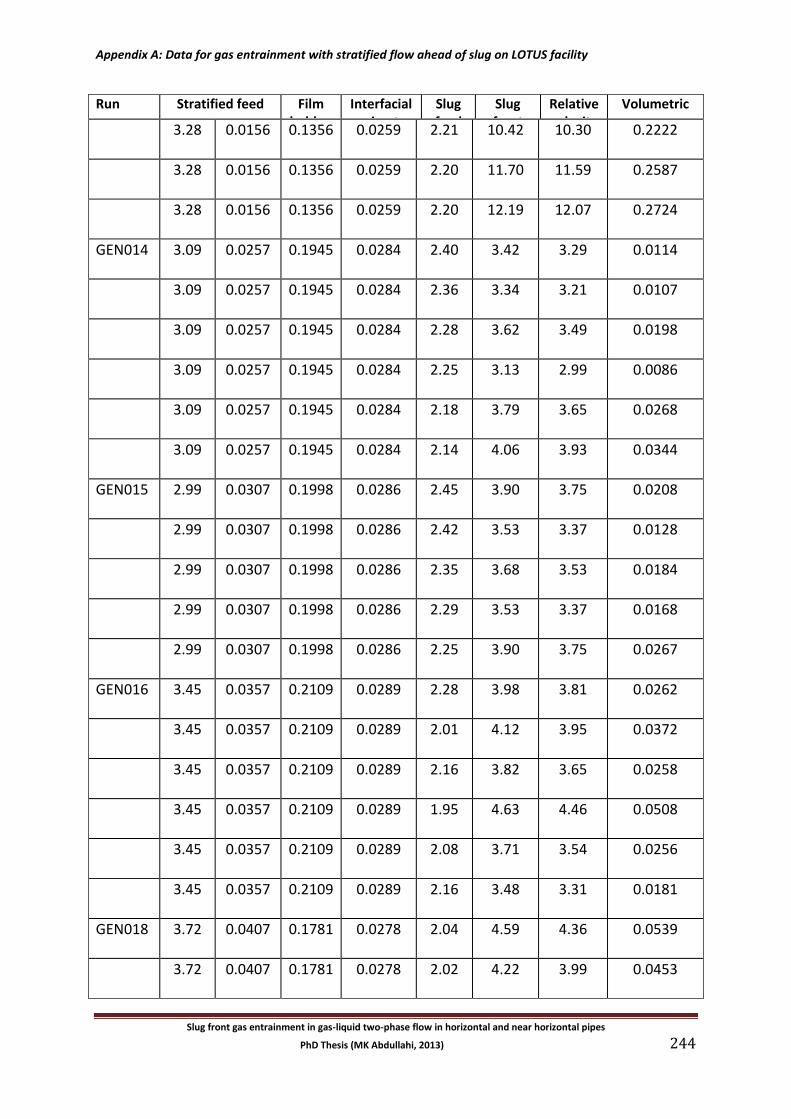
Appendix A: Data for gas entrainment with stratified flow ahead of slug on LOTUS facility
Slug front gas entrainment in gas-liquid two-phase flow in horizontal and near horizontal pipes
PhD Thesis (MK Abdullahi, 2013) 244
Run name
Stratified feed Film holdup
εLF
Interfacial perimeter
SI
Slug feed ULS
Slug front
velocity uT
Relative velocity
uR
Volumetric gas
entrainment rate
VGE /SI
3.28 0.0156 0.1356 0.0259 2.21 10.42 10.30 0.2222
3.28 0.0156 0.1356 0.0259 2.20 11.70 11.59 0.2587
3.28 0.0156 0.1356 0.0259 2.20 12.19 12.07 0.2724
GEN014 3.09 0.0257 0.1945 0.0284 2.40 3.42 3.29 0.0114
3.09 0.0257 0.1945 0.0284 2.36 3.34 3.21 0.0107
3.09 0.0257 0.1945 0.0284 2.28 3.62 3.49 0.0198
3.09 0.0257 0.1945 0.0284 2.25 3.13 2.99 0.0086
3.09 0.0257 0.1945 0.0284 2.18 3.79 3.65 0.0268
3.09 0.0257 0.1945 0.0284 2.14 4.06 3.93 0.0344
GEN015 2.99 0.0307 0.1998 0.0286 2.45 3.90 3.75 0.0208
2.99 0.0307 0.1998 0.0286 2.42 3.53 3.37 0.0128
2.99 0.0307 0.1998 0.0286 2.35 3.68 3.53 0.0184
2.99 0.0307 0.1998 0.0286 2.29 3.53 3.37 0.0168
2.99 0.0307 0.1998 0.0286 2.25 3.90 3.75 0.0267
GEN016 3.45 0.0357 0.2109 0.0289 2.28 3.98 3.81 0.0262
3.45 0.0357 0.2109 0.0289 2.01 4.12 3.95 0.0372
3.45 0.0357 0.2109 0.0289 2.16 3.82 3.65 0.0258
3.45 0.0357 0.2109 0.0289 1.95 4.63 4.46 0.0508
3.45 0.0357 0.2109 0.0289 2.08 3.71 3.54 0.0256
3.45 0.0357 0.2109 0.0289 2.16 3.48 3.31 0.0181
GEN018 3.72 0.0407 0.1781 0.0278 2.04 4.59 4.36 0.0539
3.72 0.0407 0.1781 0.0278 2.02 4.22 3.99 0.0453
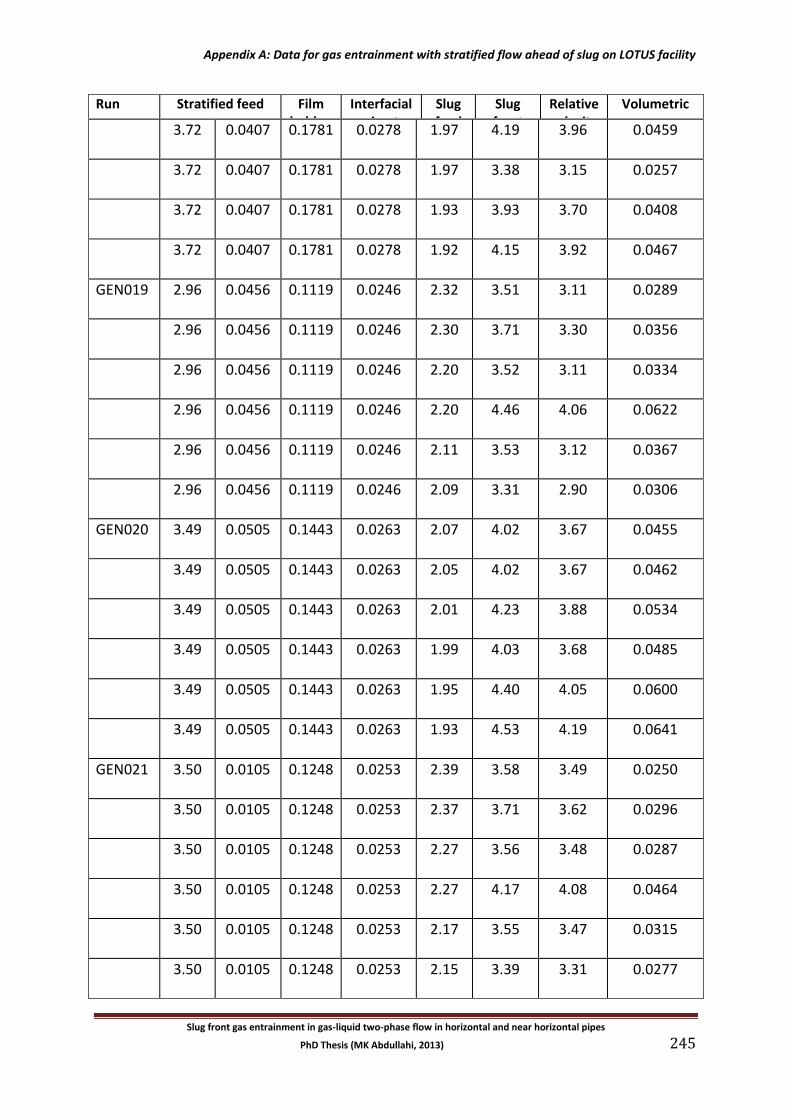
Appendix A: Data for gas entrainment with stratified flow ahead of slug on LOTUS facility
Slug front gas entrainment in gas-liquid two-phase flow in horizontal and near horizontal pipes
PhD Thesis (MK Abdullahi, 2013) 245
Run name
Stratified feed Film holdup
εLF
Interfacial perimeter
SI
Slug feed ULS
Slug front
velocity uT
Relative velocity
uR
Volumetric gas
entrainment rate
VGE /SI
3.72 0.0407 0.1781 0.0278 1.97 4.19 3.96 0.0459
3.72 0.0407 0.1781 0.0278 1.97 3.38 3.15 0.0257
3.72 0.0407 0.1781 0.0278 1.93 3.93 3.70 0.0408
3.72 0.0407 0.1781 0.0278 1.92 4.15 3.92 0.0467
GEN019 2.96 0.0456 0.1119 0.0246 2.32 3.51 3.11 0.0289
2.96 0.0456 0.1119 0.0246 2.30 3.71 3.30 0.0356
2.96 0.0456 0.1119 0.0246 2.20 3.52 3.11 0.0334
2.96 0.0456 0.1119 0.0246 2.20 4.46 4.06 0.0622
2.96 0.0456 0.1119 0.0246 2.11 3.53 3.12 0.0367
2.96 0.0456 0.1119 0.0246 2.09 3.31 2.90 0.0306
GEN020 3.49 0.0505 0.1443 0.0263 2.07 4.02 3.67 0.0455
3.49 0.0505 0.1443 0.0263 2.05 4.02 3.67 0.0462
3.49 0.0505 0.1443 0.0263 2.01 4.23 3.88 0.0534
3.49 0.0505 0.1443 0.0263 1.99 4.03 3.68 0.0485
3.49 0.0505 0.1443 0.0263 1.95 4.40 4.05 0.0600
3.49 0.0505 0.1443 0.0263 1.93 4.53 4.19 0.0641
GEN021 3.50 0.0105 0.1248 0.0253 2.39 3.58 3.49 0.0250
3.50 0.0105 0.1248 0.0253 2.37 3.71 3.62 0.0296
3.50 0.0105 0.1248 0.0253 2.27 3.56 3.48 0.0287
3.50 0.0105 0.1248 0.0253 2.27 4.17 4.08 0.0464
3.50 0.0105 0.1248 0.0253 2.17 3.55 3.47 0.0315
3.50 0.0105 0.1248 0.0253 2.15 3.39 3.31 0.0277
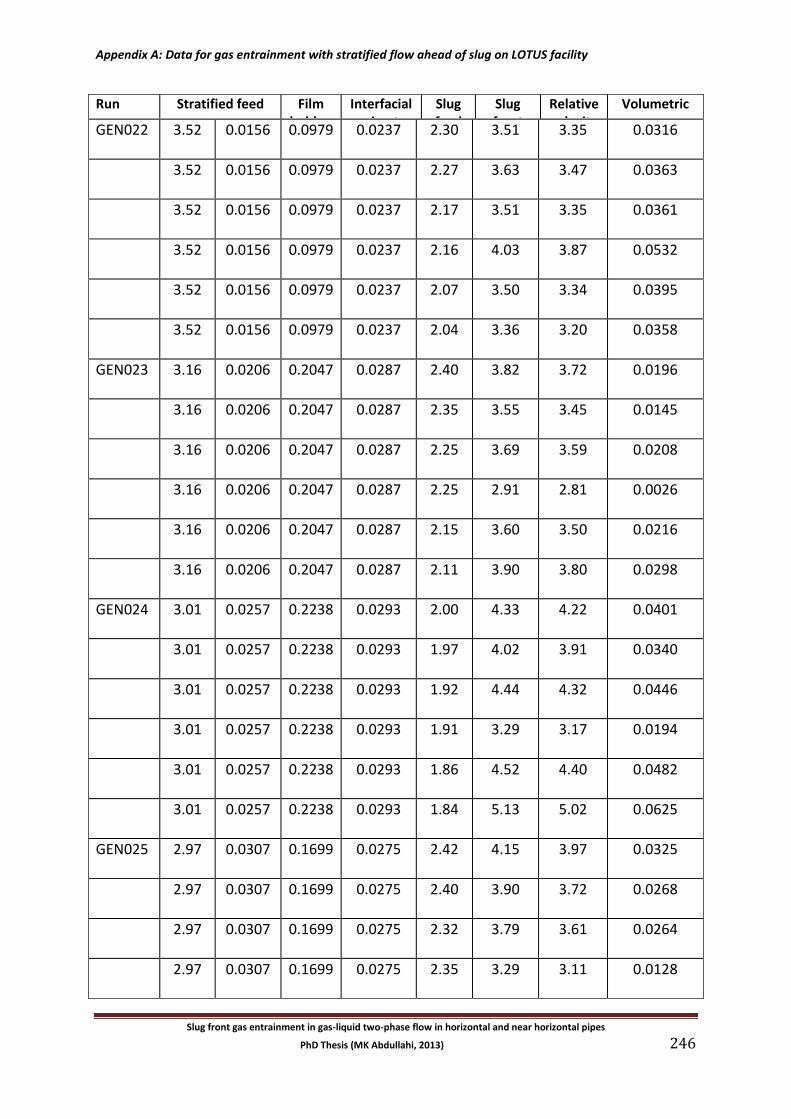
Appendix A: Data for gas entrainment with stratified flow ahead of slug on LOTUS facility
Slug front gas entrainment in gas-liquid two-phase flow in horizontal and near horizontal pipes
PhD Thesis (MK Abdullahi, 2013) 246
Run name
Stratified feed Film holdup
εLF
Interfacial perimeter
SI
Slug feed ULS
Slug front
velocity uT
Relative velocity
uR
Volumetric gas
entrainment rate
VGE /SI
GEN022 3.52 0.0156 0.0979 0.0237 2.30 3.51 3.35 0.0316
3.52 0.0156 0.0979 0.0237 2.27 3.63 3.47 0.0363
3.52 0.0156 0.0979 0.0237 2.17 3.51 3.35 0.0361
3.52 0.0156 0.0979 0.0237 2.16 4.03 3.87 0.0532
3.52 0.0156 0.0979 0.0237 2.07 3.50 3.34 0.0395
3.52 0.0156 0.0979 0.0237 2.04 3.36 3.20 0.0358
GEN023 3.16 0.0206 0.2047 0.0287 2.40 3.82 3.72 0.0196
3.16 0.0206 0.2047 0.0287 2.35 3.55 3.45 0.0145
3.16 0.0206 0.2047 0.0287 2.25 3.69 3.59 0.0208
3.16 0.0206 0.2047 0.0287 2.25 2.91 2.81 0.0026
3.16 0.0206 0.2047 0.0287 2.15 3.60 3.50 0.0216
3.16 0.0206 0.2047 0.0287 2.11 3.90 3.80 0.0298
GEN024 3.01 0.0257 0.2238 0.0293 2.00 4.33 4.22 0.0401
3.01 0.0257 0.2238 0.0293 1.97 4.02 3.91 0.0340
3.01 0.0257 0.2238 0.0293 1.92 4.44 4.32 0.0446
3.01 0.0257 0.2238 0.0293 1.91 3.29 3.17 0.0194
3.01 0.0257 0.2238 0.0293 1.86 4.52 4.40 0.0482
3.01 0.0257 0.2238 0.0293 1.84 5.13 5.02 0.0625
GEN025 2.97 0.0307 0.1699 0.0275 2.42 4.15 3.97 0.0325
2.97 0.0307 0.1699 0.0275 2.40 3.90 3.72 0.0268
2.97 0.0307 0.1699 0.0275 2.32 3.79 3.61 0.0264
2.97 0.0307 0.1699 0.0275 2.35 3.29 3.11 0.0128
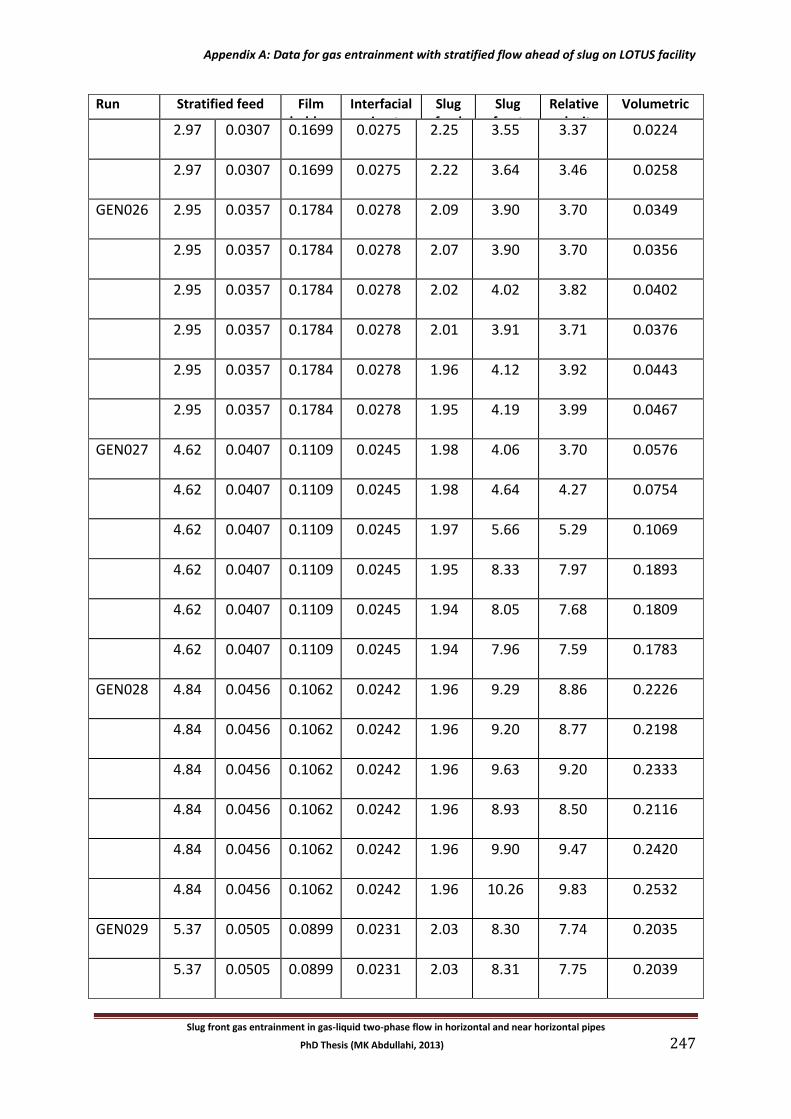
Appendix A: Data for gas entrainment with stratified flow ahead of slug on LOTUS facility
Slug front gas entrainment in gas-liquid two-phase flow in horizontal and near horizontal pipes
PhD Thesis (MK Abdullahi, 2013) 247
Run name
Stratified feed Film holdup
εLF
Interfacial perimeter
SI
Slug feed ULS
Slug front
velocity uT
Relative velocity
uR
Volumetric gas
entrainment rate
VGE /SI
2.97 0.0307 0.1699 0.0275 2.25 3.55 3.37 0.0224
2.97 0.0307 0.1699 0.0275 2.22 3.64 3.46 0.0258
GEN026 2.95 0.0357 0.1784 0.0278 2.09 3.90 3.70 0.0349
2.95 0.0357 0.1784 0.0278 2.07 3.90 3.70 0.0356
2.95 0.0357 0.1784 0.0278 2.02 4.02 3.82 0.0402
2.95 0.0357 0.1784 0.0278 2.01 3.91 3.71 0.0376
2.95 0.0357 0.1784 0.0278 1.96 4.12 3.92 0.0443
2.95 0.0357 0.1784 0.0278 1.95 4.19 3.99 0.0467
GEN027 4.62 0.0407 0.1109 0.0245 1.98 4.06 3.70 0.0576
4.62 0.0407 0.1109 0.0245 1.98 4.64 4.27 0.0754
4.62 0.0407 0.1109 0.0245 1.97 5.66 5.29 0.1069
4.62 0.0407 0.1109 0.0245 1.95 8.33 7.97 0.1893
4.62 0.0407 0.1109 0.0245 1.94 8.05 7.68 0.1809
4.62 0.0407 0.1109 0.0245 1.94 7.96 7.59 0.1783
GEN028 4.84 0.0456 0.1062 0.0242 1.96 9.29 8.86 0.2226
4.84 0.0456 0.1062 0.0242 1.96 9.20 8.77 0.2198
4.84 0.0456 0.1062 0.0242 1.96 9.63 9.20 0.2333
4.84 0.0456 0.1062 0.0242 1.96 8.93 8.50 0.2116
4.84 0.0456 0.1062 0.0242 1.96 9.90 9.47 0.2420
4.84 0.0456 0.1062 0.0242 1.96 10.26 9.83 0.2532
GEN029 5.37 0.0505 0.0899 0.0231 2.03 8.30 7.74 0.2035
5.37 0.0505 0.0899 0.0231 2.03 8.31 7.75 0.2039
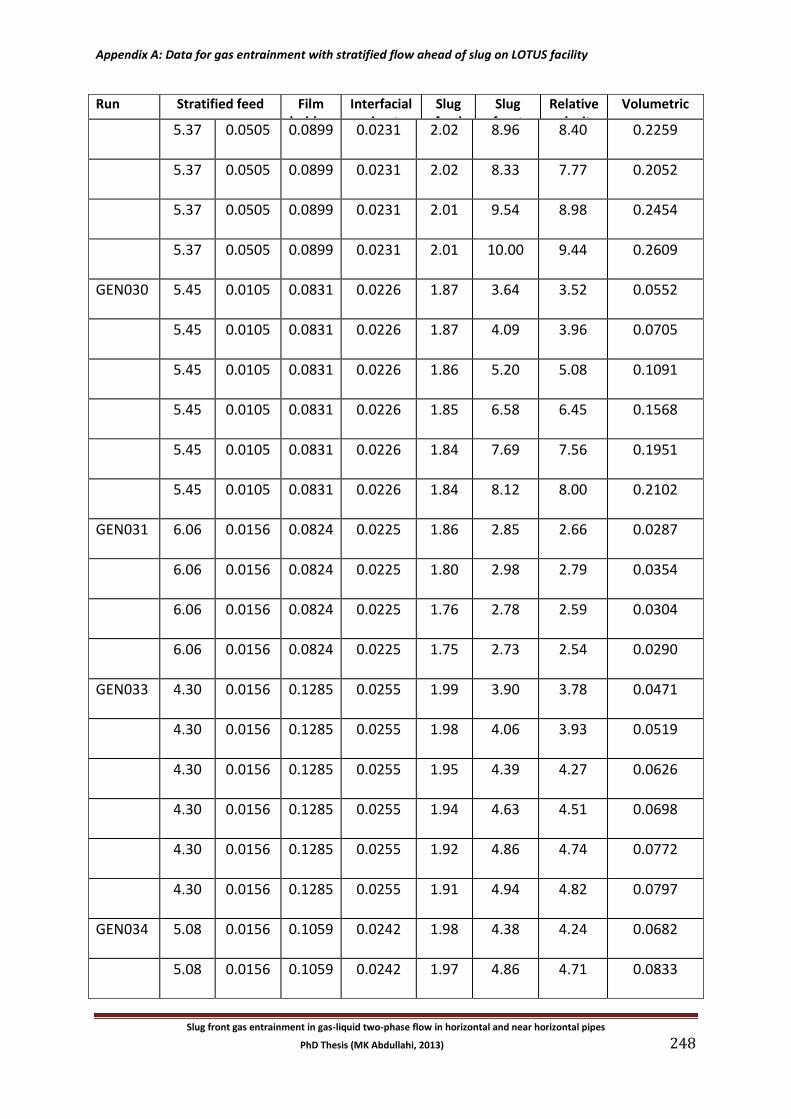
Appendix A: Data for gas entrainment with stratified flow ahead of slug on LOTUS facility
Slug front gas entrainment in gas-liquid two-phase flow in horizontal and near horizontal pipes
PhD Thesis (MK Abdullahi, 2013) 248
Run name
Stratified feed Film holdup
εLF
Interfacial perimeter
SI
Slug feed ULS
Slug front
velocity uT
Relative velocity
uR
Volumetric gas
entrainment rate
VGE /SI
5.37 0.0505 0.0899 0.0231 2.02 8.96 8.40 0.2259
5.37 0.0505 0.0899 0.0231 2.02 8.33 7.77 0.2052
5.37 0.0505 0.0899 0.0231 2.01 9.54 8.98 0.2454
5.37 0.0505 0.0899 0.0231 2.01 10.00 9.44 0.2609
GEN030 5.45 0.0105 0.0831 0.0226 1.87 3.64 3.52 0.0552
5.45 0.0105 0.0831 0.0226 1.87 4.09 3.96 0.0705
5.45 0.0105 0.0831 0.0226 1.86 5.20 5.08 0.1091
5.45 0.0105 0.0831 0.0226 1.85 6.58 6.45 0.1568
5.45 0.0105 0.0831 0.0226 1.84 7.69 7.56 0.1951
5.45 0.0105 0.0831 0.0226 1.84 8.12 8.00 0.2102
GEN031 6.06 0.0156 0.0824 0.0225 1.86 2.85 2.66 0.0287
6.06 0.0156 0.0824 0.0225 1.80 2.98 2.79 0.0354
6.06 0.0156 0.0824 0.0225 1.76 2.78 2.59 0.0304
6.06 0.0156 0.0824 0.0225 1.75 2.73 2.54 0.0290
GEN033 4.30 0.0156 0.1285 0.0255 1.99 3.90 3.78 0.0471
4.30 0.0156 0.1285 0.0255 1.98 4.06 3.93 0.0519
4.30 0.0156 0.1285 0.0255 1.95 4.39 4.27 0.0626
4.30 0.0156 0.1285 0.0255 1.94 4.63 4.51 0.0698
4.30 0.0156 0.1285 0.0255 1.92 4.86 4.74 0.0772
4.30 0.0156 0.1285 0.0255 1.91 4.94 4.82 0.0797
GEN034 5.08 0.0156 0.1059 0.0242 1.98 4.38 4.24 0.0682
5.08 0.0156 0.1059 0.0242 1.97 4.86 4.71 0.0833
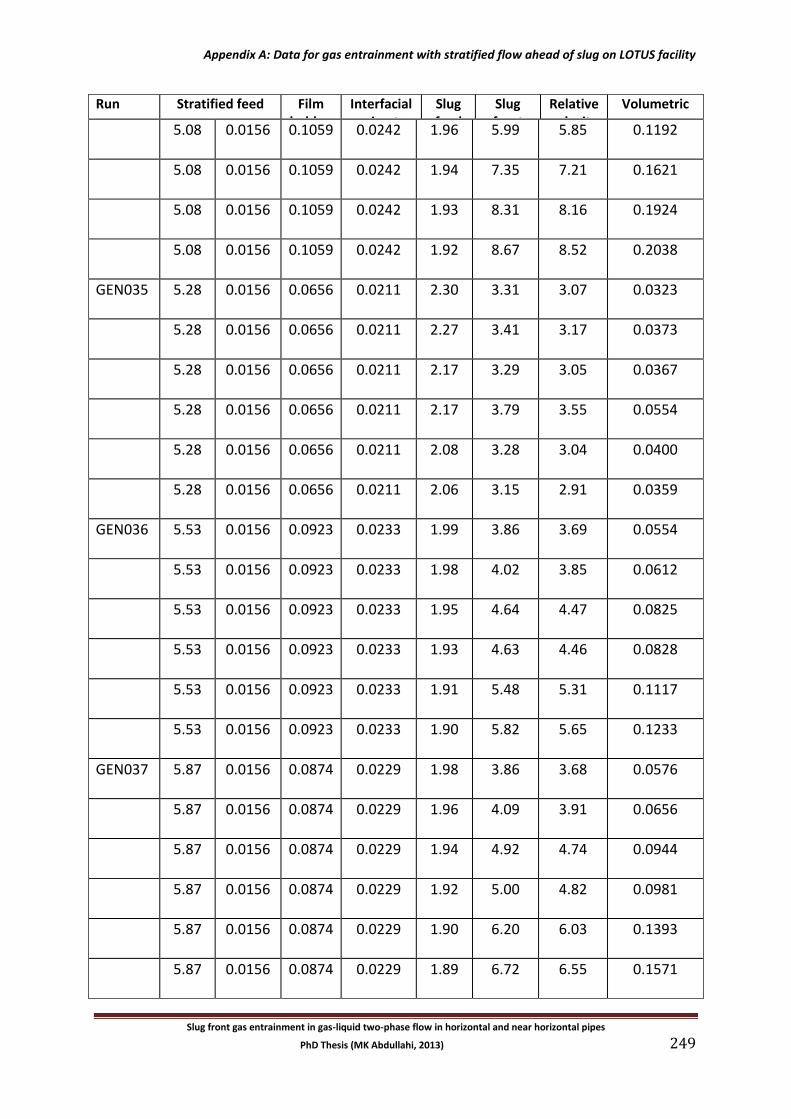
Appendix A: Data for gas entrainment with stratified flow ahead of slug on LOTUS facility
Slug front gas entrainment in gas-liquid two-phase flow in horizontal and near horizontal pipes
PhD Thesis (MK Abdullahi, 2013) 249
Run name
Stratified feed Film holdup
εLF
Interfacial perimeter
SI
Slug feed ULS
Slug front
velocity uT
Relative velocity
uR
Volumetric gas
entrainment rate
VGE /SI
5.08 0.0156 0.1059 0.0242 1.96 5.99 5.85 0.1192
5.08 0.0156 0.1059 0.0242 1.94 7.35 7.21 0.1621
5.08 0.0156 0.1059 0.0242 1.93 8.31 8.16 0.1924
5.08 0.0156 0.1059 0.0242 1.92 8.67 8.52 0.2038
GEN035 5.28 0.0156 0.0656 0.0211 2.30 3.31 3.07 0.0323
5.28 0.0156 0.0656 0.0211 2.27 3.41 3.17 0.0373
5.28 0.0156 0.0656 0.0211 2.17 3.29 3.05 0.0367
5.28 0.0156 0.0656 0.0211 2.17 3.79 3.55 0.0554
5.28 0.0156 0.0656 0.0211 2.08 3.28 3.04 0.0400
5.28 0.0156 0.0656 0.0211 2.06 3.15 2.91 0.0359
GEN036 5.53 0.0156 0.0923 0.0233 1.99 3.86 3.69 0.0554
5.53 0.0156 0.0923 0.0233 1.98 4.02 3.85 0.0612
5.53 0.0156 0.0923 0.0233 1.95 4.64 4.47 0.0825
5.53 0.0156 0.0923 0.0233 1.93 4.63 4.46 0.0828
5.53 0.0156 0.0923 0.0233 1.91 5.48 5.31 0.1117
5.53 0.0156 0.0923 0.0233 1.90 5.82 5.65 0.1233
GEN037 5.87 0.0156 0.0874 0.0229 1.98 3.86 3.68 0.0576
5.87 0.0156 0.0874 0.0229 1.96 4.09 3.91 0.0656
5.87 0.0156 0.0874 0.0229 1.94 4.92 4.74 0.0944
5.87 0.0156 0.0874 0.0229 1.92 5.00 4.82 0.0981
5.87 0.0156 0.0874 0.0229 1.90 6.20 6.03 0.1393
5.87 0.0156 0.0874 0.0229 1.89 6.72 6.55 0.1571
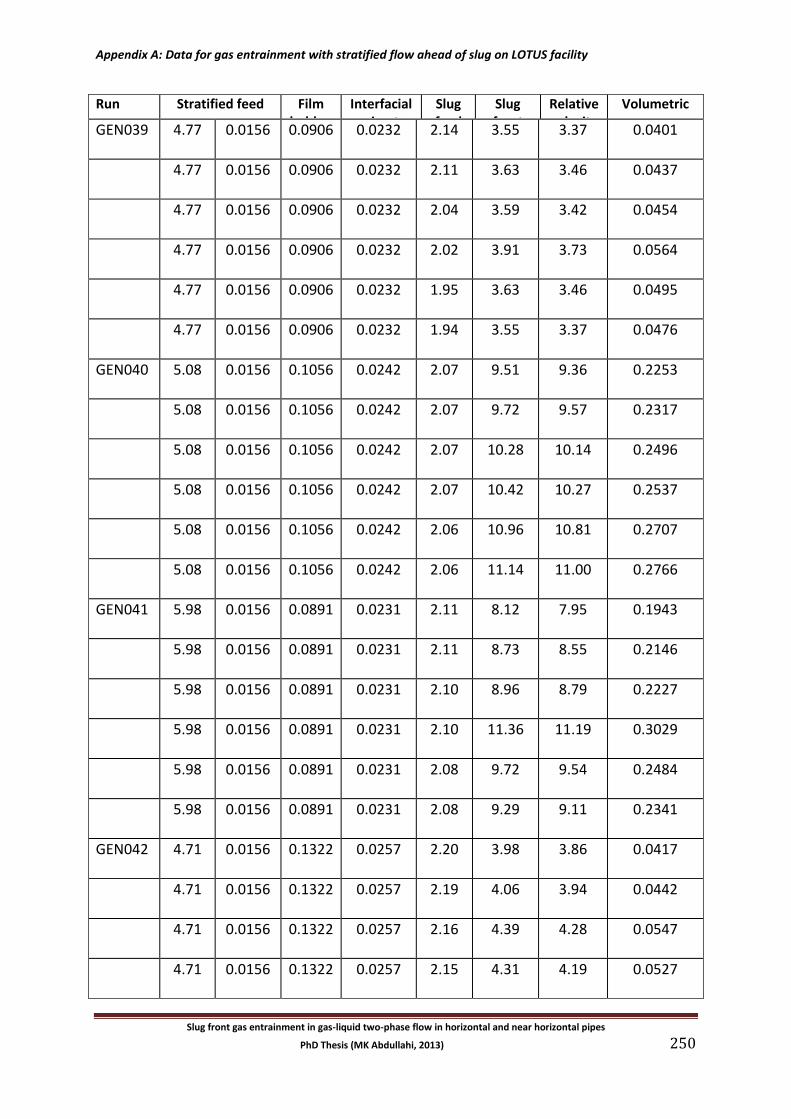
Appendix A: Data for gas entrainment with stratified flow ahead of slug on LOTUS facility
Slug front gas entrainment in gas-liquid two-phase flow in horizontal and near horizontal pipes
PhD Thesis (MK Abdullahi, 2013) 250
Run name
Stratified feed Film holdup
εLF
Interfacial perimeter
SI
Slug feed ULS
Slug front
velocity uT
Relative velocity
uR
Volumetric gas
entrainment rate
VGE /SI
GEN039 4.77 0.0156 0.0906 0.0232 2.14 3.55 3.37 0.0401
4.77 0.0156 0.0906 0.0232 2.11 3.63 3.46 0.0437
4.77 0.0156 0.0906 0.0232 2.04 3.59 3.42 0.0454
4.77 0.0156 0.0906 0.0232 2.02 3.91 3.73 0.0564
4.77 0.0156 0.0906 0.0232 1.95 3.63 3.46 0.0495
4.77 0.0156 0.0906 0.0232 1.94 3.55 3.37 0.0476
GEN040 5.08 0.0156 0.1056 0.0242 2.07 9.51 9.36 0.2253
5.08 0.0156 0.1056 0.0242 2.07 9.72 9.57 0.2317
5.08 0.0156 0.1056 0.0242 2.07 10.28 10.14 0.2496
5.08 0.0156 0.1056 0.0242 2.07 10.42 10.27 0.2537
5.08 0.0156 0.1056 0.0242 2.06 10.96 10.81 0.2707
5.08 0.0156 0.1056 0.0242 2.06 11.14 11.00 0.2766
GEN041 5.98 0.0156 0.0891 0.0231 2.11 8.12 7.95 0.1943
5.98 0.0156 0.0891 0.0231 2.11 8.73 8.55 0.2146
5.98 0.0156 0.0891 0.0231 2.10 8.96 8.79 0.2227
5.98 0.0156 0.0891 0.0231 2.10 11.36 11.19 0.3029
5.98 0.0156 0.0891 0.0231 2.08 9.72 9.54 0.2484
5.98 0.0156 0.0891 0.0231 2.08 9.29 9.11 0.2341
GEN042 4.71 0.0156 0.1322 0.0257 2.20 3.98 3.86 0.0417
4.71 0.0156 0.1322 0.0257 2.19 4.06 3.94 0.0442
4.71 0.0156 0.1322 0.0257 2.16 4.39 4.28 0.0547
4.71 0.0156 0.1322 0.0257 2.15 4.31 4.19 0.0527
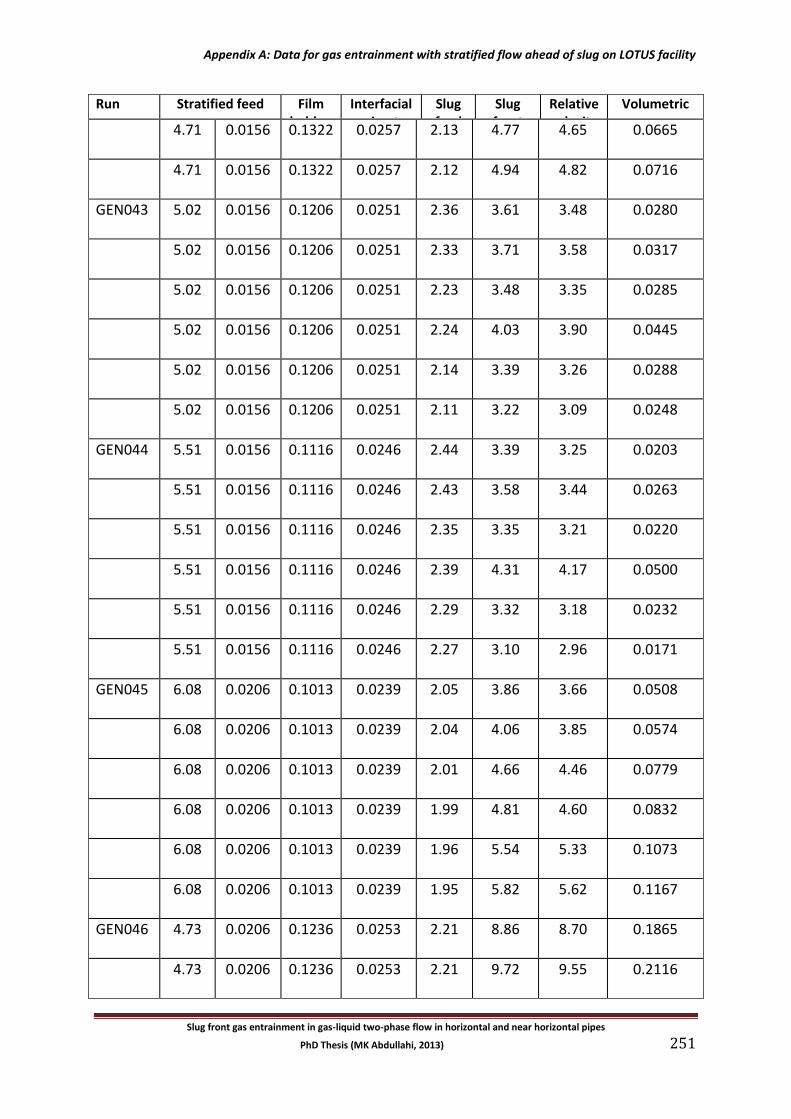
Appendix A: Data for gas entrainment with stratified flow ahead of slug on LOTUS facility
Slug front gas entrainment in gas-liquid two-phase flow in horizontal and near horizontal pipes
PhD Thesis (MK Abdullahi, 2013) 251
Run name
Stratified feed Film holdup
εLF
Interfacial perimeter
SI
Slug feed ULS
Slug front
velocity uT
Relative velocity
uR
Volumetric gas
entrainment rate
VGE /SI
4.71 0.0156 0.1322 0.0257 2.13 4.77 4.65 0.0665
4.71 0.0156 0.1322 0.0257 2.12 4.94 4.82 0.0716
GEN043 5.02 0.0156 0.1206 0.0251 2.36 3.61 3.48 0.0280
5.02 0.0156 0.1206 0.0251 2.33 3.71 3.58 0.0317
5.02 0.0156 0.1206 0.0251 2.23 3.48 3.35 0.0285
5.02 0.0156 0.1206 0.0251 2.24 4.03 3.90 0.0445
5.02 0.0156 0.1206 0.0251 2.14 3.39 3.26 0.0288
5.02 0.0156 0.1206 0.0251 2.11 3.22 3.09 0.0248
GEN044 5.51 0.0156 0.1116 0.0246 2.44 3.39 3.25 0.0203
5.51 0.0156 0.1116 0.0246 2.43 3.58 3.44 0.0263
5.51 0.0156 0.1116 0.0246 2.35 3.35 3.21 0.0220
5.51 0.0156 0.1116 0.0246 2.39 4.31 4.17 0.0500
5.51 0.0156 0.1116 0.0246 2.29 3.32 3.18 0.0232
5.51 0.0156 0.1116 0.0246 2.27 3.10 2.96 0.0171
GEN045 6.08 0.0206 0.1013 0.0239 2.05 3.86 3.66 0.0508
6.08 0.0206 0.1013 0.0239 2.04 4.06 3.85 0.0574
6.08 0.0206 0.1013 0.0239 2.01 4.66 4.46 0.0779
6.08 0.0206 0.1013 0.0239 1.99 4.81 4.60 0.0832
6.08 0.0206 0.1013 0.0239 1.96 5.54 5.33 0.1073
6.08 0.0206 0.1013 0.0239 1.95 5.82 5.62 0.1167
GEN046 4.73 0.0206 0.1236 0.0253 2.21 8.86 8.70 0.1865
4.73 0.0206 0.1236 0.0253 2.21 9.72 9.55 0.2116
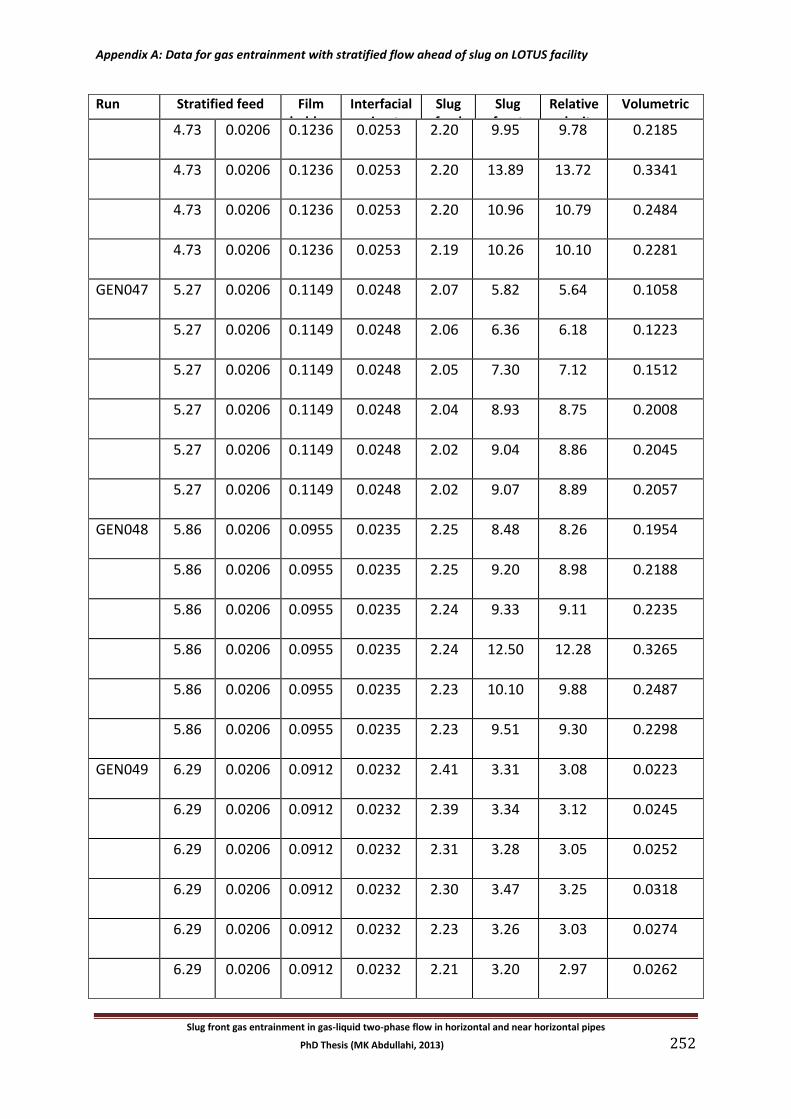
Appendix A: Data for gas entrainment with stratified flow ahead of slug on LOTUS facility
Slug front gas entrainment in gas-liquid two-phase flow in horizontal and near horizontal pipes
PhD Thesis (MK Abdullahi, 2013) 252
Run name
Stratified feed Film holdup
εLF
Interfacial perimeter
SI
Slug feed ULS
Slug front
velocity uT
Relative velocity
uR
Volumetric gas
entrainment rate
VGE /SI
4.73 0.0206 0.1236 0.0253 2.20 9.95 9.78 0.2185
4.73 0.0206 0.1236 0.0253 2.20 13.89 13.72 0.3341
4.73 0.0206 0.1236 0.0253 2.20 10.96 10.79 0.2484
4.73 0.0206 0.1236 0.0253 2.19 10.26 10.10 0.2281
GEN047 5.27 0.0206 0.1149 0.0248 2.07 5.82 5.64 0.1058
5.27 0.0206 0.1149 0.0248 2.06 6.36 6.18 0.1223
5.27 0.0206 0.1149 0.0248 2.05 7.30 7.12 0.1512
5.27 0.0206 0.1149 0.0248 2.04 8.93 8.75 0.2008
5.27 0.0206 0.1149 0.0248 2.02 9.04 8.86 0.2045
5.27 0.0206 0.1149 0.0248 2.02 9.07 8.89 0.2057
GEN048 5.86 0.0206 0.0955 0.0235 2.25 8.48 8.26 0.1954
5.86 0.0206 0.0955 0.0235 2.25 9.20 8.98 0.2188
5.86 0.0206 0.0955 0.0235 2.24 9.33 9.11 0.2235
5.86 0.0206 0.0955 0.0235 2.24 12.50 12.28 0.3265
5.86 0.0206 0.0955 0.0235 2.23 10.10 9.88 0.2487
5.86 0.0206 0.0955 0.0235 2.23 9.51 9.30 0.2298
GEN049 6.29 0.0206 0.0912 0.0232 2.41 3.31 3.08 0.0223
6.29 0.0206 0.0912 0.0232 2.39 3.34 3.12 0.0245
6.29 0.0206 0.0912 0.0232 2.31 3.28 3.05 0.0252
6.29 0.0206 0.0912 0.0232 2.30 3.47 3.25 0.0318
6.29 0.0206 0.0912 0.0232 2.23 3.26 3.03 0.0274
6.29 0.0206 0.0912 0.0232 2.21 3.20 2.97 0.0262
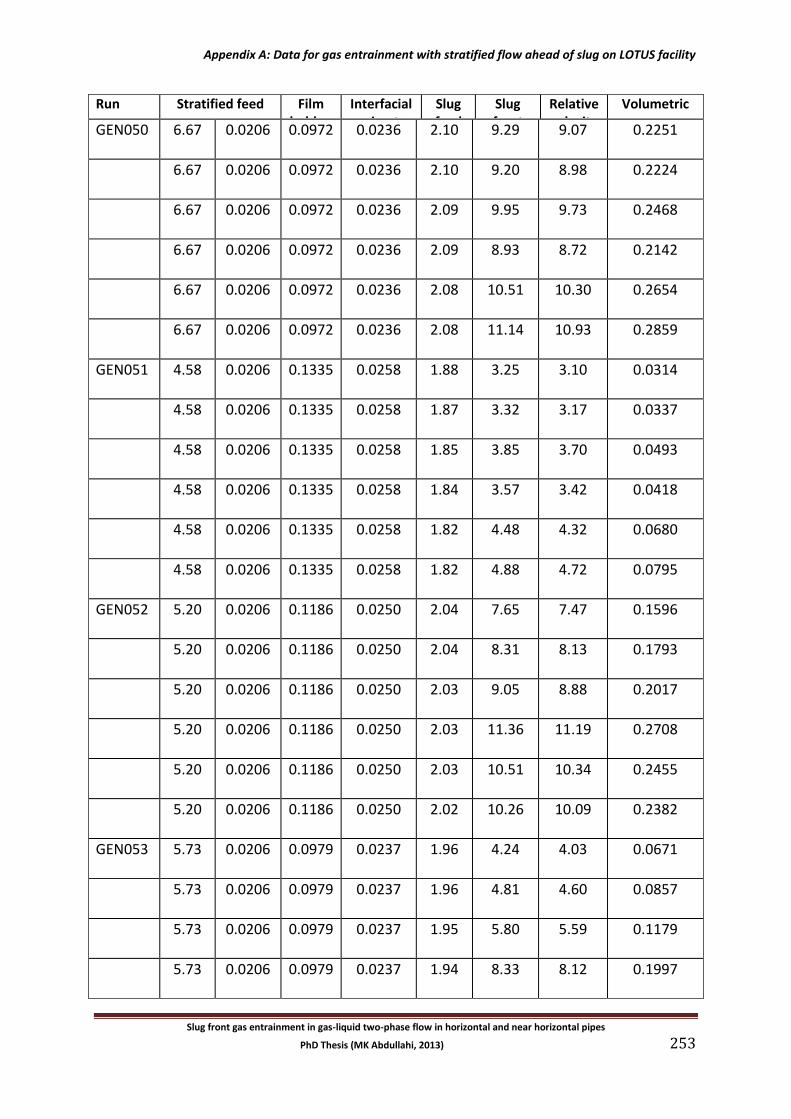
Appendix A: Data for gas entrainment with stratified flow ahead of slug on LOTUS facility
Slug front gas entrainment in gas-liquid two-phase flow in horizontal and near horizontal pipes
PhD Thesis (MK Abdullahi, 2013) 253
Run name
Stratified feed Film holdup
εLF
Interfacial perimeter
SI
Slug feed ULS
Slug front
velocity uT
Relative velocity
uR
Volumetric gas
entrainment rate
VGE /SI
GEN050 6.67 0.0206 0.0972 0.0236 2.10 9.29 9.07 0.2251
6.67 0.0206 0.0972 0.0236 2.10 9.20 8.98 0.2224
6.67 0.0206 0.0972 0.0236 2.09 9.95 9.73 0.2468
6.67 0.0206 0.0972 0.0236 2.09 8.93 8.72 0.2142
6.67 0.0206 0.0972 0.0236 2.08 10.51 10.30 0.2654
6.67 0.0206 0.0972 0.0236 2.08 11.14 10.93 0.2859
GEN051 4.58 0.0206 0.1335 0.0258 1.88 3.25 3.10 0.0314
4.58 0.0206 0.1335 0.0258 1.87 3.32 3.17 0.0337
4.58 0.0206 0.1335 0.0258 1.85 3.85 3.70 0.0493
4.58 0.0206 0.1335 0.0258 1.84 3.57 3.42 0.0418
4.58 0.0206 0.1335 0.0258 1.82 4.48 4.32 0.0680
4.58 0.0206 0.1335 0.0258 1.82 4.88 4.72 0.0795
GEN052 5.20 0.0206 0.1186 0.0250 2.04 7.65 7.47 0.1596
5.20 0.0206 0.1186 0.0250 2.04 8.31 8.13 0.1793
5.20 0.0206 0.1186 0.0250 2.03 9.05 8.88 0.2017
5.20 0.0206 0.1186 0.0250 2.03 11.36 11.19 0.2708
5.20 0.0206 0.1186 0.0250 2.03 10.51 10.34 0.2455
5.20 0.0206 0.1186 0.0250 2.02 10.26 10.09 0.2382
GEN053 5.73 0.0206 0.0979 0.0237 1.96 4.24 4.03 0.0671
5.73 0.0206 0.0979 0.0237 1.96 4.81 4.60 0.0857
5.73 0.0206 0.0979 0.0237 1.95 5.80 5.59 0.1179
5.73 0.0206 0.0979 0.0237 1.94 8.33 8.12 0.1997
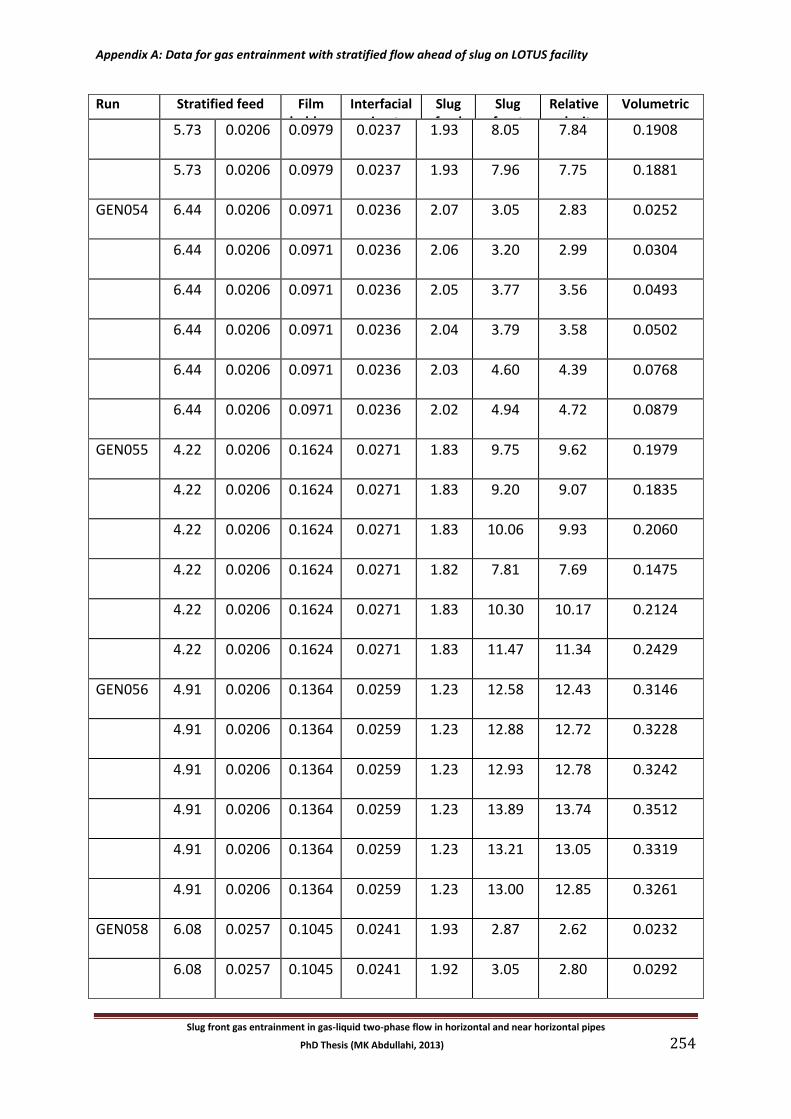
Appendix A: Data for gas entrainment with stratified flow ahead of slug on LOTUS facility
Slug front gas entrainment in gas-liquid two-phase flow in horizontal and near horizontal pipes
PhD Thesis (MK Abdullahi, 2013) 254
Run name
Stratified feed Film holdup
εLF
Interfacial perimeter
SI
Slug feed ULS
Slug front
velocity uT
Relative velocity
uR
Volumetric gas
entrainment rate
VGE /SI
5.73 0.0206 0.0979 0.0237 1.93 8.05 7.84 0.1908
5.73 0.0206 0.0979 0.0237 1.93 7.96 7.75 0.1881
GEN054 6.44 0.0206 0.0971 0.0236 2.07 3.05 2.83 0.0252
6.44 0.0206 0.0971 0.0236 2.06 3.20 2.99 0.0304
6.44 0.0206 0.0971 0.0236 2.05 3.77 3.56 0.0493
6.44 0.0206 0.0971 0.0236 2.04 3.79 3.58 0.0502
6.44 0.0206 0.0971 0.0236 2.03 4.60 4.39 0.0768
6.44 0.0206 0.0971 0.0236 2.02 4.94 4.72 0.0879
GEN055 4.22 0.0206 0.1624 0.0271 1.83 9.75 9.62 0.1979
4.22 0.0206 0.1624 0.0271 1.83 9.20 9.07 0.1835
4.22 0.0206 0.1624 0.0271 1.83 10.06 9.93 0.2060
4.22 0.0206 0.1624 0.0271 1.82 7.81 7.69 0.1475
4.22 0.0206 0.1624 0.0271 1.83 10.30 10.17 0.2124
4.22 0.0206 0.1624 0.0271 1.83 11.47 11.34 0.2429
GEN056 4.91 0.0206 0.1364 0.0259 1.23 12.58 12.43 0.3146
4.91 0.0206 0.1364 0.0259 1.23 12.88 12.72 0.3228
4.91 0.0206 0.1364 0.0259 1.23 12.93 12.78 0.3242
4.91 0.0206 0.1364 0.0259 1.23 13.89 13.74 0.3512
4.91 0.0206 0.1364 0.0259 1.23 13.21 13.05 0.3319
4.91 0.0206 0.1364 0.0259 1.23 13.00 12.85 0.3261
GEN058 6.08 0.0257 0.1045 0.0241 1.93 2.87 2.62 0.0232
6.08 0.0257 0.1045 0.0241 1.92 3.05 2.80 0.0292
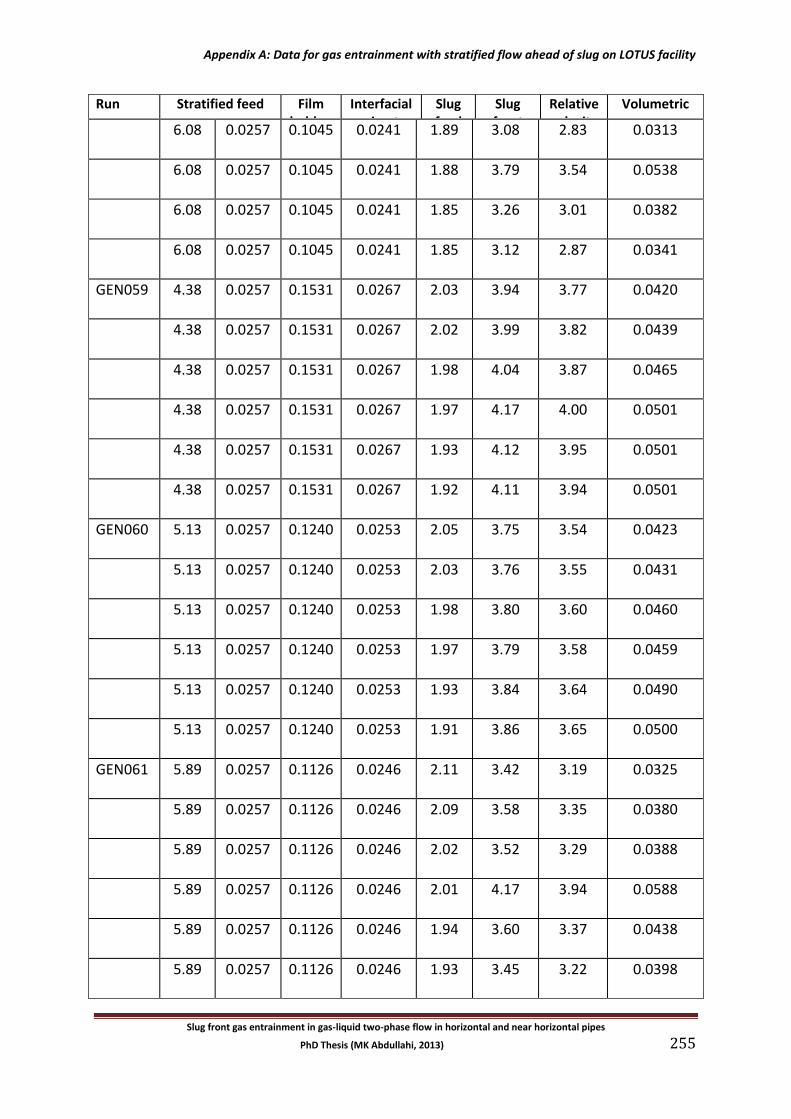
Appendix A: Data for gas entrainment with stratified flow ahead of slug on LOTUS facility
Slug front gas entrainment in gas-liquid two-phase flow in horizontal and near horizontal pipes
PhD Thesis (MK Abdullahi, 2013) 255
Run name
Stratified feed Film holdup
εLF
Interfacial perimeter
SI
Slug feed ULS
Slug front
velocity uT
Relative velocity
uR
Volumetric gas
entrainment rate
VGE /SI
6.08 0.0257 0.1045 0.0241 1.89 3.08 2.83 0.0313
6.08 0.0257 0.1045 0.0241 1.88 3.79 3.54 0.0538
6.08 0.0257 0.1045 0.0241 1.85 3.26 3.01 0.0382
6.08 0.0257 0.1045 0.0241 1.85 3.12 2.87 0.0341
GEN059 4.38 0.0257 0.1531 0.0267 2.03 3.94 3.77 0.0420
4.38 0.0257 0.1531 0.0267 2.02 3.99 3.82 0.0439
4.38 0.0257 0.1531 0.0267 1.98 4.04 3.87 0.0465
4.38 0.0257 0.1531 0.0267 1.97 4.17 4.00 0.0501
4.38 0.0257 0.1531 0.0267 1.93 4.12 3.95 0.0501
4.38 0.0257 0.1531 0.0267 1.92 4.11 3.94 0.0501
GEN060 5.13 0.0257 0.1240 0.0253 2.05 3.75 3.54 0.0423
5.13 0.0257 0.1240 0.0253 2.03 3.76 3.55 0.0431
5.13 0.0257 0.1240 0.0253 1.98 3.80 3.60 0.0460
5.13 0.0257 0.1240 0.0253 1.97 3.79 3.58 0.0459
5.13 0.0257 0.1240 0.0253 1.93 3.84 3.64 0.0490
5.13 0.0257 0.1240 0.0253 1.91 3.86 3.65 0.0500
GEN061 5.89 0.0257 0.1126 0.0246 2.11 3.42 3.19 0.0325
5.89 0.0257 0.1126 0.0246 2.09 3.58 3.35 0.0380
5.89 0.0257 0.1126 0.0246 2.02 3.52 3.29 0.0388
5.89 0.0257 0.1126 0.0246 2.01 4.17 3.94 0.0588
5.89 0.0257 0.1126 0.0246 1.94 3.60 3.37 0.0438
5.89 0.0257 0.1126 0.0246 1.93 3.45 3.22 0.0398
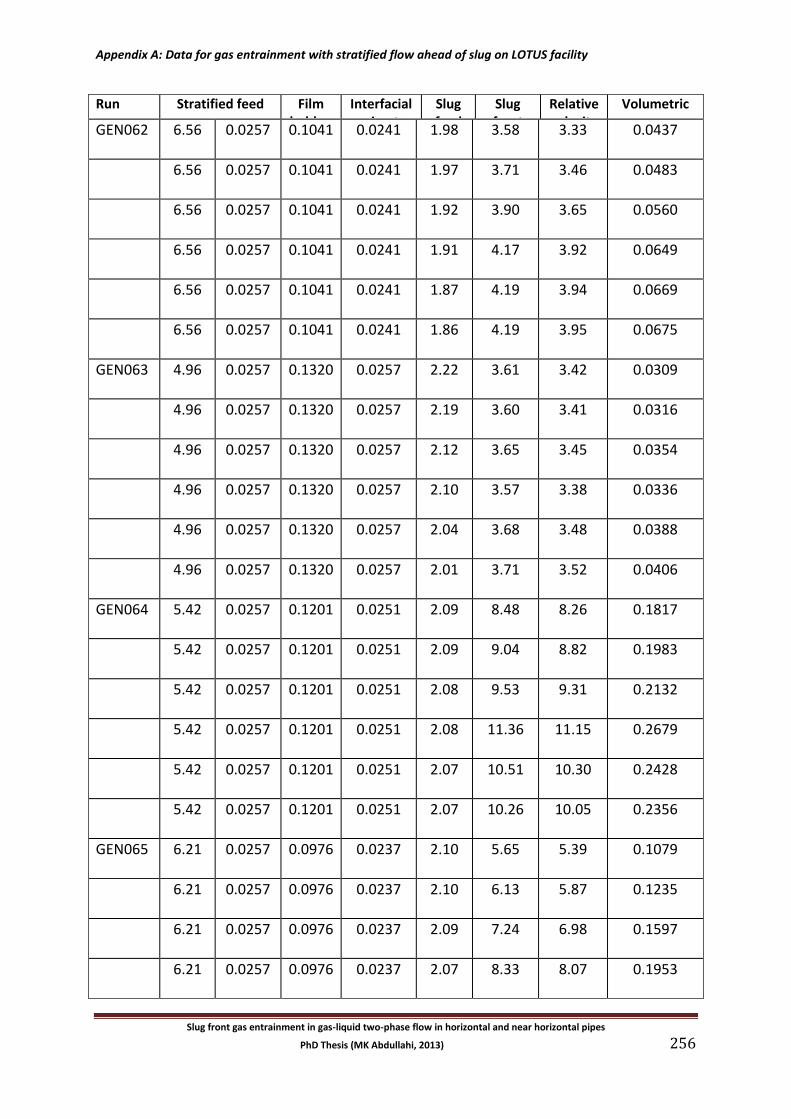
Appendix A: Data for gas entrainment with stratified flow ahead of slug on LOTUS facility
Slug front gas entrainment in gas-liquid two-phase flow in horizontal and near horizontal pipes
PhD Thesis (MK Abdullahi, 2013) 256
Run name
Stratified feed Film holdup
εLF
Interfacial perimeter
SI
Slug feed ULS
Slug front
velocity uT
Relative velocity
uR
Volumetric gas
entrainment rate
VGE /SI
GEN062 6.56 0.0257 0.1041 0.0241 1.98 3.58 3.33 0.0437
6.56 0.0257 0.1041 0.0241 1.97 3.71 3.46 0.0483
6.56 0.0257 0.1041 0.0241 1.92 3.90 3.65 0.0560
6.56 0.0257 0.1041 0.0241 1.91 4.17 3.92 0.0649
6.56 0.0257 0.1041 0.0241 1.87 4.19 3.94 0.0669
6.56 0.0257 0.1041 0.0241 1.86 4.19 3.95 0.0675
GEN063 4.96 0.0257 0.1320 0.0257 2.22 3.61 3.42 0.0309
4.96 0.0257 0.1320 0.0257 2.19 3.60 3.41 0.0316
4.96 0.0257 0.1320 0.0257 2.12 3.65 3.45 0.0354
4.96 0.0257 0.1320 0.0257 2.10 3.57 3.38 0.0336
4.96 0.0257 0.1320 0.0257 2.04 3.68 3.48 0.0388
4.96 0.0257 0.1320 0.0257 2.01 3.71 3.52 0.0406
GEN064 5.42 0.0257 0.1201 0.0251 2.09 8.48 8.26 0.1817
5.42 0.0257 0.1201 0.0251 2.09 9.04 8.82 0.1983
5.42 0.0257 0.1201 0.0251 2.08 9.53 9.31 0.2132
5.42 0.0257 0.1201 0.0251 2.08 11.36 11.15 0.2679
5.42 0.0257 0.1201 0.0251 2.07 10.51 10.30 0.2428
5.42 0.0257 0.1201 0.0251 2.07 10.26 10.05 0.2356
GEN065 6.21 0.0257 0.0976 0.0237 2.10 5.65 5.39 0.1079
6.21 0.0257 0.0976 0.0237 2.10 6.13 5.87 0.1235
6.21 0.0257 0.0976 0.0237 2.09 7.24 6.98 0.1597
6.21 0.0257 0.0976 0.0237 2.07 8.33 8.07 0.1953
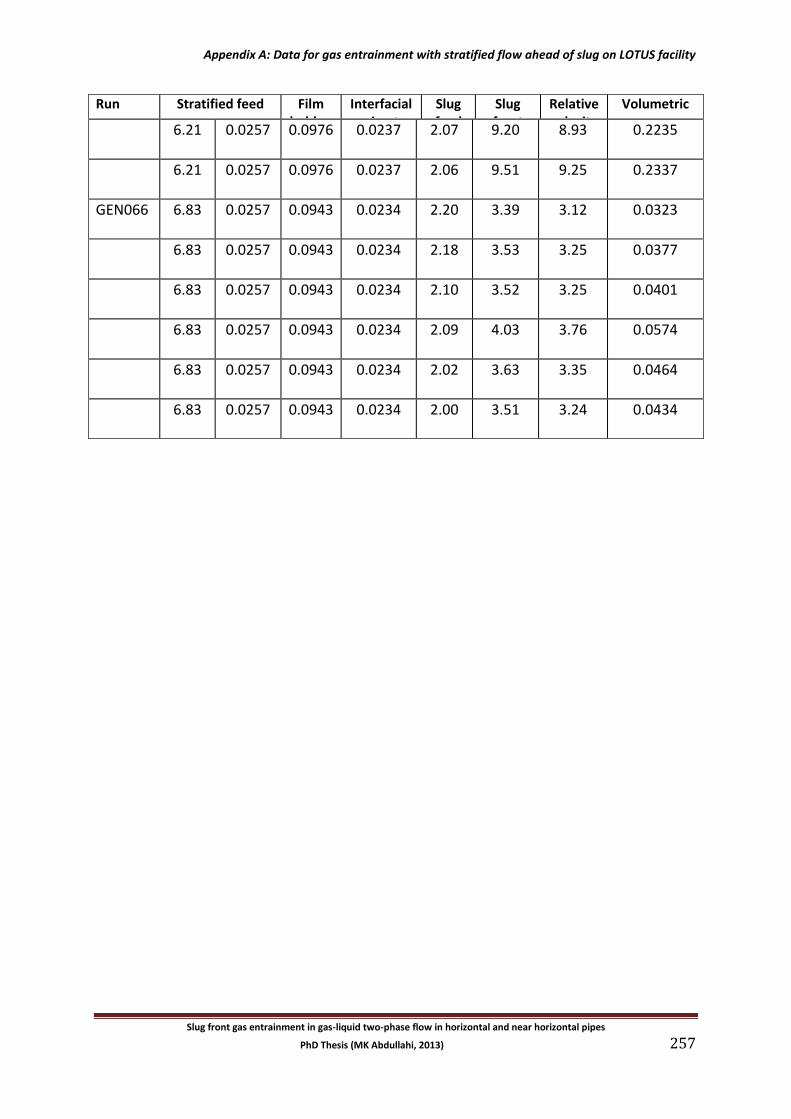
Appendix A: Data for gas entrainment with stratified flow ahead of slug on LOTUS facility
Slug front gas entrainment in gas-liquid two-phase flow in horizontal and near horizontal pipes
PhD Thesis (MK Abdullahi, 2013) 257
Run name
Stratified feed Film holdup
εLF
Interfacial perimeter
SI
Slug feed ULS
Slug front
velocity uT
Relative velocity
uR
Volumetric gas
entrainment rate
VGE /SI
6.21 0.0257 0.0976 0.0237 2.07 9.20 8.93 0.2235
6.21 0.0257 0.0976 0.0237 2.06 9.51 9.25 0.2337
GEN066 6.83 0.0257 0.0943 0.0234 2.20 3.39 3.12 0.0323
6.83 0.0257 0.0943 0.0234 2.18 3.53 3.25 0.0377
6.83 0.0257 0.0943 0.0234 2.10 3.52 3.25 0.0401
6.83 0.0257 0.0943 0.0234 2.09 4.03 3.76 0.0574
6.83 0.0257 0.0943 0.0234 2.02 3.63 3.35 0.0464
6.83 0.0257 0.0943 0.0234 2.00 3.51 3.24 0.0434
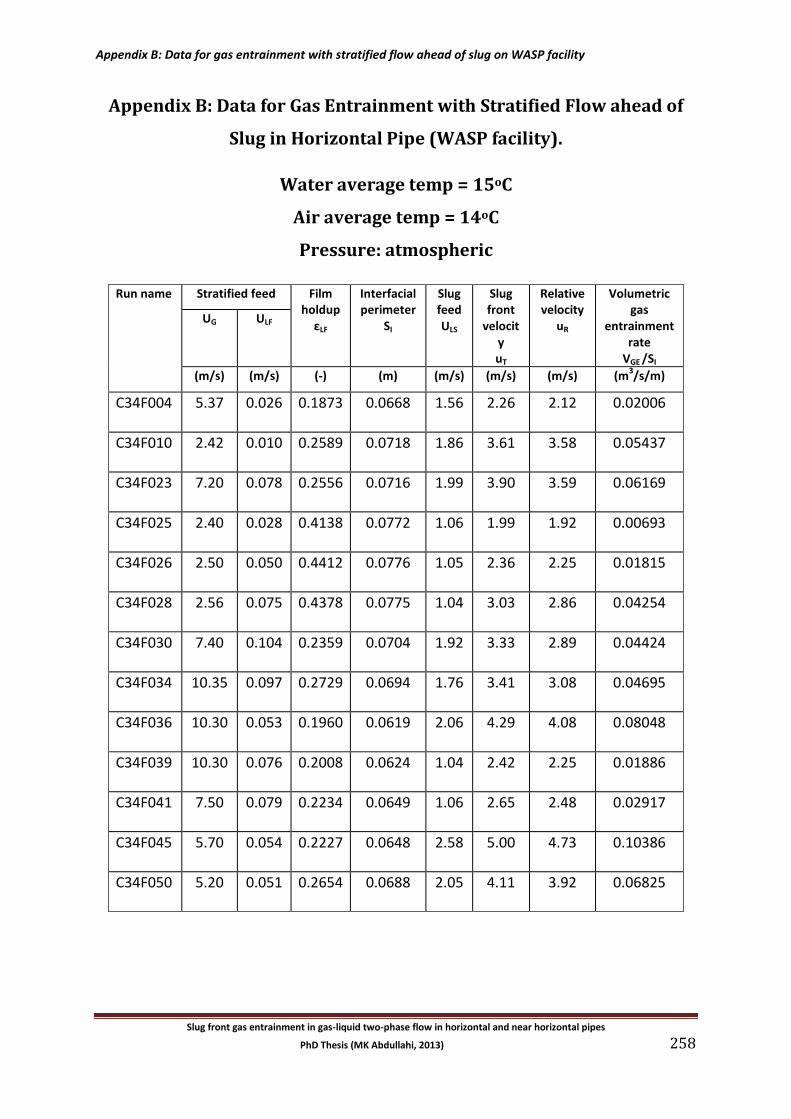
Appendix B: Data for gas entrainment with stratified flow ahead of slug on WASP facility
Slug front gas entrainment in gas-liquid two-phase flow in horizontal and near horizontal pipes
PhD Thesis (MK Abdullahi, 2013) 258
Appendix B: Data for Gas Entrainment with Stratified Flow ahead of
Slug in Horizontal Pipe (WASP facility).
Water average temp = 15oC
Air average temp = 14oC
Pressure: atmospheric
Run name Stratified feed Film holdup
εLF
Interfacial perimeter
SI
Slug feed ULS
Slug front
velocity uT
Relative velocity
uR
Volumetric gas
entrainment rate
VGE /SI
UG ULF
(m/s) (m/s) (-) (m) (m/s) (m/s) (m/s) (m3/s/m)
C34F004 5.37 0.026 0.1873 0.0668 1.56 2.26 2.12 0.02006
C34F010 2.42 0.010 0.2589 0.0718 1.86 3.61 3.58 0.05437
C34F023 7.20 0.078 0.2556 0.0716 1.99 3.90 3.59 0.06169
C34F025 2.40 0.028 0.4138 0.0772 1.06 1.99 1.92 0.00693
C34F026 2.50 0.050 0.4412 0.0776 1.05 2.36 2.25 0.01815
C34F028 2.56 0.075 0.4378 0.0775 1.04 3.03 2.86 0.04254
C34F030 7.40 0.104 0.2359 0.0704 1.92 3.33 2.89 0.04424
C34F034 10.35 0.097 0.2729 0.0694 1.76 3.41 3.08 0.04695
C34F036 10.30 0.053 0.1960 0.0619 2.06 4.29 4.08 0.08048
C34F039 10.30 0.076 0.2008 0.0624 1.04 2.42 2.25 0.01886
C34F041 7.50 0.079 0.2234 0.0649 1.06 2.65 2.48 0.02917
C34F045 5.70 0.054 0.2227 0.0648 2.58 5.00 4.73 0.10386
C34F050 5.20 0.051 0.2654 0.0688 2.05 4.11 3.92 0.06825
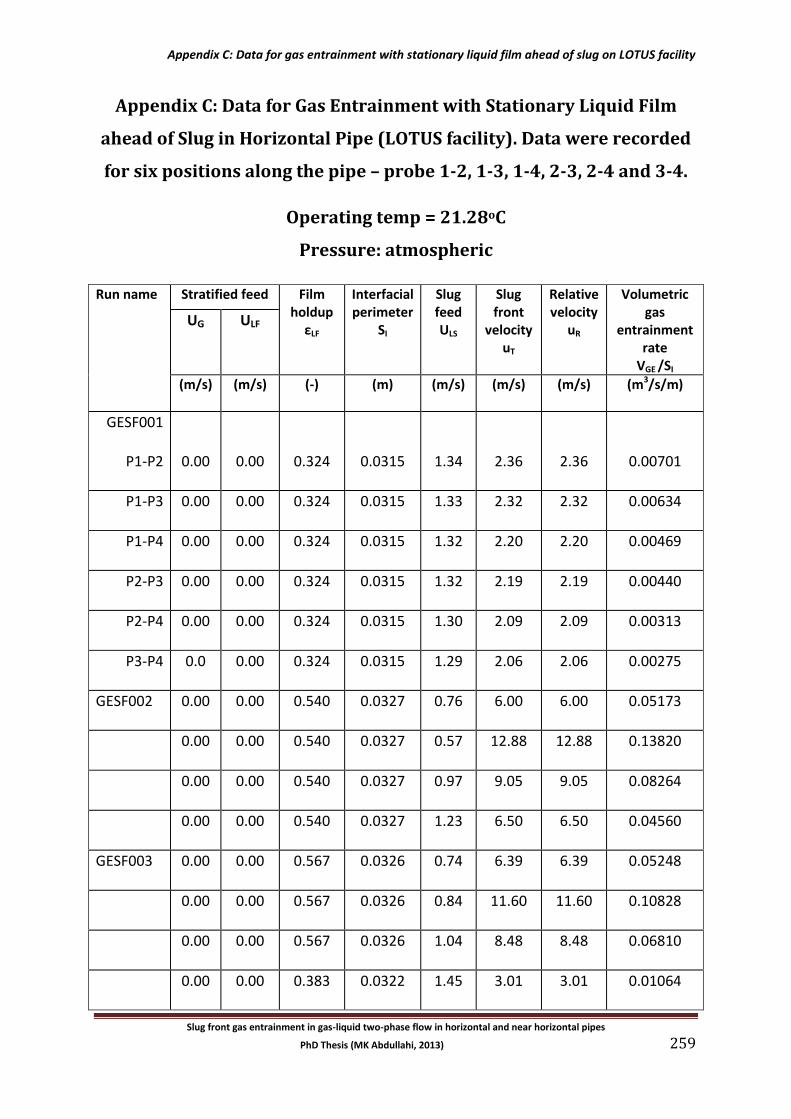
Appendix C: Data for gas entrainment with stationary liquid film ahead of slug on LOTUS facility
Slug front gas entrainment in gas-liquid two-phase flow in horizontal and near horizontal pipes
PhD Thesis (MK Abdullahi, 2013) 259
Appendix C: Data for Gas Entrainment with Stationary Liquid Film
ahead of Slug in Horizontal Pipe (LOTUS facility). Data were recorded
for six positions along the pipe – probe 1-2, 1-3, 1-4, 2-3, 2-4 and 3-4.
Operating temp = 21.28oC
Pressure: atmospheric
Run name Stratified feed Film holdup
εLF
Interfacial perimeter
SI
Slug feed ULS
Slug front
velocity uT
Relative velocity
uR
Volumetric gas
entrainment rate
VGE /SI
UG ULF
(m/s) (m/s) (-) (m) (m/s) (m/s) (m/s) (m3/s/m)
GESF001
P1-P2 0.00 0.00 0.324 0.0315 1.34 2.36 2.36 0.00701
P1-P3 0.00 0.00 0.324 0.0315 1.33 2.32 2.32 0.00634
P1-P4 0.00 0.00 0.324 0.0315 1.32 2.20 2.20 0.00469
P2-P3 0.00 0.00 0.324 0.0315 1.32 2.19 2.19 0.00440
P2-P4 0.00 0.00 0.324 0.0315 1.30 2.09 2.09 0.00313
P3-P4 0.0 0.00 0.324 0.0315 1.29 2.06 2.06 0.00275
GESF002 0.00 0.00 0.540 0.0327 0.76 6.00 6.00 0.05173
0.00 0.00 0.540 0.0327 0.57 12.88 12.88 0.13820
0.00 0.00 0.540 0.0327 0.97 9.05 9.05 0.08264
0.00 0.00 0.540 0.0327 1.23 6.50 6.50 0.04560
GESF003 0.00 0.00 0.567 0.0326 0.74 6.39 6.39 0.05248
0.00 0.00 0.567 0.0326 0.84 11.60 11.60 0.10828
0.00 0.00 0.567 0.0326 1.04 8.48 8.48 0.06810
0.00 0.00 0.383 0.0322 1.45 3.01 3.01 0.01064
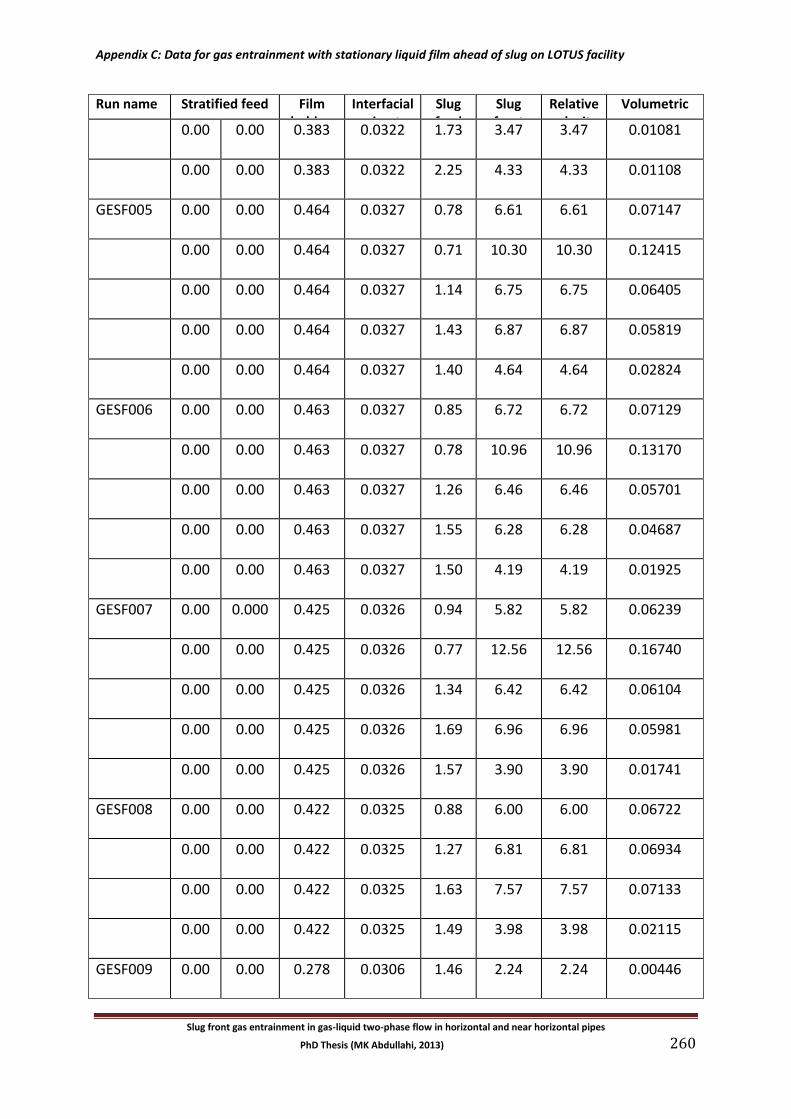
Appendix C: Data for gas entrainment with stationary liquid film ahead of slug on LOTUS facility
Slug front gas entrainment in gas-liquid two-phase flow in horizontal and near horizontal pipes
PhD Thesis (MK Abdullahi, 2013) 260
Run name Stratified feed Film holdup
εLF
Interfacial perimeter
SI
Slug feed ULS
Slug front
velocity uT
Relative velocity
uR
Volumetric gas
entrainment rate
VGE /SI
0.00 0.00 0.383 0.0322 1.73 3.47 3.47 0.01081
0.00 0.00 0.383 0.0322 2.25 4.33 4.33 0.01108
GESF005 0.00 0.00 0.464 0.0327 0.78 6.61 6.61 0.07147
0.00 0.00 0.464 0.0327 0.71 10.30 10.30 0.12415
0.00 0.00 0.464 0.0327 1.14 6.75 6.75 0.06405
0.00 0.00 0.464 0.0327 1.43 6.87 6.87 0.05819
0.00 0.00 0.464 0.0327 1.40 4.64 4.64 0.02824
GESF006 0.00 0.00 0.463 0.0327 0.85 6.72 6.72 0.07129
0.00 0.00 0.463 0.0327 0.78 10.96 10.96 0.13170
0.00 0.00 0.463 0.0327 1.26 6.46 6.46 0.05701
0.00 0.00 0.463 0.0327 1.55 6.28 6.28 0.04687
0.00 0.00 0.463 0.0327 1.50 4.19 4.19 0.01925
GESF007 0.00 0.000 0.425 0.0326 0.94 5.82 5.82 0.06239
0.00 0.00 0.425 0.0326 0.77 12.56 12.56 0.16740
0.00 0.00 0.425 0.0326 1.34 6.42 6.42 0.06104
0.00 0.00 0.425 0.0326 1.69 6.96 6.96 0.05981
0.00 0.00 0.425 0.0326 1.57 3.90 3.90 0.01741
GESF008 0.00 0.00 0.422 0.0325 0.88 6.00 6.00 0.06722
0.00 0.00 0.422 0.0325 1.27 6.81 6.81 0.06934
0.00 0.00 0.422 0.0325 1.63 7.57 7.57 0.07133
0.00 0.00 0.422 0.0325 1.49 3.98 3.98 0.02115
GESF009 0.00 0.00 0.278 0.0306 1.46 2.24 2.24 0.00446
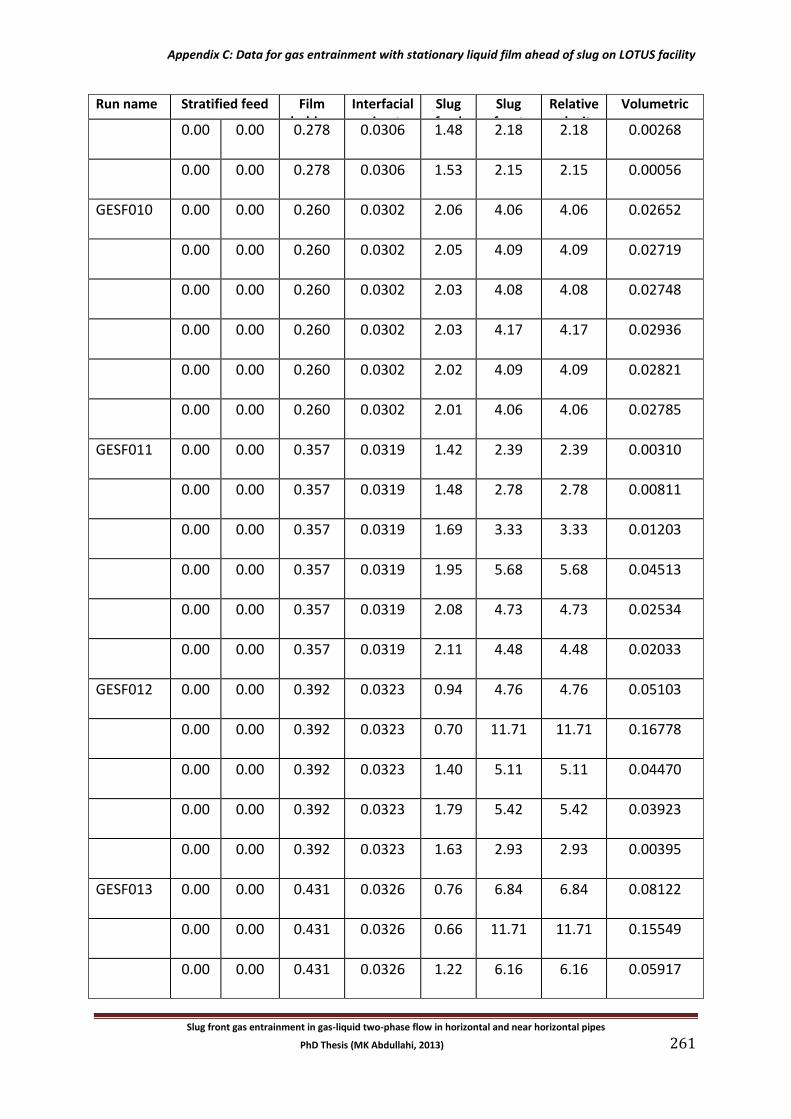
Appendix C: Data for gas entrainment with stationary liquid film ahead of slug on LOTUS facility
Slug front gas entrainment in gas-liquid two-phase flow in horizontal and near horizontal pipes
PhD Thesis (MK Abdullahi, 2013) 261
Run name Stratified feed Film holdup
εLF
Interfacial perimeter
SI
Slug feed ULS
Slug front
velocity uT
Relative velocity
uR
Volumetric gas
entrainment rate
VGE /SI
0.00 0.00 0.278 0.0306 1.48 2.18 2.18 0.00268
0.00 0.00 0.278 0.0306 1.53 2.15 2.15 0.00056
GESF010 0.00 0.00 0.260 0.0302 2.06 4.06 4.06 0.02652
0.00 0.00 0.260 0.0302 2.05 4.09 4.09 0.02719
0.00 0.00 0.260 0.0302 2.03 4.08 4.08 0.02748
0.00 0.00 0.260 0.0302 2.03 4.17 4.17 0.02936
0.00 0.00 0.260 0.0302 2.02 4.09 4.09 0.02821
0.00 0.00 0.260 0.0302 2.01 4.06 4.06 0.02785
GESF011 0.00 0.00 0.357 0.0319 1.42 2.39 2.39 0.00310
0.00 0.00 0.357 0.0319 1.48 2.78 2.78 0.00811
0.00 0.00 0.357 0.0319 1.69 3.33 3.33 0.01203
0.00 0.00 0.357 0.0319 1.95 5.68 5.68 0.04513
0.00 0.00 0.357 0.0319 2.08 4.73 4.73 0.02534
0.00 0.00 0.357 0.0319 2.11 4.48 4.48 0.02033
GESF012 0.00 0.00 0.392 0.0323 0.94 4.76 4.76 0.05103
0.00 0.00 0.392 0.0323 0.70 11.71 11.71 0.16778
0.00 0.00 0.392 0.0323 1.40 5.11 5.11 0.04470
0.00 0.00 0.392 0.0323 1.79 5.42 5.42 0.03923
0.00 0.00 0.392 0.0323 1.63 2.93 2.93 0.00395
GESF013 0.00 0.00 0.431 0.0326 0.76 6.84 6.84 0.08122
0.00 0.00 0.431 0.0326 0.66 11.71 11.71 0.15549
0.00 0.00 0.431 0.0326 1.22 6.16 6.16 0.05917
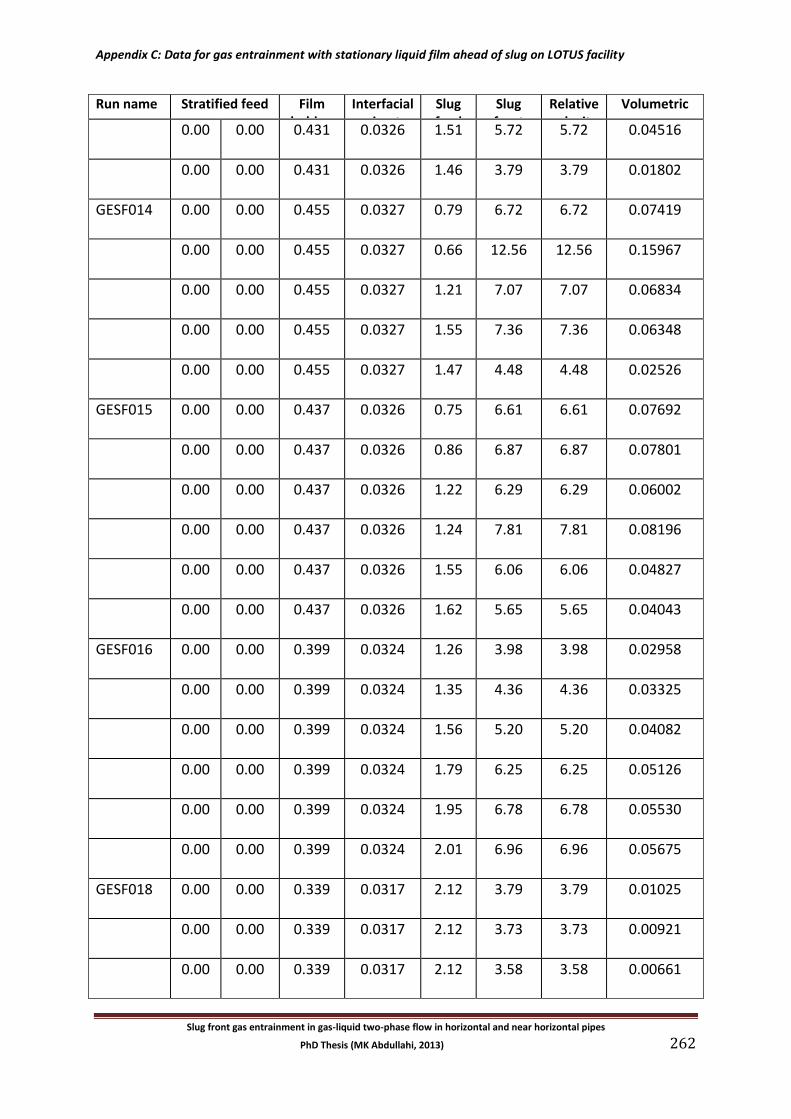
Appendix C: Data for gas entrainment with stationary liquid film ahead of slug on LOTUS facility
Slug front gas entrainment in gas-liquid two-phase flow in horizontal and near horizontal pipes
PhD Thesis (MK Abdullahi, 2013) 262
Run name Stratified feed Film holdup
εLF
Interfacial perimeter
SI
Slug feed ULS
Slug front
velocity uT
Relative velocity
uR
Volumetric gas
entrainment rate
VGE /SI
0.00 0.00 0.431 0.0326 1.51 5.72 5.72 0.04516
0.00 0.00 0.431 0.0326 1.46 3.79 3.79 0.01802
GESF014 0.00 0.00 0.455 0.0327 0.79 6.72 6.72 0.07419
0.00 0.00 0.455 0.0327 0.66 12.56 12.56 0.15967
0.00 0.00 0.455 0.0327 1.21 7.07 7.07 0.06834
0.00 0.00 0.455 0.0327 1.55 7.36 7.36 0.06348
0.00 0.00 0.455 0.0327 1.47 4.48 4.48 0.02526
GESF015 0.00 0.00 0.437 0.0326 0.75 6.61 6.61 0.07692
0.00 0.00 0.437 0.0326 0.86 6.87 6.87 0.07801
0.00 0.00 0.437 0.0326 1.22 6.29 6.29 0.06002
0.00 0.00 0.437 0.0326 1.24 7.81 7.81 0.08196
0.00 0.00 0.437 0.0326 1.55 6.06 6.06 0.04827
0.00 0.00 0.437 0.0326 1.62 5.65 5.65 0.04043
GESF016 0.00 0.00 0.399 0.0324 1.26 3.98 3.98 0.02958
0.00 0.00 0.399 0.0324 1.35 4.36 4.36 0.03325
0.00 0.00 0.399 0.0324 1.56 5.20 5.20 0.04082
0.00 0.00 0.399 0.0324 1.79 6.25 6.25 0.05126
0.00 0.00 0.399 0.0324 1.95 6.78 6.78 0.05530
0.00 0.00 0.399 0.0324 2.01 6.96 6.96 0.05675
GESF018 0.00 0.00 0.339 0.0317 2.12 3.79 3.79 0.01025
0.00 0.00 0.339 0.0317 2.12 3.73 3.73 0.00921
0.00 0.00 0.339 0.0317 2.12 3.58 3.58 0.00661
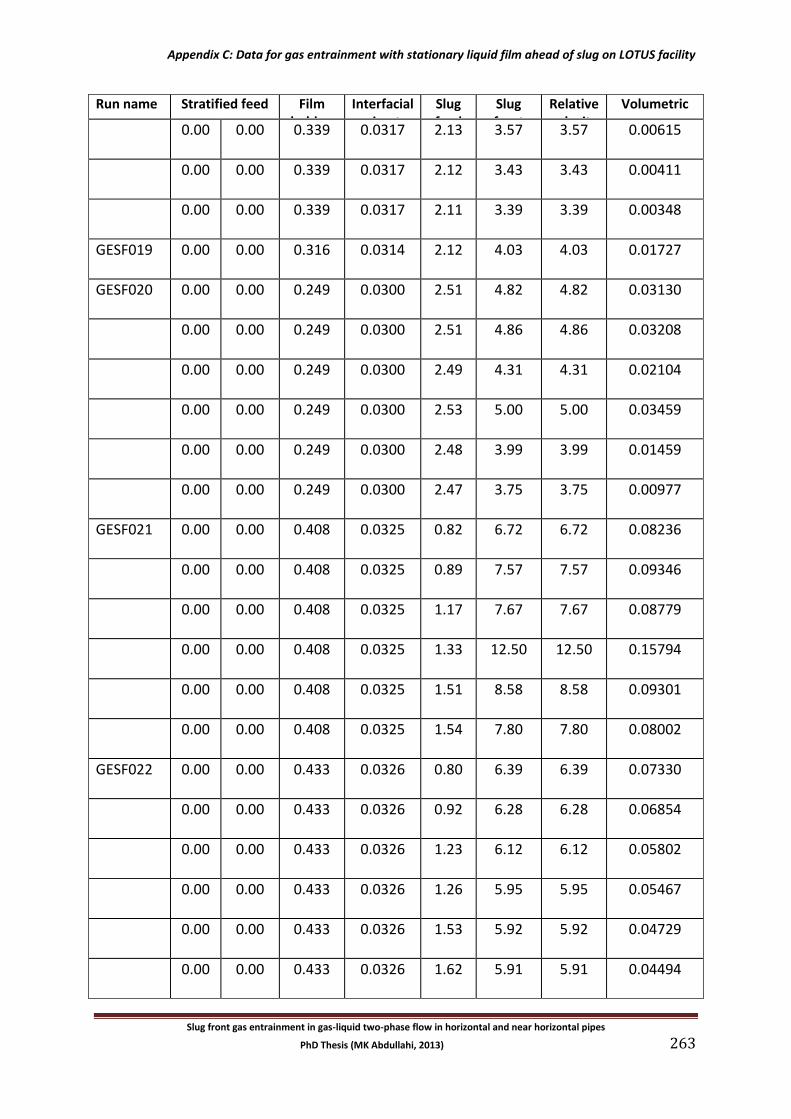
Appendix C: Data for gas entrainment with stationary liquid film ahead of slug on LOTUS facility
Slug front gas entrainment in gas-liquid two-phase flow in horizontal and near horizontal pipes
PhD Thesis (MK Abdullahi, 2013) 263
Run name Stratified feed Film holdup
εLF
Interfacial perimeter
SI
Slug feed ULS
Slug front
velocity uT
Relative velocity
uR
Volumetric gas
entrainment rate
VGE /SI
0.00 0.00 0.339 0.0317 2.13 3.57 3.57 0.00615
0.00 0.00 0.339 0.0317 2.12 3.43 3.43 0.00411
0.00 0.00 0.339 0.0317 2.11 3.39 3.39 0.00348
GESF019 0.00 0.00 0.316 0.0314 2.12 4.03 4.03 0.01727
GESF020 0.00 0.00 0.249 0.0300 2.51 4.82 4.82 0.03130
0.00 0.00 0.249 0.0300 2.51 4.86 4.86 0.03208
0.00 0.00 0.249 0.0300 2.49 4.31 4.31 0.02104
0.00 0.00 0.249 0.0300 2.53 5.00 5.00 0.03459
0.00 0.00 0.249 0.0300 2.48 3.99 3.99 0.01459
0.00 0.00 0.249 0.0300 2.47 3.75 3.75 0.00977
GESF021 0.00 0.00 0.408 0.0325 0.82 6.72 6.72 0.08236
0.00 0.00 0.408 0.0325 0.89 7.57 7.57 0.09346
0.00 0.00 0.408 0.0325 1.17 7.67 7.67 0.08779
0.00 0.00 0.408 0.0325 1.33 12.50 12.50 0.15794
0.00 0.00 0.408 0.0325 1.51 8.58 8.58 0.09301
0.00 0.00 0.408 0.0325 1.54 7.80 7.80 0.08002
GESF022 0.00 0.00 0.433 0.0326 0.80 6.39 6.39 0.07330
0.00 0.00 0.433 0.0326 0.92 6.28 6.28 0.06854
0.00 0.00 0.433 0.0326 1.23 6.12 6.12 0.05802
0.00 0.00 0.433 0.0326 1.26 5.95 5.95 0.05467
0.00 0.00 0.433 0.0326 1.53 5.92 5.92 0.04729
0.00 0.00 0.433 0.0326 1.62 5.91 5.91 0.04494
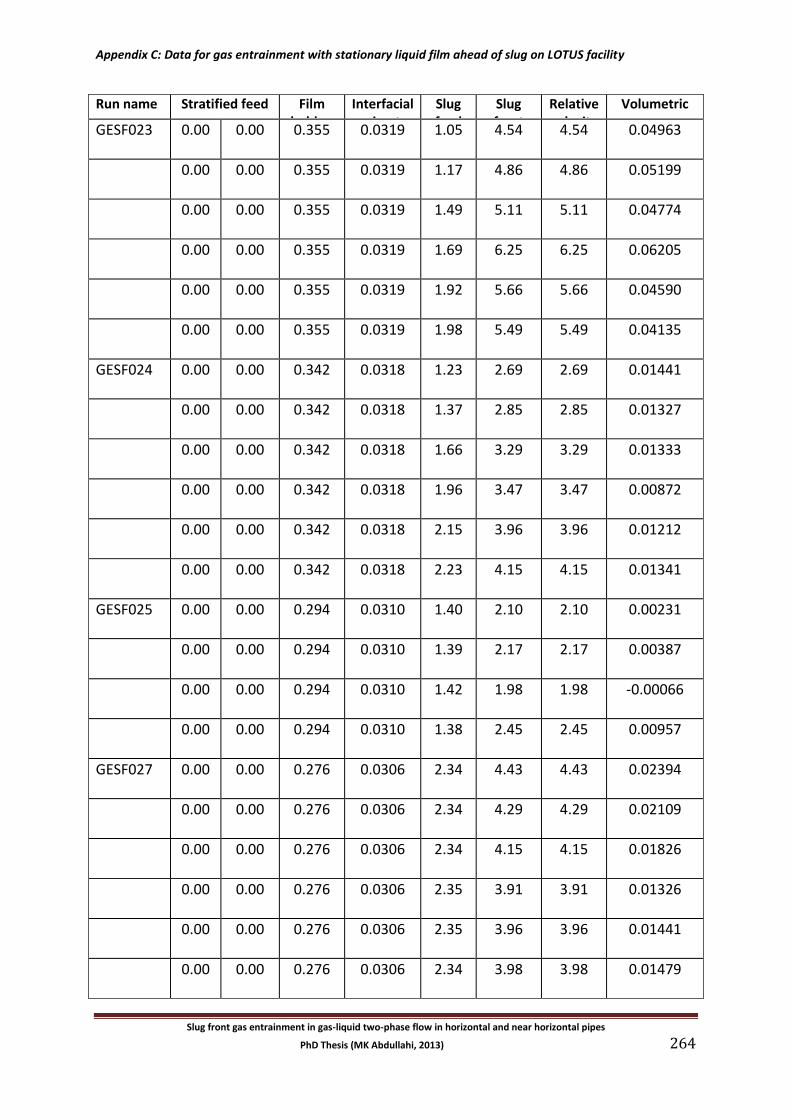
Appendix C: Data for gas entrainment with stationary liquid film ahead of slug on LOTUS facility
Slug front gas entrainment in gas-liquid two-phase flow in horizontal and near horizontal pipes
PhD Thesis (MK Abdullahi, 2013) 264
Run name Stratified feed Film holdup
εLF
Interfacial perimeter
SI
Slug feed ULS
Slug front
velocity uT
Relative velocity
uR
Volumetric gas
entrainment rate
VGE /SI
GESF023 0.00 0.00 0.355 0.0319 1.05 4.54 4.54 0.04963
0.00 0.00 0.355 0.0319 1.17 4.86 4.86 0.05199
0.00 0.00 0.355 0.0319 1.49 5.11 5.11 0.04774
0.00 0.00 0.355 0.0319 1.69 6.25 6.25 0.06205
0.00 0.00 0.355 0.0319 1.92 5.66 5.66 0.04590
0.00 0.00 0.355 0.0319 1.98 5.49 5.49 0.04135
GESF024 0.00 0.00 0.342 0.0318 1.23 2.69 2.69 0.01441
0.00 0.00 0.342 0.0318 1.37 2.85 2.85 0.01327
0.00 0.00 0.342 0.0318 1.66 3.29 3.29 0.01333
0.00 0.00 0.342 0.0318 1.96 3.47 3.47 0.00872
0.00 0.00 0.342 0.0318 2.15 3.96 3.96 0.01212
0.00 0.00 0.342 0.0318 2.23 4.15 4.15 0.01341
GESF025 0.00 0.00 0.294 0.0310 1.40 2.10 2.10 0.00231
0.00 0.00 0.294 0.0310 1.39 2.17 2.17 0.00387
0.00 0.00 0.294 0.0310 1.42 1.98 1.98 -0.00066
0.00 0.00 0.294 0.0310 1.38 2.45 2.45 0.00957
GESF027 0.00 0.00 0.276 0.0306 2.34 4.43 4.43 0.02394
0.00 0.00 0.276 0.0306 2.34 4.29 4.29 0.02109
0.00 0.00 0.276 0.0306 2.34 4.15 4.15 0.01826
0.00 0.00 0.276 0.0306 2.35 3.91 3.91 0.01326
0.00 0.00 0.276 0.0306 2.35 3.96 3.96 0.01441
0.00 0.00 0.276 0.0306 2.34 3.98 3.98 0.01479
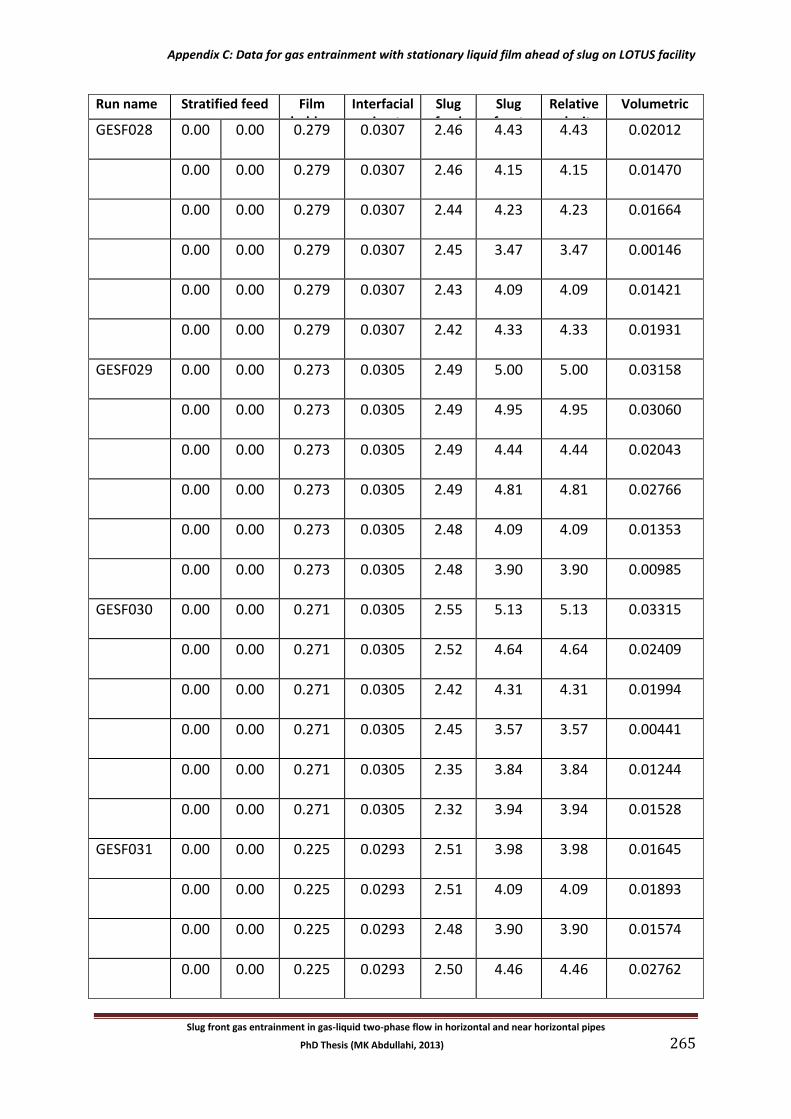
Appendix C: Data for gas entrainment with stationary liquid film ahead of slug on LOTUS facility
Slug front gas entrainment in gas-liquid two-phase flow in horizontal and near horizontal pipes
PhD Thesis (MK Abdullahi, 2013) 265
Run name Stratified feed Film holdup
εLF
Interfacial perimeter
SI
Slug feed ULS
Slug front
velocity uT
Relative velocity
uR
Volumetric gas
entrainment rate
VGE /SI
GESF028 0.00 0.00 0.279 0.0307 2.46 4.43 4.43 0.02012
0.00 0.00 0.279 0.0307 2.46 4.15 4.15 0.01470
0.00 0.00 0.279 0.0307 2.44 4.23 4.23 0.01664
0.00 0.00 0.279 0.0307 2.45 3.47 3.47 0.00146
0.00 0.00 0.279 0.0307 2.43 4.09 4.09 0.01421
0.00 0.00 0.279 0.0307 2.42 4.33 4.33 0.01931
GESF029 0.00 0.00 0.273 0.0305 2.49 5.00 5.00 0.03158
0.00 0.00 0.273 0.0305 2.49 4.95 4.95 0.03060
0.00 0.00 0.273 0.0305 2.49 4.44 4.44 0.02043
0.00 0.00 0.273 0.0305 2.49 4.81 4.81 0.02766
0.00 0.00 0.273 0.0305 2.48 4.09 4.09 0.01353
0.00 0.00 0.273 0.0305 2.48 3.90 3.90 0.00985
GESF030 0.00 0.00 0.271 0.0305 2.55 5.13 5.13 0.03315
0.00 0.00 0.271 0.0305 2.52 4.64 4.64 0.02409
0.00 0.00 0.271 0.0305 2.42 4.31 4.31 0.01994
0.00 0.00 0.271 0.0305 2.45 3.57 3.57 0.00441
0.00 0.00 0.271 0.0305 2.35 3.84 3.84 0.01244
0.00 0.00 0.271 0.0305 2.32 3.94 3.94 0.01528
GESF031 0.00 0.00 0.225 0.0293 2.51 3.98 3.98 0.01645
0.00 0.00 0.225 0.0293 2.51 4.09 4.09 0.01893
0.00 0.00 0.225 0.0293 2.48 3.90 3.90 0.01574
0.00 0.00 0.225 0.0293 2.50 4.46 4.46 0.02762
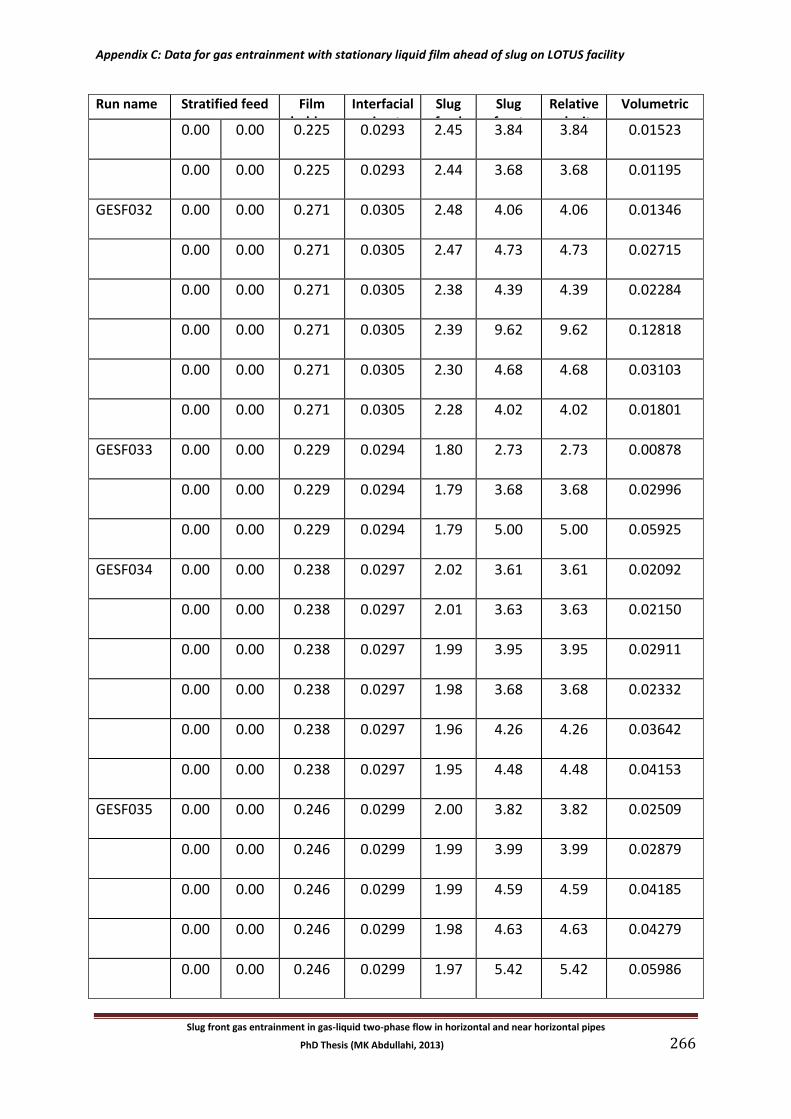
Appendix C: Data for gas entrainment with stationary liquid film ahead of slug on LOTUS facility
Slug front gas entrainment in gas-liquid two-phase flow in horizontal and near horizontal pipes
PhD Thesis (MK Abdullahi, 2013) 266
Run name Stratified feed Film holdup
εLF
Interfacial perimeter
SI
Slug feed ULS
Slug front
velocity uT
Relative velocity
uR
Volumetric gas
entrainment rate
VGE /SI
0.00 0.00 0.225 0.0293 2.45 3.84 3.84 0.01523
0.00 0.00 0.225 0.0293 2.44 3.68 3.68 0.01195
GESF032 0.00 0.00 0.271 0.0305 2.48 4.06 4.06 0.01346
0.00 0.00 0.271 0.0305 2.47 4.73 4.73 0.02715
0.00 0.00 0.271 0.0305 2.38 4.39 4.39 0.02284
0.00 0.00 0.271 0.0305 2.39 9.62 9.62 0.12818
0.00 0.00 0.271 0.0305 2.30 4.68 4.68 0.03103
0.00 0.00 0.271 0.0305 2.28 4.02 4.02 0.01801
GESF033 0.00 0.00 0.229 0.0294 1.80 2.73 2.73 0.00878
0.00 0.00 0.229 0.0294 1.79 3.68 3.68 0.02996
0.00 0.00 0.229 0.0294 1.79 5.00 5.00 0.05925
GESF034 0.00 0.00 0.238 0.0297 2.02 3.61 3.61 0.02092
0.00 0.00 0.238 0.0297 2.01 3.63 3.63 0.02150
0.00 0.00 0.238 0.0297 1.99 3.95 3.95 0.02911
0.00 0.00 0.238 0.0297 1.98 3.68 3.68 0.02332
0.00 0.00 0.238 0.0297 1.96 4.26 4.26 0.03642
0.00 0.00 0.238 0.0297 1.95 4.48 4.48 0.04153
GESF035 0.00 0.00 0.246 0.0299 2.00 3.82 3.82 0.02509
0.00 0.00 0.246 0.0299 1.99 3.99 3.99 0.02879
0.00 0.00 0.246 0.0299 1.99 4.59 4.59 0.04185
0.00 0.00 0.246 0.0299 1.98 4.63 4.63 0.04279
0.00 0.00 0.246 0.0299 1.97 5.42 5.42 0.05986
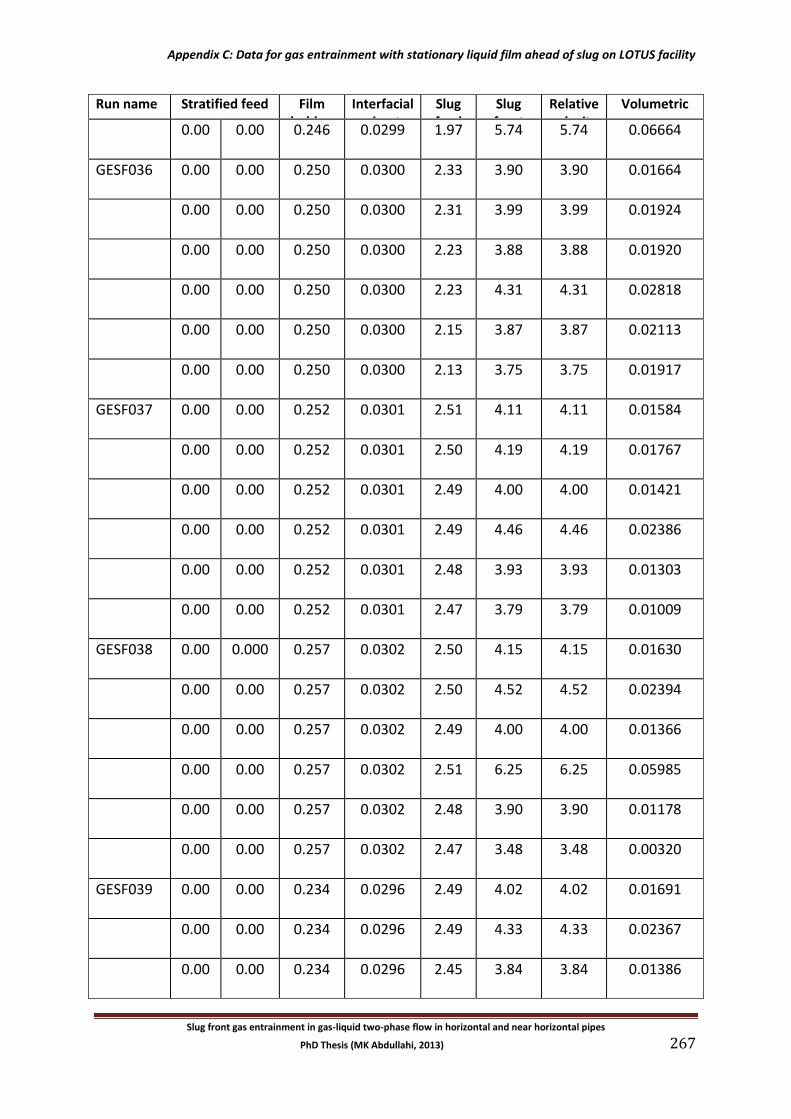
Appendix C: Data for gas entrainment with stationary liquid film ahead of slug on LOTUS facility
Slug front gas entrainment in gas-liquid two-phase flow in horizontal and near horizontal pipes
PhD Thesis (MK Abdullahi, 2013) 267
Run name Stratified feed Film holdup
εLF
Interfacial perimeter
SI
Slug feed ULS
Slug front
velocity uT
Relative velocity
uR
Volumetric gas
entrainment rate
VGE /SI
0.00 0.00 0.246 0.0299 1.97 5.74 5.74 0.06664
GESF036 0.00 0.00 0.250 0.0300 2.33 3.90 3.90 0.01664
0.00 0.00 0.250 0.0300 2.31 3.99 3.99 0.01924
0.00 0.00 0.250 0.0300 2.23 3.88 3.88 0.01920
0.00 0.00 0.250 0.0300 2.23 4.31 4.31 0.02818
0.00 0.00 0.250 0.0300 2.15 3.87 3.87 0.02113
0.00 0.00 0.250 0.0300 2.13 3.75 3.75 0.01917
GESF037 0.00 0.00 0.252 0.0301 2.51 4.11 4.11 0.01584
0.00 0.00 0.252 0.0301 2.50 4.19 4.19 0.01767
0.00 0.00 0.252 0.0301 2.49 4.00 4.00 0.01421
0.00 0.00 0.252 0.0301 2.49 4.46 4.46 0.02386
0.00 0.00 0.252 0.0301 2.48 3.93 3.93 0.01303
0.00 0.00 0.252 0.0301 2.47 3.79 3.79 0.01009
GESF038 0.00 0.000 0.257 0.0302 2.50 4.15 4.15 0.01630
0.00 0.00 0.257 0.0302 2.50 4.52 4.52 0.02394
0.00 0.00 0.257 0.0302 2.49 4.00 4.00 0.01366
0.00 0.00 0.257 0.0302 2.51 6.25 6.25 0.05985
0.00 0.00 0.257 0.0302 2.48 3.90 3.90 0.01178
0.00 0.00 0.257 0.0302 2.47 3.48 3.48 0.00320
GESF039 0.00 0.00 0.234 0.0296 2.49 4.02 4.02 0.01691
0.00 0.00 0.234 0.0296 2.49 4.33 4.33 0.02367
0.00 0.00 0.234 0.0296 2.45 3.84 3.84 0.01386
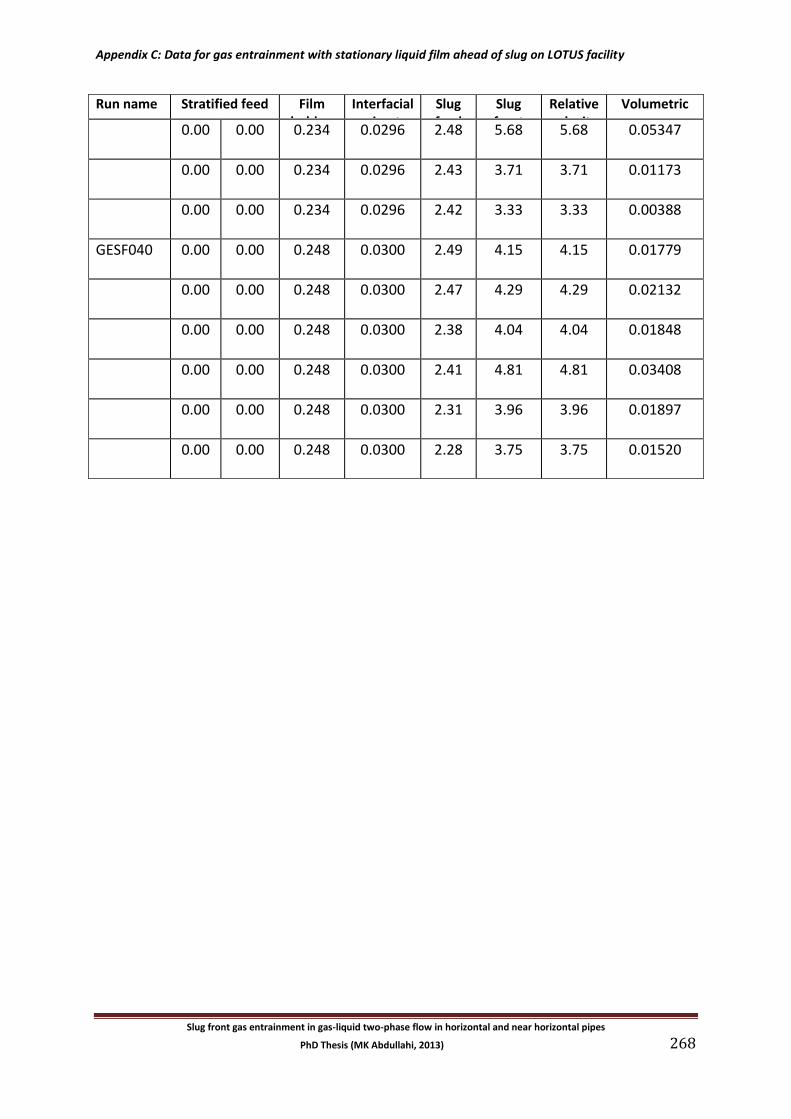
Appendix C: Data for gas entrainment with stationary liquid film ahead of slug on LOTUS facility
Slug front gas entrainment in gas-liquid two-phase flow in horizontal and near horizontal pipes
PhD Thesis (MK Abdullahi, 2013) 268
Run name Stratified feed Film holdup
εLF
Interfacial perimeter
SI
Slug feed ULS
Slug front
velocity uT
Relative velocity
uR
Volumetric gas
entrainment rate
VGE /SI
0.00 0.00 0.234 0.0296 2.48 5.68 5.68 0.05347
0.00 0.00 0.234 0.0296 2.43 3.71 3.71 0.01173
0.00 0.00 0.234 0.0296 2.42 3.33 3.33 0.00388
GESF040 0.00 0.00 0.248 0.0300 2.49 4.15 4.15 0.01779
0.00 0.00 0.248 0.0300 2.47 4.29 4.29 0.02132
0.00 0.00 0.248 0.0300 2.38 4.04 4.04 0.01848
0.00 0.00 0.248 0.0300 2.41 4.81 4.81 0.03408
0.00 0.00 0.248 0.0300 2.31 3.96 3.96 0.01897
0.00 0.00 0.248 0.0300 2.28 3.75 3.75 0.01520
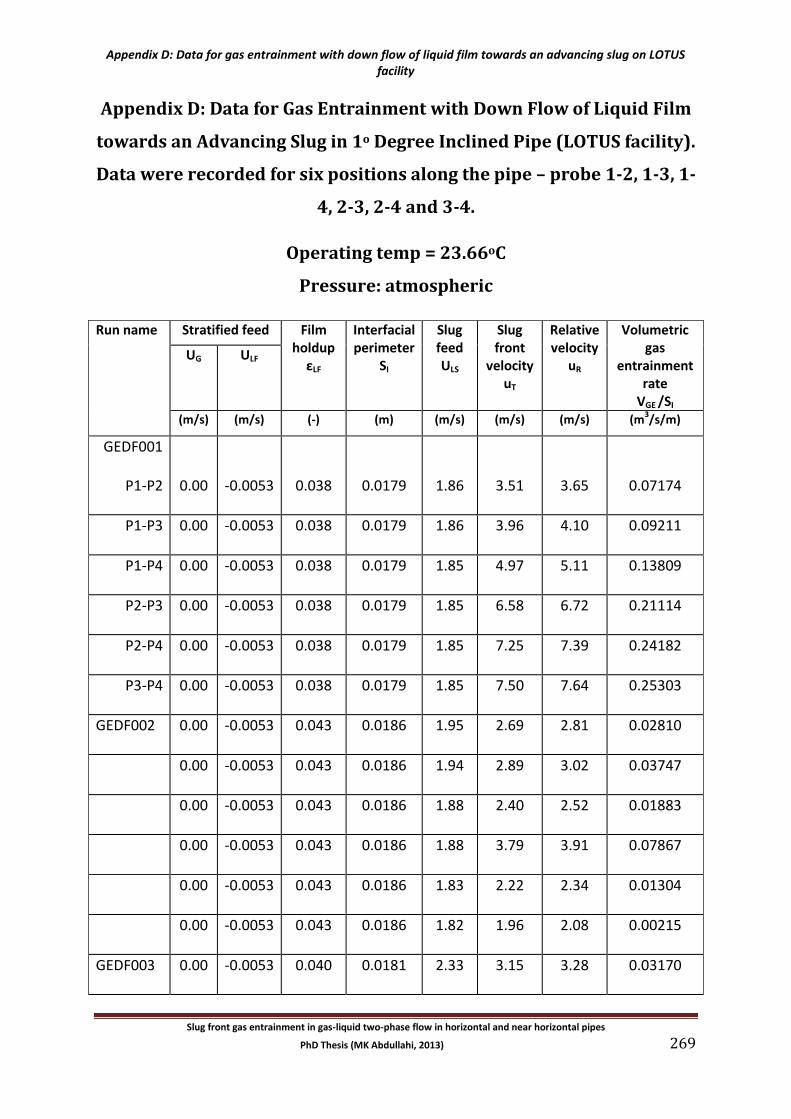
Appendix D: Data for gas entrainment with down flow of liquid film towards an advancing slug on LOTUS facility
Slug front gas entrainment in gas-liquid two-phase flow in horizontal and near horizontal pipes
PhD Thesis (MK Abdullahi, 2013) 269
Appendix D: Data for Gas Entrainment with Down Flow of Liquid Film
towards an Advancing Slug in 1o Degree Inclined Pipe (LOTUS facility).
Data were recorded for six positions along the pipe – probe 1-2, 1-3, 1-
4, 2-3, 2-4 and 3-4.
Operating temp = 23.66oC
Pressure: atmospheric
Run name Stratified feed Film holdup
εLF
Interfacial perimeter
SI
Slug feed ULS
Slug front
velocity uT
Relative velocity
uR
Volumetric gas
entrainment rate
VGE /SI
UG ULF
(m/s) (m/s) (-) (m) (m/s) (m/s) (m/s) (m3/s/m)
GEDF001
P1-P2 0.00 -0.0053 0.038 0.0179 1.86 3.51 3.65 0.07174
P1-P3 0.00 -0.0053 0.038 0.0179 1.86 3.96 4.10 0.09211
P1-P4 0.00 -0.0053 0.038 0.0179 1.85 4.97 5.11 0.13809
P2-P3 0.00 -0.0053 0.038 0.0179 1.85 6.58 6.72 0.21114
P2-P4 0.00 -0.0053 0.038 0.0179 1.85 7.25 7.39 0.24182
P3-P4 0.00 -0.0053 0.038 0.0179 1.85 7.50 7.64 0.25303
GEDF002 0.00 -0.0053 0.043 0.0186 1.95 2.69 2.81 0.02810
0.00 -0.0053 0.043 0.0186 1.94 2.89 3.02 0.03747
0.00 -0.0053 0.043 0.0186 1.88 2.40 2.52 0.01883
0.00 -0.0053 0.043 0.0186 1.88 3.79 3.91 0.07867
0.00 -0.0053 0.043 0.0186 1.83 2.22 2.34 0.01304
0.00 -0.0053 0.043 0.0186 1.82 1.96 2.08 0.00215
GEDF003 0.00 -0.0053 0.040 0.0181 2.33 3.15 3.28 0.03170
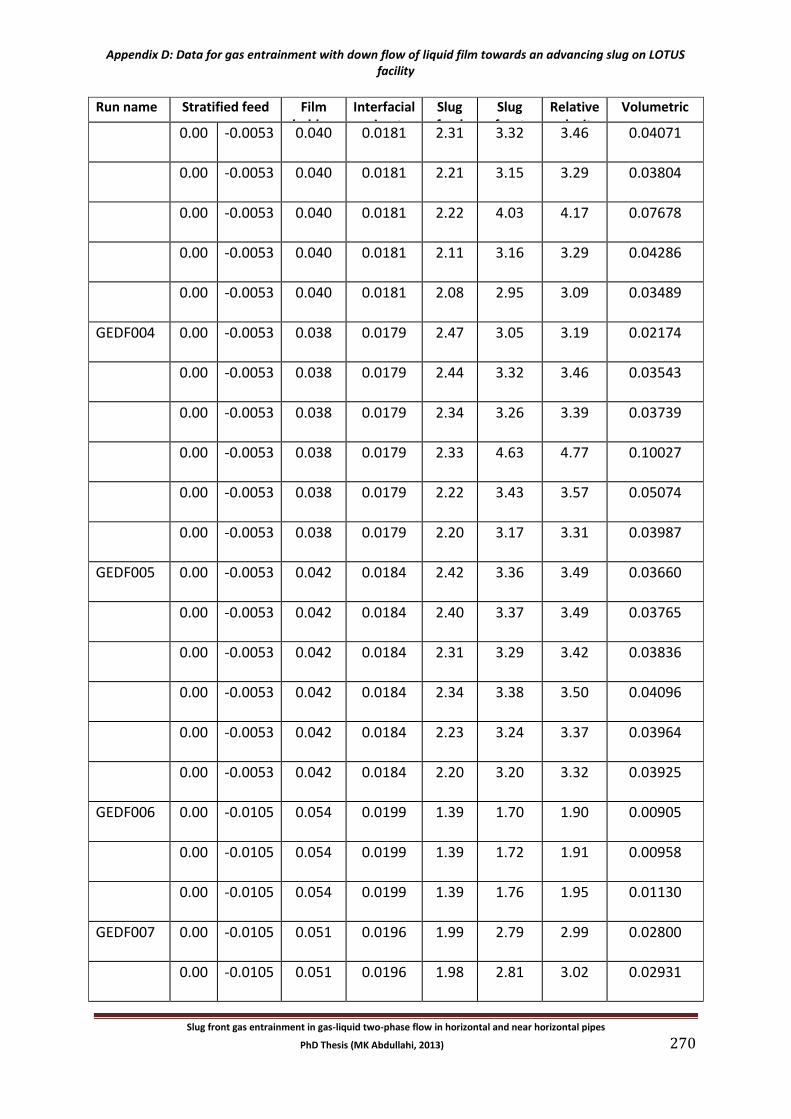
Appendix D: Data for gas entrainment with down flow of liquid film towards an advancing slug on LOTUS facility
Slug front gas entrainment in gas-liquid two-phase flow in horizontal and near horizontal pipes
PhD Thesis (MK Abdullahi, 2013) 270
Run name Stratified feed Film holdup
εLF
Interfacial perimeter
SI
Slug feed ULS
Slug front
velocity uT
Relative velocity
uR
Volumetric gas
entrainment rate
VGE /SI
0.00 -0.0053 0.040 0.0181 2.31 3.32 3.46 0.04071
0.00 -0.0053 0.040 0.0181 2.21 3.15 3.29 0.03804
0.00 -0.0053 0.040 0.0181 2.22 4.03 4.17 0.07678
0.00 -0.0053 0.040 0.0181 2.11 3.16 3.29 0.04286
0.00 -0.0053 0.040 0.0181 2.08 2.95 3.09 0.03489
GEDF004 0.00 -0.0053 0.038 0.0179 2.47 3.05 3.19 0.02174
0.00 -0.0053 0.038 0.0179 2.44 3.32 3.46 0.03543
0.00 -0.0053 0.038 0.0179 2.34 3.26 3.39 0.03739
0.00 -0.0053 0.038 0.0179 2.33 4.63 4.77 0.10027
0.00 -0.0053 0.038 0.0179 2.22 3.43 3.57 0.05074
0.00 -0.0053 0.038 0.0179 2.20 3.17 3.31 0.03987
GEDF005 0.00 -0.0053 0.042 0.0184 2.42 3.36 3.49 0.03660
0.00 -0.0053 0.042 0.0184 2.40 3.37 3.49 0.03765
0.00 -0.0053 0.042 0.0184 2.31 3.29 3.42 0.03836
0.00 -0.0053 0.042 0.0184 2.34 3.38 3.50 0.04096
0.00 -0.0053 0.042 0.0184 2.23 3.24 3.37 0.03964
0.00 -0.0053 0.042 0.0184 2.20 3.20 3.32 0.03925
GEDF006 0.00 -0.0105 0.054 0.0199 1.39 1.70 1.90 0.00905
0.00 -0.0105 0.054 0.0199 1.39 1.72 1.91 0.00958
0.00 -0.0105 0.054 0.0199 1.39 1.76 1.95 0.01130
GEDF007 0.00 -0.0105 0.051 0.0196 1.99 2.79 2.99 0.02800
0.00 -0.0105 0.051 0.0196 1.98 2.81 3.02 0.02931
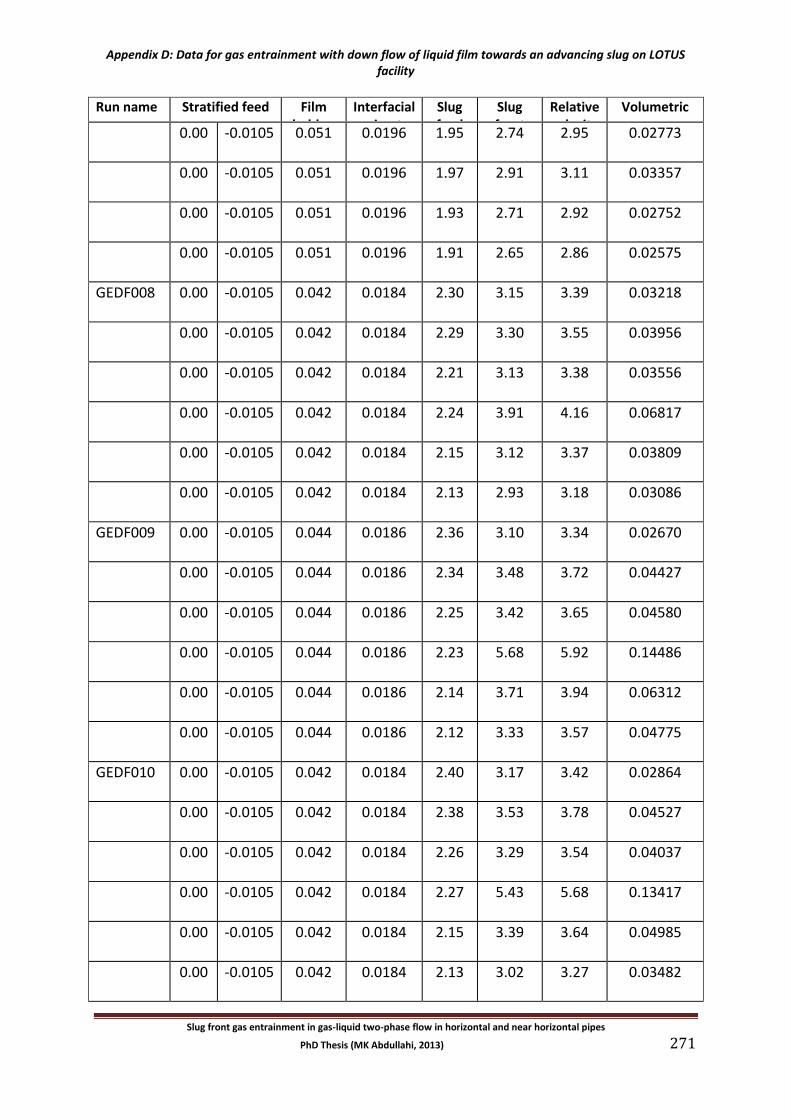
Appendix D: Data for gas entrainment with down flow of liquid film towards an advancing slug on LOTUS facility
Slug front gas entrainment in gas-liquid two-phase flow in horizontal and near horizontal pipes
PhD Thesis (MK Abdullahi, 2013) 271
Run name Stratified feed Film holdup
εLF
Interfacial perimeter
SI
Slug feed ULS
Slug front
velocity uT
Relative velocity
uR
Volumetric gas
entrainment rate
VGE /SI
0.00 -0.0105 0.051 0.0196 1.95 2.74 2.95 0.02773
0.00 -0.0105 0.051 0.0196 1.97 2.91 3.11 0.03357
0.00 -0.0105 0.051 0.0196 1.93 2.71 2.92 0.02752
0.00 -0.0105 0.051 0.0196 1.91 2.65 2.86 0.02575
GEDF008 0.00 -0.0105 0.042 0.0184 2.30 3.15 3.39 0.03218
0.00 -0.0105 0.042 0.0184 2.29 3.30 3.55 0.03956
0.00 -0.0105 0.042 0.0184 2.21 3.13 3.38 0.03556
0.00 -0.0105 0.042 0.0184 2.24 3.91 4.16 0.06817
0.00 -0.0105 0.042 0.0184 2.15 3.12 3.37 0.03809
0.00 -0.0105 0.042 0.0184 2.13 2.93 3.18 0.03086
GEDF009 0.00 -0.0105 0.044 0.0186 2.36 3.10 3.34 0.02670
0.00 -0.0105 0.044 0.0186 2.34 3.48 3.72 0.04427
0.00 -0.0105 0.044 0.0186 2.25 3.42 3.65 0.04580
0.00 -0.0105 0.044 0.0186 2.23 5.68 5.92 0.14486
0.00 -0.0105 0.044 0.0186 2.14 3.71 3.94 0.06312
0.00 -0.0105 0.044 0.0186 2.12 3.33 3.57 0.04775
GEDF010 0.00 -0.0105 0.042 0.0184 2.40 3.17 3.42 0.02864
0.00 -0.0105 0.042 0.0184 2.38 3.53 3.78 0.04527
0.00 -0.0105 0.042 0.0184 2.26 3.29 3.54 0.04037
0.00 -0.0105 0.042 0.0184 2.27 5.43 5.68 0.13417
0.00 -0.0105 0.042 0.0184 2.15 3.39 3.64 0.04985
0.00 -0.0105 0.042 0.0184 2.13 3.02 3.27 0.03482
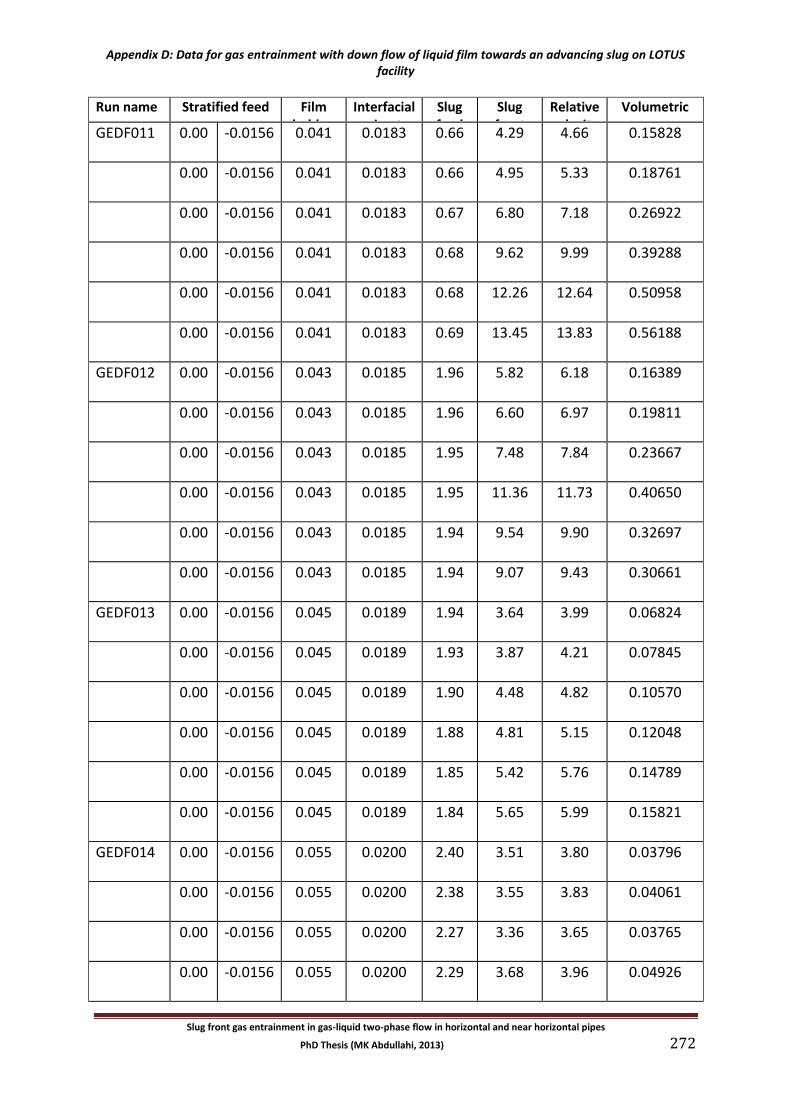
Appendix D: Data for gas entrainment with down flow of liquid film towards an advancing slug on LOTUS facility
Slug front gas entrainment in gas-liquid two-phase flow in horizontal and near horizontal pipes
PhD Thesis (MK Abdullahi, 2013) 272
Run name Stratified feed Film holdup
εLF
Interfacial perimeter
SI
Slug feed ULS
Slug front
velocity uT
Relative velocity
uR
Volumetric gas
entrainment rate
VGE /SI
GEDF011 0.00 -0.0156 0.041 0.0183 0.66 4.29 4.66 0.15828
0.00 -0.0156 0.041 0.0183 0.66 4.95 5.33 0.18761
0.00 -0.0156 0.041 0.0183 0.67 6.80 7.18 0.26922
0.00 -0.0156 0.041 0.0183 0.68 9.62 9.99 0.39288
0.00 -0.0156 0.041 0.0183 0.68 12.26 12.64 0.50958
0.00 -0.0156 0.041 0.0183 0.69 13.45 13.83 0.56188
GEDF012 0.00 -0.0156 0.043 0.0185 1.96 5.82 6.18 0.16389
0.00 -0.0156 0.043 0.0185 1.96 6.60 6.97 0.19811
0.00 -0.0156 0.043 0.0185 1.95 7.48 7.84 0.23667
0.00 -0.0156 0.043 0.0185 1.95 11.36 11.73 0.40650
0.00 -0.0156 0.043 0.0185 1.94 9.54 9.90 0.32697
0.00 -0.0156 0.043 0.0185 1.94 9.07 9.43 0.30661
GEDF013 0.00 -0.0156 0.045 0.0189 1.94 3.64 3.99 0.06824
0.00 -0.0156 0.045 0.0189 1.93 3.87 4.21 0.07845
0.00 -0.0156 0.045 0.0189 1.90 4.48 4.82 0.10570
0.00 -0.0156 0.045 0.0189 1.88 4.81 5.15 0.12048
0.00 -0.0156 0.045 0.0189 1.85 5.42 5.76 0.14789
0.00 -0.0156 0.045 0.0189 1.84 5.65 5.99 0.15821
GEDF014 0.00 -0.0156 0.055 0.0200 2.40 3.51 3.80 0.03796
0.00 -0.0156 0.055 0.0200 2.38 3.55 3.83 0.04061
0.00 -0.0156 0.055 0.0200 2.27 3.36 3.65 0.03765
0.00 -0.0156 0.055 0.0200 2.29 3.68 3.96 0.04926
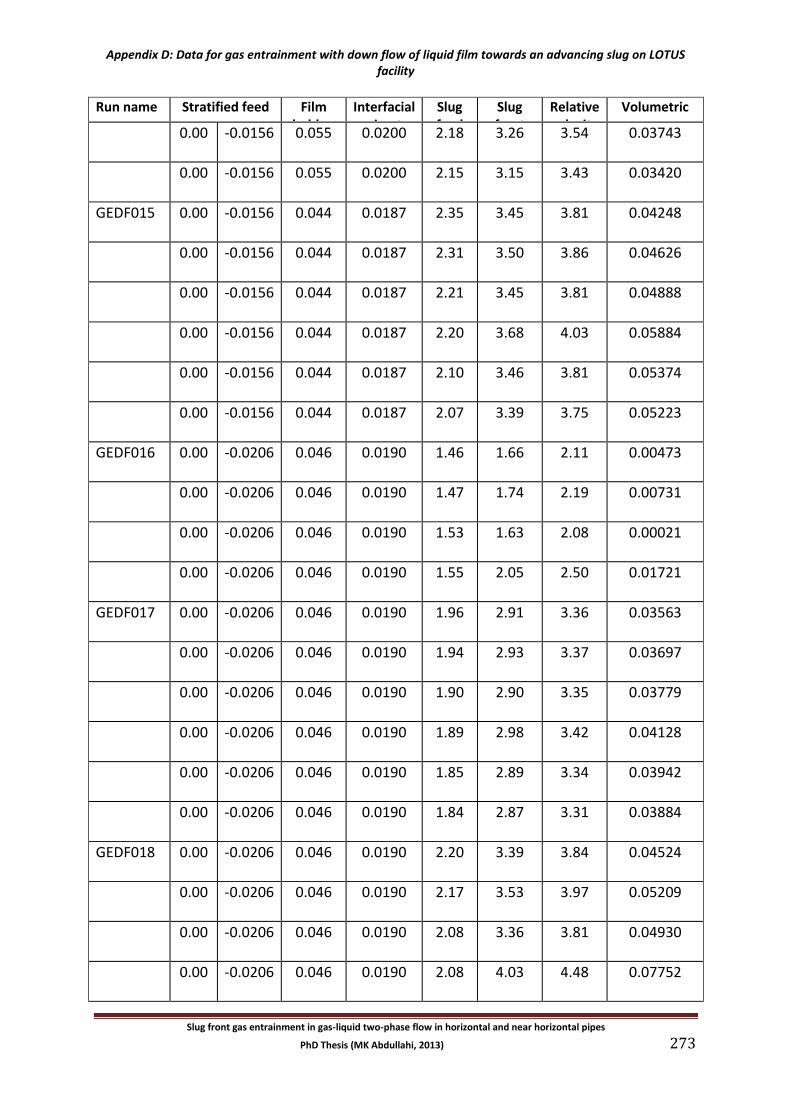
Appendix D: Data for gas entrainment with down flow of liquid film towards an advancing slug on LOTUS facility
Slug front gas entrainment in gas-liquid two-phase flow in horizontal and near horizontal pipes
PhD Thesis (MK Abdullahi, 2013) 273
Run name Stratified feed Film holdup
εLF
Interfacial perimeter
SI
Slug feed ULS
Slug front
velocity uT
Relative velocity
uR
Volumetric gas
entrainment rate
VGE /SI
0.00 -0.0156 0.055 0.0200 2.18 3.26 3.54 0.03743
0.00 -0.0156 0.055 0.0200 2.15 3.15 3.43 0.03420
GEDF015 0.00 -0.0156 0.044 0.0187 2.35 3.45 3.81 0.04248
0.00 -0.0156 0.044 0.0187 2.31 3.50 3.86 0.04626
0.00 -0.0156 0.044 0.0187 2.21 3.45 3.81 0.04888
0.00 -0.0156 0.044 0.0187 2.20 3.68 4.03 0.05884
0.00 -0.0156 0.044 0.0187 2.10 3.46 3.81 0.05374
0.00 -0.0156 0.044 0.0187 2.07 3.39 3.75 0.05223
GEDF016 0.00 -0.0206 0.046 0.0190 1.46 1.66 2.11 0.00473
0.00 -0.0206 0.046 0.0190 1.47 1.74 2.19 0.00731
0.00 -0.0206 0.046 0.0190 1.53 1.63 2.08 0.00021
0.00 -0.0206 0.046 0.0190 1.55 2.05 2.50 0.01721
GEDF017 0.00 -0.0206 0.046 0.0190 1.96 2.91 3.36 0.03563
0.00 -0.0206 0.046 0.0190 1.94 2.93 3.37 0.03697
0.00 -0.0206 0.046 0.0190 1.90 2.90 3.35 0.03779
0.00 -0.0206 0.046 0.0190 1.89 2.98 3.42 0.04128
0.00 -0.0206 0.046 0.0190 1.85 2.89 3.34 0.03942
0.00 -0.0206 0.046 0.0190 1.84 2.87 3.31 0.03884
GEDF018 0.00 -0.0206 0.046 0.0190 2.20 3.39 3.84 0.04524
0.00 -0.0206 0.046 0.0190 2.17 3.53 3.97 0.05209
0.00 -0.0206 0.046 0.0190 2.08 3.36 3.81 0.04930
0.00 -0.0206 0.046 0.0190 2.08 4.03 4.48 0.07752
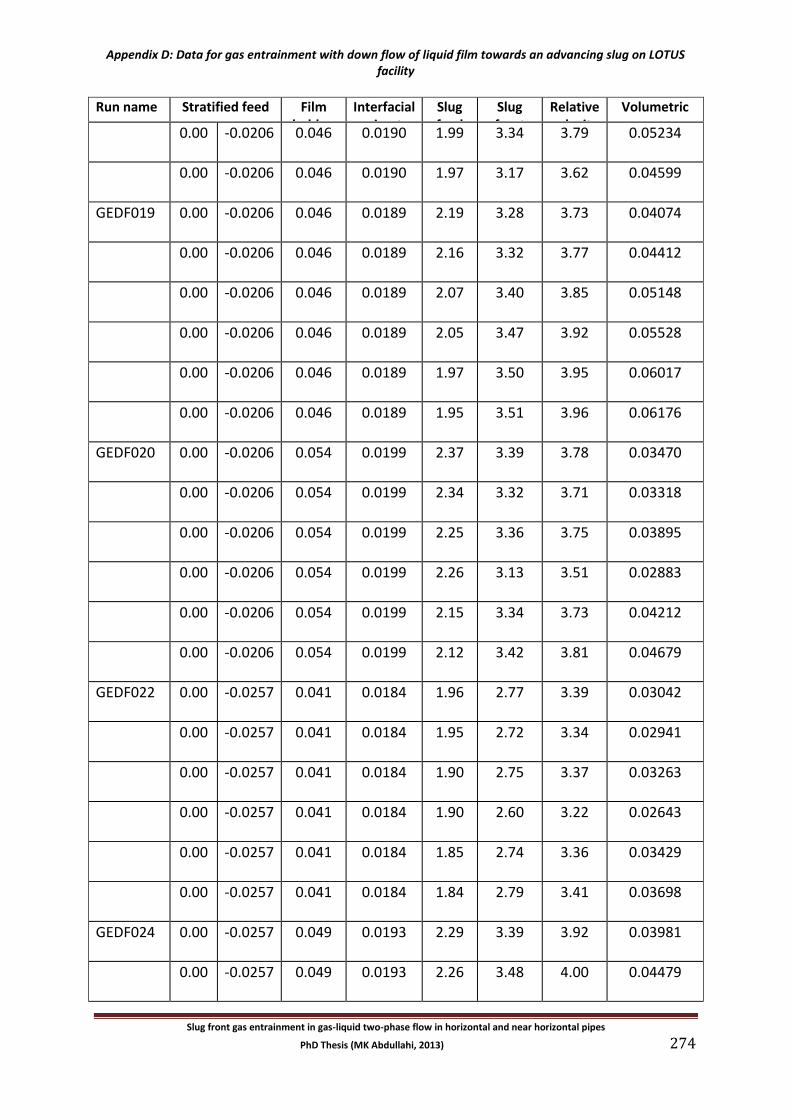
Appendix D: Data for gas entrainment with down flow of liquid film towards an advancing slug on LOTUS facility
Slug front gas entrainment in gas-liquid two-phase flow in horizontal and near horizontal pipes
PhD Thesis (MK Abdullahi, 2013) 274
Run name Stratified feed Film holdup
εLF
Interfacial perimeter
SI
Slug feed ULS
Slug front
velocity uT
Relative velocity
uR
Volumetric gas
entrainment rate
VGE /SI
0.00 -0.0206 0.046 0.0190 1.99 3.34 3.79 0.05234
0.00 -0.0206 0.046 0.0190 1.97 3.17 3.62 0.04599
GEDF019 0.00 -0.0206 0.046 0.0189 2.19 3.28 3.73 0.04074
0.00 -0.0206 0.046 0.0189 2.16 3.32 3.77 0.04412
0.00 -0.0206 0.046 0.0189 2.07 3.40 3.85 0.05148
0.00 -0.0206 0.046 0.0189 2.05 3.47 3.92 0.05528
0.00 -0.0206 0.046 0.0189 1.97 3.50 3.95 0.06017
0.00 -0.0206 0.046 0.0189 1.95 3.51 3.96 0.06176
GEDF020 0.00 -0.0206 0.054 0.0199 2.37 3.39 3.78 0.03470
0.00 -0.0206 0.054 0.0199 2.34 3.32 3.71 0.03318
0.00 -0.0206 0.054 0.0199 2.25 3.36 3.75 0.03895
0.00 -0.0206 0.054 0.0199 2.26 3.13 3.51 0.02883
0.00 -0.0206 0.054 0.0199 2.15 3.34 3.73 0.04212
0.00 -0.0206 0.054 0.0199 2.12 3.42 3.81 0.04679
GEDF022 0.00 -0.0257 0.041 0.0184 1.96 2.77 3.39 0.03042
0.00 -0.0257 0.041 0.0184 1.95 2.72 3.34 0.02941
0.00 -0.0257 0.041 0.0184 1.90 2.75 3.37 0.03263
0.00 -0.0257 0.041 0.0184 1.90 2.60 3.22 0.02643
0.00 -0.0257 0.041 0.0184 1.85 2.74 3.36 0.03429
0.00 -0.0257 0.041 0.0184 1.84 2.79 3.41 0.03698
GEDF024 0.00 -0.0257 0.049 0.0193 2.29 3.39 3.92 0.03981
0.00 -0.0257 0.049 0.0193 2.26 3.48 4.00 0.04479
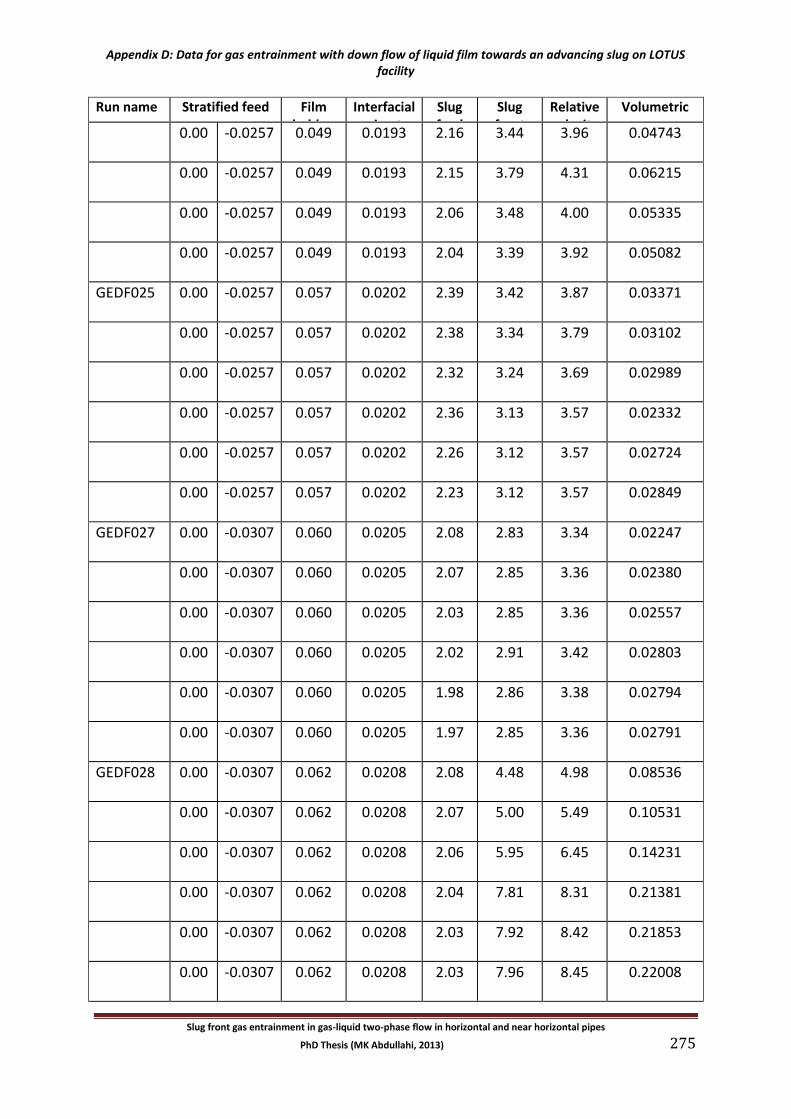
Appendix D: Data for gas entrainment with down flow of liquid film towards an advancing slug on LOTUS facility
Slug front gas entrainment in gas-liquid two-phase flow in horizontal and near horizontal pipes
PhD Thesis (MK Abdullahi, 2013) 275
Run name Stratified feed Film holdup
εLF
Interfacial perimeter
SI
Slug feed ULS
Slug front
velocity uT
Relative velocity
uR
Volumetric gas
entrainment rate
VGE /SI
0.00 -0.0257 0.049 0.0193 2.16 3.44 3.96 0.04743
0.00 -0.0257 0.049 0.0193 2.15 3.79 4.31 0.06215
0.00 -0.0257 0.049 0.0193 2.06 3.48 4.00 0.05335
0.00 -0.0257 0.049 0.0193 2.04 3.39 3.92 0.05082
GEDF025 0.00 -0.0257 0.057 0.0202 2.39 3.42 3.87 0.03371
0.00 -0.0257 0.057 0.0202 2.38 3.34 3.79 0.03102
0.00 -0.0257 0.057 0.0202 2.32 3.24 3.69 0.02989
0.00 -0.0257 0.057 0.0202 2.36 3.13 3.57 0.02332
0.00 -0.0257 0.057 0.0202 2.26 3.12 3.57 0.02724
0.00 -0.0257 0.057 0.0202 2.23 3.12 3.57 0.02849
GEDF027 0.00 -0.0307 0.060 0.0205 2.08 2.83 3.34 0.02247
0.00 -0.0307 0.060 0.0205 2.07 2.85 3.36 0.02380
0.00 -0.0307 0.060 0.0205 2.03 2.85 3.36 0.02557
0.00 -0.0307 0.060 0.0205 2.02 2.91 3.42 0.02803
0.00 -0.0307 0.060 0.0205 1.98 2.86 3.38 0.02794
0.00 -0.0307 0.060 0.0205 1.97 2.85 3.36 0.02791
GEDF028 0.00 -0.0307 0.062 0.0208 2.08 4.48 4.98 0.08536
0.00 -0.0307 0.062 0.0208 2.07 5.00 5.49 0.10531
0.00 -0.0307 0.062 0.0208 2.06 5.95 6.45 0.14231
0.00 -0.0307 0.062 0.0208 2.04 7.81 8.31 0.21381
0.00 -0.0307 0.062 0.0208 2.03 7.92 8.42 0.21853
0.00 -0.0307 0.062 0.0208 2.03 7.96 8.45 0.22008
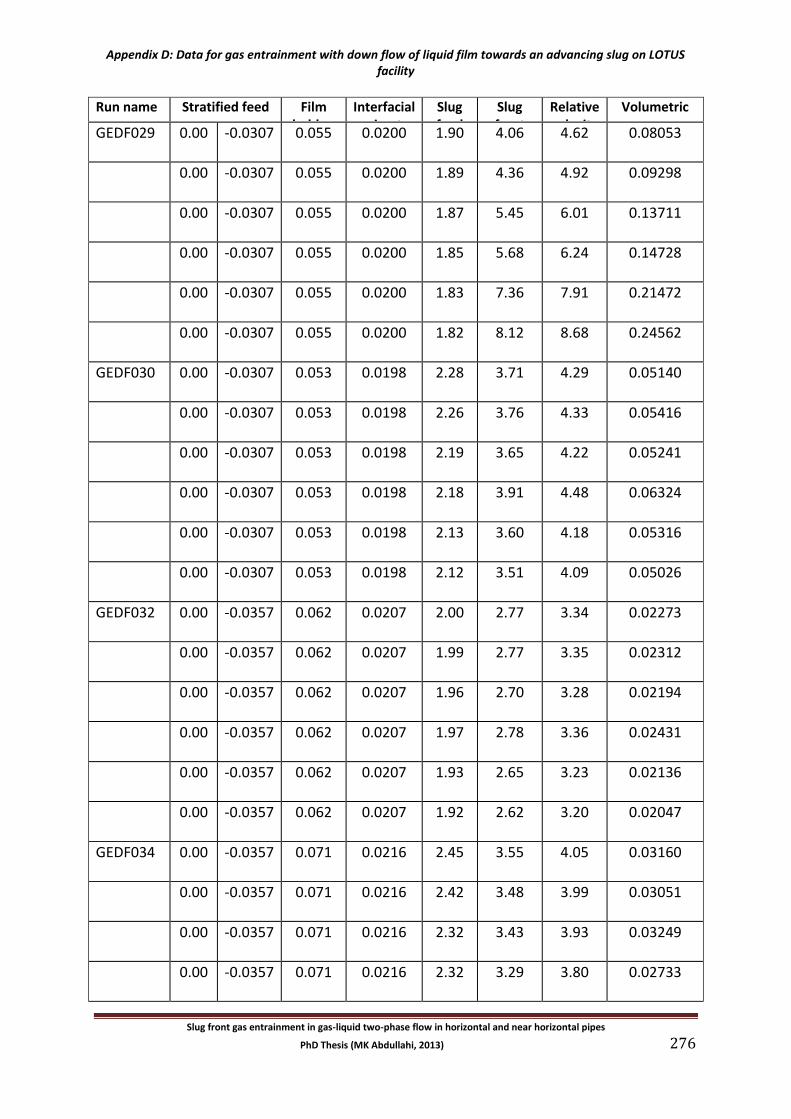
Appendix D: Data for gas entrainment with down flow of liquid film towards an advancing slug on LOTUS facility
Slug front gas entrainment in gas-liquid two-phase flow in horizontal and near horizontal pipes
PhD Thesis (MK Abdullahi, 2013) 276
Run name Stratified feed Film holdup
εLF
Interfacial perimeter
SI
Slug feed ULS
Slug front
velocity uT
Relative velocity
uR
Volumetric gas
entrainment rate
VGE /SI
GEDF029 0.00 -0.0307 0.055 0.0200 1.90 4.06 4.62 0.08053
0.00 -0.0307 0.055 0.0200 1.89 4.36 4.92 0.09298
0.00 -0.0307 0.055 0.0200 1.87 5.45 6.01 0.13711
0.00 -0.0307 0.055 0.0200 1.85 5.68 6.24 0.14728
0.00 -0.0307 0.055 0.0200 1.83 7.36 7.91 0.21472
0.00 -0.0307 0.055 0.0200 1.82 8.12 8.68 0.24562
GEDF030 0.00 -0.0307 0.053 0.0198 2.28 3.71 4.29 0.05140
0.00 -0.0307 0.053 0.0198 2.26 3.76 4.33 0.05416
0.00 -0.0307 0.053 0.0198 2.19 3.65 4.22 0.05241
0.00 -0.0307 0.053 0.0198 2.18 3.91 4.48 0.06324
0.00 -0.0307 0.053 0.0198 2.13 3.60 4.18 0.05316
0.00 -0.0307 0.053 0.0198 2.12 3.51 4.09 0.05026
GEDF032 0.00 -0.0357 0.062 0.0207 2.00 2.77 3.34 0.02273
0.00 -0.0357 0.062 0.0207 1.99 2.77 3.35 0.02312
0.00 -0.0357 0.062 0.0207 1.96 2.70 3.28 0.02194
0.00 -0.0357 0.062 0.0207 1.97 2.78 3.36 0.02431
0.00 -0.0357 0.062 0.0207 1.93 2.65 3.23 0.02136
0.00 -0.0357 0.062 0.0207 1.92 2.62 3.20 0.02047
GEDF034 0.00 -0.0357 0.071 0.0216 2.45 3.55 4.05 0.03160
0.00 -0.0357 0.071 0.0216 2.42 3.48 3.99 0.03051
0.00 -0.0357 0.071 0.0216 2.32 3.43 3.93 0.03249
0.00 -0.0357 0.071 0.0216 2.32 3.29 3.80 0.02733
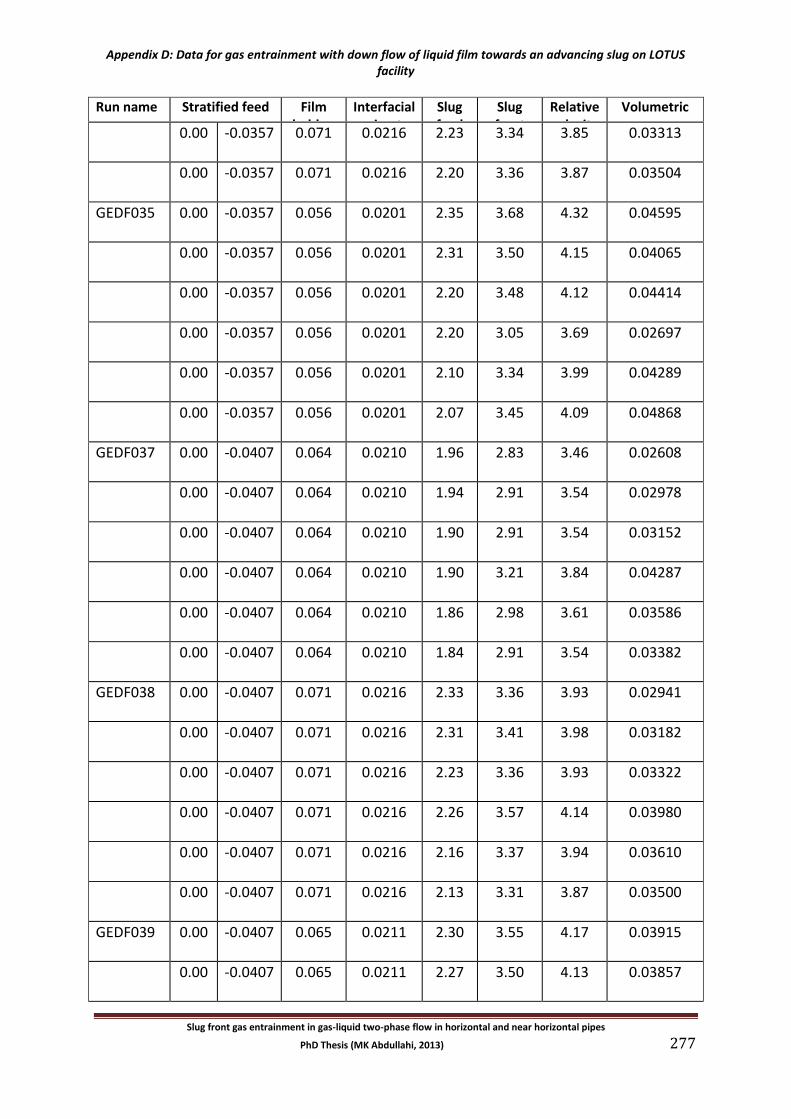
Appendix D: Data for gas entrainment with down flow of liquid film towards an advancing slug on LOTUS facility
Slug front gas entrainment in gas-liquid two-phase flow in horizontal and near horizontal pipes
PhD Thesis (MK Abdullahi, 2013) 277
Run name Stratified feed Film holdup
εLF
Interfacial perimeter
SI
Slug feed ULS
Slug front
velocity uT
Relative velocity
uR
Volumetric gas
entrainment rate
VGE /SI
0.00 -0.0357 0.071 0.0216 2.23 3.34 3.85 0.03313
0.00 -0.0357 0.071 0.0216 2.20 3.36 3.87 0.03504
GEDF035 0.00 -0.0357 0.056 0.0201 2.35 3.68 4.32 0.04595
0.00 -0.0357 0.056 0.0201 2.31 3.50 4.15 0.04065
0.00 -0.0357 0.056 0.0201 2.20 3.48 4.12 0.04414
0.00 -0.0357 0.056 0.0201 2.20 3.05 3.69 0.02697
0.00 -0.0357 0.056 0.0201 2.10 3.34 3.99 0.04289
0.00 -0.0357 0.056 0.0201 2.07 3.45 4.09 0.04868
GEDF037 0.00 -0.0407 0.064 0.0210 1.96 2.83 3.46 0.02608
0.00 -0.0407 0.064 0.0210 1.94 2.91 3.54 0.02978
0.00 -0.0407 0.064 0.0210 1.90 2.91 3.54 0.03152
0.00 -0.0407 0.064 0.0210 1.90 3.21 3.84 0.04287
0.00 -0.0407 0.064 0.0210 1.86 2.98 3.61 0.03586
0.00 -0.0407 0.064 0.0210 1.84 2.91 3.54 0.03382
GEDF038 0.00 -0.0407 0.071 0.0216 2.33 3.36 3.93 0.02941
0.00 -0.0407 0.071 0.0216 2.31 3.41 3.98 0.03182
0.00 -0.0407 0.071 0.0216 2.23 3.36 3.93 0.03322
0.00 -0.0407 0.071 0.0216 2.26 3.57 4.14 0.03980
0.00 -0.0407 0.071 0.0216 2.16 3.37 3.94 0.03610
0.00 -0.0407 0.071 0.0216 2.13 3.31 3.87 0.03500
GEDF039 0.00 -0.0407 0.065 0.0211 2.30 3.55 4.17 0.03915
0.00 -0.0407 0.065 0.0211 2.27 3.50 4.13 0.03857
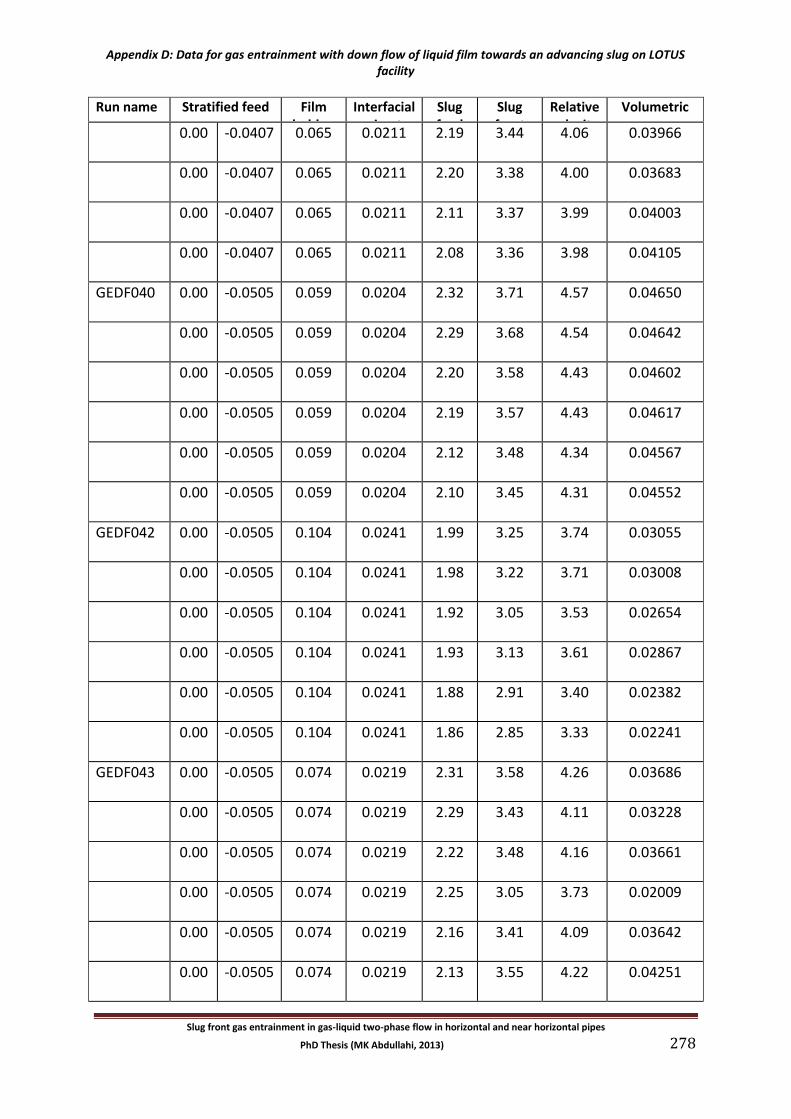
Appendix D: Data for gas entrainment with down flow of liquid film towards an advancing slug on LOTUS facility
Slug front gas entrainment in gas-liquid two-phase flow in horizontal and near horizontal pipes
PhD Thesis (MK Abdullahi, 2013) 278
Run name Stratified feed Film holdup
εLF
Interfacial perimeter
SI
Slug feed ULS
Slug front
velocity uT
Relative velocity
uR
Volumetric gas
entrainment rate
VGE /SI
0.00 -0.0407 0.065 0.0211 2.19 3.44 4.06 0.03966
0.00 -0.0407 0.065 0.0211 2.20 3.38 4.00 0.03683
0.00 -0.0407 0.065 0.0211 2.11 3.37 3.99 0.04003
0.00 -0.0407 0.065 0.0211 2.08 3.36 3.98 0.04105
GEDF040 0.00 -0.0505 0.059 0.0204 2.32 3.71 4.57 0.04650
0.00 -0.0505 0.059 0.0204 2.29 3.68 4.54 0.04642
0.00 -0.0505 0.059 0.0204 2.20 3.58 4.43 0.04602
0.00 -0.0505 0.059 0.0204 2.19 3.57 4.43 0.04617
0.00 -0.0505 0.059 0.0204 2.12 3.48 4.34 0.04567
0.00 -0.0505 0.059 0.0204 2.10 3.45 4.31 0.04552
GEDF042 0.00 -0.0505 0.104 0.0241 1.99 3.25 3.74 0.03055
0.00 -0.0505 0.104 0.0241 1.98 3.22 3.71 0.03008
0.00 -0.0505 0.104 0.0241 1.92 3.05 3.53 0.02654
0.00 -0.0505 0.104 0.0241 1.93 3.13 3.61 0.02867
0.00 -0.0505 0.104 0.0241 1.88 2.91 3.40 0.02382
0.00 -0.0505 0.104 0.0241 1.86 2.85 3.33 0.02241
GEDF043 0.00 -0.0505 0.074 0.0219 2.31 3.58 4.26 0.03686
0.00 -0.0505 0.074 0.0219 2.29 3.43 4.11 0.03228
0.00 -0.0505 0.074 0.0219 2.22 3.48 4.16 0.03661
0.00 -0.0505 0.074 0.0219 2.25 3.05 3.73 0.02009
0.00 -0.0505 0.074 0.0219 2.16 3.41 4.09 0.03642
0.00 -0.0505 0.074 0.0219 2.13 3.55 4.22 0.04251
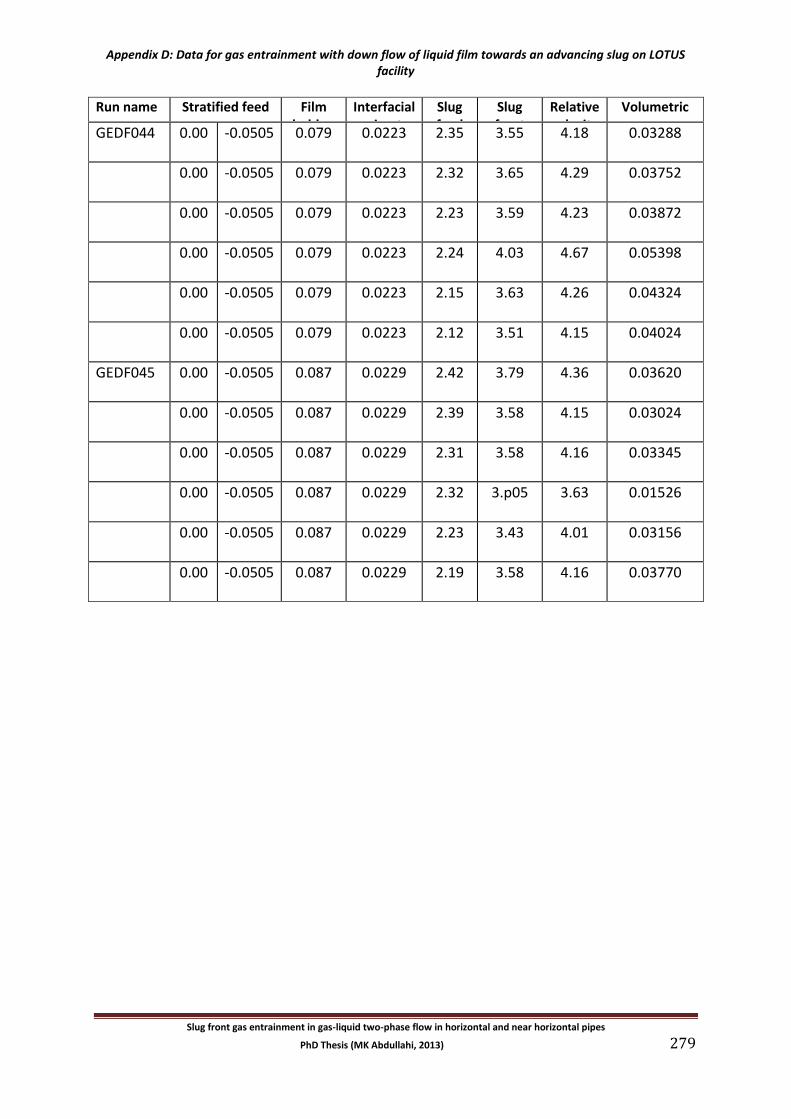
Appendix D: Data for gas entrainment with down flow of liquid film towards an advancing slug on LOTUS facility
Slug front gas entrainment in gas-liquid two-phase flow in horizontal and near horizontal pipes
PhD Thesis (MK Abdullahi, 2013) 279
Run name Stratified feed Film holdup
εLF
Interfacial perimeter
SI
Slug feed ULS
Slug front
velocity uT
Relative velocity
uR
Volumetric gas
entrainment rate
VGE /SI
GEDF044 0.00 -0.0505 0.079 0.0223 2.35 3.55 4.18 0.03288
0.00 -0.0505 0.079 0.0223 2.32 3.65 4.29 0.03752
0.00 -0.0505 0.079 0.0223 2.23 3.59 4.23 0.03872
0.00 -0.0505 0.079 0.0223 2.24 4.03 4.67 0.05398
0.00 -0.0505 0.079 0.0223 2.15 3.63 4.26 0.04324
0.00 -0.0505 0.079 0.0223 2.12 3.51 4.15 0.04024
GEDF045 0.00 -0.0505 0.087 0.0229 2.42 3.79 4.36 0.03620
0.00 -0.0505 0.087 0.0229 2.39 3.58 4.15 0.03024
0.00 -0.0505 0.087 0.0229 2.31 3.58 4.16 0.03345
0.00 -0.0505 0.087 0.0229 2.32 3.p05 3.63 0.01526
0.00 -0.0505 0.087 0.0229 2.23 3.43 4.01 0.03156
0.00 -0.0505 0.087 0.0229 2.19 3.58 4.16 0.03770
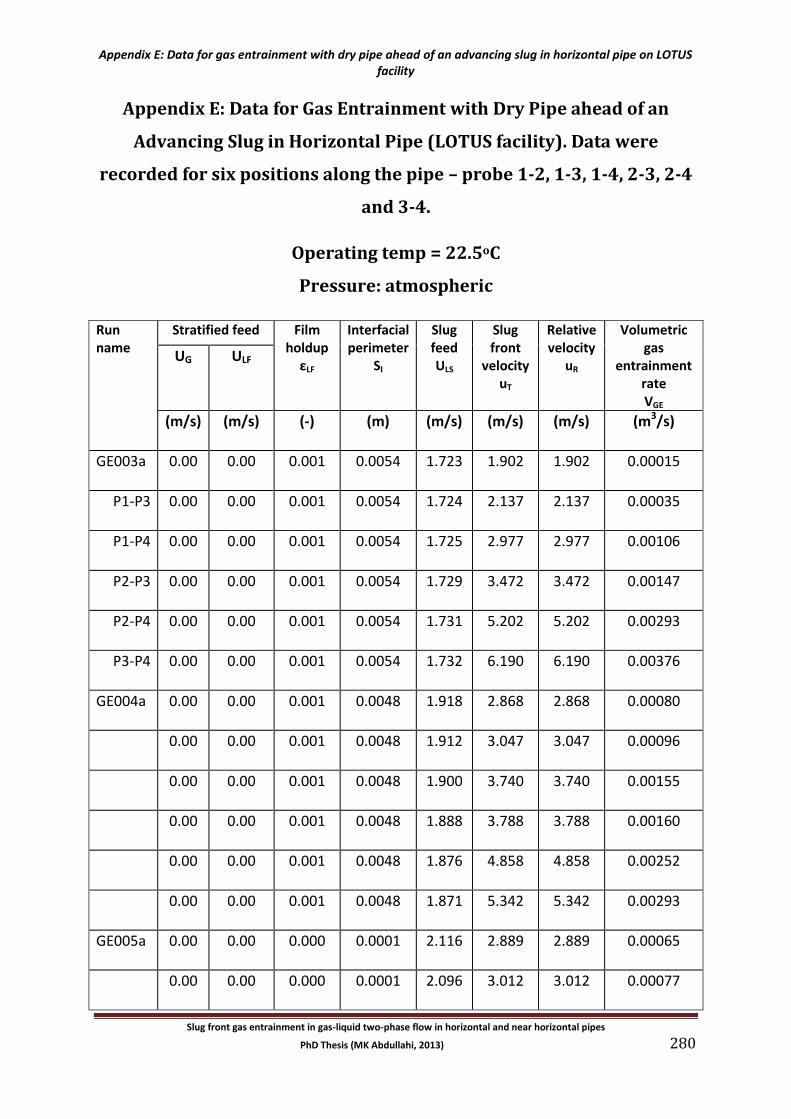
Appendix E: Data for gas entrainment with dry pipe ahead of an advancing slug in horizontal pipe on LOTUS facility
Slug front gas entrainment in gas-liquid two-phase flow in horizontal and near horizontal pipes
PhD Thesis (MK Abdullahi, 2013) 280
Appendix E: Data for Gas Entrainment with Dry Pipe ahead of an
Advancing Slug in Horizontal Pipe (LOTUS facility). Data were
recorded for six positions along the pipe – probe 1-2, 1-3, 1-4, 2-3, 2-4
and 3-4.
Operating temp = 22.5oC
Pressure: atmospheric
Run name
Stratified feed Film holdup
εLF
Interfacial perimeter
SI
Slug feed ULS
Slug front
velocity uT
Relative velocity
uR
Volumetric gas
entrainment rate VGE
UG ULF
(m/s) (m/s) (-) (m) (m/s) (m/s) (m/s) (m3/s)
GE003a 0.00 0.00 0.001 0.0054 1.723 1.902 1.902 0.00015
P1-P3 0.00 0.00 0.001 0.0054 1.724 2.137 2.137 0.00035
P1-P4 0.00 0.00 0.001 0.0054 1.725 2.977 2.977 0.00106
P2-P3 0.00 0.00 0.001 0.0054 1.729 3.472 3.472 0.00147
P2-P4 0.00 0.00 0.001 0.0054 1.731 5.202 5.202 0.00293
P3-P4 0.00 0.00 0.001 0.0054 1.732 6.190 6.190 0.00376
GE004a 0.00 0.00 0.001 0.0048 1.918 2.868 2.868 0.00080
0.00 0.00 0.001 0.0048 1.912 3.047 3.047 0.00096
0.00 0.00 0.001 0.0048 1.900 3.740 3.740 0.00155
0.00 0.00 0.001 0.0048 1.888 3.788 3.788 0.00160
0.00 0.00 0.001 0.0048 1.876 4.858 4.858 0.00252
0.00 0.00 0.001 0.0048 1.871 5.342 5.342 0.00293
GE005a 0.00 0.00 0.000 0.0001 2.116 2.889 2.889 0.00065
0.00 0.00 0.000 0.0001 2.096 3.012 3.012 0.00077
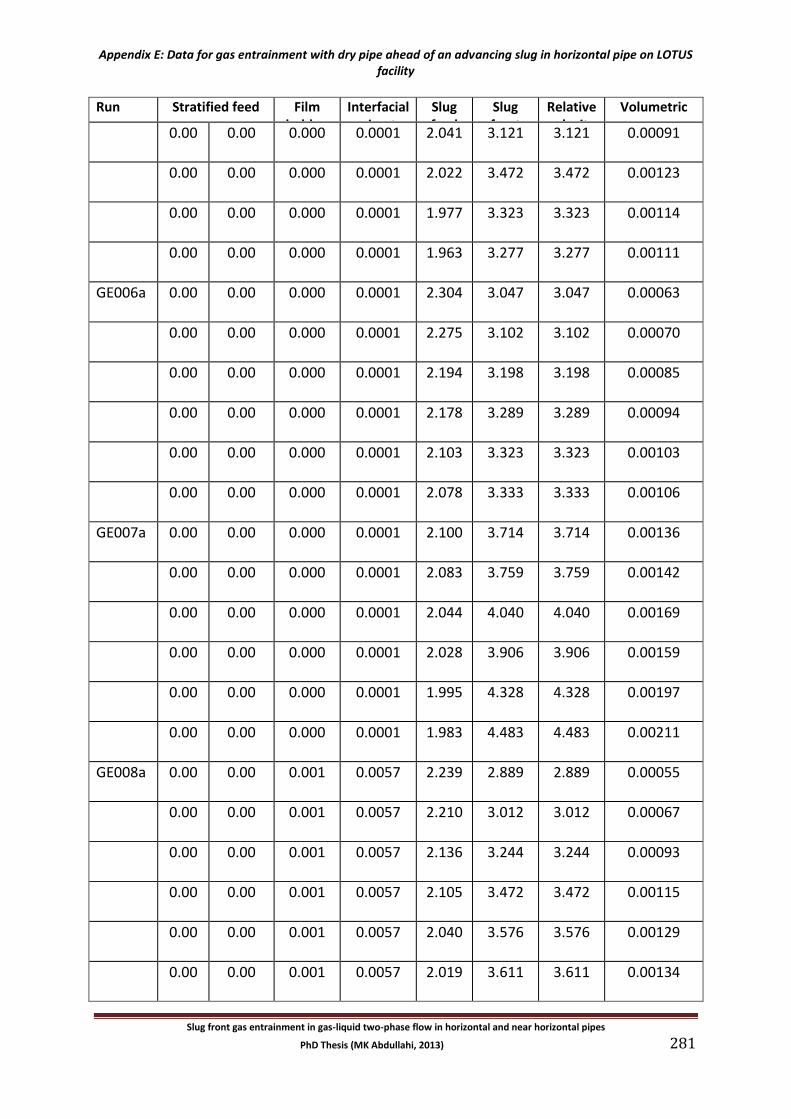
Appendix E: Data for gas entrainment with dry pipe ahead of an advancing slug in horizontal pipe on LOTUS facility
Slug front gas entrainment in gas-liquid two-phase flow in horizontal and near horizontal pipes
PhD Thesis (MK Abdullahi, 2013) 281
Run name
Stratified feed Film holdup
εLF
Interfacial perimeter
SI
Slug feed ULS
Slug front
velocity uT
Relative velocity
uR
Volumetric gas
entrainment rate VGE
0.00 0.00 0.000 0.0001 2.041 3.121 3.121 0.00091
0.00 0.00 0.000 0.0001 2.022 3.472 3.472 0.00123
0.00 0.00 0.000 0.0001 1.977 3.323 3.323 0.00114
0.00 0.00 0.000 0.0001 1.963 3.277 3.277 0.00111
GE006a 0.00 0.00 0.000 0.0001 2.304 3.047 3.047 0.00063
0.00 0.00 0.000 0.0001 2.275 3.102 3.102 0.00070
0.00 0.00 0.000 0.0001 2.194 3.198 3.198 0.00085
0.00 0.00 0.000 0.0001 2.178 3.289 3.289 0.00094
0.00 0.00 0.000 0.0001 2.103 3.323 3.323 0.00103
0.00 0.00 0.000 0.0001 2.078 3.333 3.333 0.00106
GE007a 0.00 0.00 0.000 0.0001 2.100 3.714 3.714 0.00136
0.00 0.00 0.000 0.0001 2.083 3.759 3.759 0.00142
0.00 0.00 0.000 0.0001 2.044 4.040 4.040 0.00169
0.00 0.00 0.000 0.0001 2.028 3.906 3.906 0.00159
0.00 0.00 0.000 0.0001 1.995 4.328 4.328 0.00197
0.00 0.00 0.000 0.0001 1.983 4.483 4.483 0.00211
GE008a 0.00 0.00 0.001 0.0057 2.239 2.889 2.889 0.00055
0.00 0.00 0.001 0.0057 2.210 3.012 3.012 0.00067
0.00 0.00 0.001 0.0057 2.136 3.244 3.244 0.00093
0.00 0.00 0.001 0.0057 2.105 3.472 3.472 0.00115
0.00 0.00 0.001 0.0057 2.040 3.576 3.576 0.00129
0.00 0.00 0.001 0.0057 2.019 3.611 3.611 0.00134
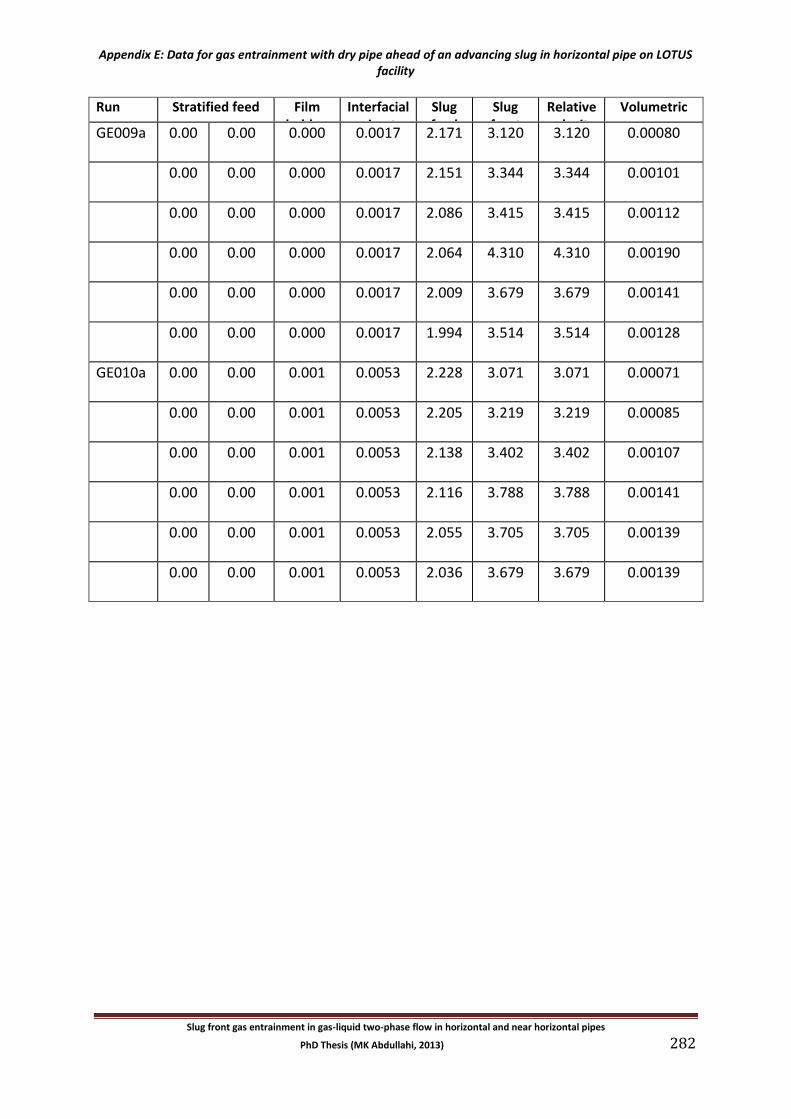
Appendix E: Data for gas entrainment with dry pipe ahead of an advancing slug in horizontal pipe on LOTUS facility
Slug front gas entrainment in gas-liquid two-phase flow in horizontal and near horizontal pipes
PhD Thesis (MK Abdullahi, 2013) 282
Run name
Stratified feed Film holdup
εLF
Interfacial perimeter
SI
Slug feed ULS
Slug front
velocity uT
Relative velocity
uR
Volumetric gas
entrainment rate VGE
GE009a 0.00 0.00 0.000 0.0017 2.171 3.120 3.120 0.00080
0.00 0.00 0.000 0.0017 2.151 3.344 3.344 0.00101
0.00 0.00 0.000 0.0017 2.086 3.415 3.415 0.00112
0.00 0.00 0.000 0.0017 2.064 4.310 4.310 0.00190
0.00 0.00 0.000 0.0017 2.009 3.679 3.679 0.00141
0.00 0.00 0.000 0.0017 1.994 3.514 3.514 0.00128
GE010a 0.00 0.00 0.001 0.0053 2.228 3.071 3.071 0.00071
0.00 0.00 0.001 0.0053 2.205 3.219 3.219 0.00085
0.00 0.00 0.001 0.0053 2.138 3.402 3.402 0.00107
0.00 0.00 0.001 0.0053 2.116 3.788 3.788 0.00141
0.00 0.00 0.001 0.0053 2.055 3.705 3.705 0.00139
0.00 0.00 0.001 0.0053 2.036 3.679 3.679 0.00139
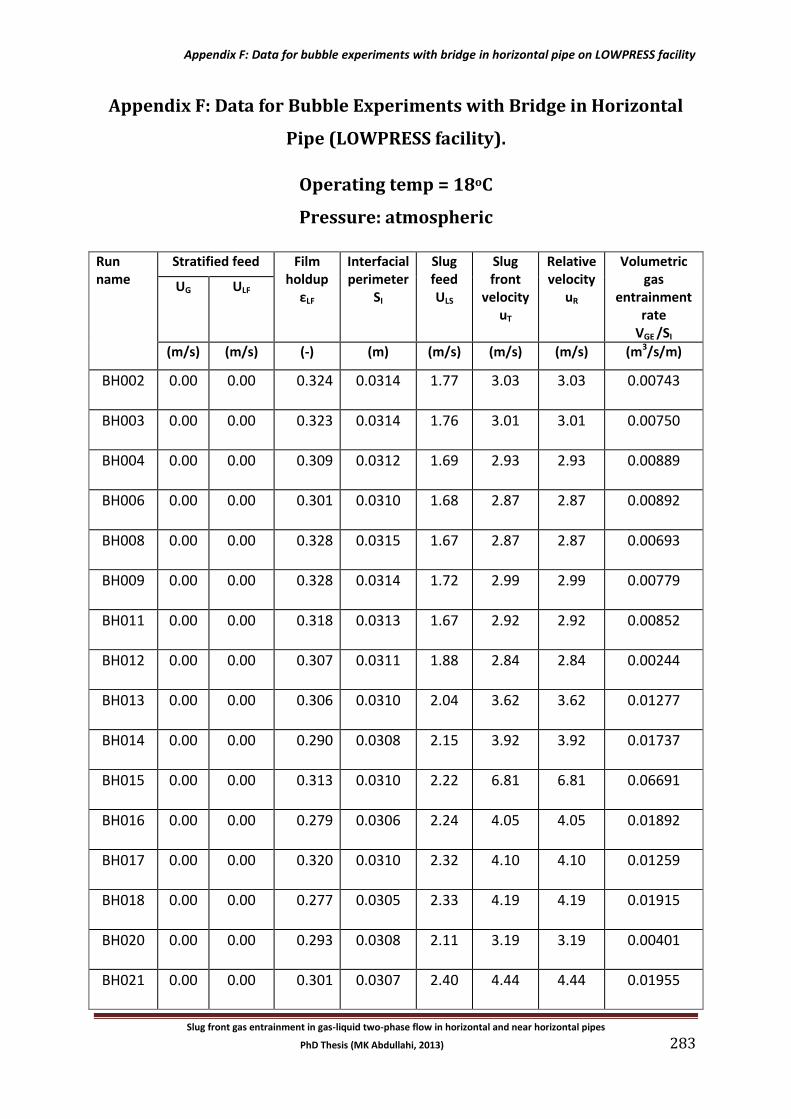
Appendix F: Data for bubble experiments with bridge in horizontal pipe on LOWPRESS facility
Slug front gas entrainment in gas-liquid two-phase flow in horizontal and near horizontal pipes
PhD Thesis (MK Abdullahi, 2013) 283
Appendix F: Data for Bubble Experiments with Bridge in Horizontal
Pipe (LOWPRESS facility).
Operating temp = 18oC
Pressure: atmospheric
Run name
Stratified feed Film holdup
εLF
Interfacial perimeter
SI
Slug feed ULS
Slug front
velocity uT
Relative velocity
uR
Volumetric gas
entrainment rate
VGE /SI
UG ULF
(m/s) (m/s) (-) (m) (m/s) (m/s) (m/s) (m3/s/m)
BH002 0.00 0.00 0.324 0.0314 1.77 3.03 3.03 0.00743
BH003 0.00 0.00 0.323 0.0314 1.76 3.01 3.01 0.00750
BH004 0.00 0.00 0.309 0.0312 1.69 2.93 2.93 0.00889
BH006 0.00 0.00 0.301 0.0310 1.68 2.87 2.87 0.00892
BH008 0.00 0.00 0.328 0.0315 1.67 2.87 2.87 0.00693
BH009 0.00 0.00 0.328 0.0314 1.72 2.99 2.99 0.00779
BH011 0.00 0.00 0.318 0.0313 1.67 2.92 2.92 0.00852
BH012 0.00 0.00 0.307 0.0311 1.88 2.84 2.84 0.00244
BH013 0.00 0.00 0.306 0.0310 2.04 3.62 3.62 0.01277
BH014 0.00 0.00 0.290 0.0308 2.15 3.92 3.92 0.01737
BH015 0.00 0.00 0.313 0.0310 2.22 6.81 6.81 0.06691
BH016 0.00 0.00 0.279 0.0306 2.24 4.05 4.05 0.01892
BH017 0.00 0.00 0.320 0.0310 2.32 4.10 4.10 0.01259
BH018 0.00 0.00 0.277 0.0305 2.33 4.19 4.19 0.01915
BH020 0.00 0.00 0.293 0.0308 2.11 3.19 3.19 0.00401
BH021 0.00 0.00 0.301 0.0307 2.40 4.44 4.44 0.01955
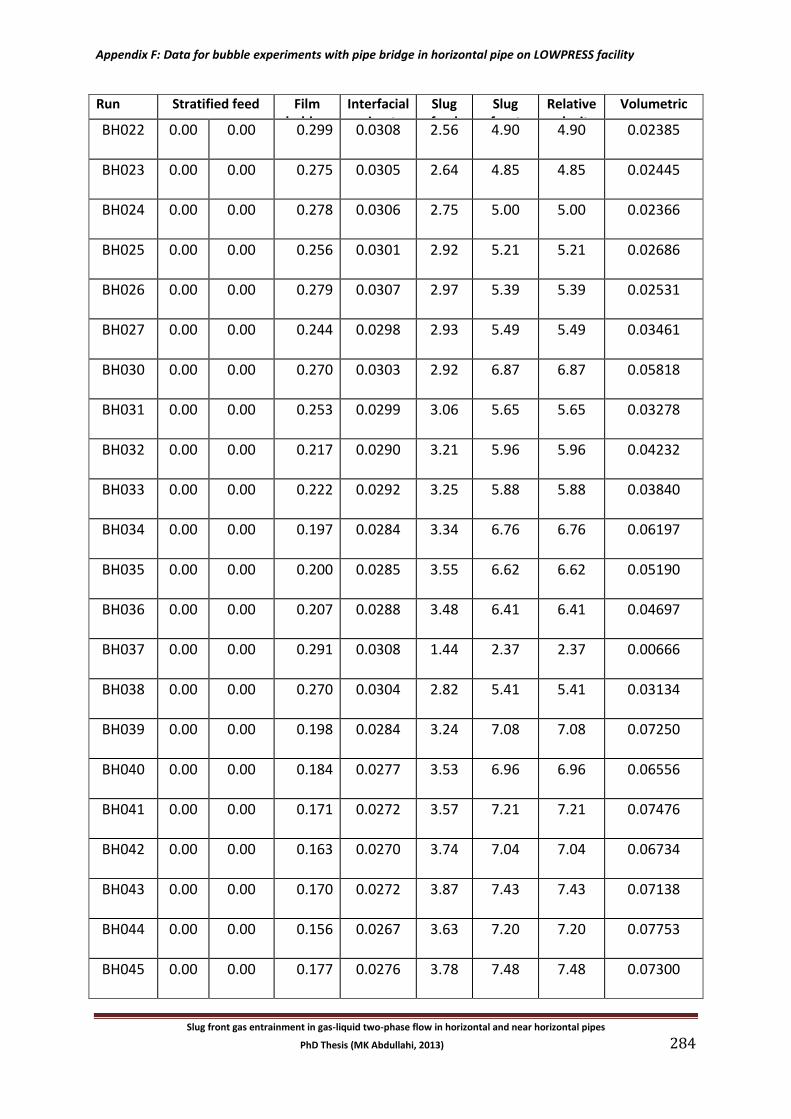
Appendix F: Data for bubble experiments with pipe bridge in horizontal pipe on LOWPRESS facility
Slug front gas entrainment in gas-liquid two-phase flow in horizontal and near horizontal pipes
PhD Thesis (MK Abdullahi, 2013) 284
Run name
Stratified feed Film holdup
εLF
Interfacial perimeter
SI
Slug feed ULS
Slug front
velocity uT
Relative velocity
uR
Volumetric gas
entrainment rate
VGE /SI
BH022 0.00 0.00 0.299 0.0308 2.56 4.90 4.90 0.02385
BH023 0.00 0.00 0.275 0.0305 2.64 4.85 4.85 0.02445
BH024 0.00 0.00 0.278 0.0306 2.75 5.00 5.00 0.02366
BH025 0.00 0.00 0.256 0.0301 2.92 5.21 5.21 0.02686
BH026 0.00 0.00 0.279 0.0307 2.97 5.39 5.39 0.02531
BH027 0.00 0.00 0.244 0.0298 2.93 5.49 5.49 0.03461
BH030 0.00 0.00 0.270 0.0303 2.92 6.87 6.87 0.05818
BH031 0.00 0.00 0.253 0.0299 3.06 5.65 5.65 0.03278
BH032 0.00 0.00 0.217 0.0290 3.21 5.96 5.96 0.04232
BH033 0.00 0.00 0.222 0.0292 3.25 5.88 5.88 0.03840
BH034 0.00 0.00 0.197 0.0284 3.34 6.76 6.76 0.06197
BH035 0.00 0.00 0.200 0.0285 3.55 6.62 6.62 0.05190
BH036 0.00 0.00 0.207 0.0288 3.48 6.41 6.41 0.04697
BH037 0.00 0.00 0.291 0.0308 1.44 2.37 2.37 0.00666
BH038 0.00 0.00 0.270 0.0304 2.82 5.41 5.41 0.03134
BH039 0.00 0.00 0.198 0.0284 3.24 7.08 7.08 0.07250
BH040 0.00 0.00 0.184 0.0277 3.53 6.96 6.96 0.06556
BH041 0.00 0.00 0.171 0.0272 3.57 7.21 7.21 0.07476
BH042 0.00 0.00 0.163 0.0270 3.74 7.04 7.04 0.06734
BH043 0.00 0.00 0.170 0.0272 3.87 7.43 7.43 0.07138
BH044 0.00 0.00 0.156 0.0267 3.63 7.20 7.20 0.07753
BH045 0.00 0.00 0.177 0.0276 3.78 7.48 7.48 0.07300
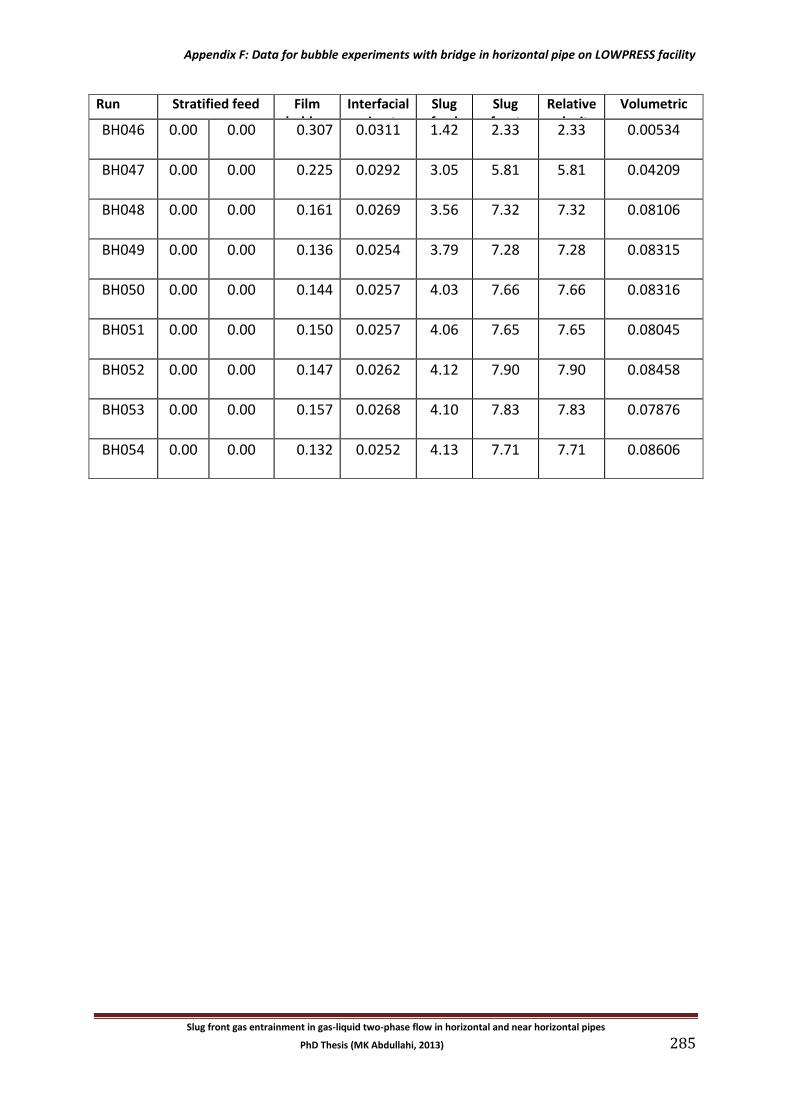
Appendix F: Data for bubble experiments with bridge in horizontal pipe on LOWPRESS facility
Slug front gas entrainment in gas-liquid two-phase flow in horizontal and near horizontal pipes
PhD Thesis (MK Abdullahi, 2013) 285
Run name
Stratified feed Film holdup
εLF
Interfacial perimeter
SI
Slug feed ULS
Slug front
velocity uT
Relative velocity
uR
Volumetric gas
entrainment rate
VGE /SI
BH046 0.00 0.00 0.307 0.0311 1.42 2.33 2.33 0.00534
BH047 0.00 0.00 0.225 0.0292 3.05 5.81 5.81 0.04209
BH048 0.00 0.00 0.161 0.0269 3.56 7.32 7.32 0.08106
BH049 0.00 0.00 0.136 0.0254 3.79 7.28 7.28 0.08315
BH050 0.00 0.00 0.144 0.0257 4.03 7.66 7.66 0.08316
BH051 0.00 0.00 0.150 0.0257 4.06 7.65 7.65 0.08045
BH052 0.00 0.00 0.147 0.0262 4.12 7.90 7.90 0.08458
BH053 0.00 0.00 0.157 0.0268 4.10 7.83 7.83 0.07876
BH054 0.00 0.00 0.132 0.0252 4.13 7.71 7.71 0.08606
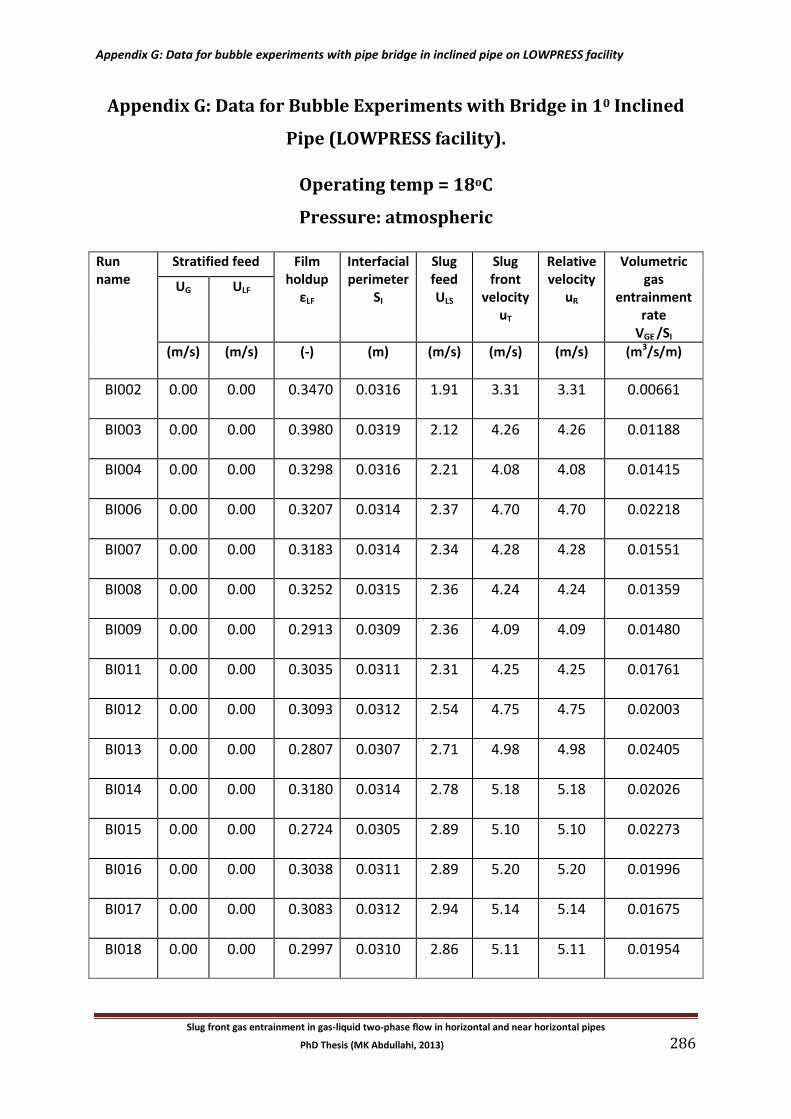
Appendix G: Data for bubble experiments with pipe bridge in inclined pipe on LOWPRESS facility
Slug front gas entrainment in gas-liquid two-phase flow in horizontal and near horizontal pipes
PhD Thesis (MK Abdullahi, 2013) 286
Appendix G: Data for Bubble Experiments with Bridge in 10 Inclined
Pipe (LOWPRESS facility).
Operating temp = 18oC
Pressure: atmospheric
Run name
Stratified feed Film holdup
εLF
Interfacial perimeter
SI
Slug feed ULS
Slug front
velocity uT
Relative velocity
uR
Volumetric gas
entrainment rate
VGE /SI
UG ULF
(m/s) (m/s) (-) (m) (m/s) (m/s) (m/s) (m3/s/m)
BI002 0.00 0.00 0.3470 0.0316 1.91 3.31 3.31 0.00661
BI003 0.00 0.00 0.3980 0.0319 2.12 4.26 4.26 0.01188
BI004 0.00 0.00 0.3298 0.0316 2.21 4.08 4.08 0.01415
BI006 0.00 0.00 0.3207 0.0314 2.37 4.70 4.70 0.02218
BI007 0.00 0.00 0.3183 0.0314 2.34 4.28 4.28 0.01551
BI008 0.00 0.00 0.3252 0.0315 2.36 4.24 4.24 0.01359
BI009 0.00 0.00 0.2913 0.0309 2.36 4.09 4.09 0.01480
BI011 0.00 0.00 0.3035 0.0311 2.31 4.25 4.25 0.01761
BI012 0.00 0.00 0.3093 0.0312 2.54 4.75 4.75 0.02003
BI013 0.00 0.00 0.2807 0.0307 2.71 4.98 4.98 0.02405
BI014 0.00 0.00 0.3180 0.0314 2.78 5.18 5.18 0.02026
BI015 0.00 0.00 0.2724 0.0305 2.89 5.10 5.10 0.02273
BI016 0.00 0.00 0.3038 0.0311 2.89 5.20 5.20 0.01996
BI017 0.00 0.00 0.3083 0.0312 2.94 5.14 5.14 0.01675
BI018 0.00 0.00 0.2997 0.0310 2.86 5.11 5.11 0.01954
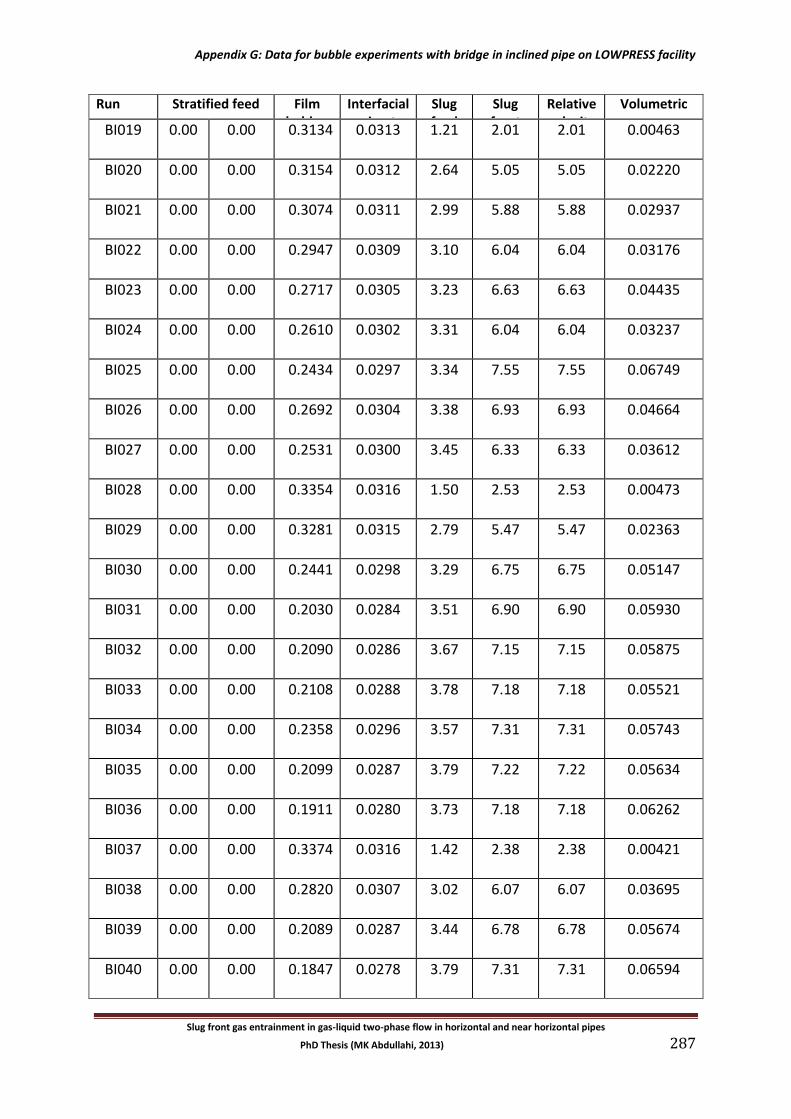
Appendix G: Data for bubble experiments with bridge in inclined pipe on LOWPRESS facility
Slug front gas entrainment in gas-liquid two-phase flow in horizontal and near horizontal pipes
PhD Thesis (MK Abdullahi, 2013) 287
Run name
Stratified feed Film holdup
εLF
Interfacial perimeter
SI
Slug feed ULS
Slug front
velocity uT
Relative velocity
uR
Volumetric gas
entrainment rate
VGE /SI
BI019 0.00 0.00 0.3134 0.0313 1.21 2.01 2.01 0.00463
BI020 0.00 0.00 0.3154 0.0312 2.64 5.05 5.05 0.02220
BI021 0.00 0.00 0.3074 0.0311 2.99 5.88 5.88 0.02937
BI022 0.00 0.00 0.2947 0.0309 3.10 6.04 6.04 0.03176
BI023 0.00 0.00 0.2717 0.0305 3.23 6.63 6.63 0.04435
BI024 0.00 0.00 0.2610 0.0302 3.31 6.04 6.04 0.03237
BI025 0.00 0.00 0.2434 0.0297 3.34 7.55 7.55 0.06749
BI026 0.00 0.00 0.2692 0.0304 3.38 6.93 6.93 0.04664
BI027 0.00 0.00 0.2531 0.0300 3.45 6.33 6.33 0.03612
BI028 0.00 0.00 0.3354 0.0316 1.50 2.53 2.53 0.00473
BI029 0.00 0.00 0.3281 0.0315 2.79 5.47 5.47 0.02363
BI030 0.00 0.00 0.2441 0.0298 3.29 6.75 6.75 0.05147
BI031 0.00 0.00 0.2030 0.0284 3.51 6.90 6.90 0.05930
BI032 0.00 0.00 0.2090 0.0286 3.67 7.15 7.15 0.05875
BI033 0.00 0.00 0.2108 0.0288 3.78 7.18 7.18 0.05521
BI034 0.00 0.00 0.2358 0.0296 3.57 7.31 7.31 0.05743
BI035 0.00 0.00 0.2099 0.0287 3.79 7.22 7.22 0.05634
BI036 0.00 0.00 0.1911 0.0280 3.73 7.18 7.18 0.06262
BI037 0.00 0.00 0.3374 0.0316 1.42 2.38 2.38 0.00421
BI038 0.00 0.00 0.2820 0.0307 3.02 6.07 6.07 0.03695
BI039 0.00 0.00 0.2089 0.0287 3.44 6.78 6.78 0.05674
BI040 0.00 0.00 0.1847 0.0278 3.79 7.31 7.31 0.06594
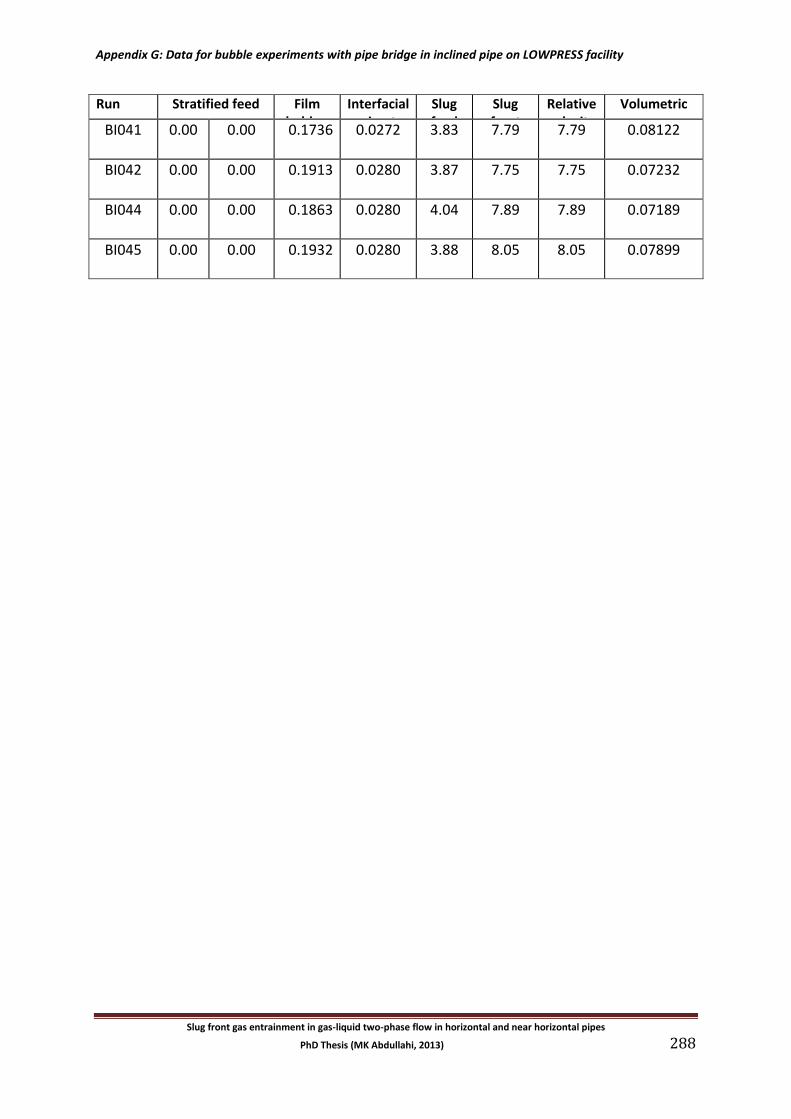
Appendix G: Data for bubble experiments with pipe bridge in inclined pipe on LOWPRESS facility
Slug front gas entrainment in gas-liquid two-phase flow in horizontal and near horizontal pipes
PhD Thesis (MK Abdullahi, 2013) 288
Run name
Stratified feed Film holdup
εLF
Interfacial perimeter
SI
Slug feed ULS
Slug front
velocity uT
Relative velocity
uR
Volumetric gas
entrainment rate
VGE /SI
BI041 0.00 0.00 0.1736 0.0272 3.83 7.79 7.79 0.08122
BI042 0.00 0.00 0.1913 0.0280 3.87 7.75 7.75 0.07232
BI044 0.00 0.00 0.1863 0.0280 4.04 7.89 7.89 0.07189
BI045 0.00 0.00 0.1932 0.0280 3.88 8.05 8.05 0.07899