Embed Size (px)
Citation preview
April 2017
SK telecomInvestor Presentation
November 2017
10 CONSECUTIVE MEMBER OF
Disclaimer
This presentation contains forward-looking statements with respect to the financial condition, results of operations
and business of SK Telecom and its subsidiaries (the “Company”) and plans and objectives of the management of
the Company. The aforementioned forward-looking statements are influenced by unknown risks, uncertainties and
other factors which may change the actual results or performance of the Company.
The Company does not make any representation or warranty, expressed or implied, as to the accuracy or
completeness of the information contained in this management presentation, and nothing contained herein is, or
shall be relied upon as, a promise or representation, whether as to the past or the future.
Therefore, this presentation contained herein should not be utilized for any legal purposes in regards to investors’
investment results. The Company hereby expressly disclaims any and all liability for any loss or damage resulting
from the investors’ reliance on the information contained herein.
This presentation only speaks the informations as of the date they are made, and the Company undertakes no
obligation to update publicly any of them in light of new information or future events.
Ⅰ. Key Takeaways
Ⅱ. Financial Results
Ⅲ. Appendix
3
12
17
Table of Contents
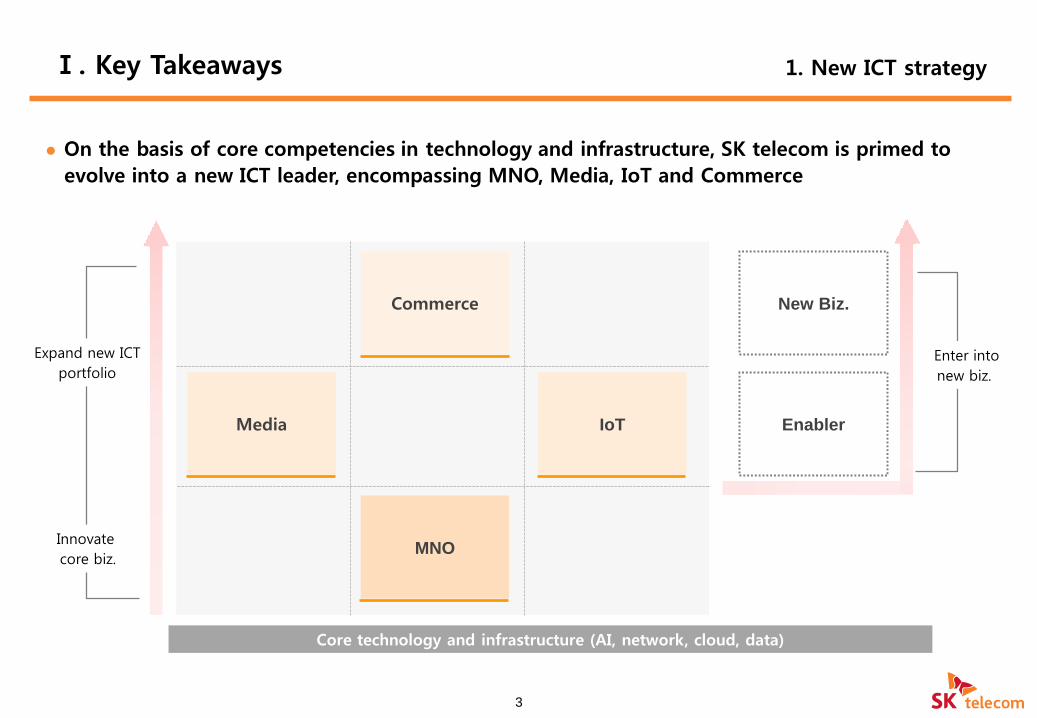
On the basis of core competencies in technology and infrastructure, SK telecom is primed to
evolve into a new ICT leader, encompassing MNO, Media, IoT and Commerce
3
Ⅰ. Key Takeaways 1. New ICT strategy
Core technology and infrastructure (AI, network, cloud, data)
Commerce
Media IoT
MNO
Enabler
New Biz.
Innovate
core biz.
Expand new ICT
portfolioEnter into
new biz.
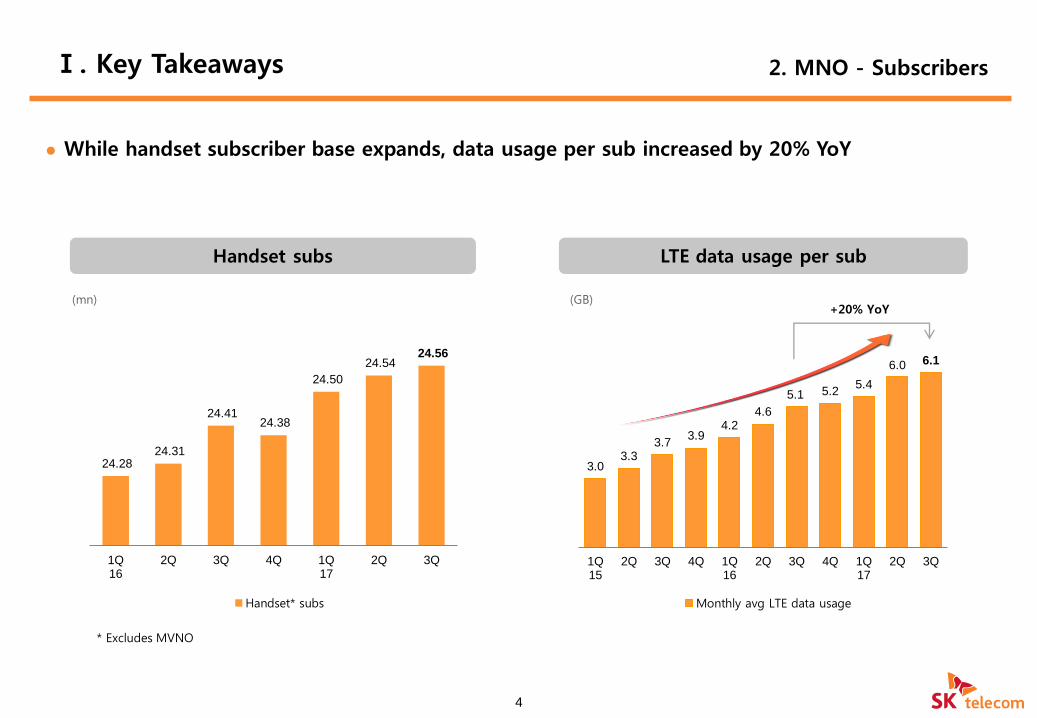
3.0 3.3
3.7 3.9
4.2 4.6
5.1 5.2 5.4
6.0 6.1
1Q15
2Q 3Q 4Q 1Q16
2Q 3Q 4Q 1Q17
2Q 3Q
Monthly avg LTE data usage
While handset subscriber base expands, data usage per sub increased by 20% YoY
4
Ⅰ. Key Takeaways 2. MNO - Subscribers
Handset subs LTE data usage per sub
+20% YoY(GB)
24.28 24.31
24.41 24.38
24.50
24.54 24.56
1Q16
2Q 3Q 4Q 1Q17
2Q 3Q
Handset* subs
* Excludes MVNO
(mn)
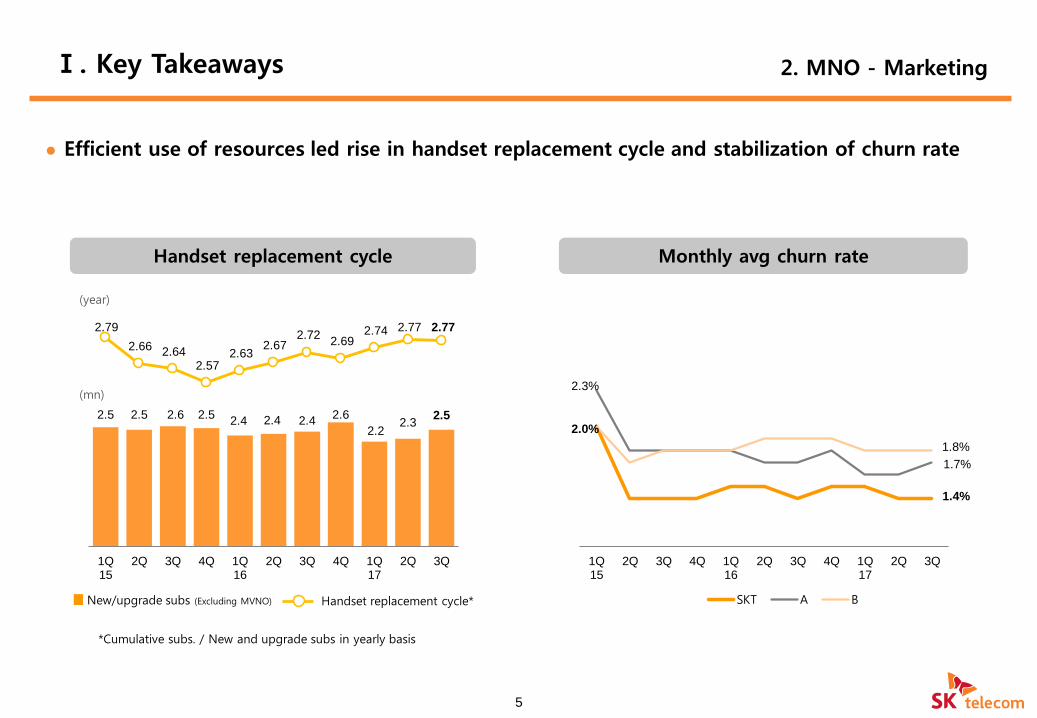
2.5 2.5 2.6 2.5 2.4 2.4 2.4
2.6
2.2 2.3
2.5
1Q15
2Q 3Q 4Q 1Q16
2Q 3Q 4Q 1Q17
2Q 3Q
Efficient use of resources led rise in handset replacement cycle and stabilization of churn rate
5
Ⅰ. Key Takeaways 2. MNO - Marketing
Handset replacement cycle Monthly avg churn rate
2.0%
1.4%
2.3%
1.7%
1.8%
1Q15
2Q 3Q 4Q 1Q16
2Q 3Q 4Q 1Q17
2Q 3Q
SKT A BHandset replacement cycle*New/upgrade subs (Excluding MVNO)
2.79
2.66 2.64 2.57
2.63 2.67
2.72 2.69
2.74 2.77 2.77
*Cumulative subs. / New and upgrade subs in yearly basis
(year)
(mn)
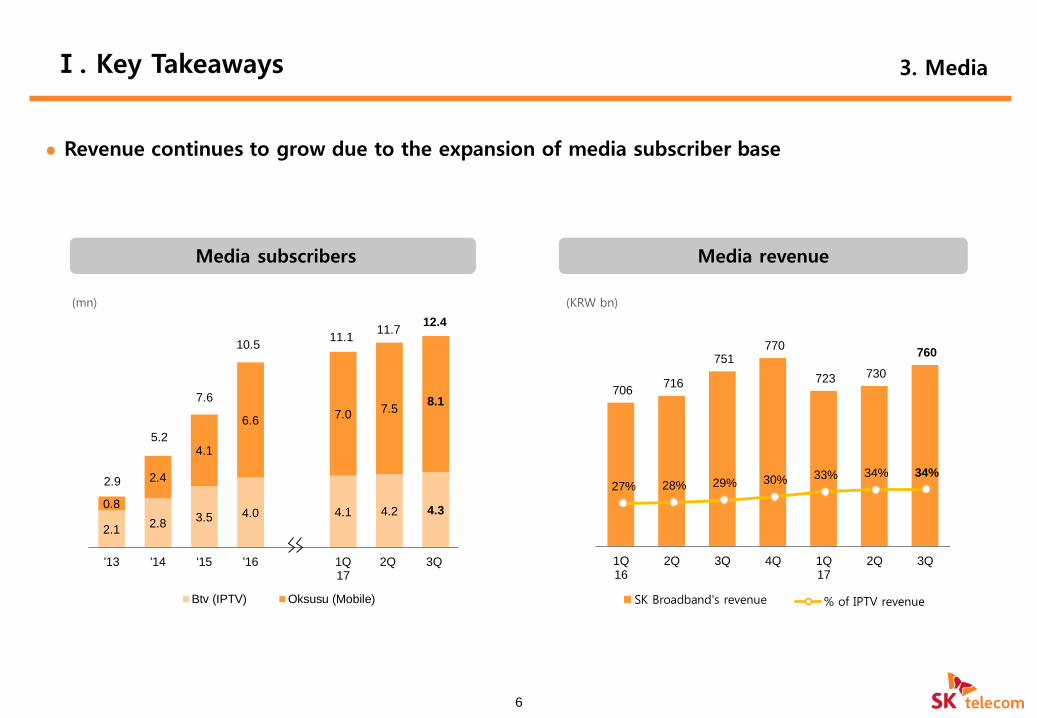
706 716
751 770
723 730
760
1Q16
2Q 3Q 4Q 1Q17
2Q 3Q
SK Broadband's revenue
27% 28% 29% 30% 33% 34% 34%
% of IPTV revenue
Revenue continues to grow due to the expansion of media subscriber base
6
Ⅰ. Key Takeaways 3. Media
Media subscribers Media revenue
2.12.8
3.5 4.0 4.1 4.2 4.30.8
2.4
4.1
6.67.0 7.5
8.1
'13 '14 '15 '16 1Q17
2Q 3Q
Btv (IPTV) Oksusu (Mobile)
(mn) (KRW bn)
2.9
5.2
7.6
10.511.1
11.712.4
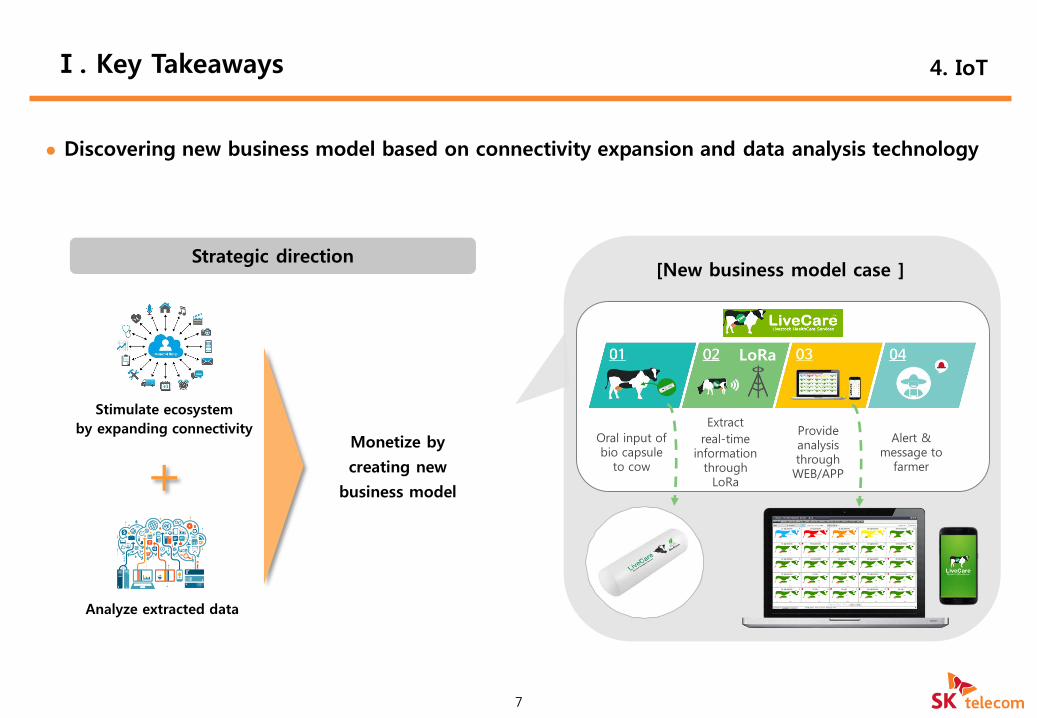
Discovering new business model based on connectivity expansion and data analysis technology
7
Ⅰ. Key Takeaways 4. IoT
Strategic direction
Stimulate ecosystem
by expanding connectivity
Analyze extracted data
Monetize by
creating new
business model
[New business model case ]
Oral input of bio capsule
to cow
Extract
real-time information
through LoRa
Provide analysis through WEB/APP
Alert & message to
farmer
LoRa
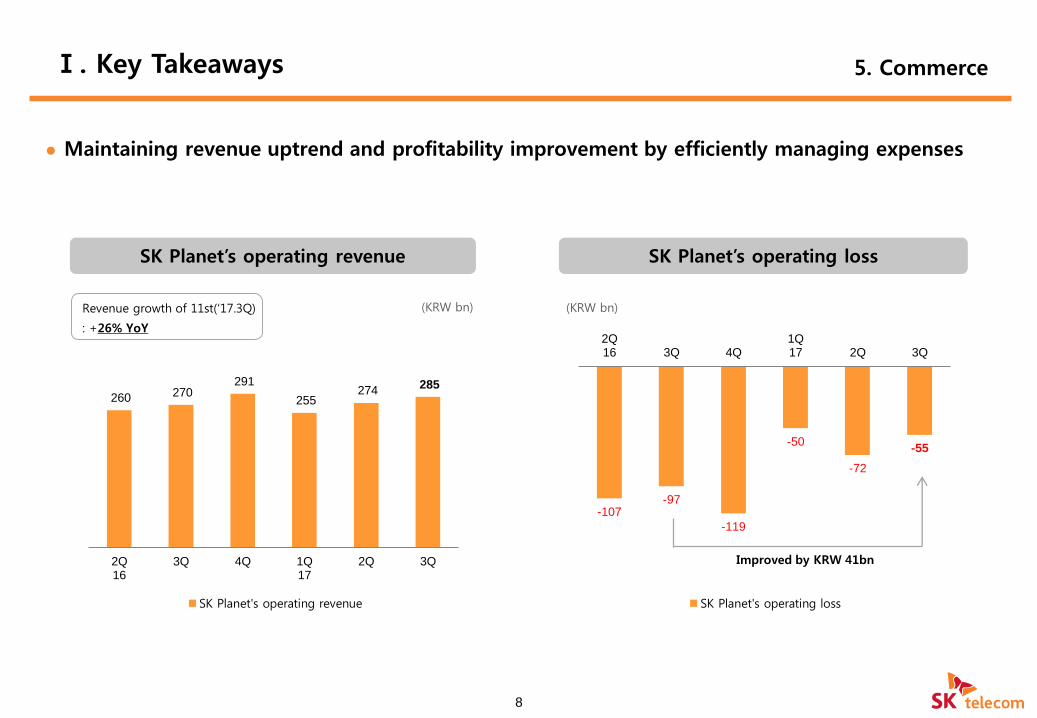
-107 -97
-119
-50
-72
-55
2Q16 3Q 4Q
1Q17 2Q 3Q
SK Planet's operating loss
Maintaining revenue uptrend and profitability improvement by efficiently managing expenses
8
Ⅰ. Key Takeaways 5. Commerce
SK Planet’s operating revenue SK Planet’s operating loss
Improved by KRW 41bn
260 270 291
255 274
285
2Q16
3Q 4Q 1Q17
2Q 3Q
SK Planet's operating revenue
(KRW bn)(KRW bn)Revenue growth of 11st(‘17.3Q)
: +26% YoY
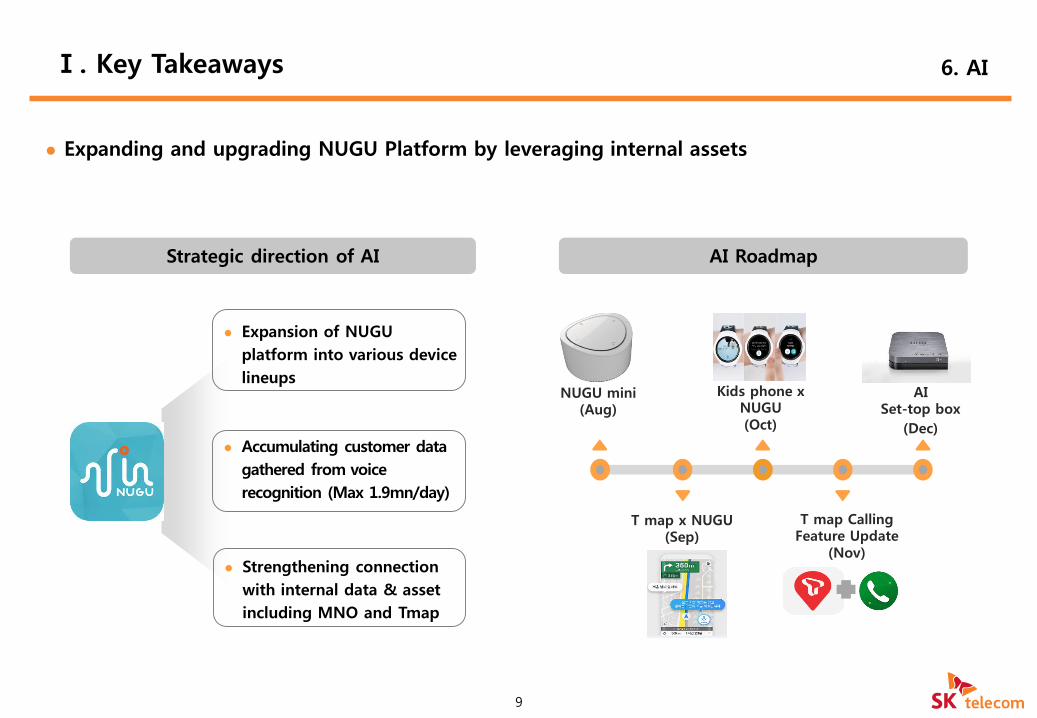
Expanding and upgrading NUGU Platform by leveraging internal assets
9
Ⅰ. Key Takeaways 6. AI
Strategic direction of AI AI Roadmap
Accumulating customer data
gathered from voice
recognition (Max 1.9mn/day)
Expansion of NUGU
platform into various device
lineups
Strengthening connection
with internal data & asset
including MNO and Tmap
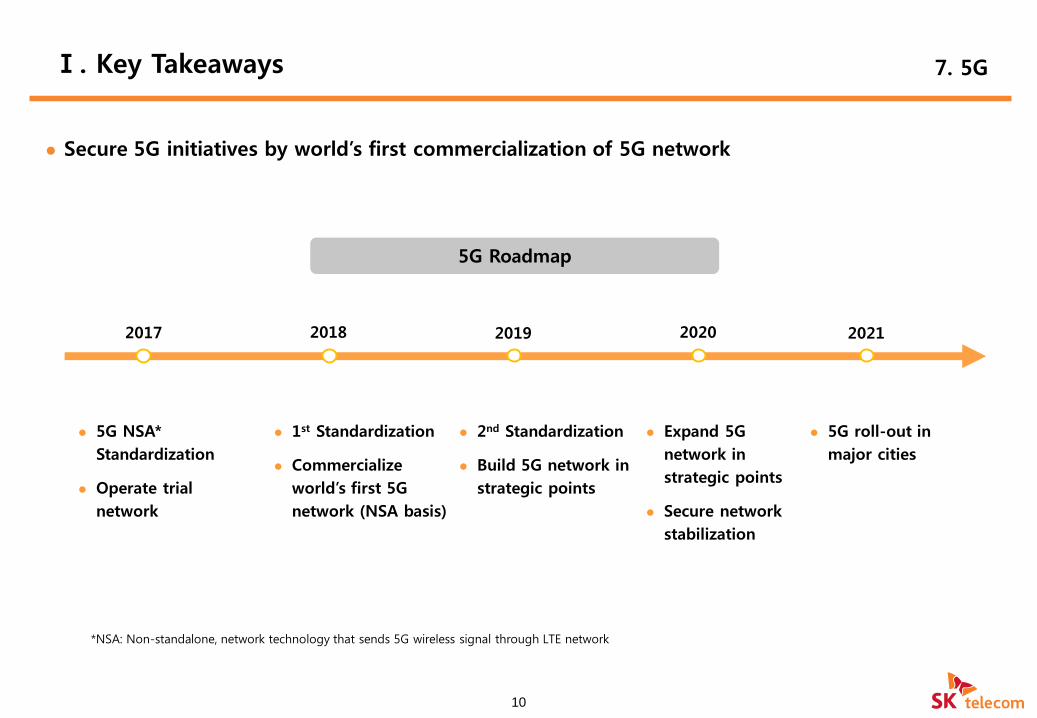
Secure 5G initiatives by world’s first commercialization of 5G network
10
Ⅰ. Key Takeaways 7. 5G
5G Roadmap
2017 2018 2019 2020 2021
5G NSA*
Standardization
Operate trial
network
1st Standardization
Commercialize
world’s first 5G
network (NSA basis)
2nd Standardization
Build 5G network in
strategic points
5G roll-out in
major cities
Expand 5G
network in
strategic points
Secure network
stabilization
*NSA: Non-standalone, network technology that sends 5G wireless signal through LTE network
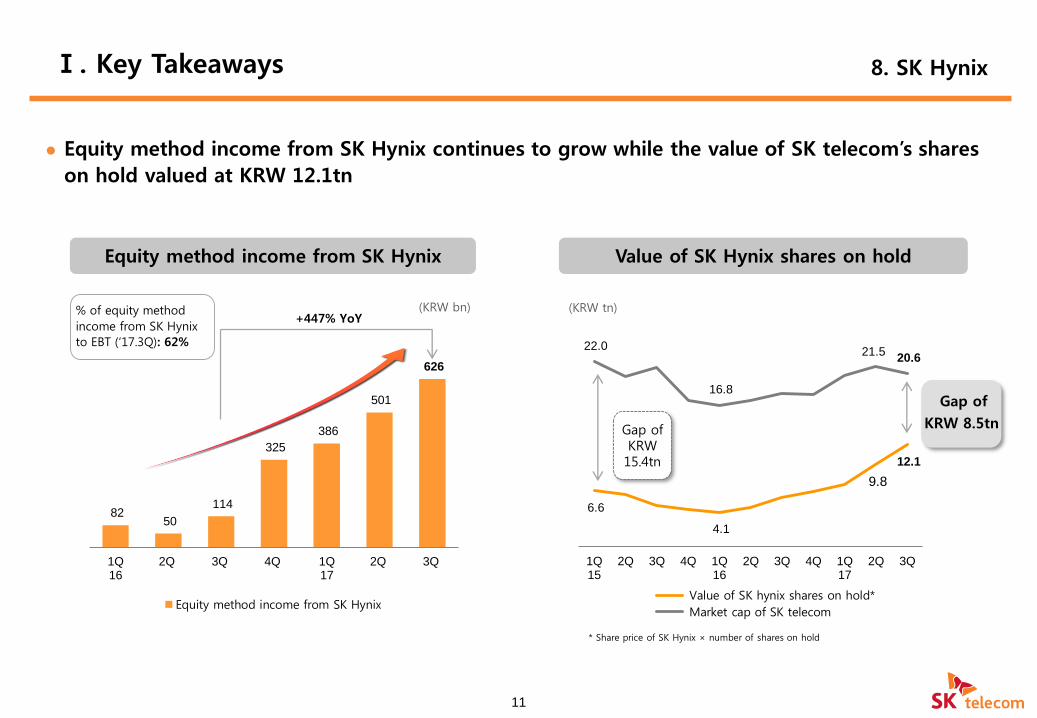
Equity method income from SK Hynix continues to grow while the value of SK telecom’s shares
on hold valued at KRW 12.1tn
11
Ⅰ. Key Takeaways 8. SK Hynix
Equity method income from SK Hynix Value of SK Hynix shares on hold
82 50
114
325
386
501
626
1Q16
2Q 3Q 4Q 1Q17
2Q 3Q
Equity method income from SK Hynix
* Share price of SK Hynix × number of shares on hold
% of equity method
income from SK Hynix
to EBT (‘17.3Q): 62%
6.6
4.1
9.8
12.1
22.0
16.8
21.5 20.6
1Q15
2Q 3Q 4Q 1Q16
2Q 3Q 4Q 1Q17
2Q 3Q
Value of SK hynix shares on hold*
Market cap of SK telecom
(KRW tn)
Gap of KRW 15.4tn
Gap of
KRW 8.5tn
(KRW bn)+447% YoY
12
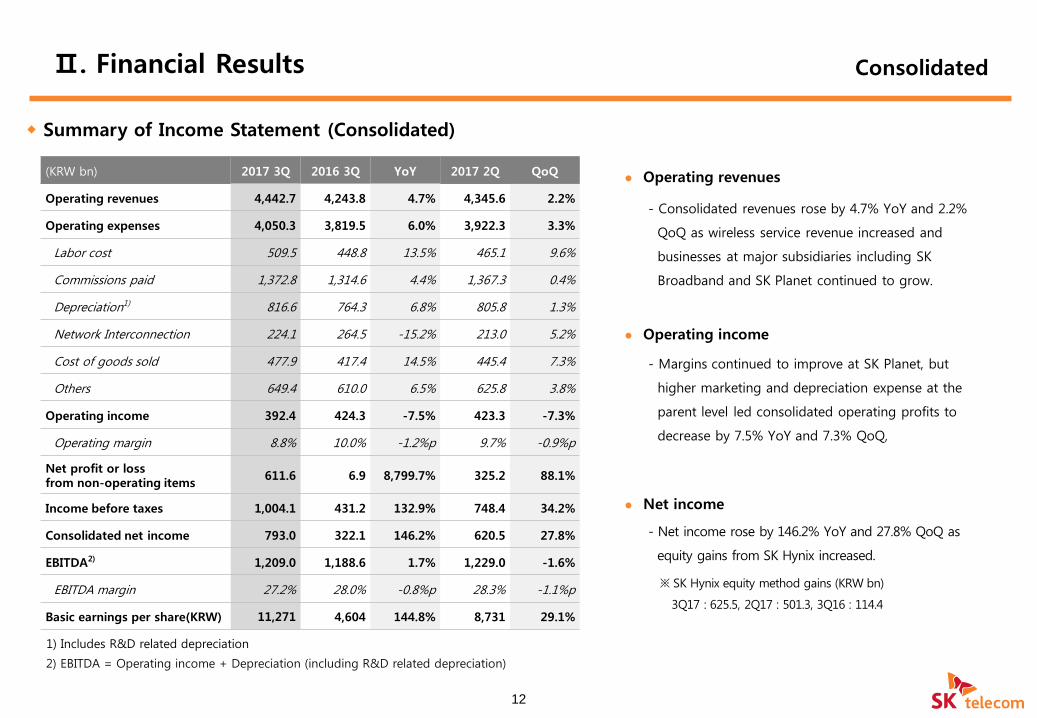
Summary of Income Statement (Consolidated)
2) EBITDA = Operating income + Depreciation (including R&D related depreciation)
1) Includes R&D related depreciation
(KRW bn) 2017 3Q 2016 3Q YoY 2017 2Q QoQ
Operating revenues 4,442.7 4,243.8 4.7% 4,345.6 2.2%
Operating expenses 4,050.3 3,819.5 6.0% 3,922.3 3.3%
Labor cost 509.5 448.8 13.5% 465.1 9.6%
Commissions paid 1,372.8 1,314.6 4.4% 1,367.3 0.4%
Depreciation1) 816.6 764.3 6.8% 805.8 1.3%
Network Interconnection 224.1 264.5 -15.2% 213.0 5.2%
Cost of goods sold 477.9 417.4 14.5% 445.4 7.3%
Others 649.4 610.0 6.5% 625.8 3.8%
Operating income 392.4 424.3 -7.5% 423.3 -7.3%
Operating margin 8.8% 10.0% -1.2%p 9.7% -0.9%p
Net profit or loss from non-operating items
611.6 6.9 8,799.7% 325.2 88.1%
Income before taxes 1,004.1 431.2 132.9% 748.4 34.2%
Consolidated net income 793.0 322.1 146.2% 620.5 27.8%
EBITDA2) 1,209.0 1,188.6 1.7% 1,229.0 -1.6%
EBITDA margin 27.2% 28.0% -0.8%p 28.3% -1.1%p
Basic earnings per share(KRW) 11,271 4,604 144.8% 8,731 29.1%
Operating revenues
Operating income
Net income
- Consolidated revenues rose by 4.7% YoY and 2.2%
QoQ as wireless service revenue increased and
businesses at major subsidiaries including SK
Broadband and SK Planet continued to grow.
- Margins continued to improve at SK Planet, but
higher marketing and depreciation expense at the
parent level led consolidated operating profits to
decrease by 7.5% YoY and 7.3% QoQ,
- Net income rose by 146.2% YoY and 27.8% QoQ as
equity gains from SK Hynix increased.
※ SK Hynix equity method gains (KRW bn)
3Q17 : 625.5, 2Q17 : 501.3, 3Q16 : 114.4
Ⅱ. Financial Results Consolidated
13
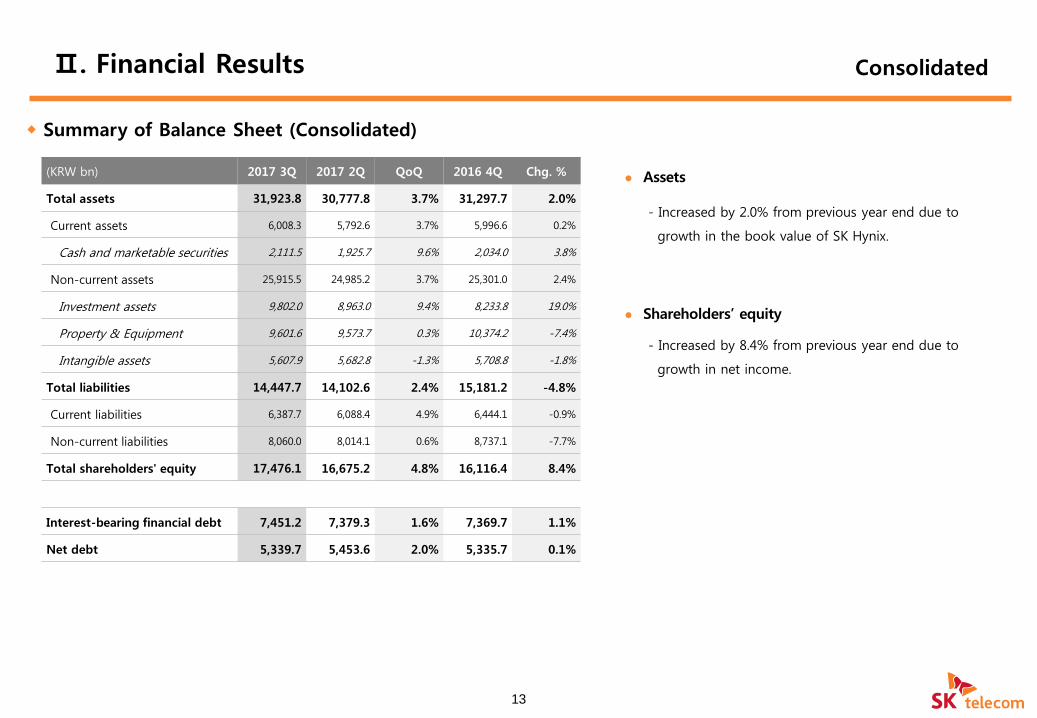
Summary of Balance Sheet (Consolidated)
(KRW bn) 2017 3Q 2017 2Q QoQ 2016 4Q Chg. %
Total assets 31,923.8 30,777.8 3.7% 31,297.7 2.0%
Current assets 6,008.3 5,792.6 3.7% 5,996.6 0.2%
Cash and marketable securities 2,111.5 1,925.7 9.6% 2,034.0 3.8%
Non-current assets 25,915.5 24,985.2 3.7% 25,301.0 2.4%
Investment assets 9,802.0 8,963.0 9.4% 8,233.8 19.0%
Property & Equipment 9,601.6 9,573.7 0.3% 10,374.2 -7.4%
Intangible assets 5,607.9 5,682.8 -1.3% 5,708.8 -1.8%
Total liabilities 14,447.7 14,102.6 2.4% 15,181.2 -4.8%
Current liabilities 6,387.7 6,088.4 4.9% 6,444.1 -0.9%
Non-current liabilities 8,060.0 8,014.1 0.6% 8,737.1 -7.7%
Total shareholders' equity 17,476.1 16,675.2 4.8% 16,116.4 8.4%
Interest-bearing financial debt 7,451.2 7,379.3 1.6% 7,369.7 1.1%
Net debt 5,339.7 5,453.6 2.0% 5,335.7 0.1%
Assets
- Increased by 2.0% from previous year end due to
growth in the book value of SK Hynix.
Shareholders’ equity
- Increased by 8.4% from previous year end due to
growth in net income.
Ⅱ. Financial Results Consolidated
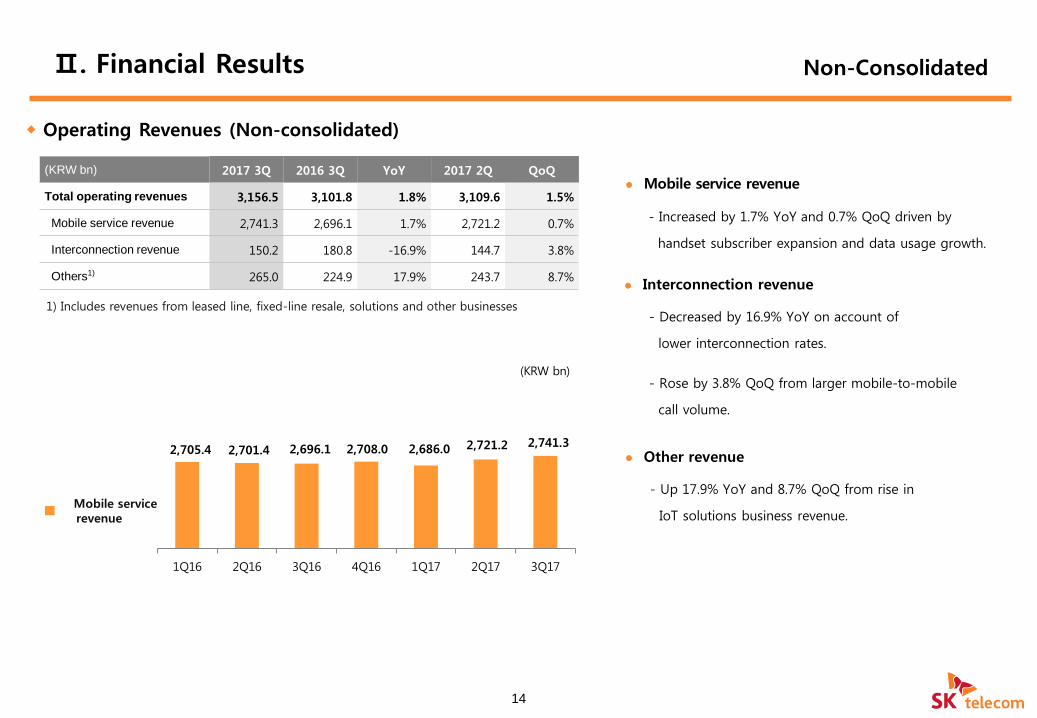
1) Includes revenues from leased line, fixed-line resale, solutions and other businesses
14
(KRW bn)
Operating Revenues (Non-consolidated)
Mobile service revenue
- Increased by 1.7% YoY and 0.7% QoQ driven by
handset subscriber expansion and data usage growth.
Mobile service revenue
(KRW bn) 2017 3Q 2016 3Q YoY 2017 2Q QoQ
Total operating revenues 3,156.5 3,101.8 1.8% 3,109.6 1.5%
Mobile service revenue 2,741.3 2,696.1 1.7% 2,721.2 0.7%
Interconnection revenue 150.2 180.8 -16.9% 144.7 3.8%
Others1) 265.0 224.9 17.9% 243.7 8.7% Interconnection revenue
- Decreased by 16.9% YoY on account of
lower interconnection rates.
- Rose by 3.8% QoQ from larger mobile-to-mobile
call volume.
Other revenue
- Up 17.9% YoY and 8.7% QoQ from rise in
IoT solutions business revenue.
2,705.4 2,701.4 2,696.1 2,708.0 2,686.0 2,721.2 2,741.3
1Q16 2Q16 3Q16 4Q16 1Q17 2Q17 3Q17
Ⅱ. Financial Results Non-Consolidated
15
1) Marketing expense = marketing related commission + advertising expenses
% to Revenue
NetworkCAPEX
Non-NetworkCAPEX
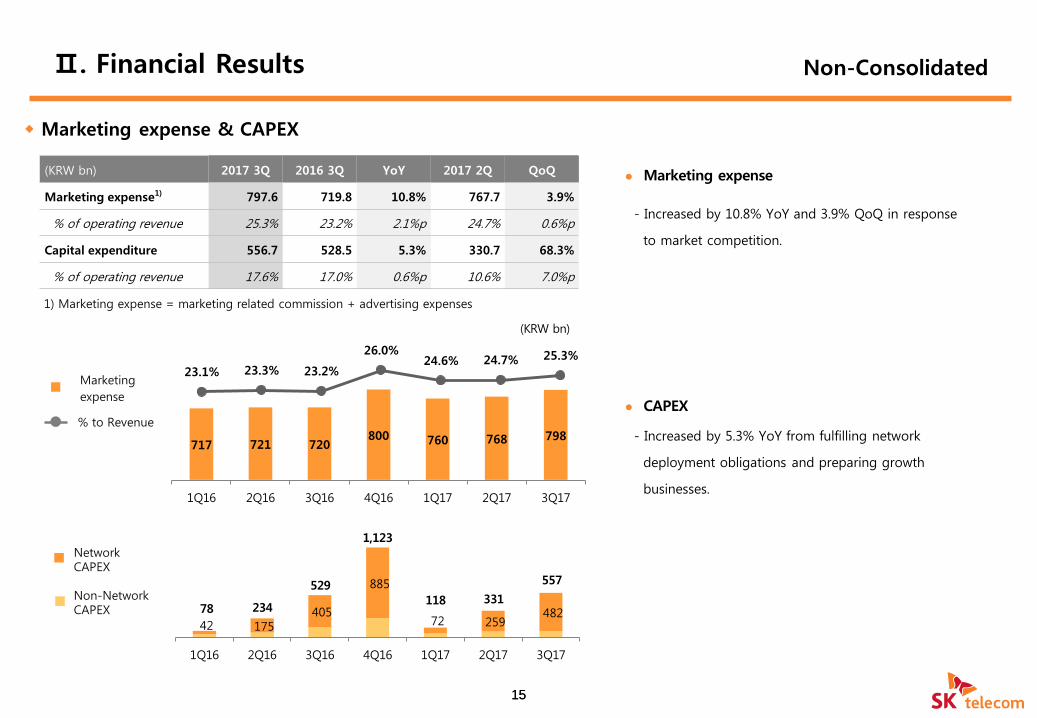
Marketing expense & CAPEX
Marketing expense
CAPEX
Marketing
expense
(KRW bn) 2017 3Q 2016 3Q YoY 2017 2Q QoQ
Marketing expense1) 797.6 719.8 10.8% 767.7 3.9%
% of operating revenue 25.3% 23.2% 2.1%p 24.7% 0.6%p
Capital expenditure 556.7 528.5 5.3% 330.7 68.3%
% of operating revenue 17.6% 17.0% 0.6%p 10.6% 7.0%p
- Increased by 10.8% YoY and 3.9% QoQ in response
to market competition.
- Increased by 5.3% YoY from fulfilling network
deployment obligations and preparing growth
businesses.
717 721 720800 760 768 798
1Q16 2Q16 3Q16 4Q16 1Q17 2Q17 3Q17
23.1% 23.3% 23.2%
26.0%24.6% 24.7% 25.3%
15
42 175 405
885
72 259 482
1Q16 2Q16 3Q16 4Q16 1Q17 2Q17 3Q17
78 234
529
1,123
118 331
557
(KRW bn)
Non-ConsolidatedⅡ. Financial Results
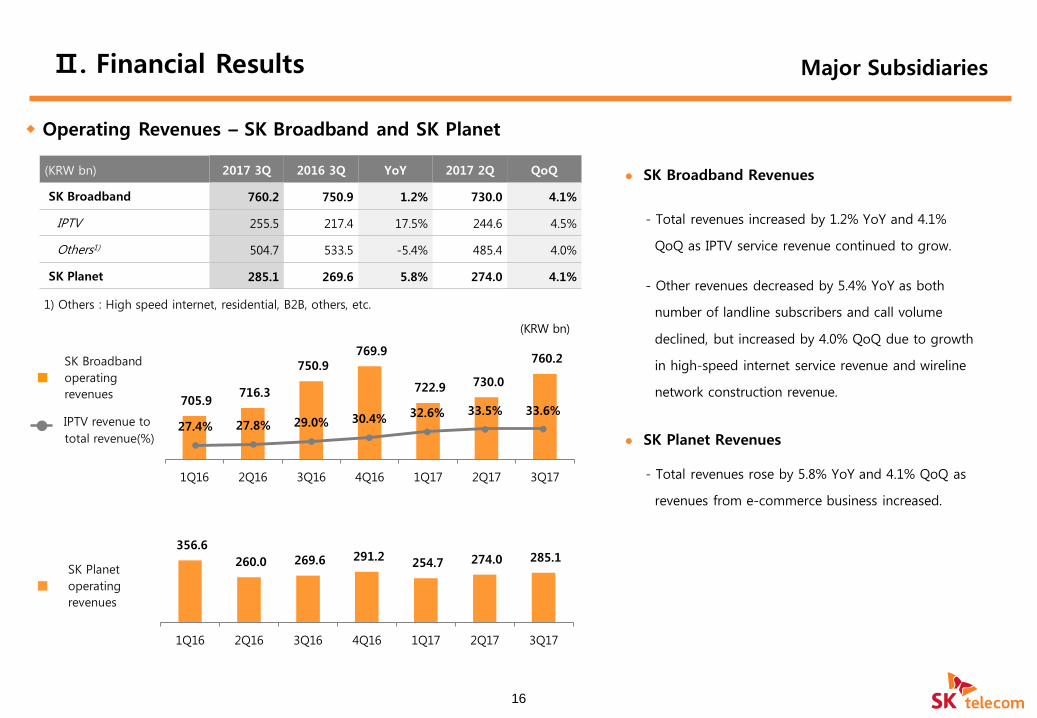
Operating Revenues – SK Broadband and SK Planet
16
SK Planet
operating
revenues
SK Broadband Revenues
SK Planet Revenues
1) Others : High speed internet, residential, B2B, others, etc.
SK Broadband
operating
revenues
IPTV revenue to
total revenue(%)
(KRW bn) 2017 3Q 2016 3Q YoY 2017 2Q QoQ
SK Broadband 760.2 750.9 1.2% 730.0 4.1%
IPTV 255.5 217.4 17.5% 244.6 4.5%
Others1) 504.7 533.5 -5.4% 485.4 4.0%
SK Planet 285.1 269.6 5.8% 274.0 4.1%
- Total revenues increased by 1.2% YoY and 4.1%
QoQ as IPTV service revenue continued to grow.
- Other revenues decreased by 5.4% YoY as both
number of landline subscribers and call volume
declined, but increased by 4.0% QoQ due to growth
in high-speed internet service revenue and wireline
network construction revenue.
- Total revenues rose by 5.8% YoY and 4.1% QoQ as
revenues from e-commerce business increased.
(KRW bn)
705.9 716.3
750.9 769.9
722.9 730.0
760.2
1Q16 2Q16 3Q16 4Q16 1Q17 2Q17 3Q17
27.4% 27.8% 29.0% 30.4% 32.6% 33.5% 33.6%
356.6
260.0 269.6 291.2 254.7 274.0 285.1
1Q16 2Q16 3Q16 4Q16 1Q17 2Q17 3Q17
Ⅱ. Financial Results Major Subsidiaries
17
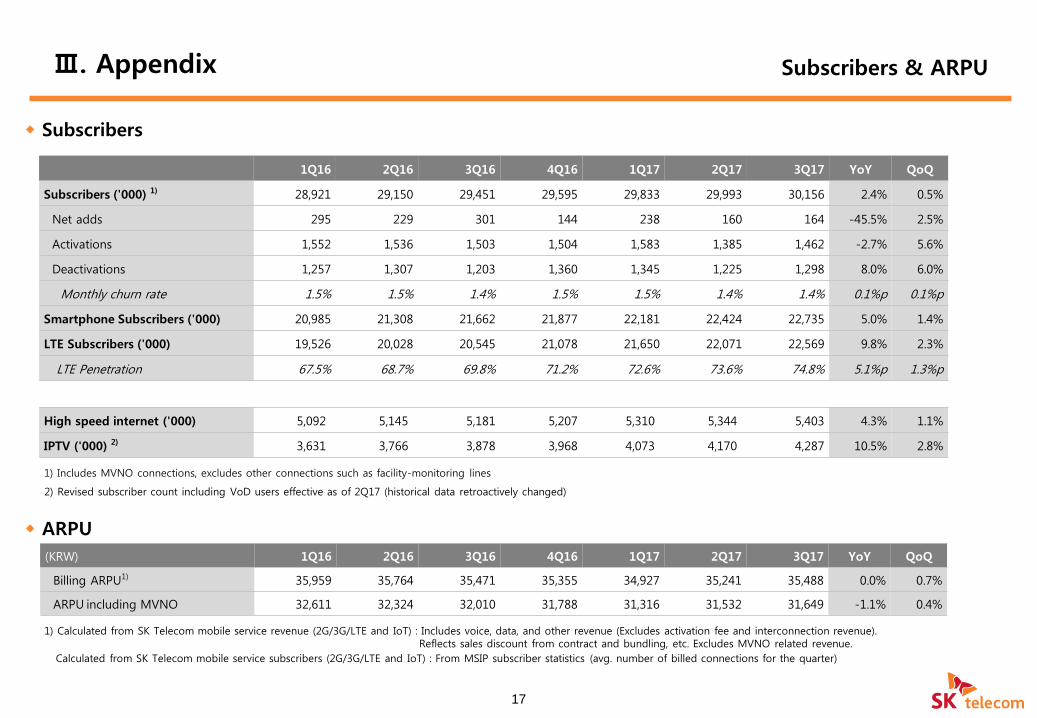
Subscribers
ARPU
1) Calculated from SK Telecom mobile service revenue (2G/3G/LTE and IoT) : Includes voice, data, and other revenue (Excludes activation fee and interconnection revenue). Reflects sales discount from contract and bundling, etc. Excludes MVNO related revenue.
Calculated from SK Telecom mobile service subscribers (2G/3G/LTE and IoT) : From MSIP subscriber statistics (avg. number of billed connections for the quarter)
1) Includes MVNO connections, excludes other connections such as facility-monitoring lines
2) Revised subscriber count including VoD users effective as of 2Q17 (historical data retroactively changed)
1Q16 2Q16 3Q16 4Q16 1Q17 2Q17 3Q17 YoY QoQ
Subscribers ('000) 1) 28,921 29,150 29,451 29,595 29,833 29,993 30,156 2.4% 0.5%
Net adds 295 229 301 144 238 160 164 -45.5% 2.5%
Activations 1,552 1,536 1,503 1,504 1,583 1,385 1,462 -2.7% 5.6%
Deactivations 1,257 1,307 1,203 1,360 1,345 1,225 1,298 8.0% 6.0%
Monthly churn rate 1.5% 1.5% 1.4% 1.5% 1.5% 1.4% 1.4% 0.1%p 0.1%p
Smartphone Subscribers ('000) 20,985 21,308 21,662 21,877 22,181 22,424 22,735 5.0% 1.4%
LTE Subscribers ('000) 19,526 20,028 20,545 21,078 21,650 22,071 22,569 9.8% 2.3%
LTE Penetration 67.5% 68.7% 69.8% 71.2% 72.6% 73.6% 74.8% 5.1%p 1.3%p
High speed internet ('000) 5,092 5,145 5,181 5,207 5,310 5,344 5,403 4.3% 1.1%
IPTV ('000) 2) 3,631 3,766 3,878 3,968 4,073 4,170 4,287 10.5% 2.8%
(KRW) 1Q16 2Q16 3Q16 4Q16 1Q17 2Q17 3Q17 YoY QoQ
Billing ARPU1) 35,959 35,764 35,471 35,355 34,927 35,241 35,488 0.0% 0.7%
ARPU including MVNO 32,611 32,324 32,010 31,788 31,316 31,532 31,649 -1.1% 0.4%
Ⅲ. Appendix Subscribers & ARPU
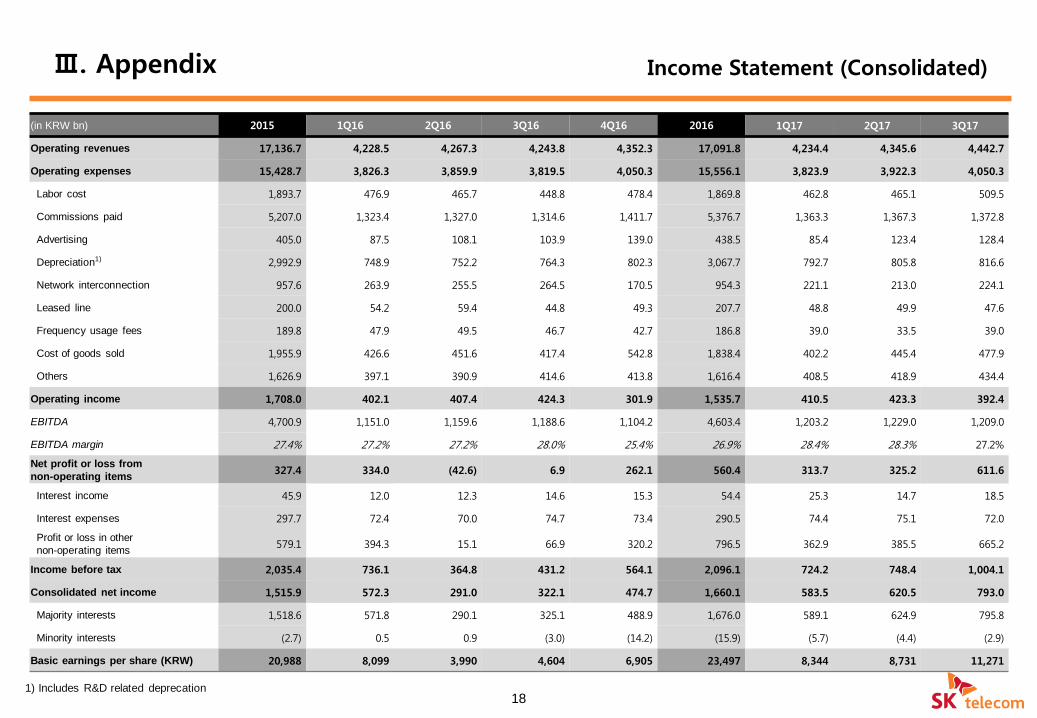
181) Includes R&D related deprecation
(in KRW bn) 2015 1Q16 2Q16 3Q16 4Q16 2016 1Q17 2Q17 3Q17
Operating revenues 17,136.7 4,228.5 4,267.3 4,243.8 4,352.3 17,091.8 4,234.4 4,345.6 4,442.7
Operating expenses 15,428.7 3,826.3 3,859.9 3,819.5 4,050.3 15,556.1 3,823.9 3,922.3 4,050.3
Labor cost 1,893.7 476.9 465.7 448.8 478.4 1,869.8 462.8 465.1 509.5
Commissions paid 5,207.0 1,323.4 1,327.0 1,314.6 1,411.7 5,376.7 1,363.3 1,367.3 1,372.8
Advertising 405.0 87.5 108.1 103.9 139.0 438.5 85.4 123.4 128.4
Depreciation1) 2,992.9 748.9 752.2 764.3 802.3 3,067.7 792.7 805.8 816.6
Network interconnection 957.6 263.9 255.5 264.5 170.5 954.3 221.1 213.0 224.1
Leased line 200.0 54.2 59.4 44.8 49.3 207.7 48.8 49.9 47.6
Frequency usage fees 189.8 47.9 49.5 46.7 42.7 186.8 39.0 33.5 39.0
Cost of goods sold 1,955.9 426.6 451.6 417.4 542.8 1,838.4 402.2 445.4 477.9
Others 1,626.9 397.1 390.9 414.6 413.8 1,616.4 408.5 418.9 434.4
Operating income 1,708.0 402.1 407.4 424.3 301.9 1,535.7 410.5 423.3 392.4
EBITDA 4,700.9 1,151.0 1,159.6 1,188.6 1,104.2 4,603.4 1,203.2 1,229.0 1,209.0
EBITDA margin 27.4% 27.2% 27.2% 28.0% 25.4% 26.9% 28.4% 28.3% 27.2%
Net profit or loss from
non-operating items327.4 334.0 (42.6) 6.9 262.1 560.4 313.7 325.2 611.6
Interest income 45.9 12.0 12.3 14.6 15.3 54.4 25.3 14.7 18.5
Interest expenses 297.7 72.4 70.0 74.7 73.4 290.5 74.4 75.1 72.0
Profit or loss in other
non-operating items579.1 394.3 15.1 66.9 320.2 796.5 362.9 385.5 665.2
Income before tax 2,035.4 736.1 364.8 431.2 564.1 2,096.1 724.2 748.4 1,004.1
Consolidated net income 1,515.9 572.3 291.0 322.1 474.7 1,660.1 583.5 620.5 793.0
Majority interests 1,518.6 571.8 290.1 325.1 488.9 1,676.0 589.1 624.9 795.8
Minority interests (2.7) 0.5 0.9 (3.0) (14.2) (15.9) (5.7) (4.4) (2.9)
Basic earnings per share (KRW) 20,988 8,099 3,990 4,604 6,905 23,497 8,344 8,731 11,271
Ⅲ. Appendix Income Statement (Consolidated)
19
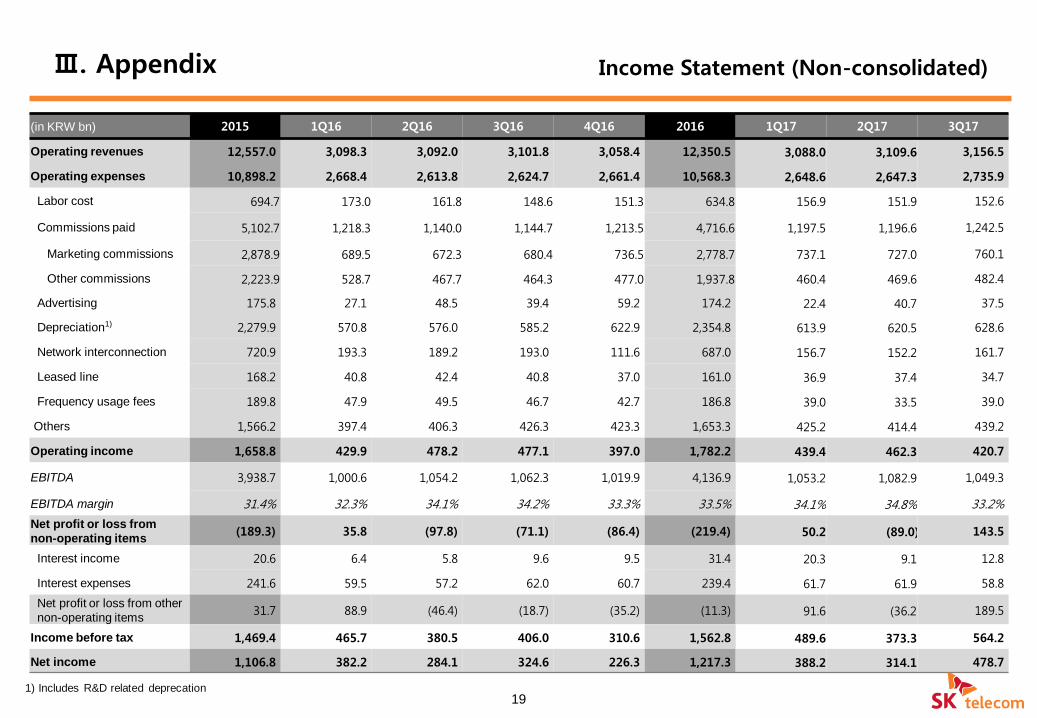
(in KRW bn) 2015 1Q16 2Q16 3Q16 4Q16 2016 1Q17 2Q17 3Q17
Operating revenues 12,557.0 3,098.3 3,092.0 3,101.8 3,058.4 12,350.5 3,088.0 3,109.6 3,156.5
Operating expenses 10,898.2 2,668.4 2,613.8 2,624.7 2,661.4 10,568.3 2,648.6 2,647.3 2,735.9
Labor cost 694.7 173.0 161.8 148.6 151.3 634.8 156.9 151.9 152.6
Commissions paid 5,102.7 1,218.3 1,140.0 1,144.7 1,213.5 4,716.6 1,197.5 1,196.6 1,242.5
Marketing commissions 2,878.9 689.5 672.3 680.4 736.5 2,778.7 737.1 727.0 760.1
Other commissions 2,223.9 528.7 467.7 464.3 477.0 1,937.8 460.4 469.6 482.4
Advertising 175.8 27.1 48.5 39.4 59.2 174.2 22.4 40.7 37.5
Depreciation1) 2,279.9 570.8 576.0 585.2 622.9 2,354.8 613.9 620.5 628.6
Network interconnection 720.9 193.3 189.2 193.0 111.6 687.0 156.7 152.2 161.7
Leased line 168.2 40.8 42.4 40.8 37.0 161.0 36.9 37.4 34.7
Frequency usage fees 189.8 47.9 49.5 46.7 42.7 186.8 39.0 33.5 39.0
Others 1,566.2 397.4 406.3 426.3 423.3 1,653.3 425.2 414.4 439.2
Operating income 1,658.8 429.9 478.2 477.1 397.0 1,782.2 439.4 462.3 420.7
EBITDA 3,938.7 1,000.6 1,054.2 1,062.3 1,019.9 4,136.9 1,053.2 1,082.9 1,049.3
EBITDA margin 31.4% 32.3% 34.1% 34.2% 33.3% 33.5% 34.1% 34.8% 33.2%
Net profit or loss from
non-operating items(189.3) 35.8 (97.8) (71.1) (86.4) (219.4) 50.2 (89.0) 143.5
Interest income 20.6 6.4 5.8 9.6 9.5 31.4 20.3 9.1 12.8
Interest expenses 241.6 59.5 57.2 62.0 60.7 239.4 61.7 61.9 58.8
Net profit or loss from other
non-operating items31.7 88.9 (46.4) (18.7) (35.2) (11.3) 91.6 (36.2) 189.5
Income before tax 1,469.4 465.7 380.5 406.0 310.6 1,562.8 489.6 373.3 564.2
Net income 1,106.8 382.2 284.1 324.6 226.3 1,217.3 388.2 314.1 478.7
1) Includes R&D related deprecation
Ⅲ. Appendix Income Statement (Non-consolidated)
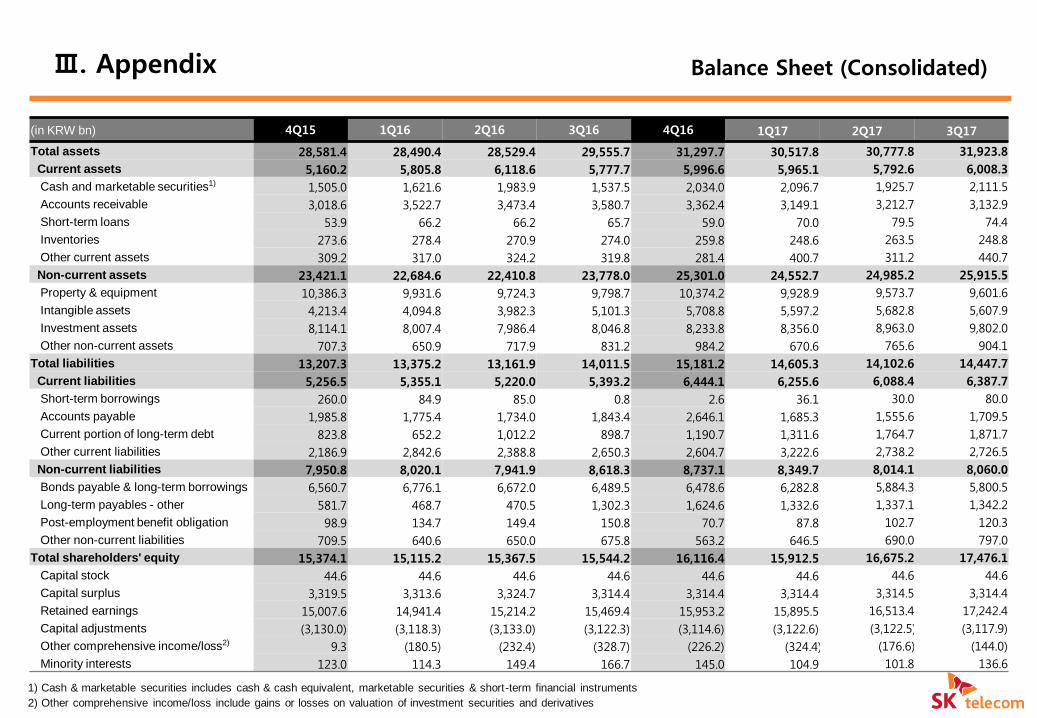
1) Cash & marketable securities includes cash & cash equivalent, marketable securities & short-term financial instruments
2) Other comprehensive income/loss include gains or losses on valuation of investment securities and derivatives
(in KRW bn) 4Q15 1Q16 2Q16 3Q16 4Q16 1Q17 2Q17 3Q17
Total assets 28,581.4 28,490.4 28,529.4 29,555.7 31,297.7 30,517.8 30,777.8 31,923.8
Current assets 5,160.2 5,805.8 6,118.6 5,777.7 5,996.6 5,965.1 5,792.6 6,008.3
Cash and marketable securities1) 1,505.0 1,621.6 1,983.9 1,537.5 2,034.0 2,096.7 1,925.7 2,111.5
Accounts receivable 3,018.6 3,522.7 3,473.4 3,580.7 3,362.4 3,149.1 3,212.7 3,132.9
Short-term loans 53.9 66.2 66.2 65.7 59.0 70.0 79.5 74.4
Inventories 273.6 278.4 270.9 274.0 259.8 248.6 263.5 248.8
Other current assets 309.2 317.0 324.2 319.8 281.4 400.7 311.2 440.7
Non-current assets 23,421.1 22,684.6 22,410.8 23,778.0 25,301.0 24,552.7 24,985.2 25,915.5
Property & equipment 10,386.3 9,931.6 9,724.3 9,798.7 10,374.2 9,928.9 9,573.7 9,601.6
Intangible assets 4,213.4 4,094.8 3,982.3 5,101.3 5,708.8 5,597.2 5,682.8 5,607.9
Investment assets 8,114.1 8,007.4 7,986.4 8,046.8 8,233.8 8,356.0 8,963.0 9,802.0
Other non-current assets 707.3 650.9 717.9 831.2 984.2 670.6 765.6 904.1
Total liabilities 13,207.3 13,375.2 13,161.9 14,011.5 15,181.2 14,605.3 14,102.6 14,447.7
Current liabilities 5,256.5 5,355.1 5,220.0 5,393.2 6,444.1 6,255.6 6,088.4 6,387.7
Short-term borrowings 260.0 84.9 85.0 0.8 2.6 36.1 30.0 80.0
Accounts payable 1,985.8 1,775.4 1,734.0 1,843.4 2,646.1 1,685.3 1,555.6 1,709.5
Current portion of long-term debt 823.8 652.2 1,012.2 898.7 1,190.7 1,311.6 1,764.7 1,871.7
Other current liabilities 2,186.9 2,842.6 2,388.8 2,650.3 2,604.7 3,222.6 2,738.2 2,726.5
Non-current liabilities 7,950.8 8,020.1 7,941.9 8,618.3 8,737.1 8,349.7 8,014.1 8,060.0
Bonds payable & long-term borrowings 6,560.7 6,776.1 6,672.0 6,489.5 6,478.6 6,282.8 5,884.3 5,800.5
Long-term payables - other 581.7 468.7 470.5 1,302.3 1,624.6 1,332.6 1,337.1 1,342.2
Post-employment benefit obligation 98.9 134.7 149.4 150.8 70.7 87.8 102.7 120.3
Other non-current liabilities 709.5 640.6 650.0 675.8 563.2 646.5 690.0 797.0
Total shareholders' equity 15,374.1 15,115.2 15,367.5 15,544.2 16,116.4 15,912.5 16,675.2 17,476.1
Capital stock 44.6 44.6 44.6 44.6 44.6 44.6 44.6 44.6
Capital surplus 3,319.5 3,313.6 3,324.7 3,314.4 3,314.4 3,314.4 3,314.5 3,314.4
Retained earnings 15,007.6 14,941.4 15,214.2 15,469.4 15,953.2 15,895.5 16,513.4 17,242.4
Capital adjustments (3,130.0) (3,118.3) (3,133.0) (3,122.3) (3,114.6) (3,122.6) (3,122.5) (3,117.9)
Other comprehensive income/loss2) 9.3 (180.5) (232.4) (328.7) (226.2) (324.4) (176.6) (144.0)
Minority interests 123.0 114.3 149.4 166.7 145.0 104.9 101.8 136.6
Ⅲ. Appendix Balance Sheet (Consolidated)
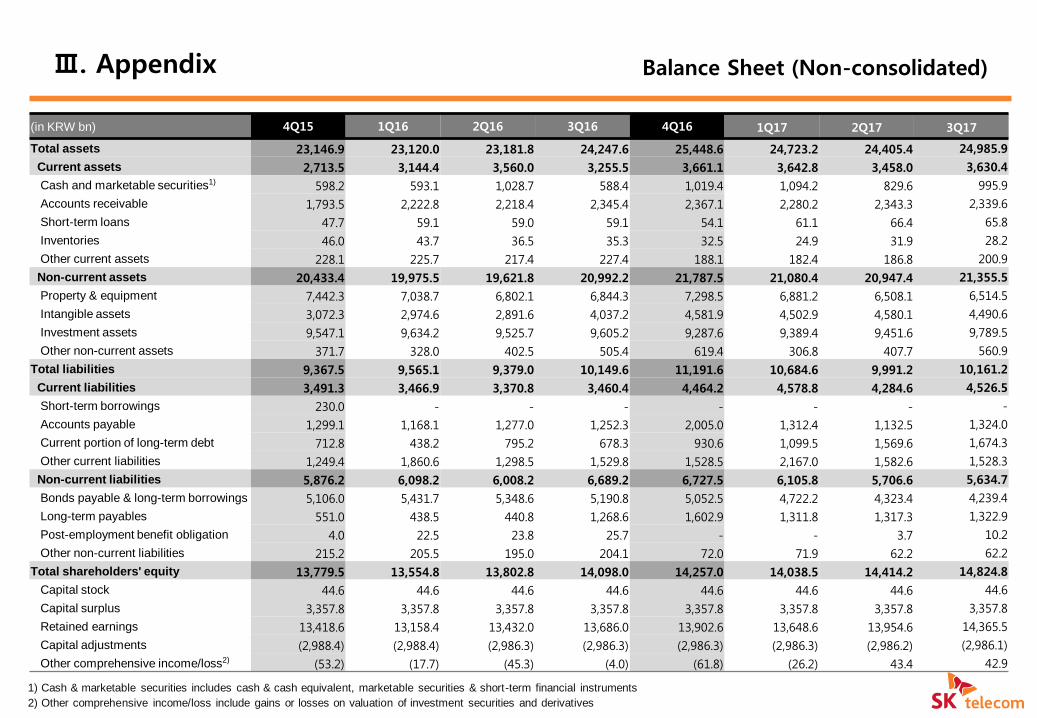
(in KRW bn) 4Q15 1Q16 2Q16 3Q16 4Q16 1Q17 2Q17 3Q17
Total assets 23,146.9 23,120.0 23,181.8 24,247.6 25,448.6 24,723.2 24,405.4 24,985.9
Current assets 2,713.5 3,144.4 3,560.0 3,255.5 3,661.1 3,642.8 3,458.0 3,630.4
Cash and marketable securities1) 598.2 593.1 1,028.7 588.4 1,019.4 1,094.2 829.6 995.9
Accounts receivable 1,793.5 2,222.8 2,218.4 2,345.4 2,367.1 2,280.2 2,343.3 2,339.6
Short-term loans 47.7 59.1 59.0 59.1 54.1 61.1 66.4 65.8
Inventories 46.0 43.7 36.5 35.3 32.5 24.9 31.9 28.2
Other current assets 228.1 225.7 217.4 227.4 188.1 182.4 186.8 200.9
Non-current assets 20,433.4 19,975.5 19,621.8 20,992.2 21,787.5 21,080.4 20,947.4 21,355.5
Property & equipment 7,442.3 7,038.7 6,802.1 6,844.3 7,298.5 6,881.2 6,508.1 6,514.5
Intangible assets 3,072.3 2,974.6 2,891.6 4,037.2 4,581.9 4,502.9 4,580.1 4,490.6
Investment assets 9,547.1 9,634.2 9,525.7 9,605.2 9,287.6 9,389.4 9,451.6 9,789.5
Other non-current assets 371.7 328.0 402.5 505.4 619.4 306.8 407.7 560.9
Total liabilities 9,367.5 9,565.1 9,379.0 10,149.6 11,191.6 10,684.6 9,991.2 10,161.2
Current liabilities 3,491.3 3,466.9 3,370.8 3,460.4 4,464.2 4,578.8 4,284.6 4,526.5
Short-term borrowings 230.0 - - - - - - -
Accounts payable 1,299.1 1,168.1 1,277.0 1,252.3 2,005.0 1,312.4 1,132.5 1,324.0
Current portion of long-term debt 712.8 438.2 795.2 678.3 930.6 1,099.5 1,569.6 1,674.3
Other current liabilities 1,249.4 1,860.6 1,298.5 1,529.8 1,528.5 2,167.0 1,582.6 1,528.3
Non-current liabilities 5,876.2 6,098.2 6,008.2 6,689.2 6,727.5 6,105.8 5,706.6 5,634.7
Bonds payable & long-term borrowings 5,106.0 5,431.7 5,348.6 5,190.8 5,052.5 4,722.2 4,323.4 4,239.4
Long-term payables 551.0 438.5 440.8 1,268.6 1,602.9 1,311.8 1,317.3 1,322.9
Post-employment benefit obligation 4.0 22.5 23.8 25.7 - - 3.7 10.2
Other non-current liabilities 215.2 205.5 195.0 204.1 72.0 71.9 62.2 62.2
Total shareholders' equity 13,779.5 13,554.8 13,802.8 14,098.0 14,257.0 14,038.5 14,414.2 14,824.8
Capital stock 44.6 44.6 44.6 44.6 44.6 44.6 44.6 44.6
Capital surplus 3,357.8 3,357.8 3,357.8 3,357.8 3,357.8 3,357.8 3,357.8 3,357.8
Retained earnings 13,418.6 13,158.4 13,432.0 13,686.0 13,902.6 13,648.6 13,954.6 14,365.5
Capital adjustments (2,988.4) (2,988.4) (2,986.3) (2,986.3) (2,986.3) (2,986.3) (2,986.2) (2,986.1)
Other comprehensive income/loss2) (53.2) (17.7) (45.3) (4.0) (61.8) (26.2) 43.4 42.9
1) Cash & marketable securities includes cash & cash equivalent, marketable securities & short-term financial instruments
2) Other comprehensive income/loss include gains or losses on valuation of investment securities and derivatives
Ⅲ. Appendix Balance Sheet (Non-consolidated)