Embed Size (px)
Citation preview
April 2016
SK telecom Investor Presentation
July 2016
8 CONSECUTIVE MEMBER OF
Disclaimer
This presentation contains forward-looking statements with respect to the financial condition, results of operations
and business of SK Telecom and its subsidiaries (the “Company”) and plans and objectives of the management of
the Company. The aforementioned forward-looking statements are influenced by unknown risks, uncertainties and
other factors which may change the actual results or performance of the Company.
The Company does not make any representation or warranty, expressed or implied, as to the accuracy or
completeness of the information contained in this management presentation, and nothing contained herein is, or
shall be relied upon as, a promise or representation, whether as to the past or the future.
Therefore, this presentation contained herein should not be utilized for any legal purposes in regards to investors’
investment results. The Company hereby expressly disclaims any and all liability for any loss or damage resulting
from the investors’ reliance on the information contained herein.
This presentation only speaks the informations as of the date they are made, and the Company undertakes no
obligation to update publicly any of them in light of new information or future events.
Table of Contents
3
12
14
16
18
Ⅰ. Business
Ⅱ. Capital Management
Ⅲ. Consolidated Results
Ⅳ. Non-consolidated Results
Appendix
- Telco
- Media
- e-Commerce
- Lifestyle Enhancement
- IoT
3
9
11
8
10
49.3%
59.2% 62.3% 63.4% 64.8% 66.3% 67.5% 68.7%
Ⅰ. Business
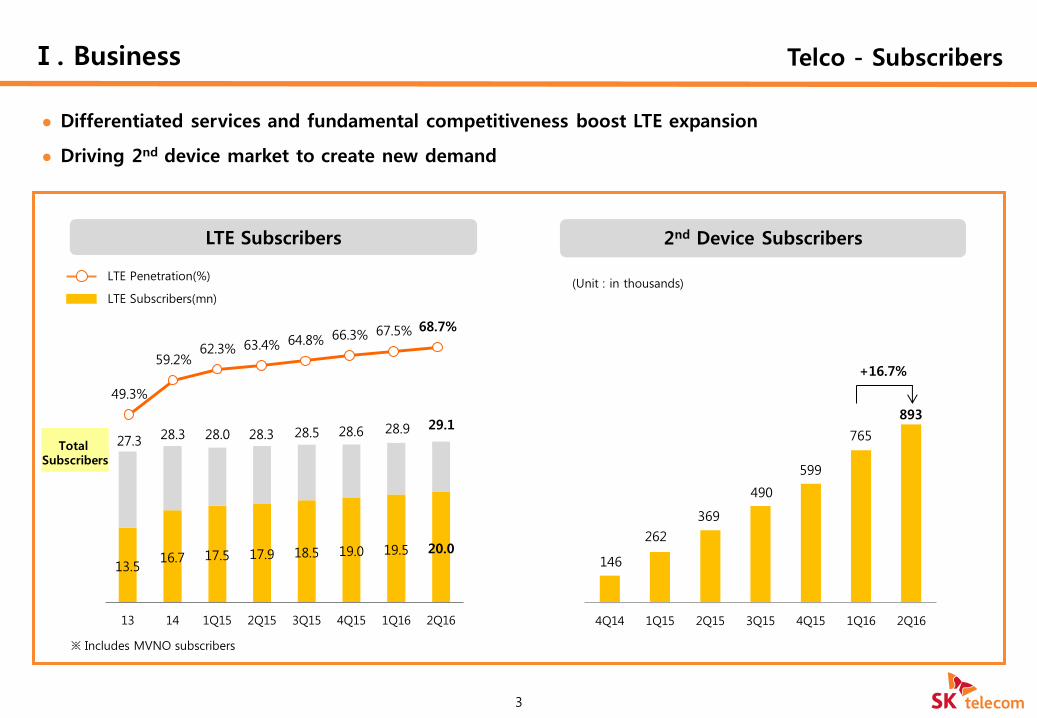
Differentiated services and fundamental competitiveness boost LTE expansion
Driving 2nd device market to create new demand
Telco - Subscribers
2nd Device Subscribers
3
LTE Penetration(%)
LTE Subscribers(mn)
LTE Subscribers
146
262
369
490
599
765
893
4Q14 1Q15 2Q15 3Q15 4Q15 1Q16 2Q16
※ Includes MVNO subscribers
+16.7%
Total Subscribers
13.5 16.7 17.5 17.9 18.5 19.0 19.5 20.0
13 14 1Q15 2Q15 3Q15 4Q15 1Q16 2Q16
27.3 28.3 28.0 28.3 28.5 28.6 28.9 29.1
(Unit : in thousands)
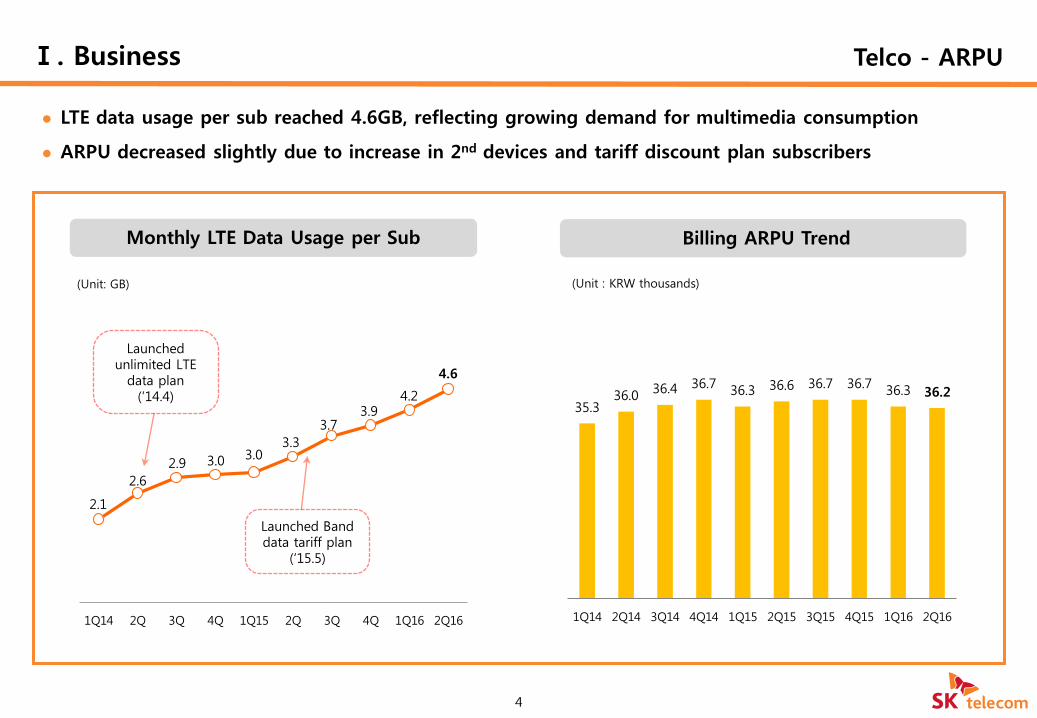
Telco - ARPU
LTE data usage per sub reached 4.6GB, reflecting growing demand for multimedia consumption
ARPU decreased slightly due to increase in 2nd devices and tariff discount plan subscribers
2.1
2.6
2.9 3.0 3.0 3.3
3.7 3.9
4.2
4.6
1Q14 2Q 3Q 4Q 1Q15 2Q 3Q 4Q 1Q16 2Q16
(Unit: GB)
4
Monthly LTE Data Usage per Sub
Launched Band data tariff plan
(‘15.5)
Billing ARPU Trend
Ⅰ. Business
35.3 36.0
36.4 36.7 36.3 36.6 36.7 36.7
36.3 36.2
1Q14 2Q14 3Q14 4Q14 1Q15 2Q15 3Q15 4Q15 1Q16 2Q16
(Unit : KRW thousands)
Launched unlimited LTE
data plan (‘14.4)
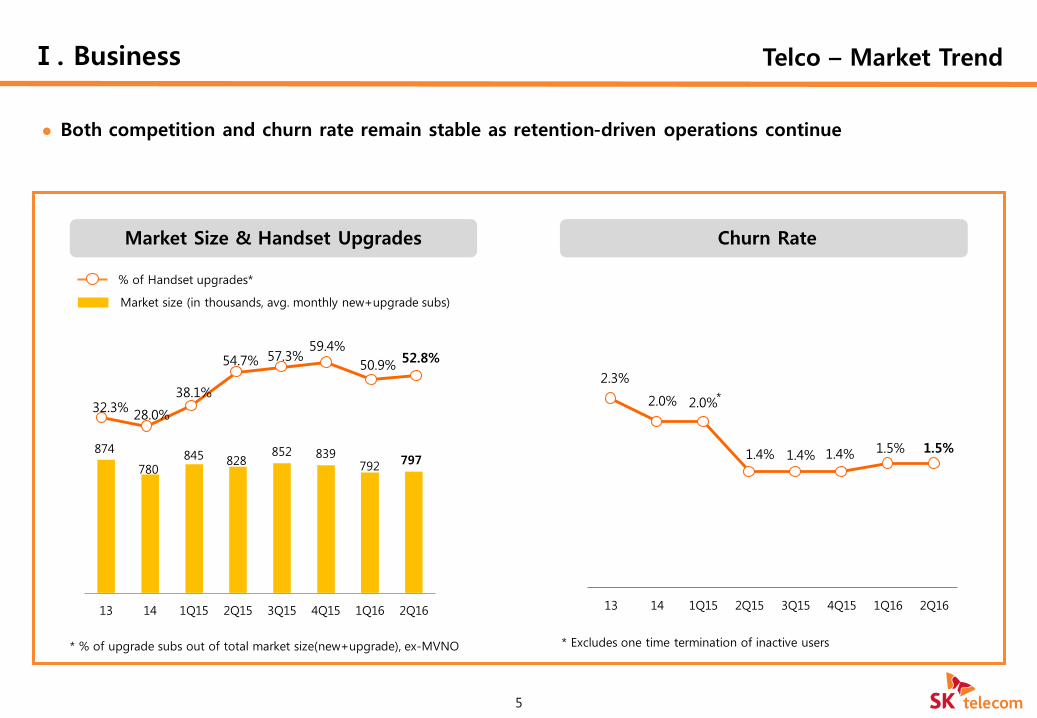
Both competition and churn rate remain stable as retention-driven operations continue
5
Market Size & Handset Upgrades Churn Rate
32.3% 28.0%
38.1%
54.7% 57.3% 59.4%
50.9% 52.8%
% of Handset upgrades*
2.3%
2.0% 2.0%
1.4% 1.4% 1.4% 1.5% 1.5%
13 14 1Q15 2Q15 3Q15 4Q15 1Q16 2Q16
*
Market size (in thousands, avg. monthly new+upgrade subs)
874
780 845 828
852 839 792
797
13 14 1Q15 2Q15 3Q15 4Q15 1Q16 2Q16
Ⅰ. Business Telco – Market Trend
* Excludes one time termination of inactive users * % of upgrade subs out of total market size(new+upgrade), ex-MVNO
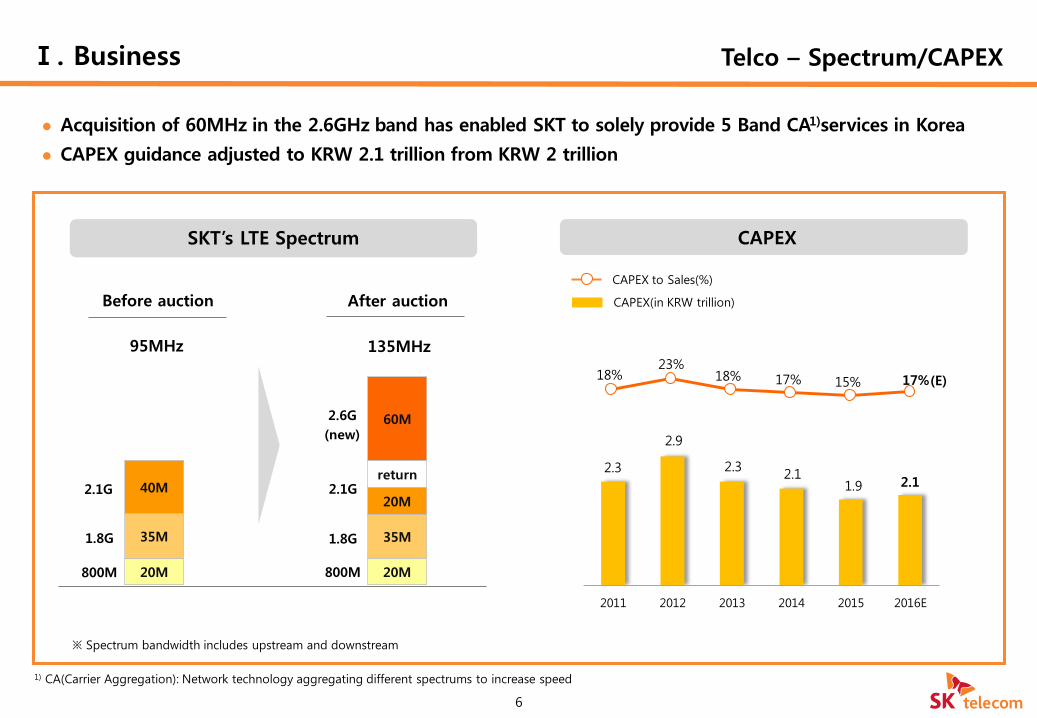
18% 23%
18% 17% 15% 17%
2.3
2.9
2.3 2.1
1.9 2.1
2011 2012 2013 2014 2015 2016E
Before auction After auction
50MHz 70MHz 30MHz
Telco – Spectrum/CAPEX
Acquisition of 60MHz in the 2.6GHz band has enabled SKT to solely provide 5 Band CA1)services in Korea
CAPEX guidance adjusted to KRW 2.1 trillion from KRW 2 trillion
6
SKT’s LTE Spectrum
Ⅰ. Business
※ Spectrum bandwidth includes upstream and downstream
95MHz 135MHz
1) CA(Carrier Aggregation): Network technology aggregating different spectrums to increase speed
40M
800M
1.8G
2.1G
20M
60M
800M
1.8G
2.6G
(new)
2.1G
35M
20M
20M
return
CAPEX to Sales(%)
CAPEX(in KRW trillion)
CAPEX
35M
(E)
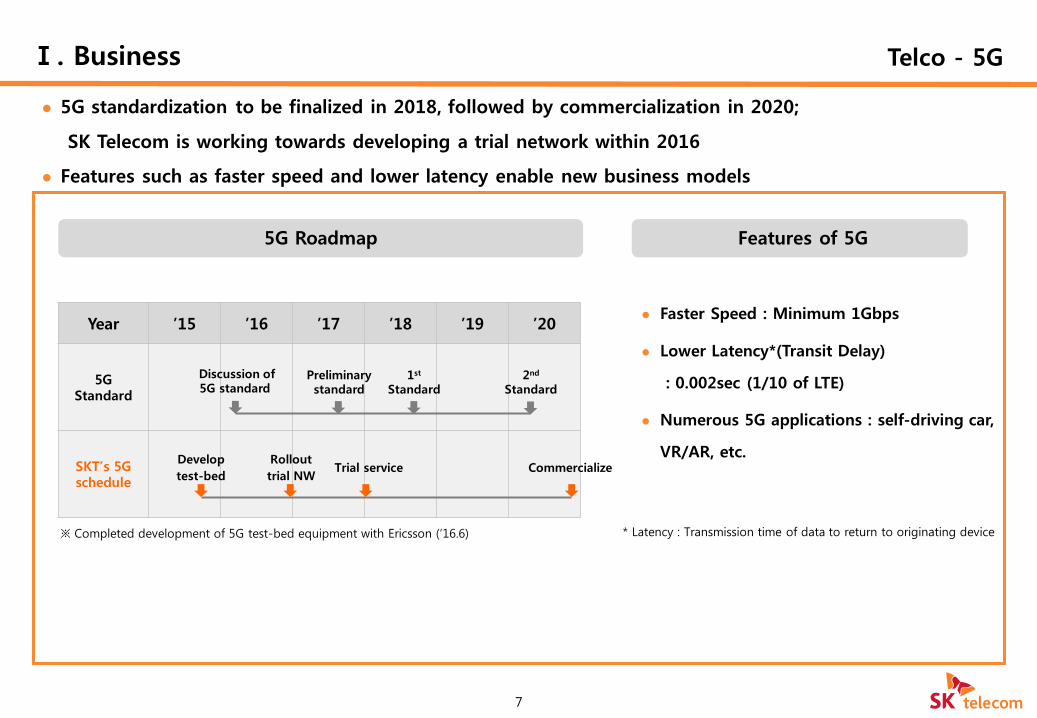
Year ’15 ’16 ’17 ’18 ’19 ’20
5G Standard
SKT’s 5G schedule
Telco - 5G
5G standardization to be finalized in 2018, followed by commercialization in 2020;
SK Telecom is working towards developing a trial network within 2016
Features such as faster speed and lower latency enable new business models
7
5G Roadmap
Discussion of 5G standard
Preliminary standard
1st Standard
2nd Standard
Develop
test-bed
Rollout
trial NW Trial service Commercialize
Ⅰ. Business
※ Completed development of 5G test-bed equipment with Ericsson (’16.6)
Features of 5G
Faster Speed : Minimum 1Gbps
Lower Latency*(Transit Delay)
: 0.002sec (1/10 of LTE)
Numerous 5G applications : self-driving car,
VR/AR, etc.
* Latency : Transmission time of data to return to originating device
Ⅰ. Business Lifestyle Enhancement
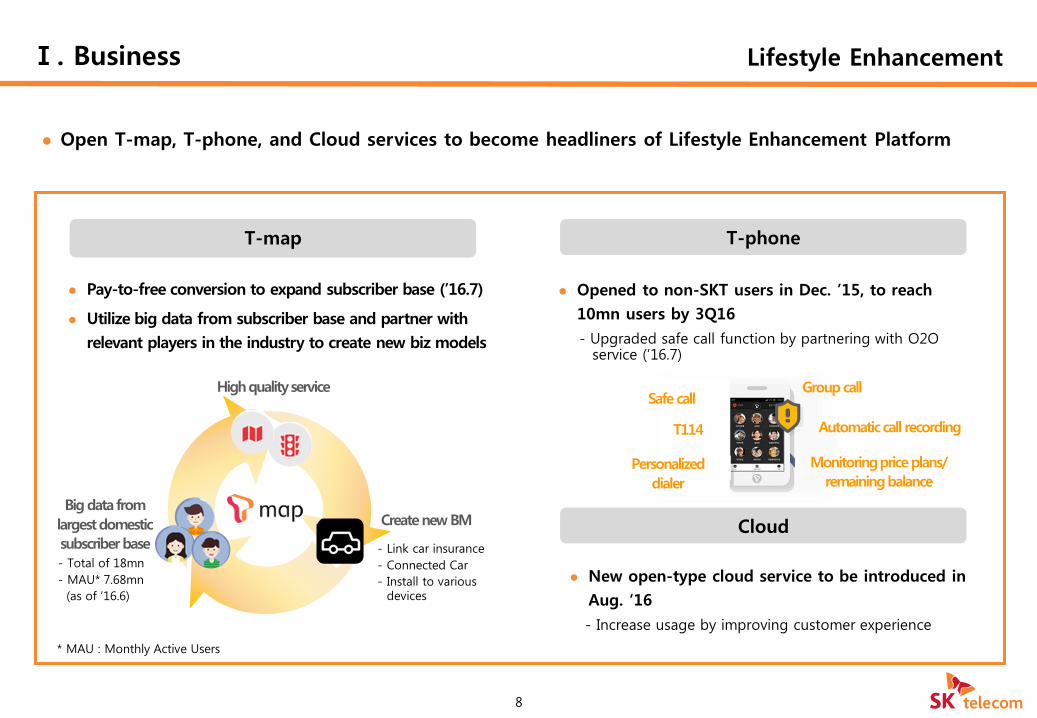
Open T-map, T-phone, and Cloud services to become headliners of Lifestyle Enhancement Platform
8
11번가 2Q 현황
Opened to non-SKT users in Dec. ’15, to reach
10mn users by 3Q16
- Upgraded safe call function by partnering with O2O service (’16.7)
T-map
* MAU : Monthly Active Users
Pay-to-free conversion to expand subscriber base (’16.7)
Utilize big data from subscriber base and partner with
relevant players in the industry to create new biz models
T-phone
Cloud Big data from
largest domestic
subscriber base
High quality service
- Total of 18mn
- MAU* 7.68mn
(as of ’16.6)
Create new BM
- Link car insurance
- Connected Car
- Install to various devices
New open-type cloud service to be introduced in
Aug. ‘16
- Increase usage by improving customer experience
Group call
Automatic call recording
Monitoring price plans/
remaining balance
T114
Personalized
dialer
Safe call
9
Media Ⅰ. Business
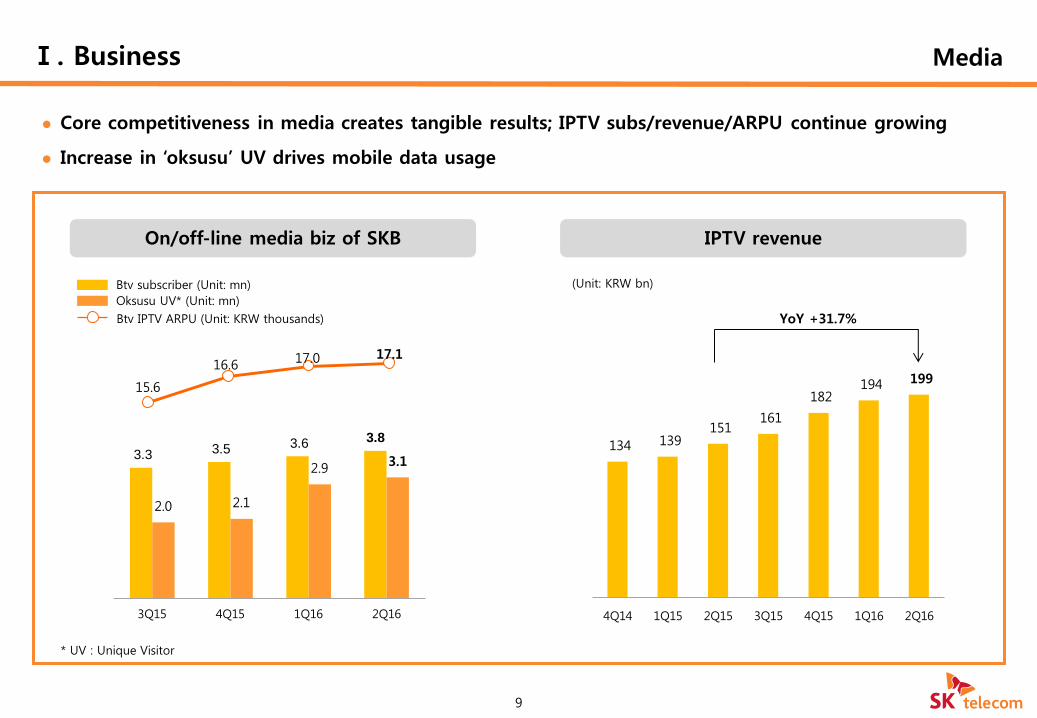
Core competitiveness in media creates tangible results; IPTV subs/revenue/ARPU continue growing
Increase in ‘oksusu’ UV drives mobile data usage
15.6
16.6 17.0 17.1
3.3 3.5 3.6 3.8
2.0 2.1
2.9 3.1
3Q15 4Q15 1Q16 2Q16
On/off-line media biz of SKB
* UV : Unique Visitor
Btv subscriber (Unit: mn)
Oksusu UV* (Unit: mn)
Btv IPTV ARPU (Unit: KRW thousands)
IPTV revenue
134 139 151
161
182 194 199
4Q14 1Q15 2Q15 3Q15 4Q15 1Q16 2Q16
YoY +31.7%
(Unit: KRW bn)
10
IoT Ⅰ. Business
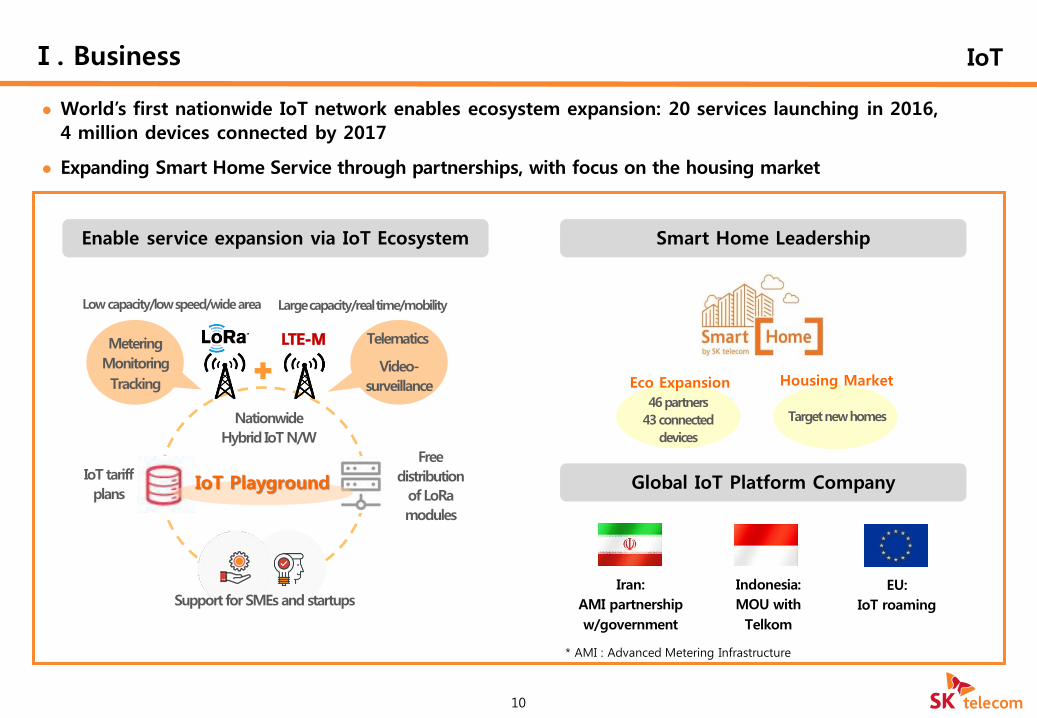
World’s first nationwide IoT network enables ecosystem expansion: 20 services launching in 2016,
4 million devices connected by 2017
Expanding Smart Home Service through partnerships, with focus on the housing market
LTE-M Metering
Monitoring
Tracking
Telematics
Video-
surveillance
Low capacity/low speed/wide area Large capacity/real time/mobility
Smart Home Leadership
Global IoT Platform Company
* AMI : Advanced Metering Infrastructure
46 partners
43 connected
devices
Target new homes
Eco Expansion Housing Market
Iran:
AMI partnership
w/government
Indonesia:
MOU with
Telkom
EU:
IoT roaming
IoT tariff
plans
Free
distribution
of LoRa
modules
IoT Playground
Enable service expansion via IoT Ecosystem
Nationwide
Hybrid IoT N/W
Support for SMEs and startups
Ⅰ. Business e-Commerce
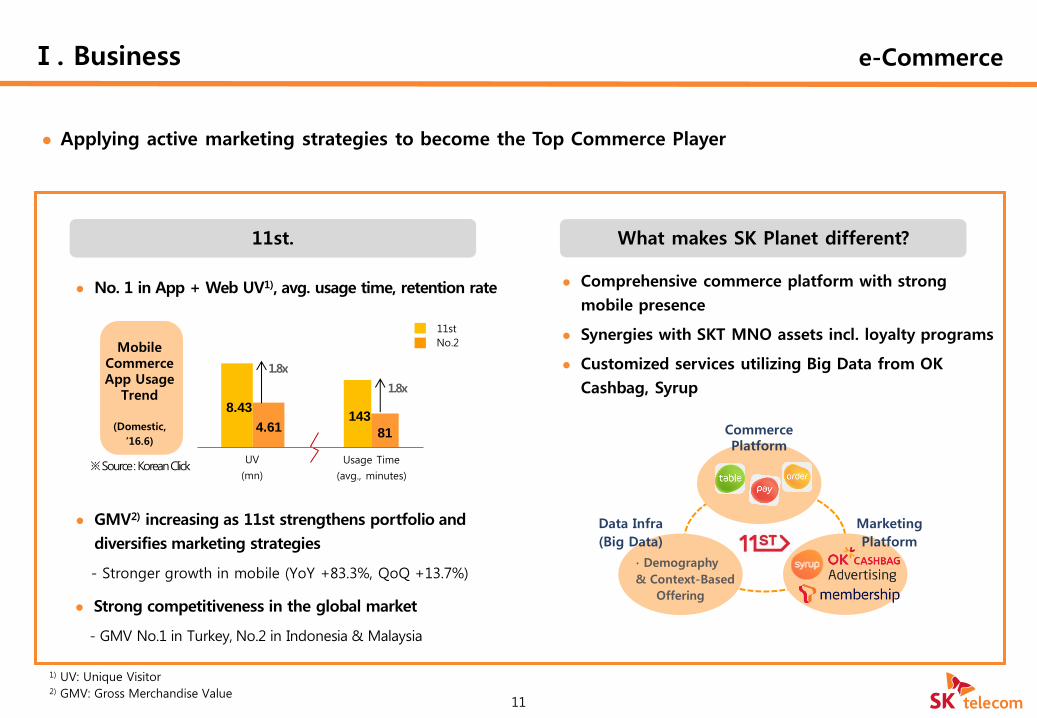
Applying active marketing strategies to become the Top Commerce Player
11
11번가 2Q 현황 What makes SK Planet different?
Comprehensive commerce platform with strong
mobile presence
Synergies with SKT MNO assets incl. loyalty programs
Customized services utilizing Big Data from OK
Cashbag, Syrup
Data Infra
(Big Data)
∙ Demography
& Context-Based
Offering
Commerce Platform
Marketing
Platform
11st.
No. 1 in App + Web UV1), avg. usage time, retention rate
1) UV: Unique Visitor 2) GMV: Gross Merchandise Value
GMV2) increasing as 11st strengthens portfolio and
diversifies marketing strategies
- Stronger growth in mobile (YoY +83.3%, QoQ +13.7%)
Strong competitiveness in the global market
- GMV No.1 in Turkey, No.2 in Indonesia & Malaysia
8.43
4.61 143
81
Mobile Commerce App Usage
Trend
(Domestic,
’16.6)
Capital Mgmt. Policy Ⅱ. Capital Mgmt.
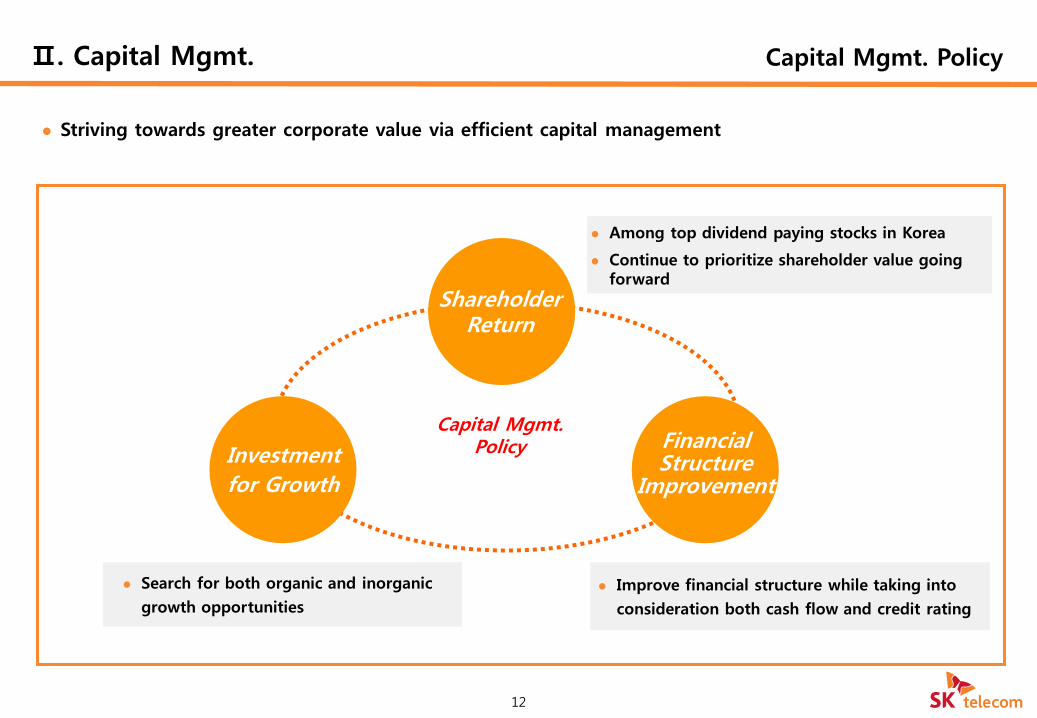
Striving towards greater corporate value via efficient capital management
12
Search for both organic and inorganic
growth opportunities
Among top dividend paying stocks in Korea
Continue to prioritize shareholder value going forward
Improve financial structure while taking into
consideration both cash flow and credit rating
Capital Mgmt. Policy
Shareholder Return
Investment
for Growth
Financial Structure
Improvement
7.7%
4.5%
0.7% Telia
Telstr
a
Tele
nor
TM
*
FET*
AT&
T
Sw
issc
om
Sin
g T
el
SKT
Verizo
n
CH
T*
Ora
nge
Axi
ata
Pro
xim
us
DT*
CM
*
CT*
NTT
CU
*
KD
DI
B. Airte
l*
SoftBank
Shareholder Return
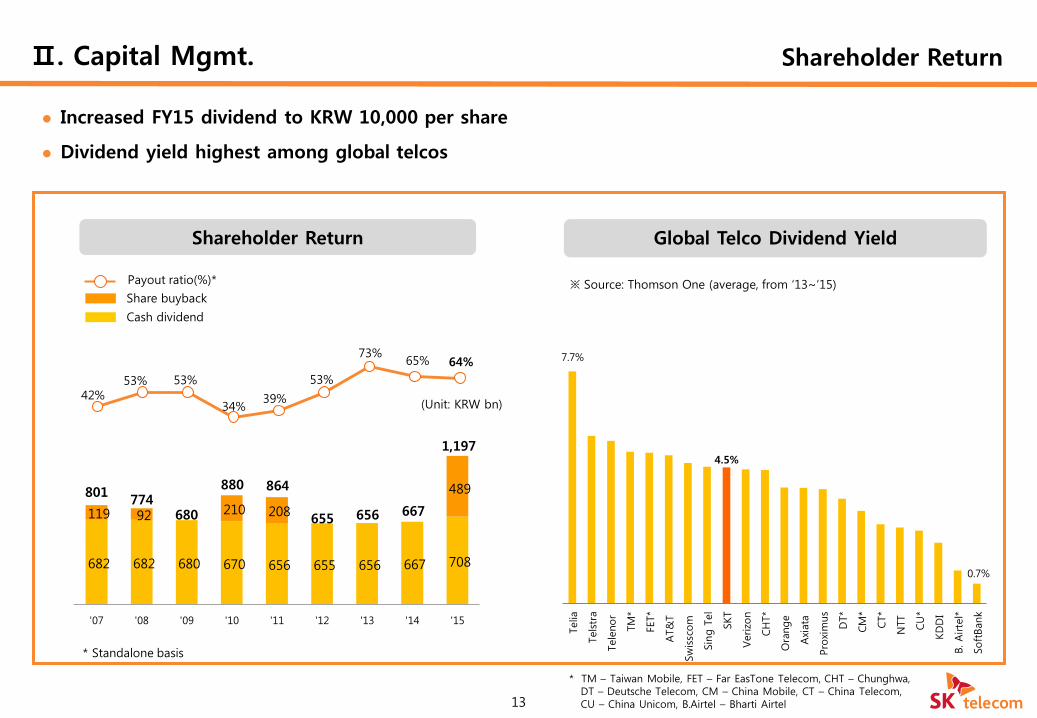
Increased FY15 dividend to KRW 10,000 per share
Dividend yield highest among global telcos
682 682 680 670 656 655 656 667 708
119 92 210 208
489
'07 '08 '09 '10 '11 '12 '13 '14 '15
42% 53% 53%
34% 39%
53%
73% 65% 64%
656 655
864 880
680 774
801
Share buyback
Cash dividend
Payout ratio(%)*
667
(Unit: KRW bn)
13
Shareholder Return
1,197
* Standalone basis
Ⅱ. Capital Mgmt.
Global Telco Dividend Yield
* TM – Taiwan Mobile, FET – Far EasTone Telecom, CHT – Chunghwa, DT – Deutsche Telecom, CM – China Mobile, CT – China Telecom, CU – China Unicom, B.Airtel – Bharti Airtel
※ Source: Thomson One (average, from ‘13~’15)
14
Consolidated Results
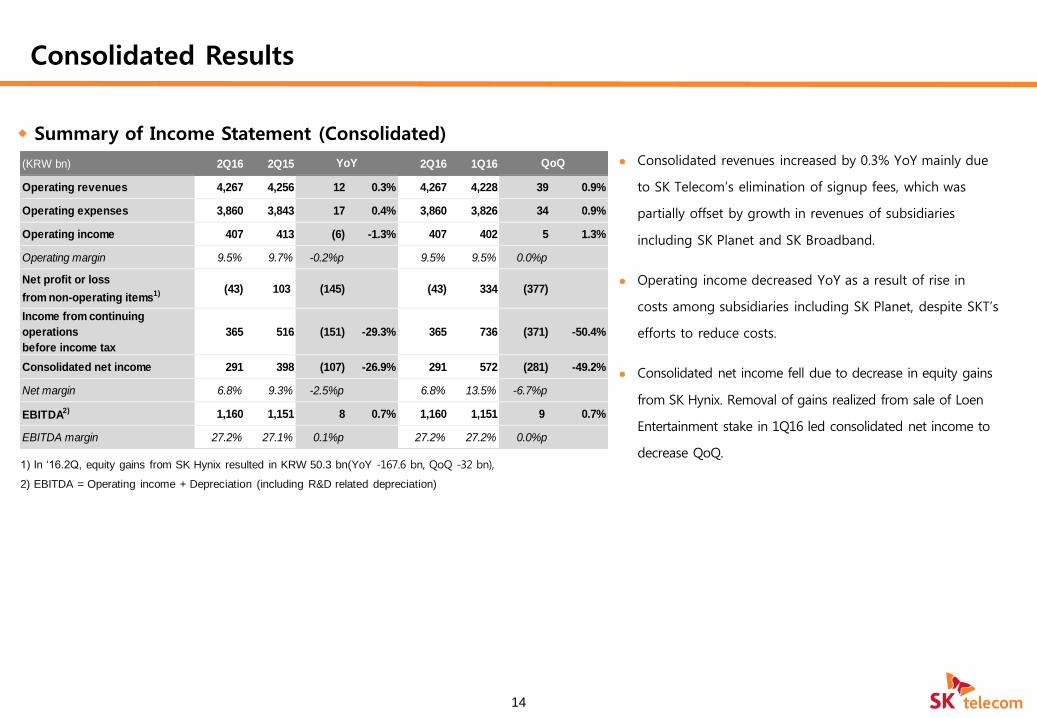
Summary of Income Statement (Consolidated)
1) In ‘16.2Q, equity gains from SK Hynix resulted in KRW 50.3 bn(YoY -167.6 bn, QoQ -32 bn),
2) EBITDA = Operating income + Depreciation (including R&D related depreciation)
Consolidated revenues increased by 0.3% YoY mainly due
to SK Telecom’s elimination of signup fees, which was
partially offset by growth in revenues of subsidiaries
including SK Planet and SK Broadband.
Operating income decreased YoY as a result of rise in
costs among subsidiaries including SK Planet, despite SKT’s
efforts to reduce costs.
Consolidated net income fell due to decrease in equity gains
from SK Hynix. Removal of gains realized from sale of Loen
Entertainment stake in 1Q16 led consolidated net income to
decrease QoQ.
(KRW bn) 2Q16 2Q15 2Q16 1Q16
Operating revenues 4,267 4,256 12 0.3% 4,267 4,228 39 0.9%
Operating expenses 3,860 3,843 17 0.4% 3,860 3,826 34 0.9%
Operating income 407 413 (6) -1.3% 407 402 5 1.3%
Operating margin 9.5% 9.7% -0.2%p 9.5% 9.5% 0.0%p
Net profit or loss
from non-operating items1) (43) 103 (145) (43) 334 (377)
Income from continuing
operations
before income tax
365 516 (151) -29.3% 365 736 (371) -50.4%
Consolidated net income 291 398 (107) -26.9% 291 572 (281) -49.2%
Net margin 6.8% 9.3% -2.5%p 6.8% 13.5% -6.7%p
EBITDA2) 1,160 1,151 8 0.7% 1,160 1,151 9 0.7%
EBITDA margin 27.2% 27.1% 0.1%p 27.2% 27.2% 0.0%p
YoY QoQ
15
Consolidated Results
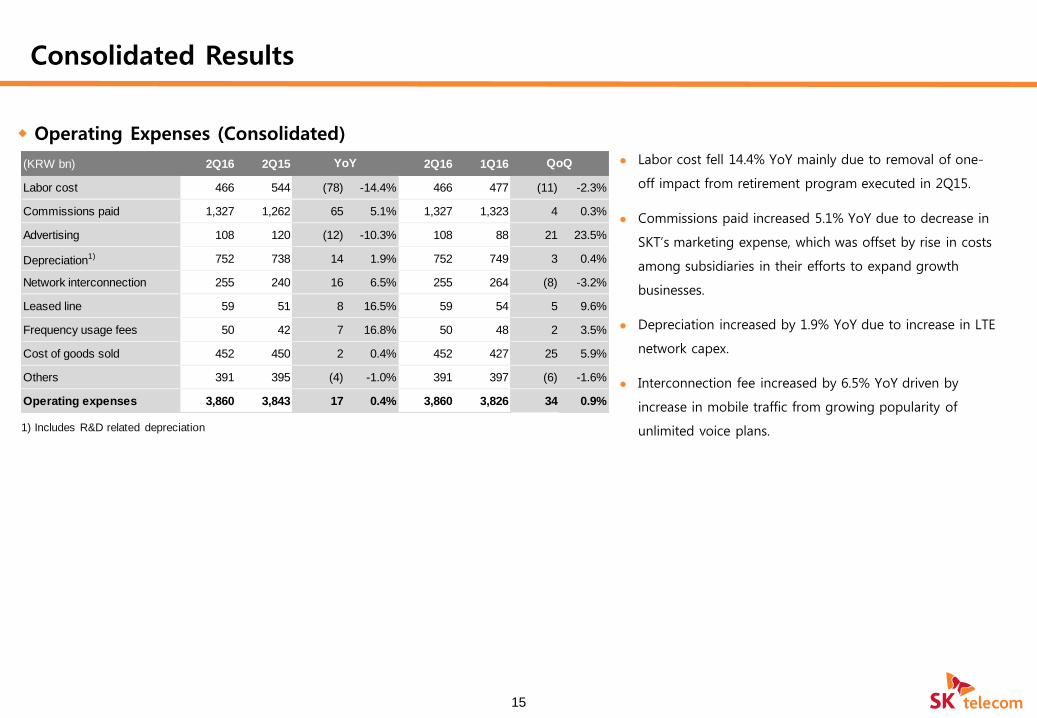
Operating Expenses (Consolidated)
1) Includes R&D related depreciation
Labor cost fell 14.4% YoY mainly due to removal of one-
off impact from retirement program executed in 2Q15.
Commissions paid increased 5.1% YoY due to decrease in
SKT’s marketing expense, which was offset by rise in costs
among subsidiaries in their efforts to expand growth
businesses.
Depreciation increased by 1.9% YoY due to increase in LTE
network capex.
Interconnection fee increased by 6.5% YoY driven by
increase in mobile traffic from growing popularity of
unlimited voice plans.
(KRW bn) 2Q16 2Q15 2Q16 1Q16
Labor cost 466 544 (78) -14.4% 466 477 (11) -2.3%
Commissions paid 1,327 1,262 65 5.1% 1,327 1,323 4 0.3%
Advertising 108 120 (12) -10.3% 108 88 21 23.5%
Depreciation1) 752 738 14 1.9% 752 749 3 0.4%
Network interconnection 255 240 16 6.5% 255 264 (8) -3.2%
Leased line 59 51 8 16.5% 59 54 5 9.6%
Frequency usage fees 50 42 7 16.8% 50 48 2 3.5%
Cost of goods sold 452 450 2 0.4% 452 427 25 5.9%
Others 391 395 (4) -1.0% 391 397 (6) -1.6%
Operating expenses 3,860 3,843 17 0.4% 3,860 3,826 34 0.9%
YoY QoQ
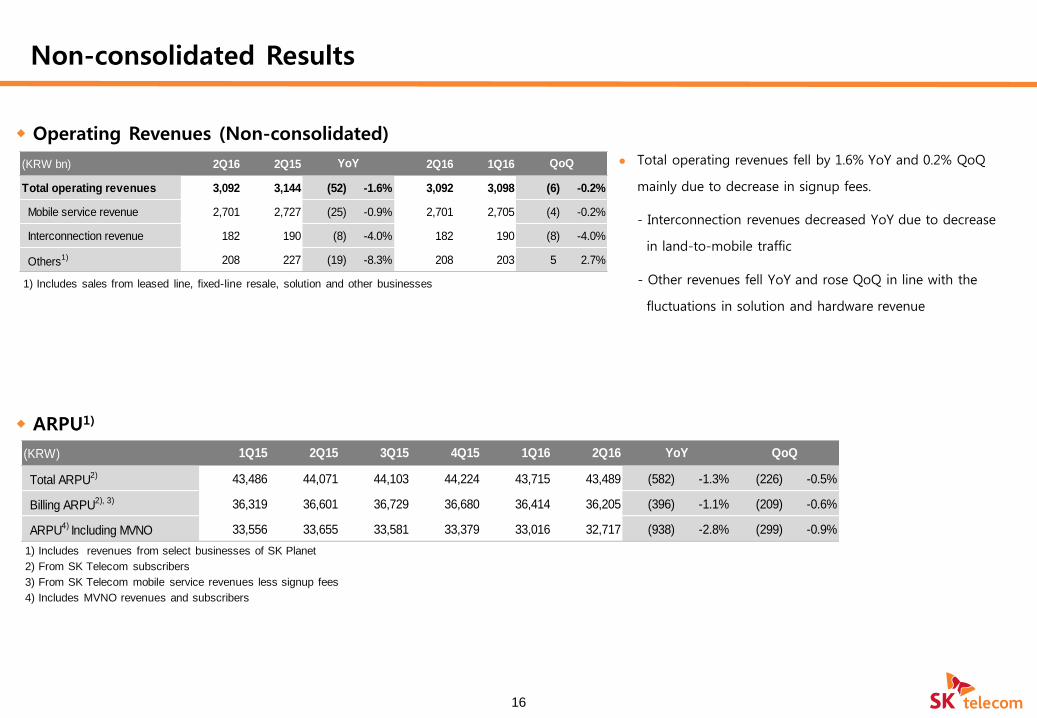
Operating Revenues (Non-consolidated)
Non-consolidated Results
Total operating revenues fell by 1.6% YoY and 0.2% QoQ
mainly due to decrease in signup fees.
- Interconnection revenues decreased YoY due to decrease
in land-to-mobile traffic
- Other revenues fell YoY and rose QoQ in line with the
fluctuations in solution and hardware revenue
1) Includes sales from leased line, fixed-line resale, solution and other businesses
16
1) Includes revenues from select businesses of SK Planet
2) From SK Telecom subscribers
3) From SK Telecom mobile service revenues less signup fees
4) Includes MVNO revenues and subscribers
ARPU1)
(KRW bn) 2Q16 2Q15 2Q16 1Q16
Total operating revenues 3,092 3,144 (52) -1.6% 3,092 3,098 (6) -0.2%
Mobile service revenue 2,701 2,727 (25) -0.9% 2,701 2,705 (4) -0.2%
Interconnection revenue 182 190 (8) -4.0% 182 190 (8) -4.0%
Others1) 208 227 (19) -8.3% 208 203 5 2.7%
YoY QoQ
(KRW) 1Q15 2Q15 3Q15 4Q15 1Q16 2Q16
Total ARPU2) 43,486 44,071 44,103 44,224 43,715 43,489 (582) -1.3% (226) -0.5%
Billing ARPU2), 3) 36,319 36,601 36,729 36,680 36,414 36,205 (396) -1.1% (209) -0.6%
ARPU4) Including MVNO 33,556 33,655 33,581 33,379 33,016 32,717 (938) -2.8% (299) -0.9%
YoY QoQ
17
Non-consolidated Results
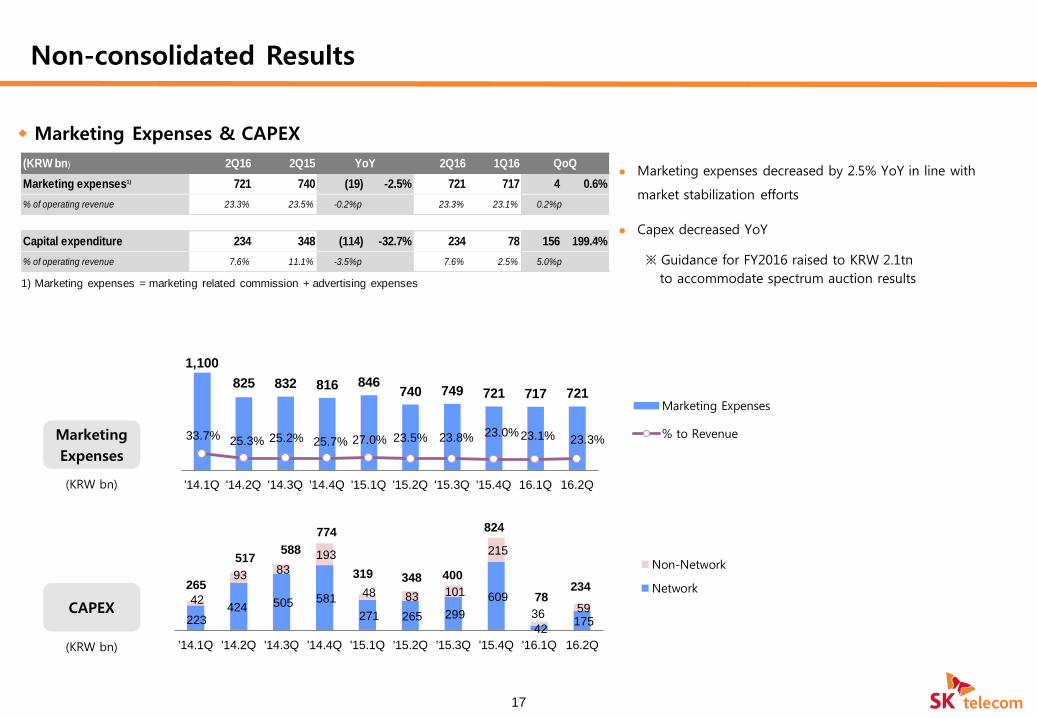
Marketing Expenses & CAPEX
Marketing expenses decreased by 2.5% YoY in line with
market stabilization efforts
Capex decreased YoY
Marketing
Expenses
CAPEX
(KRW bn)
(KRW bn)
1) Marketing expenses = marketing related commission + advertising expenses
1,100
825 832 816 846 740 749 721 717 721
33.7% 25.3% 25.2% 25.7% 27.0% 23.5% 23.8% 23.0% 23.1% 23.3%
0.0%
50.0%
100.0%
150.0%
200.0%
- 100 200 300 400 500 600 700 800 900
1,000 1,100
'14.1Q '14.2Q '14.3Q '14.4Q '15.1Q '15.2Q '15.3Q '15.4Q 16.1Q 16.2Q
Marketing Expenses
% to Revenue
223 424 505 581
271 265 299
609
42 175
42
93 83
193
48 83 101
215
36 59
'14.1Q '14.2Q '14.3Q '14.4Q '15.1Q '15.2Q '15.3Q '15.4Q '16.1Q 16.2Q
Non-Network
Network
824
265
588 517
774
319 348 400
78 234
(KRW bn) 2Q16 2Q15 2Q16 1Q16
Marketing expenses1) 721 740 (19) -2.5% 721 717 4 0.6%
% of operating revenue 23.3% 23.5% -0.2%p 23.3% 23.1% 0.2%p
Capital expenditure 234 348 (114) -32.7% 234 78 156 199.4%
% of operating revenue 7.6% 11.1% -3.5%p 7.6% 2.5% 5.0%p
YoY QoQ
※ Guidance for FY2016 raised to KRW 2.1tn
to accommodate spectrum auction results
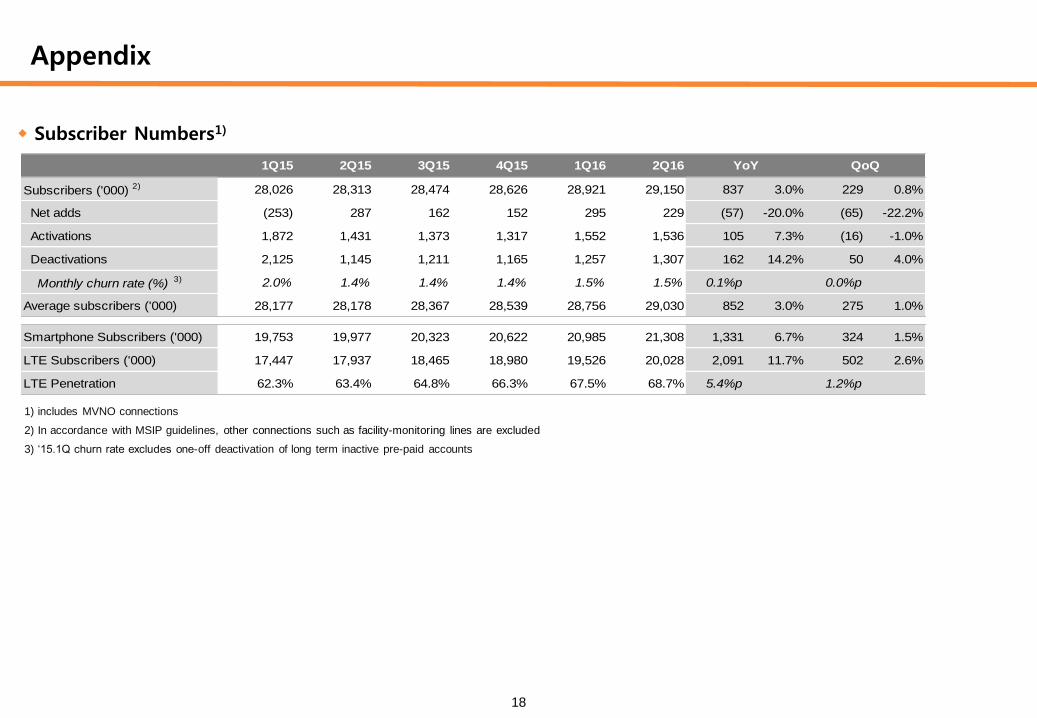
Subscriber Numbers1)
Appendix
2) In accordance with MSIP guidelines, other connections such as facility-monitoring lines are excluded
3) ‘15.1Q churn rate excludes one-off deactivation of long term inactive pre-paid accounts
18
1) includes MVNO connections
1Q15 2Q15 3Q15 4Q15 1Q16 2Q16
Subscribers ('000) 2) 28,026 28,313 28,474 28,626 28,921 29,150 837 3.0% 229 0.8%
Net adds (253) 287 162 152 295 229 (57) -20.0% (65) -22.2%
Activations 1,872 1,431 1,373 1,317 1,552 1,536 105 7.3% (16) -1.0%
Deactivations 2,125 1,145 1,211 1,165 1,257 1,307 162 14.2% 50 4.0%
Monthly churn rate (%) 3) 2.0% 1.4% 1.4% 1.4% 1.5% 1.5% 0.1%p 0.0%p
Average subscribers ('000) 28,177 28,178 28,367 28,539 28,756 29,030 852 3.0% 275 1.0%
Smartphone Subscribers ('000) 19,753 19,977 20,323 20,622 20,985 21,308 1,331 6.7% 324 1.5%
LTE Subscribers ('000) 17,447 17,937 18,465 18,980 19,526 20,028 2,091 11.7% 502 2.6%
LTE Penetration 62.3% 63.4% 64.8% 66.3% 67.5% 68.7% 5.4%p 1.2%p
YoY QoQ
19
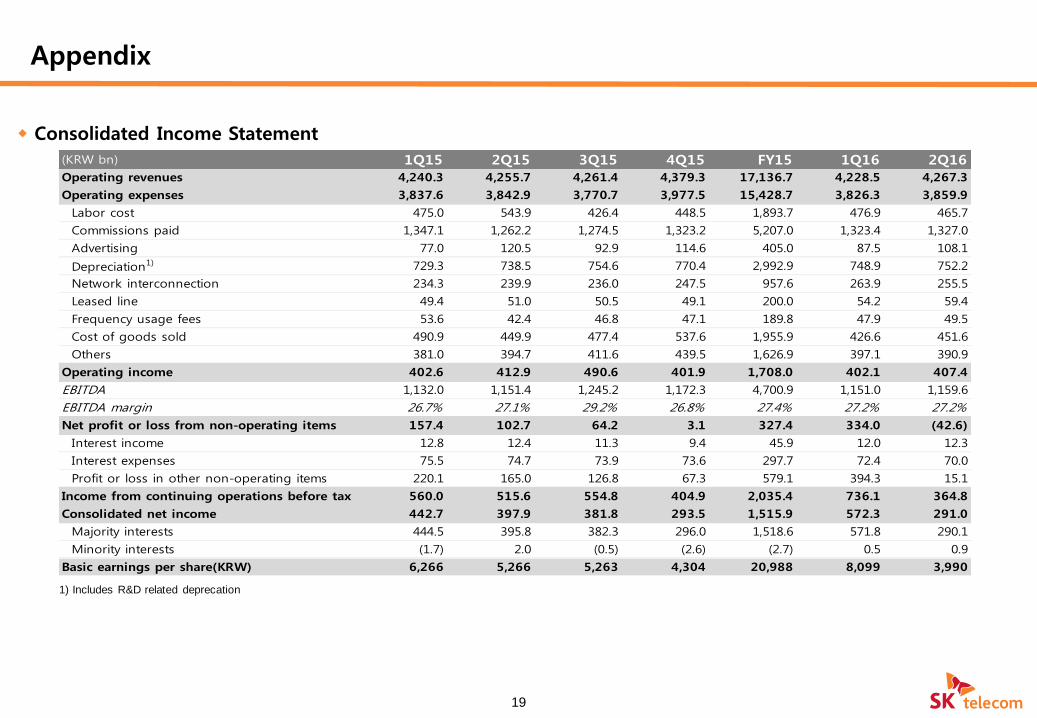
Consolidated Income Statement
Appendix
1) Includes R&D related deprecation
(KRW bn) 1Q15 2Q15 3Q15 4Q15 FY15 1Q16 2Q16
Operating revenues 4,240.3 4,255.7 4,261.4 4,379.3 17,136.7 4,228.5 4,267.3
Operating expenses 3,837.6 3,842.9 3,770.7 3,977.5 15,428.7 3,826.3 3,859.9
Labor cost 475.0 543.9 426.4 448.5 1,893.7 476.9 465.7
Commissions paid 1,347.1 1,262.2 1,274.5 1,323.2 5,207.0 1,323.4 1,327.0
Advertising 77.0 120.5 92.9 114.6 405.0 87.5 108.1
Depreciation1) 729.3 738.5 754.6 770.4 2,992.9 748.9 752.2
Network interconnection 234.3 239.9 236.0 247.5 957.6 263.9 255.5
Leased line 49.4 51.0 50.5 49.1 200.0 54.2 59.4
Frequency usage fees 53.6 42.4 46.8 47.1 189.8 47.9 49.5
Cost of goods sold 490.9 449.9 477.4 537.6 1,955.9 426.6 451.6
Others 381.0 394.7 411.6 439.5 1,626.9 397.1 390.9
Operating income 402.6 412.9 490.6 401.9 1,708.0 402.1 407.4
EBITDA 1,132.0 1,151.4 1,245.2 1,172.3 4,700.9 1,151.0 1,159.6
EBITDA margin 26.7% 27.1% 29.2% 26.8% 27.4% 27.2% 27.2%
Net profit or loss from non-operating items 157.4 102.7 64.2 3.1 327.4 334.0 (42.6)
Interest income 12.8 12.4 11.3 9.4 45.9 12.0 12.3
Interest expenses 75.5 74.7 73.9 73.6 297.7 72.4 70.0
Profit or loss in other non-operating items 220.1 165.0 126.8 67.3 579.1 394.3 15.1
Income from continuing operations before tax 560.0 515.6 554.8 404.9 2,035.4 736.1 364.8
Consolidated net income 442.7 397.9 381.8 293.5 1,515.9 572.3 291.0
Majority interests 444.5 395.8 382.3 296.0 1,518.6 571.8 290.1
Minority interests (1.7) 2.0 (0.5) (2.6) (2.7) 0.5 0.9
Basic earnings per share(KRW) 6,266 5,266 5,263 4,304 20,988 8,099 3,990
20
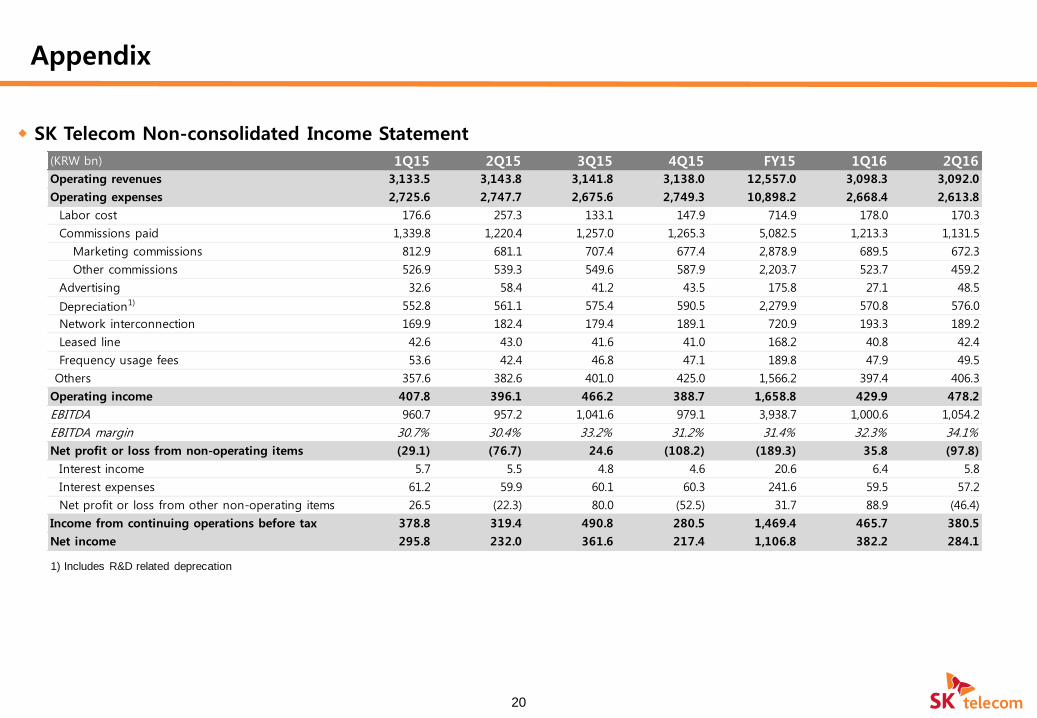
Appendix
SK Telecom Non-consolidated Income Statement
1) Includes R&D related deprecation
(KRW bn) 1Q15 2Q15 3Q15 4Q15 FY15 1Q16 2Q16
Operating revenues 3,133.5 3,143.8 3,141.8 3,138.0 12,557.0 3,098.3 3,092.0
Operating expenses 2,725.6 2,747.7 2,675.6 2,749.3 10,898.2 2,668.4 2,613.8
Labor cost 176.6 257.3 133.1 147.9 714.9 178.0 170.3
Commissions paid 1,339.8 1,220.4 1,257.0 1,265.3 5,082.5 1,213.3 1,131.5
Marketing commissions 812.9 681.1 707.4 677.4 2,878.9 689.5 672.3
Other commissions 526.9 539.3 549.6 587.9 2,203.7 523.7 459.2
Advertising 32.6 58.4 41.2 43.5 175.8 27.1 48.5
Depreciation1) 552.8 561.1 575.4 590.5 2,279.9 570.8 576.0
Network interconnection 169.9 182.4 179.4 189.1 720.9 193.3 189.2
Leased line 42.6 43.0 41.6 41.0 168.2 40.8 42.4
Frequency usage fees 53.6 42.4 46.8 47.1 189.8 47.9 49.5
Others 357.6 382.6 401.0 425.0 1,566.2 397.4 406.3
Operating income 407.8 396.1 466.2 388.7 1,658.8 429.9 478.2
EBITDA 960.7 957.2 1,041.6 979.1 3,938.7 1,000.6 1,054.2
EBITDA margin 30.7% 30.4% 33.2% 31.2% 31.4% 32.3% 34.1%
Net profit or loss from non-operating items (29.1) (76.7) 24.6 (108.2) (189.3) 35.8 (97.8)
Interest income 5.7 5.5 4.8 4.6 20.6 6.4 5.8
Interest expenses 61.2 59.9 60.1 60.3 241.6 59.5 57.2
Net profit or loss from other non-operating items 26.5 (22.3) 80.0 (52.5) 31.7 88.9 (46.4)
Income from continuing operations before tax 378.8 319.4 490.8 280.5 1,469.4 465.7 380.5
Net income 295.8 232.0 361.6 217.4 1,106.8 382.2 284.1
21
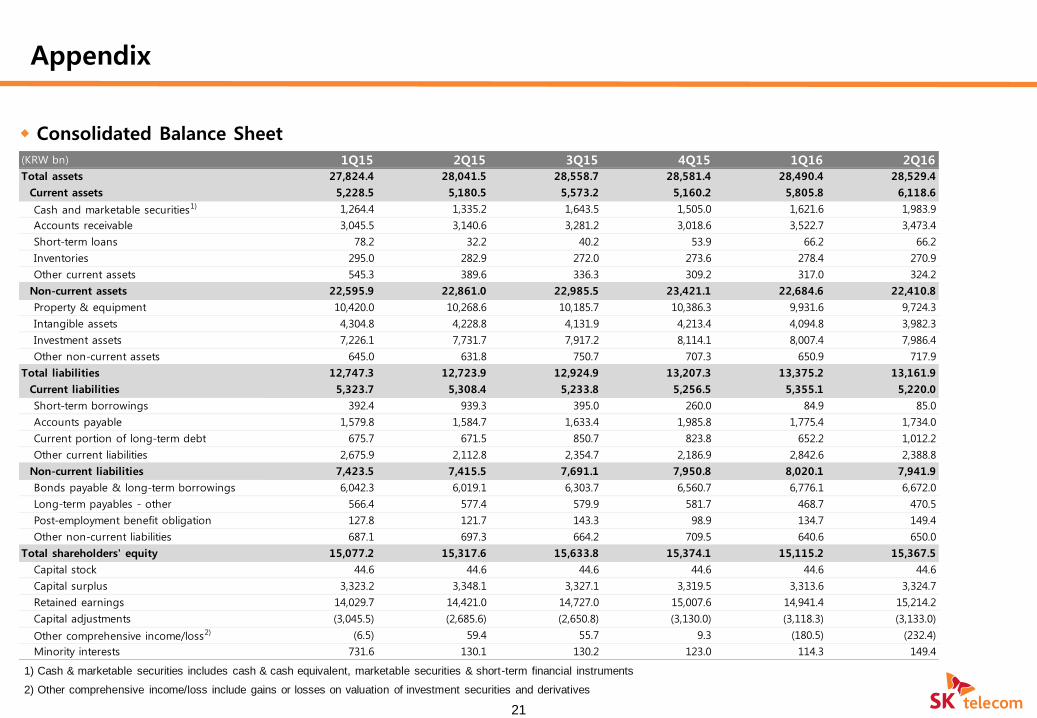
Appendix
Consolidated Balance Sheet
1) Cash & marketable securities includes cash & cash equivalent, marketable securities & short-term financial instruments
2) Other comprehensive income/loss include gains or losses on valuation of investment securities and derivatives
(KRW bn) 1Q15 2Q15 3Q15 4Q15 1Q16 2Q16
Total assets 27,824.4 28,041.5 28,558.7 28,581.4 28,490.4 28,529.4
Current assets 5,228.5 5,180.5 5,573.2 5,160.2 5,805.8 6,118.6
Cash and marketable securities1) 1,264.4 1,335.2 1,643.5 1,505.0 1,621.6 1,983.9
Accounts receivable 3,045.5 3,140.6 3,281.2 3,018.6 3,522.7 3,473.4
Short-term loans 78.2 32.2 40.2 53.9 66.2 66.2
Inventories 295.0 282.9 272.0 273.6 278.4 270.9
Other current assets 545.3 389.6 336.3 309.2 317.0 324.2
Non-current assets 22,595.9 22,861.0 22,985.5 23,421.1 22,684.6 22,410.8
Property & equipment 10,420.0 10,268.6 10,185.7 10,386.3 9,931.6 9,724.3
Intangible assets 4,304.8 4,228.8 4,131.9 4,213.4 4,094.8 3,982.3
Investment assets 7,226.1 7,731.7 7,917.2 8,114.1 8,007.4 7,986.4
Other non-current assets 645.0 631.8 750.7 707.3 650.9 717.9
Total liabilities 12,747.3 12,723.9 12,924.9 13,207.3 13,375.2 13,161.9
Current liabilities 5,323.7 5,308.4 5,233.8 5,256.5 5,355.1 5,220.0
Short-term borrowings 392.4 939.3 395.0 260.0 84.9 85.0
Accounts payable 1,579.8 1,584.7 1,633.4 1,985.8 1,775.4 1,734.0
Current portion of long-term debt 675.7 671.5 850.7 823.8 652.2 1,012.2
Other current liabilities 2,675.9 2,112.8 2,354.7 2,186.9 2,842.6 2,388.8
Non-current liabilities 7,423.5 7,415.5 7,691.1 7,950.8 8,020.1 7,941.9
Bonds payable & long-term borrowings 6,042.3 6,019.1 6,303.7 6,560.7 6,776.1 6,672.0
Long-term payables - other 566.4 577.4 579.9 581.7 468.7 470.5
Post-employment benefit obligation 127.8 121.7 143.3 98.9 134.7 149.4
Other non-current liabilities 687.1 697.3 664.2 709.5 640.6 650.0
Total shareholders' equity 15,077.2 15,317.6 15,633.8 15,374.1 15,115.2 15,367.5
Capital stock 44.6 44.6 44.6 44.6 44.6 44.6
Capital surplus 3,323.2 3,348.1 3,327.1 3,319.5 3,313.6 3,324.7
Retained earnings 14,029.7 14,421.0 14,727.0 15,007.6 14,941.4 15,214.2
Capital adjustments (3,045.5) (2,685.6) (2,650.8) (3,130.0) (3,118.3) (3,133.0)
Other comprehensive income/loss2) (6.5) 59.4 55.7 9.3 (180.5) (232.4)
Minority interests 731.6 130.1 130.2 123.0 114.3 149.4
22
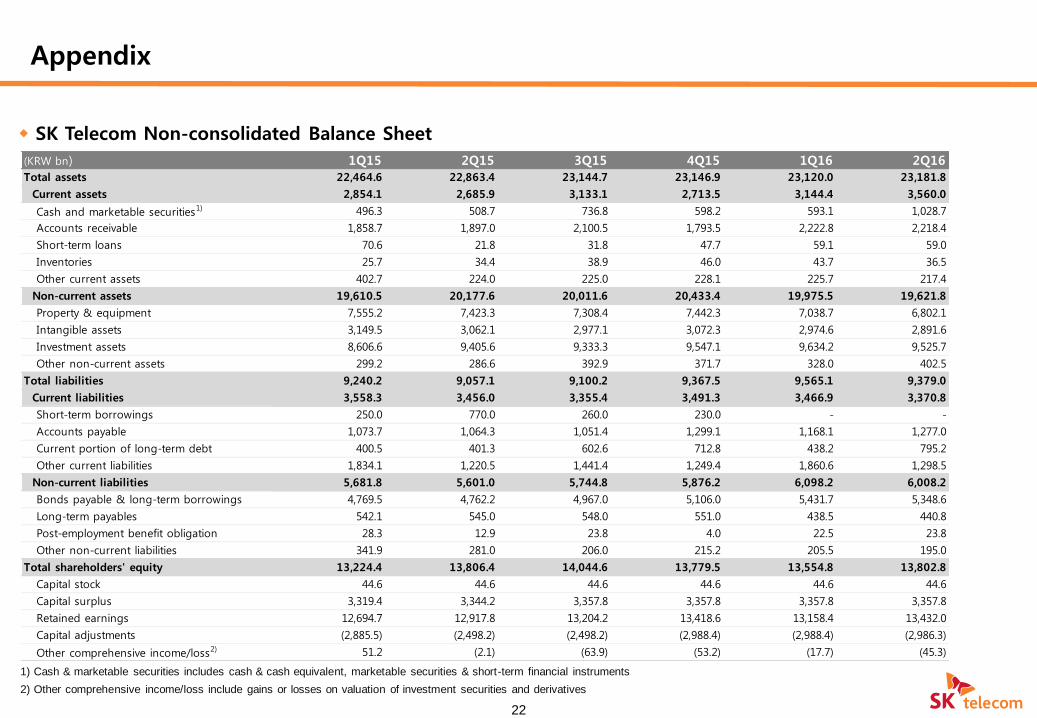
SK Telecom Non-consolidated Balance Sheet
Appendix
1) Cash & marketable securities includes cash & cash equivalent, marketable securities & short-term financial instruments
2) Other comprehensive income/loss include gains or losses on valuation of investment securities and derivatives
(KRW bn) 1Q15 2Q15 3Q15 4Q15 1Q16 2Q16
Total assets 22,464.6 22,863.4 23,144.7 23,146.9 23,120.0 23,181.8
Current assets 2,854.1 2,685.9 3,133.1 2,713.5 3,144.4 3,560.0
Cash and marketable securities1) 496.3 508.7 736.8 598.2 593.1 1,028.7
Accounts receivable 1,858.7 1,897.0 2,100.5 1,793.5 2,222.8 2,218.4
Short-term loans 70.6 21.8 31.8 47.7 59.1 59.0
Inventories 25.7 34.4 38.9 46.0 43.7 36.5
Other current assets 402.7 224.0 225.0 228.1 225.7 217.4
Non-current assets 19,610.5 20,177.6 20,011.6 20,433.4 19,975.5 19,621.8
Property & equipment 7,555.2 7,423.3 7,308.4 7,442.3 7,038.7 6,802.1
Intangible assets 3,149.5 3,062.1 2,977.1 3,072.3 2,974.6 2,891.6
Investment assets 8,606.6 9,405.6 9,333.3 9,547.1 9,634.2 9,525.7
Other non-current assets 299.2 286.6 392.9 371.7 328.0 402.5
Total liabilities 9,240.2 9,057.1 9,100.2 9,367.5 9,565.1 9,379.0
Current liabilities 3,558.3 3,456.0 3,355.4 3,491.3 3,466.9 3,370.8
Short-term borrowings 250.0 770.0 260.0 230.0 - -
Accounts payable 1,073.7 1,064.3 1,051.4 1,299.1 1,168.1 1,277.0
Current portion of long-term debt 400.5 401.3 602.6 712.8 438.2 795.2
Other current liabilities 1,834.1 1,220.5 1,441.4 1,249.4 1,860.6 1,298.5
Non-current liabilities 5,681.8 5,601.0 5,744.8 5,876.2 6,098.2 6,008.2
Bonds payable & long-term borrowings 4,769.5 4,762.2 4,967.0 5,106.0 5,431.7 5,348.6
Long-term payables 542.1 545.0 548.0 551.0 438.5 440.8
Post-employment benefit obligation 28.3 12.9 23.8 4.0 22.5 23.8
Other non-current liabilities 341.9 281.0 206.0 215.2 205.5 195.0
Total shareholders' equity 13,224.4 13,806.4 14,044.6 13,779.5 13,554.8 13,802.8
Capital stock 44.6 44.6 44.6 44.6 44.6 44.6
Capital surplus 3,319.4 3,344.2 3,357.8 3,357.8 3,357.8 3,357.8
Retained earnings 12,694.7 12,917.8 13,204.2 13,418.6 13,158.4 13,432.0
Capital adjustments (2,885.5) (2,498.2) (2,498.2) (2,988.4) (2,988.4) (2,986.3)
Other comprehensive income/loss2) 51.2 (2.1) (63.9) (53.2) (17.7) (45.3)