Embed Size (px)
Citation preview
April 2016
SK telecom Investor Presentation
April 2016
8 CONSECUTIVE MEMBER OF

Disclaimer
This presentation contains forward-looking statements with respect to the financial condition, results of operations
and business of SK Telecom and its subsidiaries (the “Company”) and plans and objectives of the management of
the Company. The aforementioned forward-looking statements are influenced by unknown risks, uncertainties and
other factors which may change the actual results or performance of the Company.
The Company does not make any representation or warranty, expressed or implied, as to the accuracy or
completeness of the information contained in this management presentation, and nothing contained herein is, or
shall be relied upon as, a promise or representation, whether as to the past or the future.
Therefore, this presentation contained herein should not be utilized for any legal purposes in regards to investors’
investment results. The Company hereby expressly disclaims any and all liability for any loss or damage resulting
from the investors’ reliance on the information contained herein.
This presentation only speaks the informations as of the date they are made, and the Company undertakes no
obligation to update publicly any of them in light of new information or future events.
Table of Contents
3
14
16
18
Ⅰ. Key Takeaways
Ⅱ. Consolidated Results
Ⅲ. Non-consolidated Results
Appendix
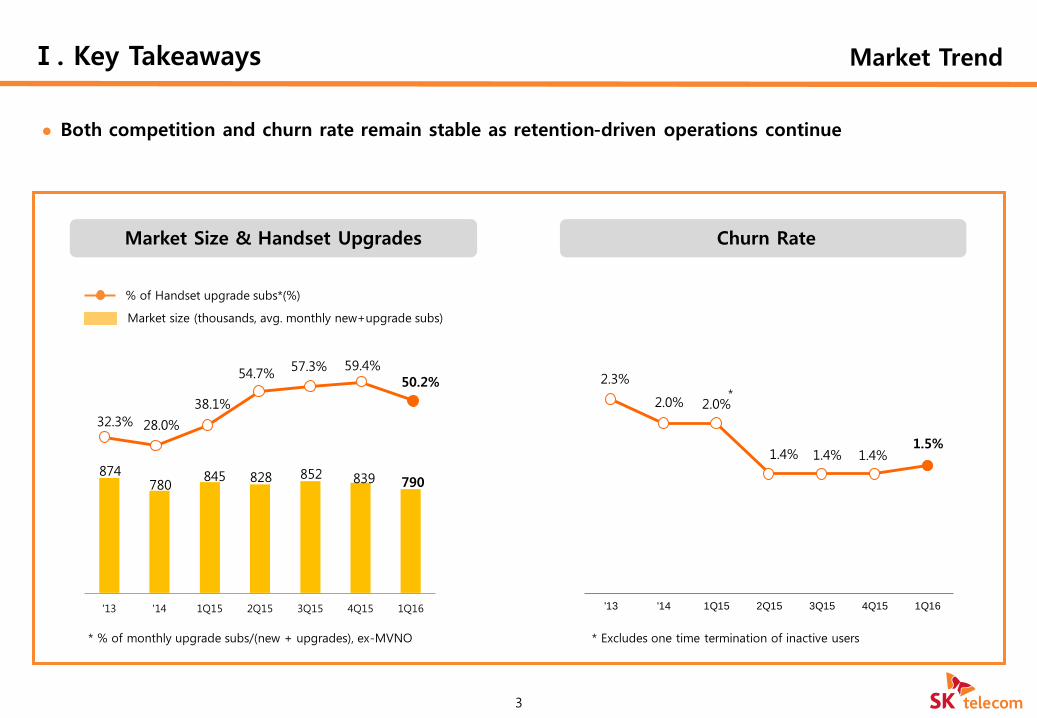
Market Trend Ⅰ. Key Takeaways
Both competition and churn rate remain stable as retention-driven operations continue
3
Market Size & Handset Upgrades Churn Rate
32.3% 28.0%
38.1%
54.7% 57.3% 59.4%
50.2%
% of Handset upgrade subs*(%)
2.3%
2.0% 2.0%
1.4% 1.4% 1.4% 1.5%
'13 '14 1Q15 2Q15 3Q15 4Q15 1Q16
*
Market size (thousands, avg. monthly new+upgrade subs)
874 780
845 828 852 839 790
'13 '14 1Q15 2Q15 3Q15 4Q15 1Q16
* % of monthly upgrade subs/(new + upgrades), ex-MVNO * Excludes one time termination of inactive users
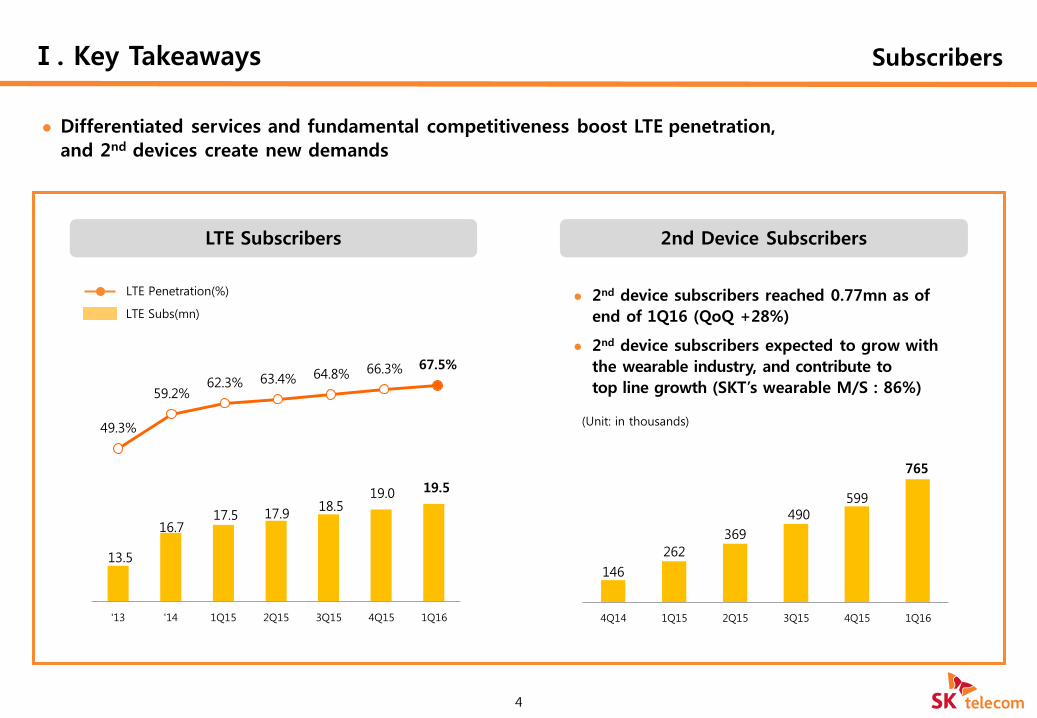
Ⅰ. Key Takeaways
Differentiated services and fundamental competitiveness boost LTE penetration,
and 2nd devices create new demands
Subscribers
2nd Device Subscribers
4
LTE Penetration(%)
LTE Subs(mn)
LTE Subscribers
49.3%
59.2% 62.3% 63.4% 64.8% 66.3% 67.5%
13.5
16.7 17.5 17.9
18.5 19.0 19.5
'13 '14 1Q15 2Q15 3Q15 4Q15 1Q16
146
262
369
490 599
765
4Q14 1Q15 2Q15 3Q15 4Q15 1Q16
2nd device subscribers reached 0.77mn as of
end of 1Q16 (QoQ +28%)
2nd device subscribers expected to grow with
the wearable industry, and contribute to
top line growth (SKT’s wearable M/S : 86%)
(Unit: in thousands)

Ⅰ. Key Takeaways Platform Strategy
5
MNO*
Explore MNO-related business Offer diverse on/off-line converged
service platform
Intelligent Life
Partner
Provide artificial intelligence based, personalized services across all aspects of
life
Transformation
MNO Infrastructure
Customer
(Telco Only)
Tariff Telco
Service
Growth
Business
Next Generation Platform Player
Customer
(Telco + Platform)
Service Fee Telco
+ Converged Services
Lifestyle Enhance-
ment IoT 3 Platforms Media
SK Telecom is being transformed into a next generation platform player
* MNO : Mobile Network Operator
6
Lifestyle Enhancement Platform Ⅰ. Key Takeaways
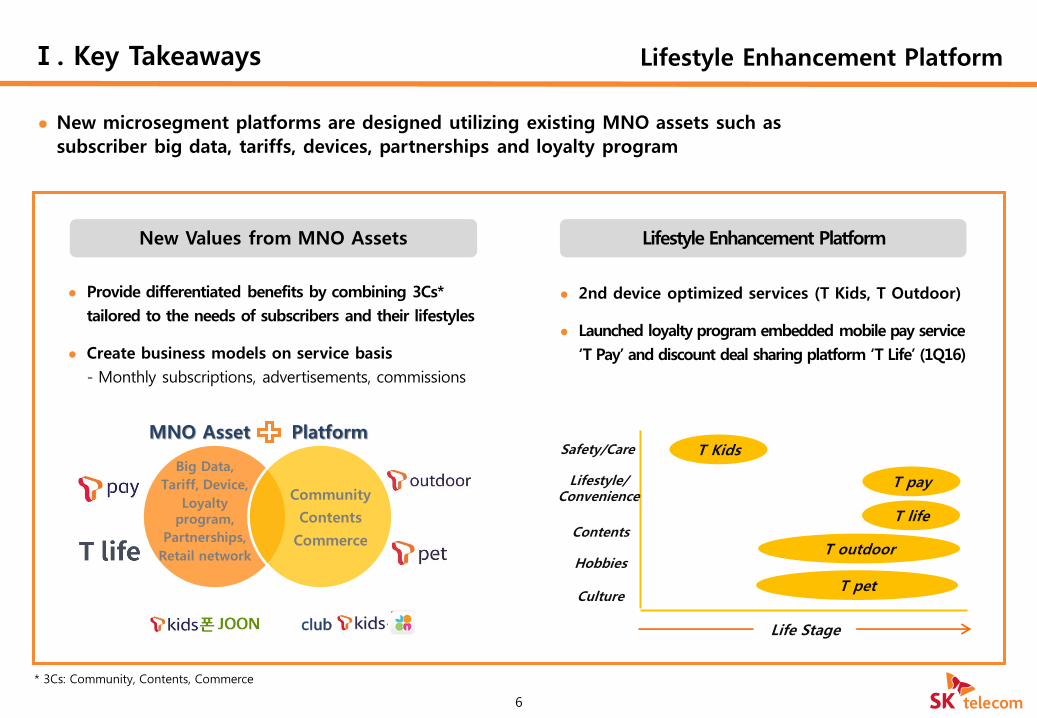
New microsegment platforms are designed utilizing existing MNO assets such as
subscriber big data, tariffs, devices, partnerships and loyalty program
Safety/Care
Lifestyle/ Convenience
Contents
Culture
Hobbies
Life Stage
New Values from MNO Assets
T Kids
T pay
T life
T outdoor
T pet
2nd device optimized services (T Kids, T Outdoor)
Launched loyalty program embedded mobile pay service
‘T Pay’ and discount deal sharing platform ‘T Life’ (1Q16)
Lifestyle Enhancement Platform
Provide differentiated benefits by combining 3Cs*
tailored to the needs of subscribers and their lifestyles
Create business models on service basis
- Monthly subscriptions, advertisements, commissions
* 3Cs: Community, Contents, Commerce
Community
Contents
Commerce
MNO Asset Platform
club
Big Data,
Tariff, Device,
Loyalty program,
Partnerships,
Retail network
Entrance of traditional media &
heterogeneous industry to new media
7
Media Platform Ⅰ. Key Takeaways
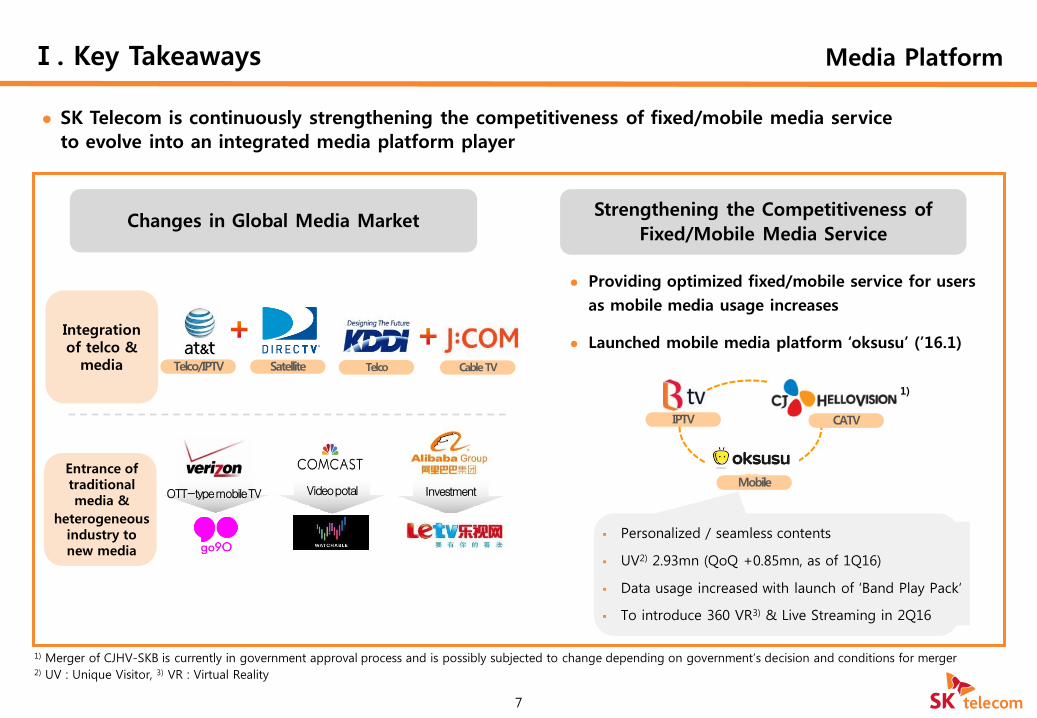
SK Telecom is continuously strengthening the competitiveness of fixed/mobile media service
to evolve into an integrated media platform player
Providing optimized fixed/mobile service for users
as mobile media usage increases
Launched mobile media platform ‘oksusu’ (’16.1)
Personalized / seamless contents
UV2) 2.93mn (QoQ +0.85mn, as of 1Q16)
Data usage increased with launch of ‘Band Play Pack‘
To introduce 360 VR3) & Live Streaming in 2Q16
Changes in Global Media Market Strengthening the Competitiveness of
Fixed/Mobile Media Service
Integration of telco &
media
1) Merger of CJHV-SKB is currently in government approval process and is possibly subjected to change depending on government’s decision and conditions for merger 2) UV : Unique Visitor, 3) VR : Virtual Reality
1)
1) LoRa : Low power, low cost, low speed telecommunication technology optimized for long range and IoT 2) LTE-M : IoT telecommunications technology based on LTE network, with advanced mobility and real time responsiveness
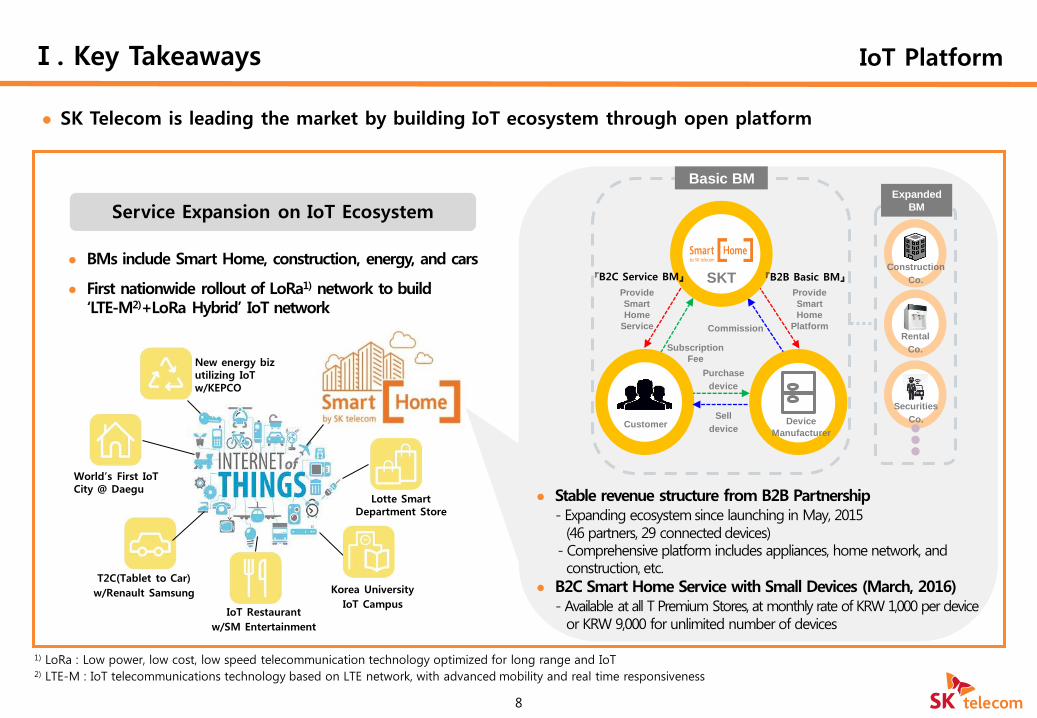
BMs include Smart Home, construction, energy, and cars
First nationwide rollout of LoRa1) network to build ‘LTE-M2)+LoRa Hybrid’ IoT network
8
IoT Platform Ⅰ. Key Takeaways
Stable revenue structure from B2B Partnership - Expanding ecosystem since launching in May, 2015 (46 partners, 29 connected devices) - Comprehensive platform includes appliances, home network, and construction, etc.
B2C Smart Home Service with Small Devices (March, 2016) - Available at all T Premium Stores, at monthly rate of KRW 1,000 per device or KRW 9,000 for unlimited number of devices
SK Telecom is leading the market by building IoT ecosystem through open platform
T2C(Tablet to Car)
w/Renault Samsung
World’s First IoT City @ Daegu
New energy biz utilizing IoT w/KEPCO
Lotte Smart Department Store
IoT Restaurant
w/SM Entertainment
Korea University
IoT Campus
Service Expansion on IoT Ecosystem
Construction
Co.
Expanded
BM
Rental
Co.
Securities
Co. •••
SKT
Customer Device
Manufacturer
Provide
Smart
Home
Platform Commission
Provide
Smart
Home
Service
Subscription
Fee
Purchase
device
Sell
device
Basic BM
『B2C Service BM』 『B2B Basic BM』
Data Usage/ARPU Ⅰ. Key Takeaways
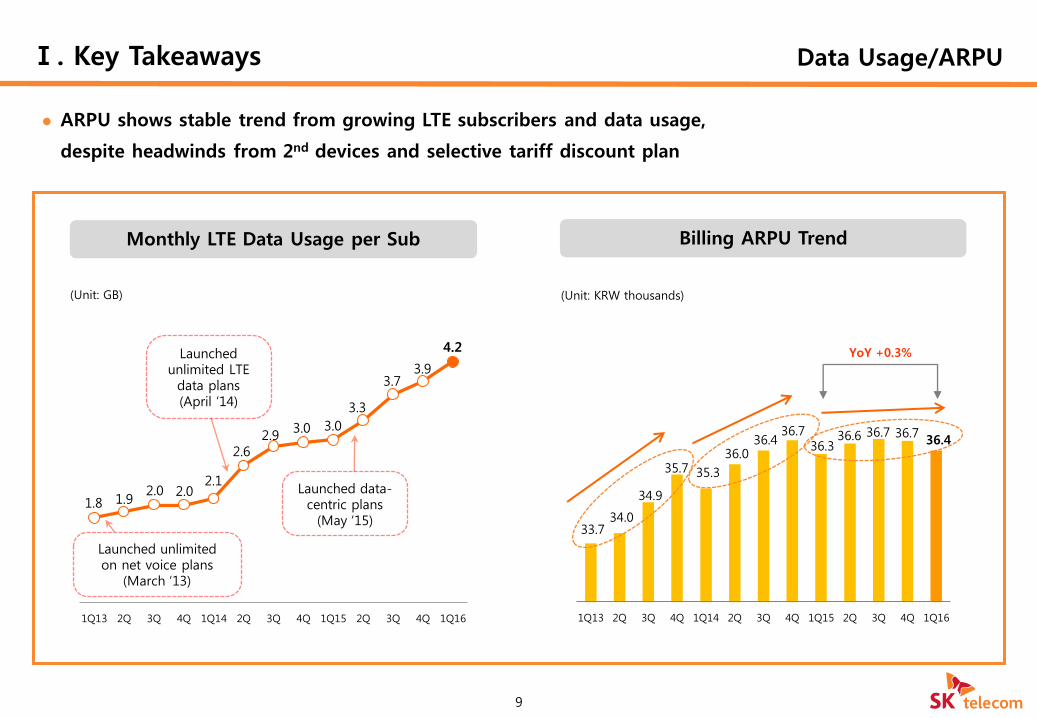
ARPU shows stable trend from growing LTE subscribers and data usage,
despite headwinds from 2nd devices and selective tariff discount plan
1.8 1.9 2.0 2.0
2.1
2.6 2.9
3.0 3.0
3.3
3.7 3.9
4.2
1Q13 2Q 3Q 4Q 1Q14 2Q 3Q 4Q 1Q15 2Q 3Q 4Q 1Q16
(Unit: GB)
Launched unlimited on net voice plans
(March ‘13)
9
Monthly LTE Data Usage per Sub
Launched data-centric plans
(May ‘15) 33.7
34.0
34.9
35.7 35.3
36.0 36.4
36.7 36.3
36.6 36.7 36.7 36.4
1Q13 2Q 3Q 4Q 1Q14 2Q 3Q 4Q 1Q15 2Q 3Q 4Q 1Q16
Billing ARPU Trend
YoY +0.3% Launched unlimited LTE data plans (April ‘14)
(Unit: KRW thousands)

CAPEX & Spectrum Ⅰ. Key Takeaways
SK Telecom acquired 60MHz from 2.6GHz band in the recent spectrum auction
Capex is expected to decrease mid-to-long term
140MHz available, 5 blocks total
- SKT acquired 60MHz from 2.6GHz
10
Spectrum Auction CAPEX
2.3
2.9
2.3 2.1
1.9 2.0
2011 2012 2013 2014 2015 2016E
CAPEX guidance for 2016 is KRW 2.0 tn
(Unit: KRW tn)
[2016 Auction Results]
* Per 1 MHz, 5 year period
(Unit: KRW bn)
Block Bandwidth Period (years)
Reserve Price
Winning Bid
Winner
A 700MHz(40MHz) 10 762 - -
B 1.8GHz(20MHz) 10 451 451 KT
C 2.1GHz(20MHz) 5 382 382 LGU+
D 2.6GHz(40MHz) 10 655 950 SKT
E 2.6GHz(20MHz) 10 328 328
Year Band-width
Period (years)
Reserve Price(A)
Winning Bid(B)
B/A Per MHz Price*
2011 1.8GHz (20MHz)
10 446 995 223% 5
2013 1.8GHz (35MHz)
8 674 1,050 156% 3.8
2016 2.6GHz
(60MHz) 10 983 1,278 130% 2.1
[SKT’s Previous Auction Results] (Unit: KRW bn)
Dividend & Share buyback Ⅰ. Key Takeaways
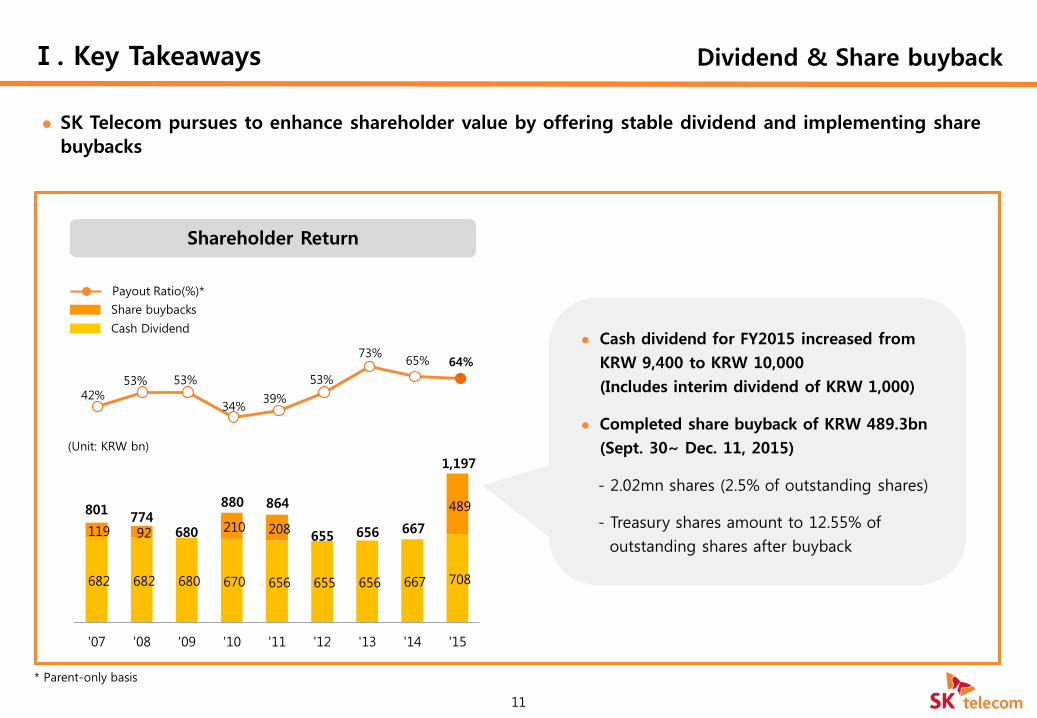
SK Telecom pursues to enhance shareholder value by offering stable dividend and implementing share
buybacks
682 682 680 670 656 655 656 667 708
119 92 210 208
489
'07 '08 '09 '10 '11 '12 '13 '14 '15
42% 53% 53%
34% 39%
53%
73% 65% 64%
656 655
864 880
680 774
801
Share buybacks
Cash Dividend
Payout Ratio(%)*
Cash dividend for FY2015 increased from
KRW 9,400 to KRW 10,000
(Includes interim dividend of KRW 1,000)
Completed share buyback of KRW 489.3bn
(Sept. 30~ Dec. 11, 2015)
- 2.02mn shares (2.5% of outstanding shares)
- Treasury shares amount to 12.55% of
outstanding shares after buyback 667
(Unit: KRW bn)
11
Shareholder Return
1,197
* Parent-only basis
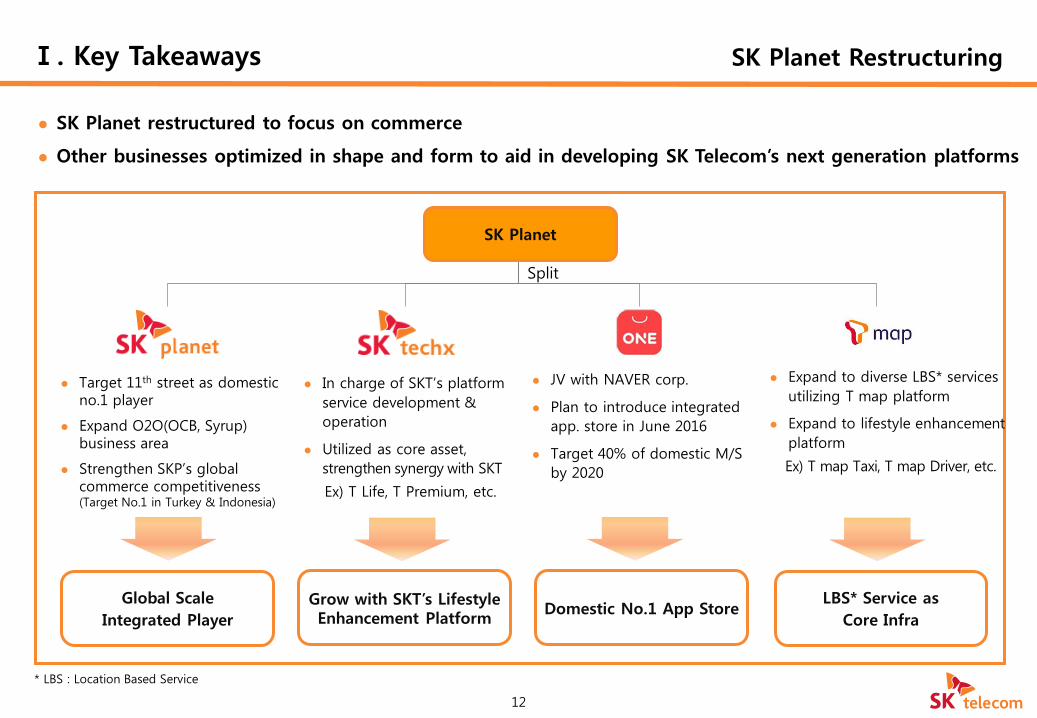
Ⅰ. Key Takeaways SK Planet Restructuring
12
Target 11th street as domestic no.1 player
Expand O2O(OCB, Syrup) business area
Strengthen SKP’s global commerce competitiveness (Target No.1 in Turkey & Indonesia)
In charge of SKT’s platform
service development &
operation
Utilized as core asset,
strengthen synergy with SKT
Ex) T Life, T Premium, etc.
JV with NAVER corp.
Plan to introduce integrated
app. store in June 2016
Target 40% of domestic M/S
by 2020
Expand to diverse LBS* services
utilizing T map platform
Expand to lifestyle enhancement
platform
Ex) T map Taxi, T map Driver, etc.
Global Scale
Integrated Player
Grow with SKT’s Lifestyle Enhancement Platform
Domestic No.1 App Store LBS* Service as
Core Infra
Split
* LBS : Location Based Service
SK Planet
SK Planet restructured to focus on commerce
Other businesses optimized in shape and form to aid in developing SK Telecom’s next generation platforms

Ⅰ. Key Takeaways e-Commerce Biz
SK Planet aims to be the market top player by actively investing in commerce, maximizing its competitive edge and industry’s growth potential
13
e-Commerce Market SK Planet’s Competitive Edge
Mobile becomes crucial factor
- Mobile e-commerce showing rapid growth in sales, GMV growth, and active users
Establish integrated & personalized commerce
- Offer integrated commerce by utilizing OCB1) and Big Data
- Mobile-centric O2O commerce platform
Commerce Platform
Marketing
Platform Data Infra
(Big Data)
∙ Demography
& Context-Based
Offering
No.1 in mobile app UV, average usage time and
active users3)
Source : National Statistical Office
E-commerce accounts for 15.4% of domestic retail market
- Hypermarket 12.8%, Supermarket 9.0%, Department store 8.7%, convenience store 4.5% (4Q15)
1) OCB : OK Cashbag, 2) JBP(Joint Business Plan) : Provide joint marketing among distributor and manufacturer 3) According to Korean Click 4Q15 e-commerce analysis report
Actively engaging in global business and
generating tangible results
- GMV No.1~2 in Turkey, Indonesia, Malaysia
Opening distribution center(rental), expanding
direct sales and JBP2)
7 15 24
38
45
54
14
Consolidated Results
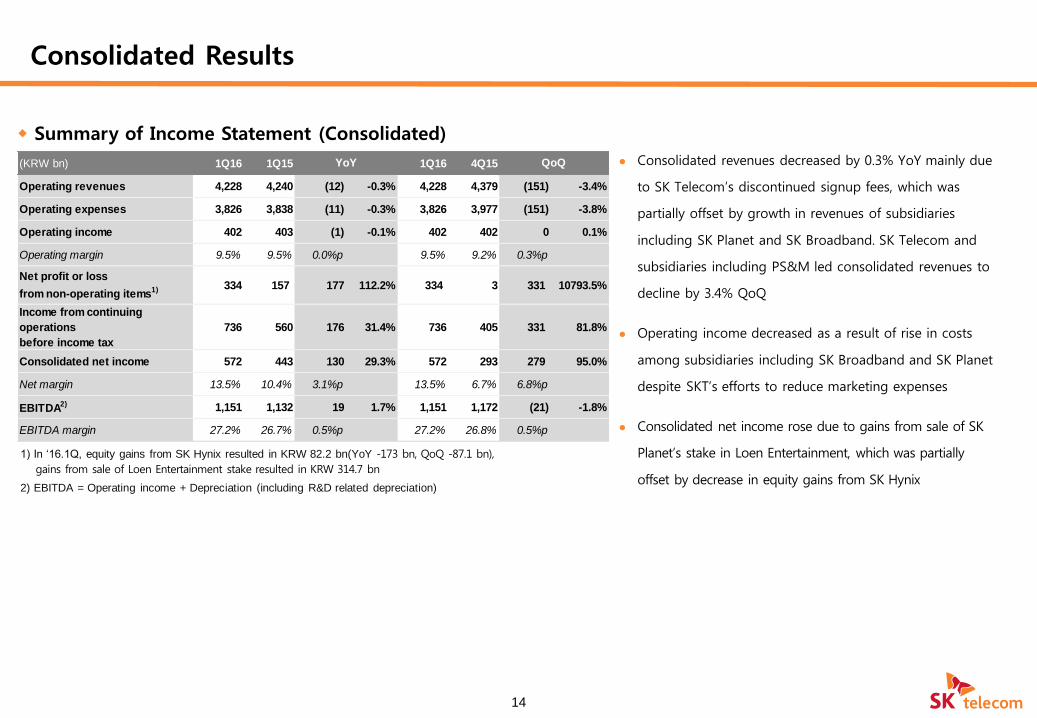
Summary of Income Statement (Consolidated)
1) In ‘16.1Q, equity gains from SK Hynix resulted in KRW 82.2 bn(YoY -173 bn, QoQ -87.1 bn),
gains from sale of Loen Entertainment stake resulted in KRW 314.7 bn
2) EBITDA = Operating income + Depreciation (including R&D related depreciation)
Consolidated revenues decreased by 0.3% YoY mainly due
to SK Telecom’s discontinued signup fees, which was
partially offset by growth in revenues of subsidiaries
including SK Planet and SK Broadband. SK Telecom and
subsidiaries including PS&M led consolidated revenues to
decline by 3.4% QoQ
Operating income decreased as a result of rise in costs
among subsidiaries including SK Broadband and SK Planet
despite SKT’s efforts to reduce marketing expenses
Consolidated net income rose due to gains from sale of SK
Planet’s stake in Loen Entertainment, which was partially
offset by decrease in equity gains from SK Hynix
(KRW bn) 1Q16 1Q15 1Q16 4Q15
Operating revenues 4,228 4,240 (12) -0.3% 4,228 4,379 (151) -3.4%
Operating expenses 3,826 3,838 (11) -0.3% 3,826 3,977 (151) -3.8%
Operating income 402 403 (1) -0.1% 402 402 0 0.1%
Operating margin 9.5% 9.5% 0.0%p 9.5% 9.2% 0.3%p
Net profit or loss
from non-operating items1) 334 157 177 112.2% 334 3 331 10793.5%
Income from continuing
operations
before income tax
736 560 176 31.4% 736 405 331 81.8%
Consolidated net income 572 443 130 29.3% 572 293 279 95.0%
Net margin 13.5% 10.4% 3.1%p 13.5% 6.7% 6.8%p
EBITDA2) 1,151 1,132 19 1.7% 1,151 1,172 (21) -1.8%
EBITDA margin 27.2% 26.7% 0.5%p 27.2% 26.8% 0.5%p
YoY QoQ
15
Consolidated Results
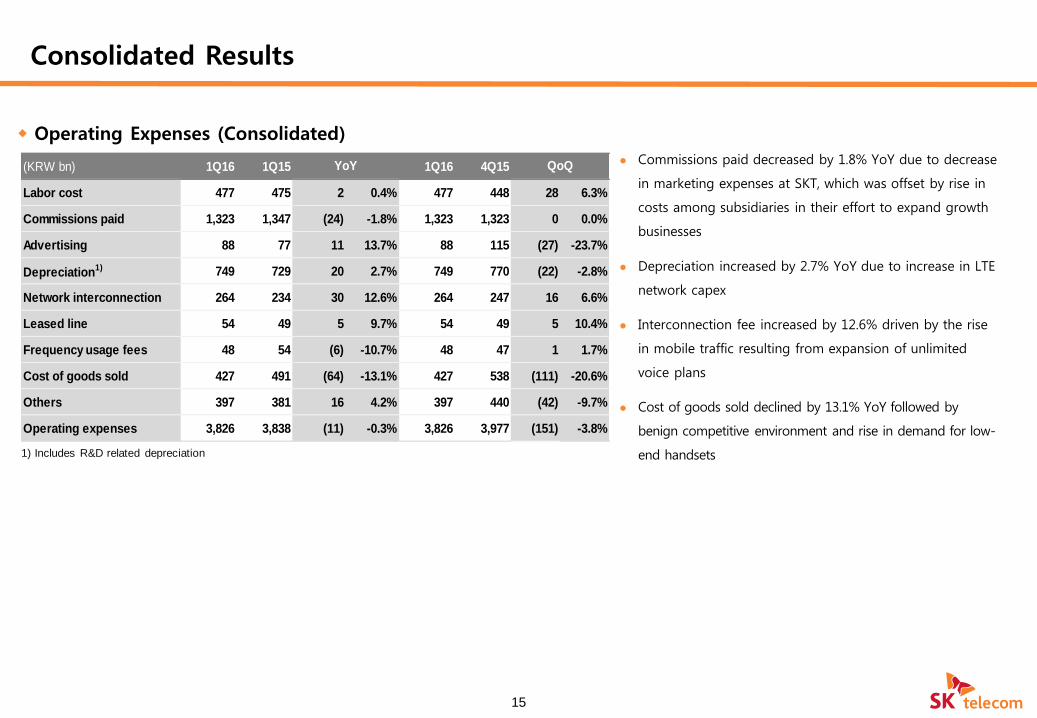
Operating Expenses (Consolidated)
1) Includes R&D related depreciation
Commissions paid decreased by 1.8% YoY due to decrease
in marketing expenses at SKT, which was offset by rise in
costs among subsidiaries in their effort to expand growth
businesses
Depreciation increased by 2.7% YoY due to increase in LTE
network capex
Interconnection fee increased by 12.6% driven by the rise
in mobile traffic resulting from expansion of unlimited
voice plans
Cost of goods sold declined by 13.1% YoY followed by
benign competitive environment and rise in demand for low-
end handsets
(KRW bn) 1Q16 1Q15 1Q16 4Q15
Labor cost 477 475 2 0.4% 477 448 28 6.3%
Commissions paid 1,323 1,347 (24) -1.8% 1,323 1,323 0 0.0%
Advertising 88 77 11 13.7% 88 115 (27) -23.7%
Depreciation1) 749 729 20 2.7% 749 770 (22) -2.8%
Network interconnection 264 234 30 12.6% 264 247 16 6.6%
Leased line 54 49 5 9.7% 54 49 5 10.4%
Frequency usage fees 48 54 (6) -10.7% 48 47 1 1.7%
Cost of goods sold 427 491 (64) -13.1% 427 538 (111) -20.6%
Others 397 381 16 4.2% 397 440 (42) -9.7%
Operating expenses 3,826 3,838 (11) -0.3% 3,826 3,977 (151) -3.8%
YoY QoQ

Operating Revenues (Non-consolidated)
Non-consolidated Results
Total operating revenues fell by 1.1% YoY and 1.3% QoQ
mainly due to decrease in signup fees
- Interconnection revenues increased YoY due to rise
in mobile traffic resulting from expansion of unlimited
voice plans and decreased QoQ due to seasonality
- Other revenues fell YoY and QoQ mainly due to decrease
in sales of solution and hardware
1) Includes sales from leased line, fixed-line resale, solution and other businesses
16
1) Includes revenues from select businesses of SK Planet
2) From SK Telecom subscribers
3) From SK Telecom mobile service revenues less signup fees
4) Includes MVNO revenues and subscribers
ARPU1)
(KRW bn) 1Q16 1Q15 1Q16 4Q15
Total operating revenues 3,098 3,133 (35) -1.1% 3,098 3,138 (40) -1.3%
Mobile service revenue 2,705 2,733 (27) -1.0% 2,705 2,719 (14) -0.5%
Interconnection revenue 190 177 13 7.2% 190 194 (4) -2.2%
Others1) 203 224 (21) -9.3% 203 225 (22) -9.7%
YoY QoQ
(KRW) 1Q15 2Q15 3Q15 4Q15 1Q16
Total ARPU2) 43,486 44,071 44,103 44,224 43,715 228 0.5% (509) -1.2%
Billing ARPU2), 3) 36,319 36,601 36,729 36,680 36,414 95 0.3% (266) -0.7%
ARPU4) Including MVNO 33,556 33,655 33,581 33,379 33,016 (541) -1.6% (363) -1.1%
YoY QoQ

17
Non-consolidated Results
Marketing Expenses & CAPEX
Marketing expenses decreased by 15.3% YoY in line with
market stabilization efforts
Capex decreased both YoY and QoQ
Marketing
Expenses
CAPEX
(KRW bn)
(KRW bn)
1) Marketing expenses = marketing related commission + advertising expenses
1,100
825 832 816 846 740 749 721 717
33.7% 25.3% 25.2% 25.7% 27.0% 23.5% 23.8% 23.0% 23.1%
0.0%
50.0%
100.0%
150.0%
200.0%
- 100 200 300 400 500 600 700 800 900
1,000 1,100
'14.1Q '14.2Q '14.3Q '14.4Q '15.1Q '15.2Q '15.3Q '15.4Q 16.1Q
Marketing Expenses
% to Revenue
223 424 505 581
271 265 299
609
42
42
93 83
193
48 83 101
215
36
'14.1Q '14.2Q '14.3Q '14.4Q '15.1Q '15.2Q '15.3Q '15.4Q '16.1Q
Non-Network
Network
824
265
588 517
774
319 348 400
78
(KRW bn) 1Q16 1Q15 1Q16 4Q15
Marketing expenses1) 717 846 (129) -15.3% 717 721 (4) -0.6%
% of operating revenue 23.1% 27.0% -3.9%p 23.1% 23.0% 0.2%p
Capital expenditure 78 319 (241) -75.5% 78 824 (746) -90.5%
% of operating revenue 2.5% 10.2% -7.7%p 2.5% 26.3% -23.7%p
YoY QoQ
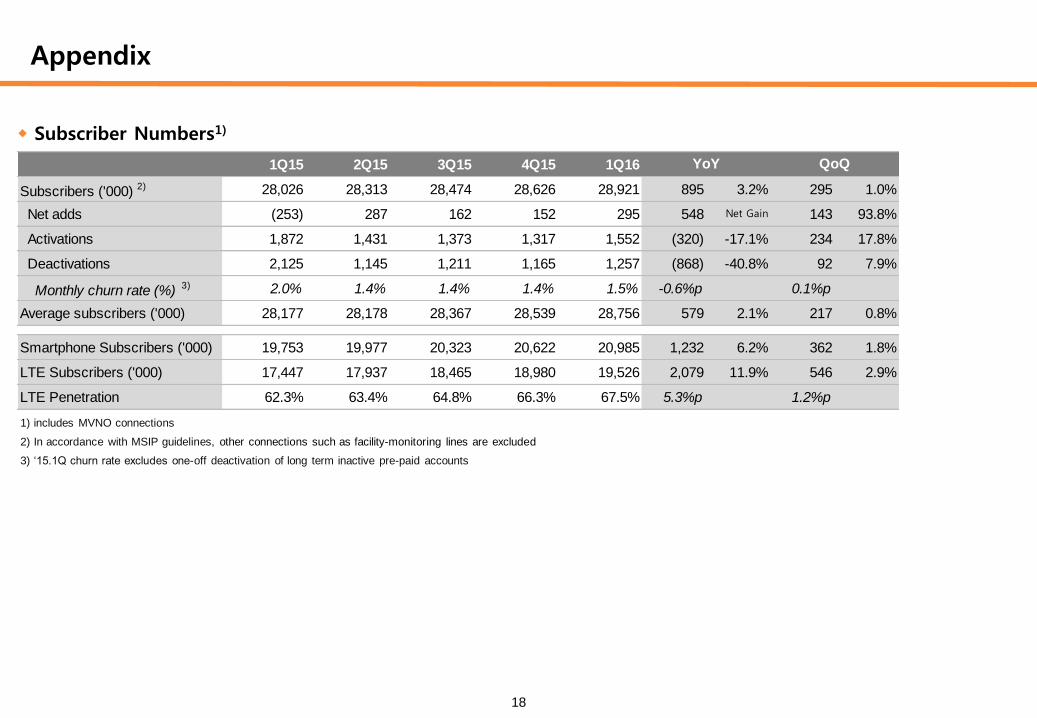
Subscriber Numbers1)
Appendix
2) In accordance with MSIP guidelines, other connections such as facility-monitoring lines are excluded
3) ‘15.1Q churn rate excludes one-off deactivation of long term inactive pre-paid accounts
18
1) includes MVNO connections
1Q15 2Q15 3Q15 4Q15 1Q16
Subscribers ('000) 2) 28,026 28,313 28,474 28,626 28,921 895 3.2% 295 1.0%
Net adds (253) 287 162 152 295 548 Net Gain 143 93.8%
Activations 1,872 1,431 1,373 1,317 1,552 (320) -17.1% 234 17.8%
Deactivations 2,125 1,145 1,211 1,165 1,257 (868) -40.8% 92 7.9%
Monthly churn rate (%) 3) 2.0% 1.4% 1.4% 1.4% 1.5% -0.6%p 0.1%p
Average subscribers ('000) 28,177 28,178 28,367 28,539 28,756 579 2.1% 217 0.8%
Smartphone Subscribers ('000) 19,753 19,977 20,323 20,622 20,985 1,232 6.2% 362 1.8%
LTE Subscribers ('000) 17,447 17,937 18,465 18,980 19,526 2,079 11.9% 546 2.9%
LTE Penetration 62.3% 63.4% 64.8% 66.3% 67.5% 5.3%p 1.2%p
YoY QoQ
19
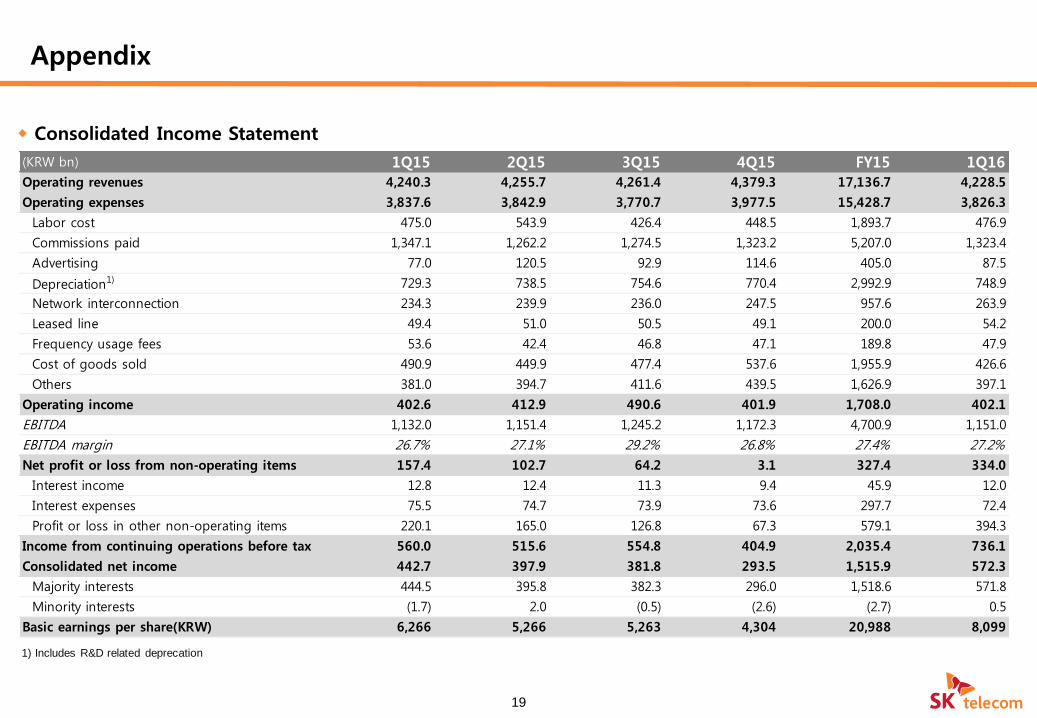
Consolidated Income Statement
Appendix
1) Includes R&D related deprecation
(KRW bn) 1Q15 2Q15 3Q15 4Q15 FY15 1Q16
Operating revenues 4,240.3 4,255.7 4,261.4 4,379.3 17,136.7 4,228.5
Operating expenses 3,837.6 3,842.9 3,770.7 3,977.5 15,428.7 3,826.3
Labor cost 475.0 543.9 426.4 448.5 1,893.7 476.9
Commissions paid 1,347.1 1,262.2 1,274.5 1,323.2 5,207.0 1,323.4
Advertising 77.0 120.5 92.9 114.6 405.0 87.5
Depreciation1) 729.3 738.5 754.6 770.4 2,992.9 748.9
Network interconnection 234.3 239.9 236.0 247.5 957.6 263.9
Leased line 49.4 51.0 50.5 49.1 200.0 54.2
Frequency usage fees 53.6 42.4 46.8 47.1 189.8 47.9
Cost of goods sold 490.9 449.9 477.4 537.6 1,955.9 426.6
Others 381.0 394.7 411.6 439.5 1,626.9 397.1
Operating income 402.6 412.9 490.6 401.9 1,708.0 402.1
EBITDA 1,132.0 1,151.4 1,245.2 1,172.3 4,700.9 1,151.0
EBITDA margin 26.7% 27.1% 29.2% 26.8% 27.4% 27.2%
Net profit or loss from non-operating items 157.4 102.7 64.2 3.1 327.4 334.0
Interest income 12.8 12.4 11.3 9.4 45.9 12.0
Interest expenses 75.5 74.7 73.9 73.6 297.7 72.4
Profit or loss in other non-operating items 220.1 165.0 126.8 67.3 579.1 394.3
Income from continuing operations before tax 560.0 515.6 554.8 404.9 2,035.4 736.1
Consolidated net income 442.7 397.9 381.8 293.5 1,515.9 572.3
Majority interests 444.5 395.8 382.3 296.0 1,518.6 571.8
Minority interests (1.7) 2.0 (0.5) (2.6) (2.7) 0.5
Basic earnings per share(KRW) 6,266 5,266 5,263 4,304 20,988 8,099

20
Appendix
SK Telecom Non-consolidated Income Statement
1) Includes R&D related deprecation
(KRW bn) 1Q15 2Q15 3Q15 4Q15 FY15 1Q16
Operating revenues 3,133.5 3,143.8 3,141.8 3,138.0 12,557.0 3,098.3
Operating expenses 2,725.6 2,747.7 2,675.6 2,749.3 10,898.2 2,668.4
Labor cost 176.6 257.3 133.1 147.9 714.9 178.0
Commissions paid 1,339.8 1,220.4 1,257.0 1,265.3 5,082.5 1,213.3
Marketing commissions 812.9 681.1 707.4 677.4 2,878.9 689.5
Other commissions 526.9 539.3 549.6 587.9 2,203.7 523.7
Advertising 32.6 58.4 41.2 43.5 175.8 27.1
Depreciation1) 552.8 561.1 575.4 590.5 2,279.9 570.8
Network interconnection 169.9 182.4 179.4 189.1 720.9 193.3
Leased line 42.6 43.0 41.6 41.0 168.2 40.8
Frequency usage fees 53.6 42.4 46.8 47.1 189.8 47.9
Others 357.6 382.6 401.0 425.0 1,566.2 397.4
Operating income 407.8 396.1 466.2 388.7 1,658.8 429.9
EBITDA 960.7 957.2 1,041.6 979.1 3,938.7 1,000.6
EBITDA margin 30.7% 30.4% 33.2% 31.2% 31.4% 32.3%
Net profit or loss from non-operating items (29.1) (76.7) 24.6 (108.2) (189.3) 35.8
Interest income 5.7 5.5 4.8 4.6 20.6 6.4
Interest expenses 61.2 59.9 60.1 60.3 241.6 59.5
Net profit or loss from other non-operating items 26.5 (22.3) 80.0 (52.5) 31.7 88.9
Income from continuing operations before tax 378.8 319.4 490.8 280.5 1,469.4 465.7
Net income 295.8 232.0 361.6 217.4 1,106.8 382.2
21
Appendix
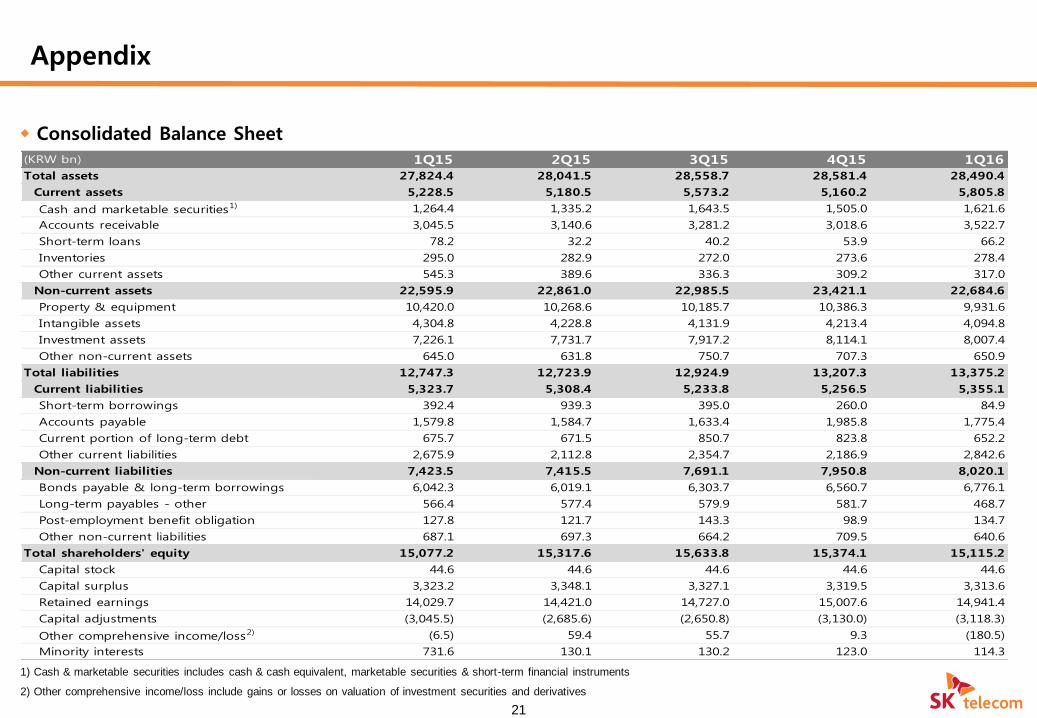
Consolidated Balance Sheet
1) Cash & marketable securities includes cash & cash equivalent, marketable securities & short-term financial instruments
2) Other comprehensive income/loss include gains or losses on valuation of investment securities and derivatives
(KRW bn) 1Q15 2Q15 3Q15 4Q15 1Q16
Total assets 27,824.4 28,041.5 28,558.7 28,581.4 28,490.4
Current assets 5,228.5 5,180.5 5,573.2 5,160.2 5,805.8
Cash and marketable securities1) 1,264.4 1,335.2 1,643.5 1,505.0 1,621.6
Accounts receivable 3,045.5 3,140.6 3,281.2 3,018.6 3,522.7
Short-term loans 78.2 32.2 40.2 53.9 66.2
Inventories 295.0 282.9 272.0 273.6 278.4
Other current assets 545.3 389.6 336.3 309.2 317.0
Non-current assets 22,595.9 22,861.0 22,985.5 23,421.1 22,684.6
Property & equipment 10,420.0 10,268.6 10,185.7 10,386.3 9,931.6
Intangible assets 4,304.8 4,228.8 4,131.9 4,213.4 4,094.8
Investment assets 7,226.1 7,731.7 7,917.2 8,114.1 8,007.4
Other non-current assets 645.0 631.8 750.7 707.3 650.9
Total liabilities 12,747.3 12,723.9 12,924.9 13,207.3 13,375.2
Current liabilities 5,323.7 5,308.4 5,233.8 5,256.5 5,355.1
Short-term borrowings 392.4 939.3 395.0 260.0 84.9
Accounts payable 1,579.8 1,584.7 1,633.4 1,985.8 1,775.4
Current portion of long-term debt 675.7 671.5 850.7 823.8 652.2
Other current liabilities 2,675.9 2,112.8 2,354.7 2,186.9 2,842.6
Non-current liabilities 7,423.5 7,415.5 7,691.1 7,950.8 8,020.1
Bonds payable & long-term borrowings 6,042.3 6,019.1 6,303.7 6,560.7 6,776.1
Long-term payables - other 566.4 577.4 579.9 581.7 468.7
Post-employment benefit obligation 127.8 121.7 143.3 98.9 134.7
Other non-current liabilities 687.1 697.3 664.2 709.5 640.6
Total shareholders' equity 15,077.2 15,317.6 15,633.8 15,374.1 15,115.2
Capital stock 44.6 44.6 44.6 44.6 44.6
Capital surplus 3,323.2 3,348.1 3,327.1 3,319.5 3,313.6
Retained earnings 14,029.7 14,421.0 14,727.0 15,007.6 14,941.4
Capital adjustments (3,045.5) (2,685.6) (2,650.8) (3,130.0) (3,118.3)
Other comprehensive income/loss2) (6.5) 59.4 55.7 9.3 (180.5)
Minority interests 731.6 130.1 130.2 123.0 114.3

22
SK Telecom Non-consolidated Balance Sheet
Appendix
1) Cash & marketable securities includes cash & cash equivalent, marketable securities & short-term financial instruments
2) Other comprehensive income/loss include gains or losses on valuation of investment securities and derivatives
(KRW bn) 1Q15 2Q15 3Q15 4Q15 1Q16
Total assets 22,464.6 22,863.4 23,144.7 23,146.9 23,120.0
Current assets 2,854.1 2,685.9 3,133.1 2,713.5 3,144.4
Cash and marketable securities1) 496.3 508.7 736.8 598.2 593.1
Accounts receivable 1,858.7 1,897.0 2,100.5 1,793.5 2,222.8
Short-term loans 70.6 21.8 31.8 47.7 59.1
Inventories 25.7 34.4 38.9 46.0 43.7
Other current assets 402.7 224.0 225.0 228.1 225.7
Non-current assets 19,610.5 20,177.6 20,011.6 20,433.4 19,975.5
Property & equipment 7,555.2 7,423.3 7,308.4 7,442.3 7,038.7
Intangible assets 3,149.5 3,062.1 2,977.1 3,072.3 2,974.6
Investment assets 8,606.6 9,405.6 9,333.3 9,547.1 9,634.2
Other non-current assets 299.2 286.6 392.9 371.7 328.0
Total liabilities 9,240.2 9,057.1 9,100.2 9,367.5 9,565.1
Current liabilities 3,558.3 3,456.0 3,355.4 3,491.3 3,466.9
Short-term borrowings 250.0 770.0 260.0 230.0 -
Accounts payable 1,073.7 1,064.3 1,051.4 1,299.1 1,168.1
Current portion of long-term debt 400.5 401.3 602.6 712.8 438.2
Other current liabilities 1,834.1 1,220.5 1,441.4 1,249.4 1,860.6
Non-current liabilities 5,681.8 5,601.0 5,744.8 5,876.2 6,098.2
Bonds payable & long-term borrowings 4,769.5 4,762.2 4,967.0 5,106.0 5,431.7
Long-term payables 542.1 545.0 548.0 551.0 438.5
Post-employment benefit obligation 28.3 12.9 23.8 4.0 22.5
Other non-current liabilities 341.9 281.0 206.0 215.2 205.5
Total shareholders' equity 13,224.4 13,806.4 14,044.6 13,779.5 13,554.8
Capital stock 44.6 44.6 44.6 44.6 44.6
Capital surplus 3,319.4 3,344.2 3,357.8 3,357.8 3,357.8
Retained earnings 12,694.7 12,917.8 13,204.2 13,418.6 13,158.4
Capital adjustments (2,885.5) (2,498.2) (2,498.2) (2,988.4) (2,988.4)
Other comprehensive income/loss2) 51.2 (2.1) (63.9) (53.2) (17.7)