Embed Size (px)
Citation preview

April 2016
SK telecom Investor Presentation
February 2017
9 CONSECUTIVE MEMBER OF
Disclaimer
This presentation contains forward-looking statements with respect to the financial condition, results of operations
and business of SK Telecom and its subsidiaries (the “Company”) and plans and objectives of the management of
the Company. The aforementioned forward-looking statements are influenced by unknown risks, uncertainties and
other factors which may change the actual results or performance of the Company.
The Company does not make any representation or warranty, expressed or implied, as to the accuracy or
completeness of the information contained in this management presentation, and nothing contained herein is, or
shall be relied upon as, a promise or representation, whether as to the past or the future.
Therefore, this presentation contained herein should not be utilized for any legal purposes in regards to investors’
investment results. The Company hereby expressly disclaims any and all liability for any loss or damage resulting
from the investors’ reliance on the information contained herein.
This presentation only speaks the informations as of the date they are made, and the Company undertakes no
obligation to update publicly any of them in light of new information or future events.
Table of Contents
Ⅰ. Overall Strategy
Ⅱ. Capital Mgmt.
III. Consolidated Results
IV. Non-Consolidate Results
V. Major Subsidiaries
VI. Appendix
3
4
5
7
10
9
Ⅰ. Overall Strategy
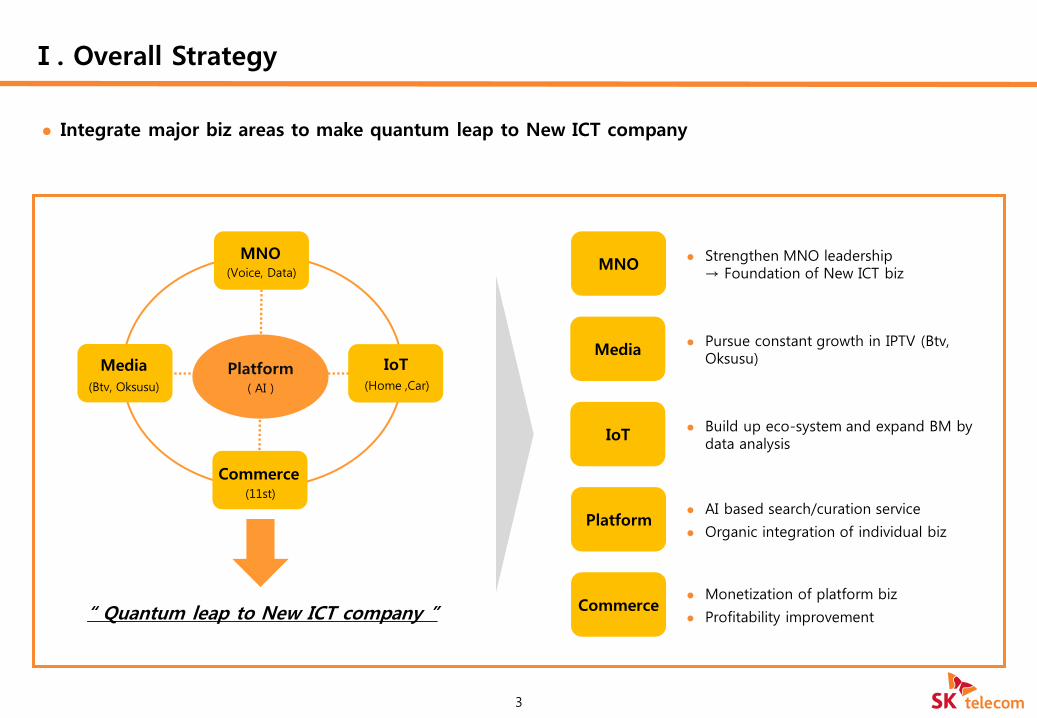
Integrate major biz areas to make quantum leap to New ICT company
3
MNO
Media
“ Quantum leap to New ICT company ”
Platform ( AI ) (Btv, Oksusu) (Home ,Car)
IoT
(11st)
Commerce
MNO (Voice, Data)
Media
IoT
Platform
Commerce
Strengthen MNO leadership → Foundation of New ICT biz
Pursue constant growth in IPTV (Btv, Oksusu)
Build up eco-system and expand BM by data analysis
AI based search/curation service
Organic integration of individual biz
Monetization of platform biz
Profitability improvement
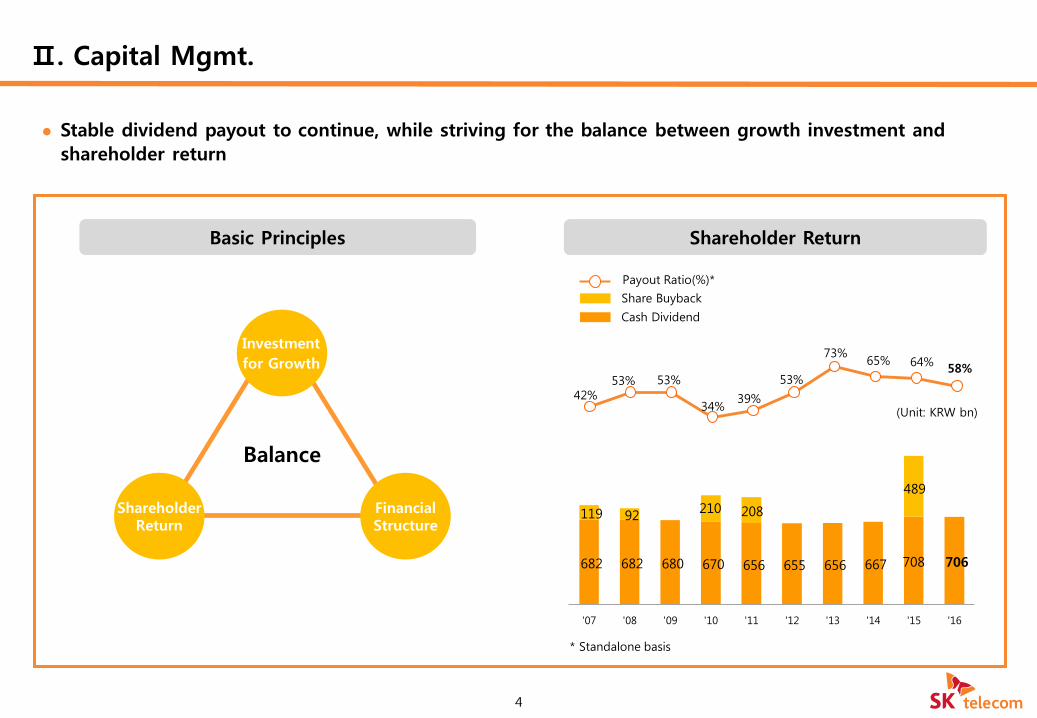
42% 53% 53%
34% 39%
53%
73% 65% 64%
58%
682 682 680 670 656 655 656 667 708 706
119 92 210 208
489
'07 '08 '09 '10 '11 '12 '13 '14 '15 '16
Stable dividend payout to continue, while striving for the balance between growth investment and
shareholder return
Share Buyback
Cash Dividend
Payout Ratio(%)*
(Unit: KRW bn)
4
Basic Principles
* Standalone basis
Ⅱ. Capital Mgmt.
Shareholder Return
Investment
for Growth
Shareholder Return
Financial Structure
Balance
(KRW bn) 2016 2015 YoY 4Q16 3Q16 QoQ
Operating revenues 17,092 17,137 -0.3% 4,352 4,244 2.6%
Operating expenses 15,556 15,429 0.8% 4,050 3,820 6.0%
Labor cost 1,870 1,894 -1.3% 478 449 6.6%
Commissions paid 5,377 5,207 3.3% 1,412 1,315 7.4%
Depreciation1) 3,068 2,993 2.5% 802 764 5.0%
Network Interconnection
954 958 -0.3% 170 264 -35.5%
Cost of goods sold 1,838 1,956 -6.0% 543 417 30.0%
Others 2,449 2,422 1.1% 645 610 5.7%
Operating income 1,536 1,708 -10.1% 302 424 -28.8%
Operating margin 9.0% 10.0% -1.0%p 6.9% 10.0% -3.1%p
Net profit or loss from non-operating items
560 327 71.2% 262 7 3714.4%
Income before taxes 2,096 2,035 3.0% 564 431 30.8%
Net income 1,660 1,516 9.5% 475 322 47.4%
EBITDA2) 4,603 4,701 -2.1% 1,104 1,189 -7.1%
EBITDA margin 26.9% 27.4% -0.5%p 25.4% 28.0% -2.6%p
Basic EPS(KRW) 23,497 20,988 12.0% 6,905 4,604 50.0%
5
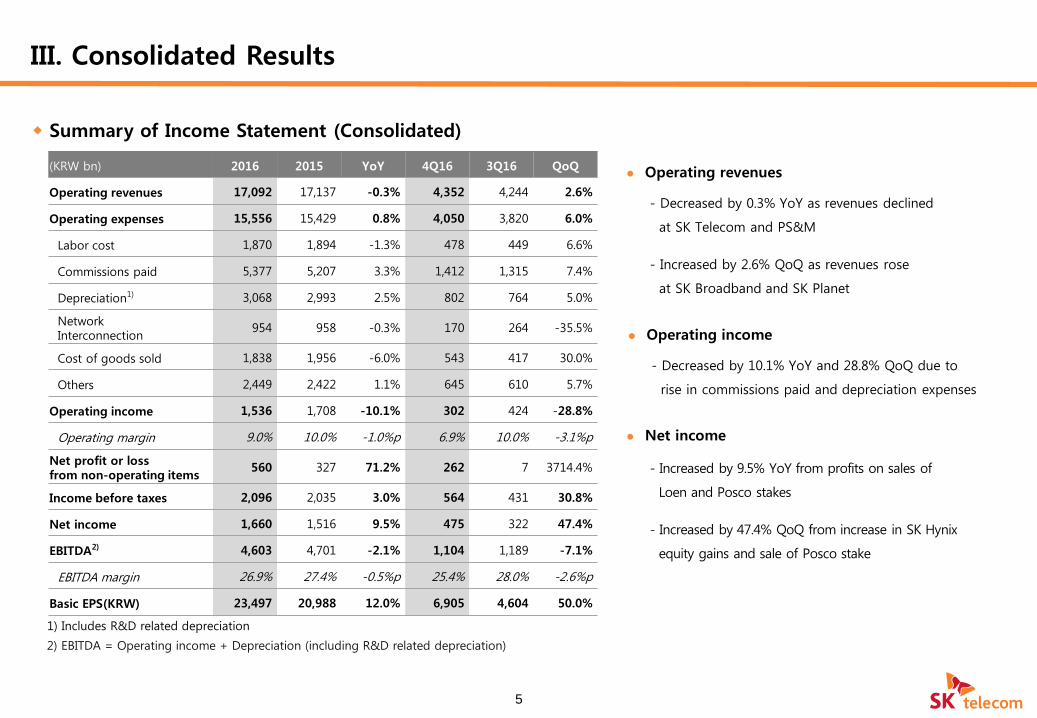
Summary of Income Statement (Consolidated)
2) EBITDA = Operating income + Depreciation (including R&D related depreciation)
1) Includes R&D related depreciation
Operating revenues
- Decreased by 0.3% YoY as revenues declined
at SK Telecom and PS&M
- Increased by 2.6% QoQ as revenues rose
at SK Broadband and SK Planet
Operating income
- Decreased by 10.1% YoY and 28.8% QoQ due to
rise in commissions paid and depreciation expenses
Net income
- Increased by 9.5% YoY from profits on sales of
Loen and Posco stakes
- Increased by 47.4% QoQ from increase in SK Hynix
equity gains and sale of Posco stake
III. Consolidated Results
6
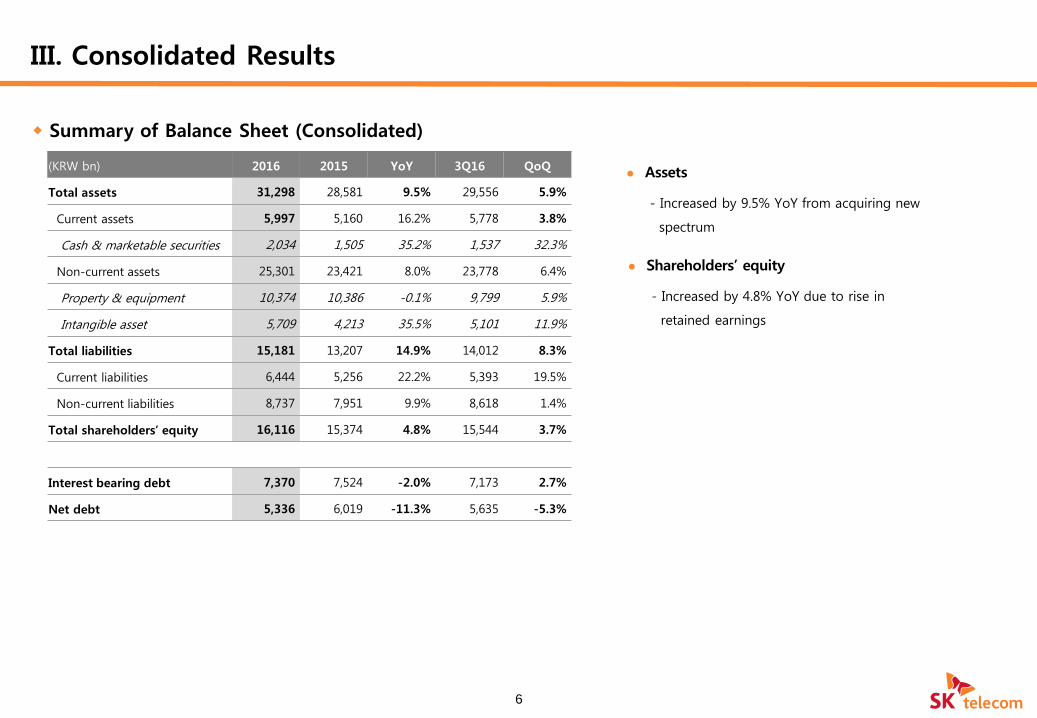
Summary of Balance Sheet (Consolidated)
(KRW bn) 2016 2015 YoY 3Q16 QoQ
Total assets 31,298 28,581 9.5% 29,556 5.9%
Current assets 5,997 5,160 16.2% 5,778 3.8%
Cash & marketable securities 2,034 1,505 35.2% 1,537 32.3%
Non-current assets 25,301 23,421 8.0% 23,778 6.4%
Property & equipment 10,374 10,386 -0.1% 9,799 5.9%
Intangible asset 5,709 4,213 35.5% 5,101 11.9%
Total liabilities 15,181 13,207 14.9% 14,012 8.3%
Current liabilities 6,444 5,256 22.2% 5,393 19.5%
Non-current liabilities 8,737 7,951 9.9% 8,618 1.4%
Total shareholders’ equity 16,116 15,374 4.8% 15,544 3.7%
Interest bearing debt 7,370 7,524 -2.0% 7,173 2.7%
Net debt 5,336 6,019 -11.3% 5,635 -5.3%
Assets
- Increased by 9.5% YoY from acquiring new
spectrum
Shareholders’ equity
- Increased by 4.8% YoY due to rise in
retained earnings
III. Consolidated Results
2,733 2,727
2,736
2,719 2,705 2,701 2,696
2,708
1Q15 2Q15 3Q15 4Q15 1Q16 2Q16 3Q16 4Q16
1) Includes revenues from leased line, fixed-line resale, solutions and other businesses
7
(KRW bn)
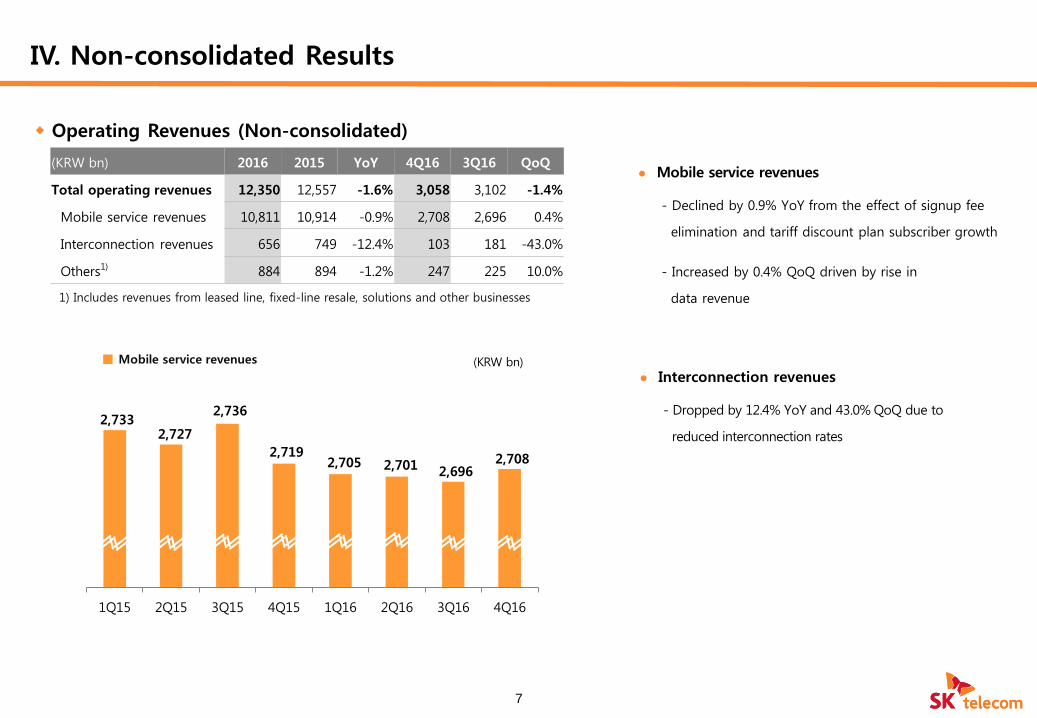
Operating Revenues (Non-consolidated)
Mobile service revenues
- Declined by 0.9% YoY from the effect of signup fee
elimination and tariff discount plan subscriber growth
- Increased by 0.4% QoQ driven by rise in
data revenue
Interconnection revenues
- Dropped by 12.4% YoY and 43.0% QoQ due to
reduced interconnection rates
Mobile service revenues
IV. Non-consolidated Results
(KRW bn) 2016 2015 YoY 4Q16 3Q16 QoQ
Total operating revenues 12,350 12,557 -1.6% 3,058 3,102 -1.4%
Mobile service revenues 10,811 10,914 -0.9% 2,708 2,696 0.4%
Interconnection revenues 656 749 -12.4% 103 181 -43.0%
Others1) 884 894 -1.2% 247 225 10.0%
3.24 3.47 3.43 3.57
3.06 2.95
2011 2012 2013 2014 2015 2016
25.8%
28.2% 26.7% 27.5%
24.3% 23.9%
IV. Non-consolidated Results
8
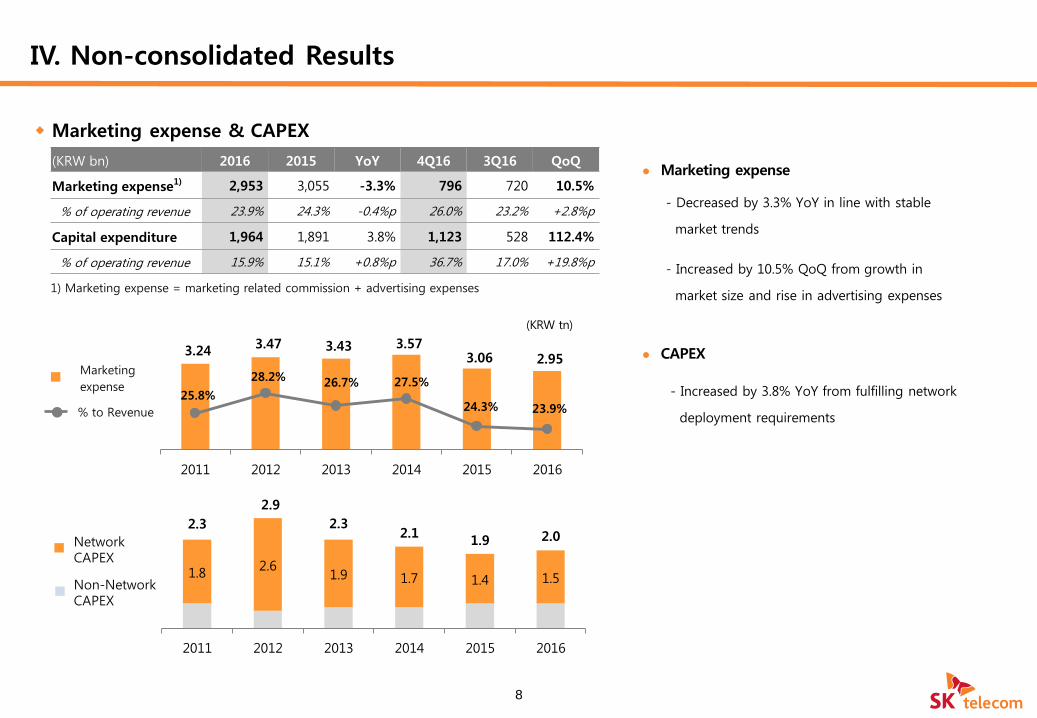
(KRW bn) 2016 2015 YoY 4Q16 3Q16 QoQ
Marketing expense1) 2,953 3,055 -3.3% 796 720 10.5%
% of operating revenue 23.9% 24.3% -0.4%p 26.0% 23.2% +2.8%p
Capital expenditure 1,964 1,891 3.8% 1,123 528 112.4%
% of operating revenue 15.9% 15.1% +0.8%p 36.7% 17.0% +19.8%p
1) Marketing expense = marketing related commission + advertising expenses
(KRW tn)
% to Revenue
Network CAPEX
Non-Network CAPEX
2.3
2.9
2.3 2.1
1.9 2.0
1.8 2.6
1.9 1.7 1.4 1.5
2011 2012 2013 2014 2015 2016
Marketing expense & CAPEX
Marketing expense
CAPEX
- Decreased by 3.3% YoY in line with stable
market trends
- Increased by 10.5% QoQ from growth in
market size and rise in advertising expenses
- Increased by 3.8% YoY from fulfilling network
deployment requirements
Marketing
expense
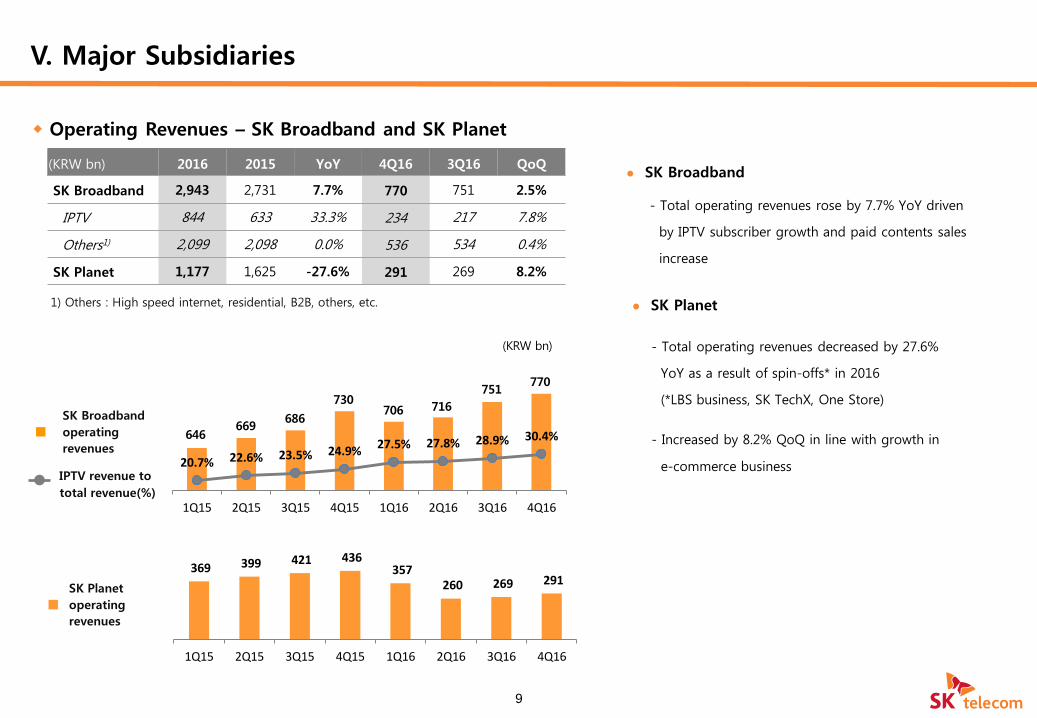
Operating Revenues – SK Broadband and SK Planet
V. Major Subsidiaries
9
369 399 421 436 357
260 269 291
1Q15 2Q15 3Q15 4Q15 1Q16 2Q16 3Q16 4Q16
SK Planet
operating
revenues
(KRW bn)
(KRW bn) 2016 2015 YoY 4Q16 3Q16 QoQ
SK Broadband 2,943 2,731 7.7% 770 751 2.5%
IPTV 844 633 33.3% 234 217 7.8%
Others1) 2,099 2,098 0.0% 536 534 0.4%
SK Planet 1,177 1,625 -27.6% 291 269 8.2%
SK Broadband
- Total operating revenues rose by 7.7% YoY driven
by IPTV subscriber growth and paid contents sales
increase
SK Planet
- Total operating revenues decreased by 27.6%
YoY as a result of spin-offs* in 2016
(*LBS business, SK TechX, One Store)
- Increased by 8.2% QoQ in line with growth in
e-commerce business
1) Others : High speed internet, residential, B2B, others, etc.
SK Broadband
operating
revenues
1Q15 2Q15 3Q15 4Q15 1Q16 2Q16 3Q16 4Q16
20.7% 22.6% 23.5% 24.9% 27.5% 27.8% 28.9% 30.4%
IPTV revenue to
total revenue(%)
646 669
686
730 706 716
751 770
10
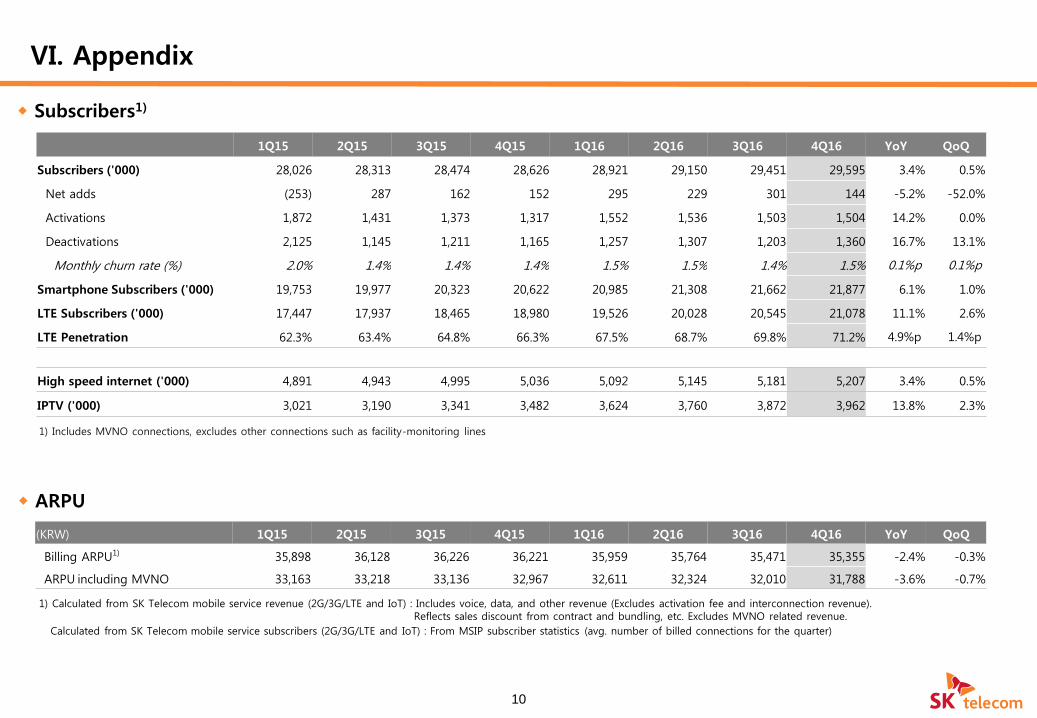
Subscribers1)
1) Includes MVNO connections, excludes other connections such as facility-monitoring lines
ARPU
VI. Appendix
1Q15 2Q15 3Q15 4Q15 1Q16 2Q16 3Q16 4Q16 YoY QoQ
Subscribers ('000) 28,026 28,313 28,474 28,626 28,921 29,150 29,451 29,595 3.4% 0.5%
Net adds (253) 287 162 152 295 229 301 144 -5.2% -52.0%
Activations 1,872 1,431 1,373 1,317 1,552 1,536 1,503 1,504 14.2% 0.0%
Deactivations 2,125 1,145 1,211 1,165 1,257 1,307 1,203 1,360 16.7% 13.1%
Monthly churn rate (%) 2.0% 1.4% 1.4% 1.4% 1.5% 1.5% 1.4% 1.5% 0.1%p 0.1%p
Smartphone Subscribers ('000) 19,753 19,977 20,323 20,622 20,985 21,308 21,662 21,877 6.1% 1.0%
LTE Subscribers ('000) 17,447 17,937 18,465 18,980 19,526 20,028 20,545 21,078 11.1% 2.6%
LTE Penetration 62.3% 63.4% 64.8% 66.3% 67.5% 68.7% 69.8% 71.2% 4.9%p 1.4%p
High speed internet ('000) 4,891 4,943 4,995 5,036 5,092 5,145 5,181 5,207 3.4% 0.5%
IPTV ('000) 3,021 3,190 3,341 3,482 3,624 3,760 3,872 3,962 13.8% 2.3%
(KRW) 1Q15 2Q15 3Q15 4Q15 1Q16 2Q16 3Q16 4Q16 YoY QoQ
Billing ARPU1) 35,898 36,128 36,226 36,221 35,959 35,764 35,471 35,355 -2.4% -0.3%
ARPU including MVNO 33,163 33,218 33,136 32,967 32,611 32,324 32,010 31,788 -3.6% -0.7%
1) Calculated from SK Telecom mobile service revenue (2G/3G/LTE and IoT) : Includes voice, data, and other revenue (Excludes activation fee and interconnection revenue). Reflects sales discount from contract and bundling, etc. Excludes MVNO related revenue.
Calculated from SK Telecom mobile service subscribers (2G/3G/LTE and IoT) : From MSIP subscriber statistics (avg. number of billed connections for the quarter)
11
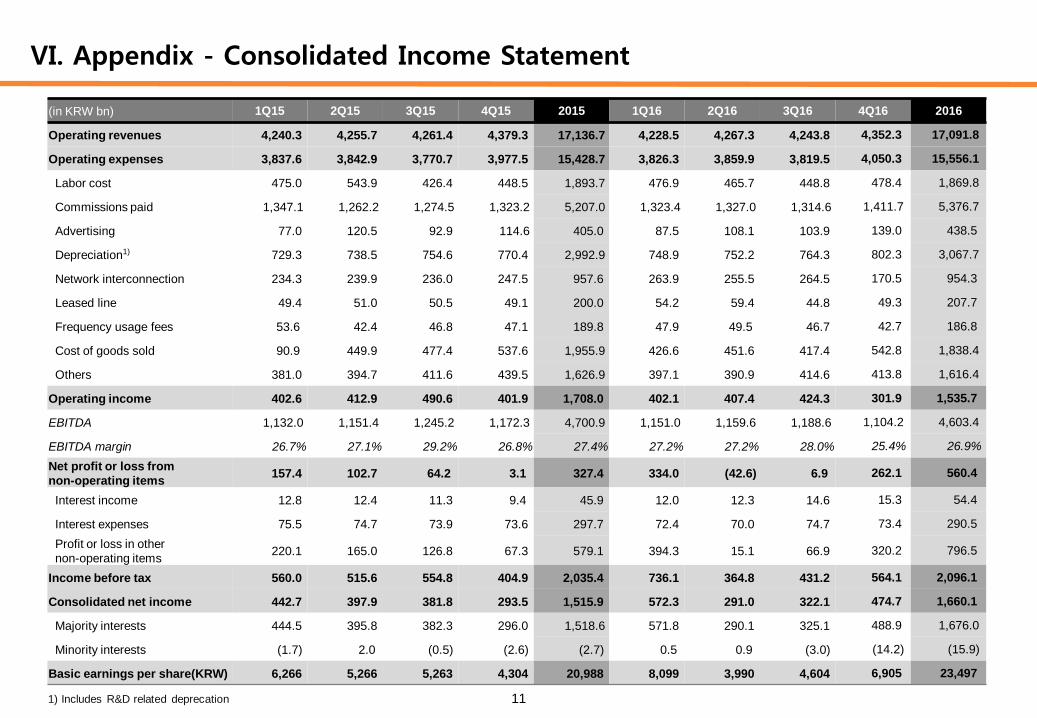
VI. Appendix - Consolidated Income Statement
1) Includes R&D related deprecation
(in KRW bn) 1Q15 2Q15 3Q15 4Q15 2015 1Q16 2Q16 3Q16 4Q16 2016
Operating revenues 4,240.3 4,255.7 4,261.4 4,379.3 17,136.7 4,228.5 4,267.3 4,243.8 4,352.3 17,091.8
Operating expenses 3,837.6 3,842.9 3,770.7 3,977.5 15,428.7 3,826.3 3,859.9 3,819.5 4,050.3 15,556.1
Labor cost 475.0 543.9 426.4 448.5 1,893.7 476.9 465.7 448.8 478.4 1,869.8
Commissions paid 1,347.1 1,262.2 1,274.5 1,323.2 5,207.0 1,323.4 1,327.0 1,314.6 1,411.7 5,376.7
Advertising 77.0 120.5 92.9 114.6 405.0 87.5 108.1 103.9 139.0 438.5
Depreciation1) 729.3 738.5 754.6 770.4 2,992.9 748.9 752.2 764.3 802.3 3,067.7
Network interconnection 234.3 239.9 236.0 247.5 957.6 263.9 255.5 264.5 170.5 954.3
Leased line 49.4 51.0 50.5 49.1 200.0 54.2 59.4 44.8 49.3 207.7
Frequency usage fees 53.6 42.4 46.8 47.1 189.8 47.9 49.5 46.7 42.7 186.8
Cost of goods sold 90.9 449.9 477.4 537.6 1,955.9 426.6 451.6 417.4 542.8 1,838.4
Others 381.0 394.7 411.6 439.5 1,626.9 397.1 390.9 414.6 413.8 1,616.4
Operating income 402.6 412.9 490.6 401.9 1,708.0 402.1 407.4 424.3 301.9 1,535.7
EBITDA 1,132.0 1,151.4 1,245.2 1,172.3 4,700.9 1,151.0 1,159.6 1,188.6 1,104.2 4,603.4
EBITDA margin 26.7% 27.1% 29.2% 26.8% 27.4% 27.2% 27.2% 28.0% 25.4% 26.9%
Net profit or loss from
non-operating items 157.4 102.7 64.2 3.1 327.4 334.0 (42.6) 6.9 262.1 560.4
Interest income 12.8 12.4 11.3 9.4 45.9 12.0 12.3 14.6 15.3 54.4
Interest expenses 75.5 74.7 73.9 73.6 297.7 72.4 70.0 74.7 73.4 290.5
Profit or loss in other
non-operating items 220.1 165.0 126.8 67.3 579.1 394.3 15.1 66.9 320.2 796.5
Income before tax 560.0 515.6 554.8 404.9 2,035.4 736.1 364.8 431.2 564.1 2,096.1
Consolidated net income 442.7 397.9 381.8 293.5 1,515.9 572.3 291.0 322.1 474.7 1,660.1
Majority interests 444.5 395.8 382.3 296.0 1,518.6 571.8 290.1 325.1 488.9 1,676.0
Minority interests (1.7) 2.0 (0.5) (2.6) (2.7) 0.5 0.9 (3.0) (14.2) (15.9)
Basic earnings per share(KRW) 6,266 5,266 5,263 4,304 20,988 8,099 3,990 4,604 6,905 23,497
12
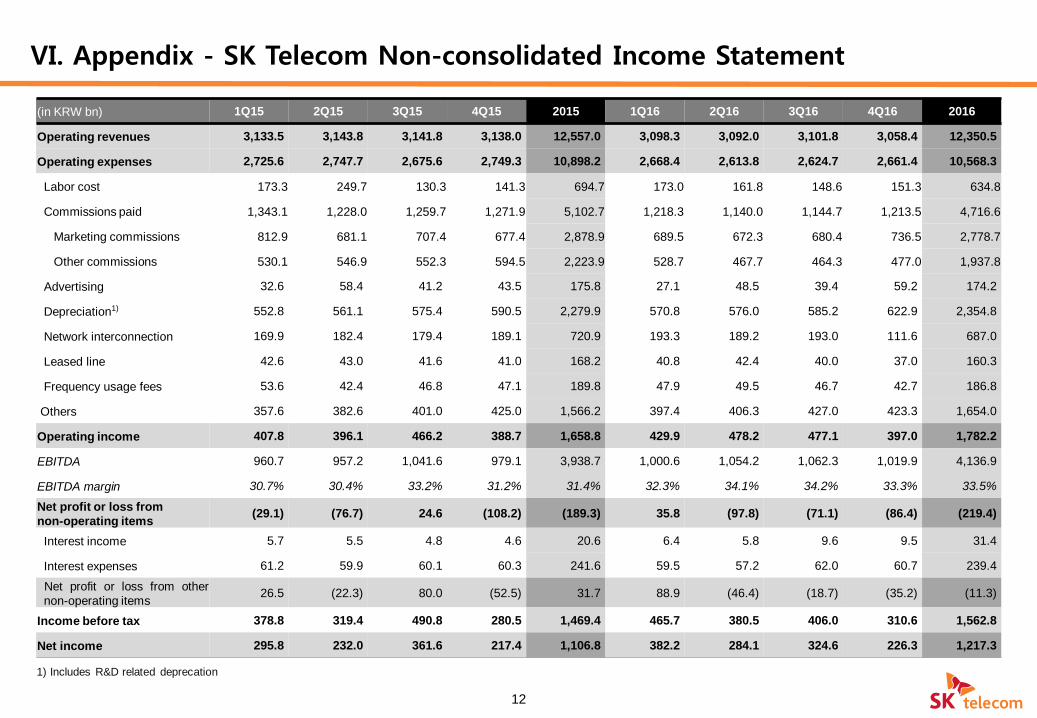
VI. Appendix - SK Telecom Non-consolidated Income Statement
(in KRW bn) 1Q15 2Q15 3Q15 4Q15 2015 1Q16 2Q16 3Q16 4Q16 2016
Operating revenues 3,133.5 3,143.8 3,141.8 3,138.0 12,557.0 3,098.3 3,092.0 3,101.8 3,058.4 12,350.5
Operating expenses 2,725.6 2,747.7 2,675.6 2,749.3 10,898.2 2,668.4 2,613.8 2,624.7 2,661.4 10,568.3
Labor cost 173.3 249.7 130.3 141.3 694.7 173.0 161.8 148.6 151.3 634.8
Commissions paid 1,343.1 1,228.0 1,259.7 1,271.9 5,102.7 1,218.3 1,140.0 1,144.7 1,213.5 4,716.6
Marketing commissions 812.9 681.1 707.4 677.4 2,878.9 689.5 672.3 680.4 736.5 2,778.7
Other commissions 530.1 546.9 552.3 594.5 2,223.9 528.7 467.7 464.3 477.0 1,937.8
Advertising 32.6 58.4 41.2 43.5 175.8 27.1 48.5 39.4 59.2 174.2
Depreciation1) 552.8 561.1 575.4 590.5 2,279.9 570.8 576.0 585.2 622.9 2,354.8
Network interconnection 169.9 182.4 179.4 189.1 720.9 193.3 189.2 193.0 111.6 687.0
Leased line 42.6 43.0 41.6 41.0 168.2 40.8 42.4 40.0 37.0 160.3
Frequency usage fees 53.6 42.4 46.8 47.1 189.8 47.9 49.5 46.7 42.7 186.8
Others 357.6 382.6 401.0 425.0 1,566.2 397.4 406.3 427.0 423.3 1,654.0
Operating income 407.8 396.1 466.2 388.7 1,658.8 429.9 478.2 477.1 397.0 1,782.2
EBITDA 960.7 957.2 1,041.6 979.1 3,938.7 1,000.6 1,054.2 1,062.3 1,019.9 4,136.9
EBITDA margin 30.7% 30.4% 33.2% 31.2% 31.4% 32.3% 34.1% 34.2% 33.3% 33.5%
Net profit or loss from
non-operating items (29.1) (76.7) 24.6 (108.2) (189.3) 35.8 (97.8) (71.1) (86.4) (219.4)
Interest income 5.7 5.5 4.8 4.6 20.6 6.4 5.8 9.6 9.5 31.4
Interest expenses 61.2 59.9 60.1 60.3 241.6 59.5 57.2 62.0 60.7 239.4
Net profit or loss from other
non-operating items 26.5 (22.3) 80.0 (52.5) 31.7 88.9 (46.4) (18.7) (35.2) (11.3)
Income before tax 378.8 319.4 490.8 280.5 1,469.4 465.7 380.5 406.0 310.6 1,562.8
Net income 295.8 232.0 361.6 217.4 1,106.8 382.2 284.1 324.6 226.3 1,217.3
1) Includes R&D related deprecation
13
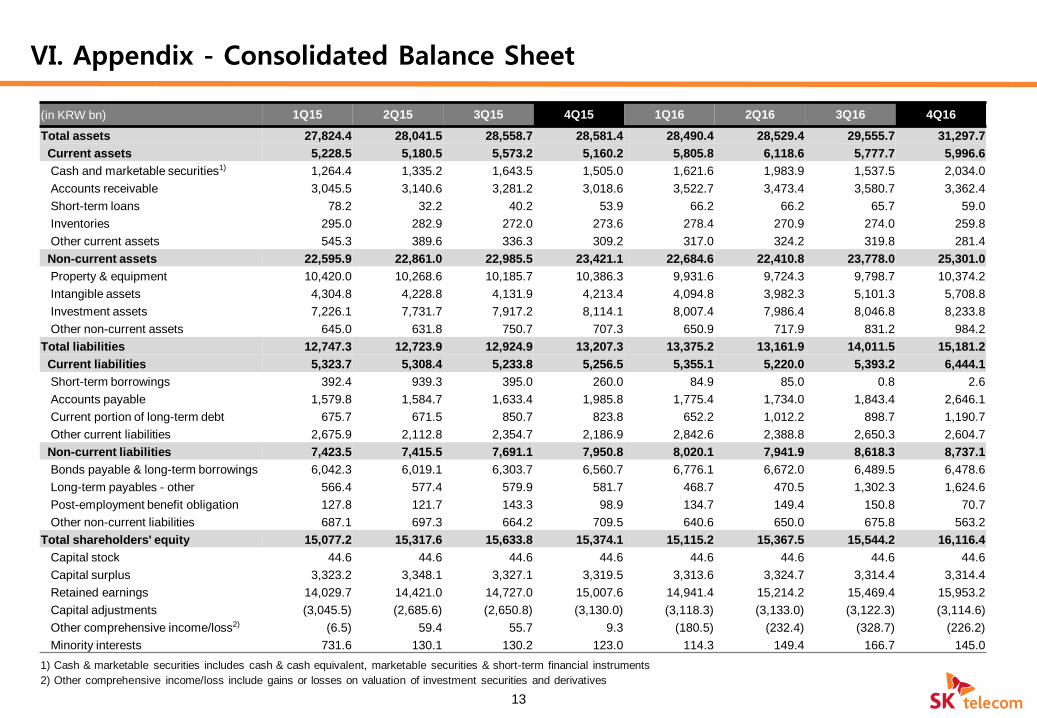
VI. Appendix - Consolidated Balance Sheet
(in KRW bn) 1Q15 2Q15 3Q15 4Q15 1Q16 2Q16 3Q16 4Q16
Total assets 27,824.4 28,041.5 28,558.7 28,581.4 28,490.4 28,529.4 29,555.7 31,297.7
Current assets 5,228.5 5,180.5 5,573.2 5,160.2 5,805.8 6,118.6 5,777.7 5,996.6
Cash and marketable securities1) 1,264.4 1,335.2 1,643.5 1,505.0 1,621.6 1,983.9 1,537.5 2,034.0
Accounts receivable 3,045.5 3,140.6 3,281.2 3,018.6 3,522.7 3,473.4 3,580.7 3,362.4
Short-term loans 78.2 32.2 40.2 53.9 66.2 66.2 65.7 59.0
Inventories 295.0 282.9 272.0 273.6 278.4 270.9 274.0 259.8
Other current assets 545.3 389.6 336.3 309.2 317.0 324.2 319.8 281.4
Non-current assets 22,595.9 22,861.0 22,985.5 23,421.1 22,684.6 22,410.8 23,778.0 25,301.0
Property & equipment 10,420.0 10,268.6 10,185.7 10,386.3 9,931.6 9,724.3 9,798.7 10,374.2
Intangible assets 4,304.8 4,228.8 4,131.9 4,213.4 4,094.8 3,982.3 5,101.3 5,708.8
Investment assets 7,226.1 7,731.7 7,917.2 8,114.1 8,007.4 7,986.4 8,046.8 8,233.8
Other non-current assets 645.0 631.8 750.7 707.3 650.9 717.9 831.2 984.2
Total liabilities 12,747.3 12,723.9 12,924.9 13,207.3 13,375.2 13,161.9 14,011.5 15,181.2
Current liabilities 5,323.7 5,308.4 5,233.8 5,256.5 5,355.1 5,220.0 5,393.2 6,444.1
Short-term borrowings 392.4 939.3 395.0 260.0 84.9 85.0 0.8 2.6
Accounts payable 1,579.8 1,584.7 1,633.4 1,985.8 1,775.4 1,734.0 1,843.4 2,646.1
Current portion of long-term debt 675.7 671.5 850.7 823.8 652.2 1,012.2 898.7 1,190.7
Other current liabilities 2,675.9 2,112.8 2,354.7 2,186.9 2,842.6 2,388.8 2,650.3 2,604.7
Non-current liabilities 7,423.5 7,415.5 7,691.1 7,950.8 8,020.1 7,941.9 8,618.3 8,737.1
Bonds payable & long-term borrowings 6,042.3 6,019.1 6,303.7 6,560.7 6,776.1 6,672.0 6,489.5 6,478.6
Long-term payables - other 566.4 577.4 579.9 581.7 468.7 470.5 1,302.3 1,624.6
Post-employment benefit obligation 127.8 121.7 143.3 98.9 134.7 149.4 150.8 70.7
Other non-current liabilities 687.1 697.3 664.2 709.5 640.6 650.0 675.8 563.2
Total shareholders' equity 15,077.2 15,317.6 15,633.8 15,374.1 15,115.2 15,367.5 15,544.2 16,116.4
Capital stock 44.6 44.6 44.6 44.6 44.6 44.6 44.6 44.6
Capital surplus 3,323.2 3,348.1 3,327.1 3,319.5 3,313.6 3,324.7 3,314.4 3,314.4
Retained earnings 14,029.7 14,421.0 14,727.0 15,007.6 14,941.4 15,214.2 15,469.4 15,953.2
Capital adjustments (3,045.5) (2,685.6) (2,650.8) (3,130.0) (3,118.3) (3,133.0) (3,122.3) (3,114.6)
Other comprehensive income/loss2) (6.5) 59.4 55.7 9.3 (180.5) (232.4) (328.7) (226.2)
Minority interests 731.6 130.1 130.2 123.0 114.3 149.4 166.7 145.0
1) Cash & marketable securities includes cash & cash equivalent, marketable securities & short-term financial instruments
2) Other comprehensive income/loss include gains or losses on valuation of investment securities and derivatives
14
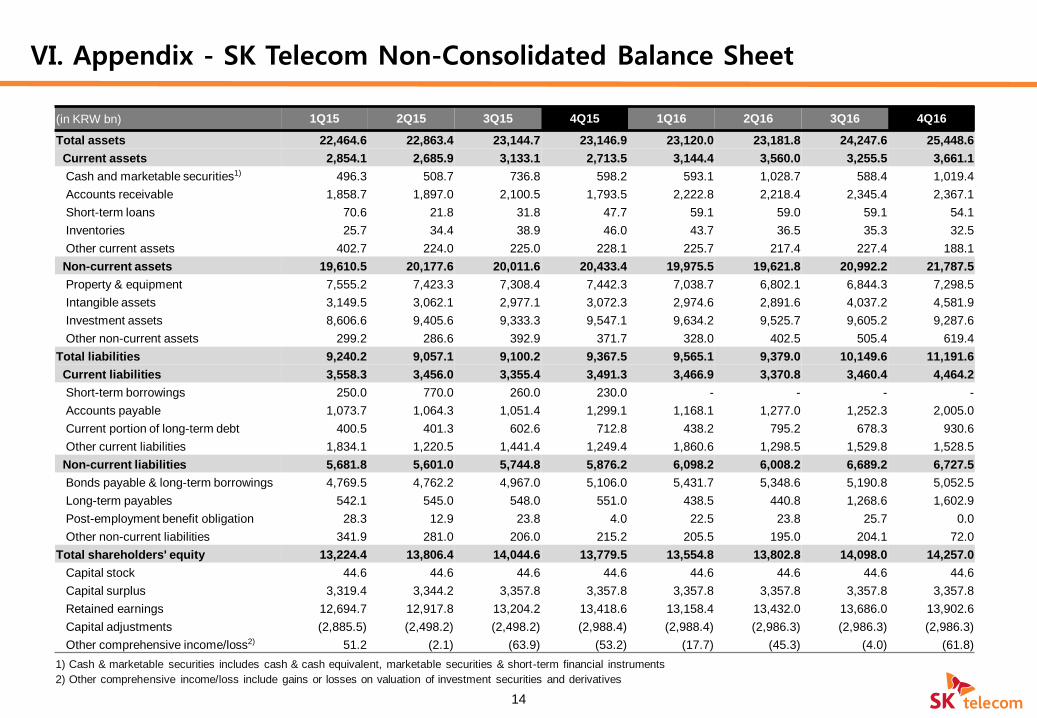
VI. Appendix - SK Telecom Non-Consolidated Balance Sheet
(in KRW bn) 1Q15 2Q15 3Q15 4Q15 1Q16 2Q16 3Q16 4Q16
Total assets 22,464.6 22,863.4 23,144.7 23,146.9 23,120.0 23,181.8 24,247.6 25,448.6
Current assets 2,854.1 2,685.9 3,133.1 2,713.5 3,144.4 3,560.0 3,255.5 3,661.1
Cash and marketable securities1) 496.3 508.7 736.8 598.2 593.1 1,028.7 588.4 1,019.4
Accounts receivable 1,858.7 1,897.0 2,100.5 1,793.5 2,222.8 2,218.4 2,345.4 2,367.1
Short-term loans 70.6 21.8 31.8 47.7 59.1 59.0 59.1 54.1
Inventories 25.7 34.4 38.9 46.0 43.7 36.5 35.3 32.5
Other current assets 402.7 224.0 225.0 228.1 225.7 217.4 227.4 188.1
Non-current assets 19,610.5 20,177.6 20,011.6 20,433.4 19,975.5 19,621.8 20,992.2 21,787.5
Property & equipment 7,555.2 7,423.3 7,308.4 7,442.3 7,038.7 6,802.1 6,844.3 7,298.5
Intangible assets 3,149.5 3,062.1 2,977.1 3,072.3 2,974.6 2,891.6 4,037.2 4,581.9
Investment assets 8,606.6 9,405.6 9,333.3 9,547.1 9,634.2 9,525.7 9,605.2 9,287.6
Other non-current assets 299.2 286.6 392.9 371.7 328.0 402.5 505.4 619.4
Total liabilities 9,240.2 9,057.1 9,100.2 9,367.5 9,565.1 9,379.0 10,149.6 11,191.6
Current liabilities 3,558.3 3,456.0 3,355.4 3,491.3 3,466.9 3,370.8 3,460.4 4,464.2
Short-term borrowings 250.0 770.0 260.0 230.0 - - - -
Accounts payable 1,073.7 1,064.3 1,051.4 1,299.1 1,168.1 1,277.0 1,252.3 2,005.0
Current portion of long-term debt 400.5 401.3 602.6 712.8 438.2 795.2 678.3 930.6
Other current liabilities 1,834.1 1,220.5 1,441.4 1,249.4 1,860.6 1,298.5 1,529.8 1,528.5
Non-current liabilities 5,681.8 5,601.0 5,744.8 5,876.2 6,098.2 6,008.2 6,689.2 6,727.5
Bonds payable & long-term borrowings 4,769.5 4,762.2 4,967.0 5,106.0 5,431.7 5,348.6 5,190.8 5,052.5
Long-term payables 542.1 545.0 548.0 551.0 438.5 440.8 1,268.6 1,602.9
Post-employment benefit obligation 28.3 12.9 23.8 4.0 22.5 23.8 25.7 0.0
Other non-current liabilities 341.9 281.0 206.0 215.2 205.5 195.0 204.1 72.0
Total shareholders' equity 13,224.4 13,806.4 14,044.6 13,779.5 13,554.8 13,802.8 14,098.0 14,257.0
Capital stock 44.6 44.6 44.6 44.6 44.6 44.6 44.6 44.6
Capital surplus 3,319.4 3,344.2 3,357.8 3,357.8 3,357.8 3,357.8 3,357.8 3,357.8
Retained earnings 12,694.7 12,917.8 13,204.2 13,418.6 13,158.4 13,432.0 13,686.0 13,902.6
Capital adjustments (2,885.5) (2,498.2) (2,498.2) (2,988.4) (2,988.4) (2,986.3) (2,986.3) (2,986.3)
Other comprehensive income/loss2) 51.2 (2.1) (63.9) (53.2) (17.7) (45.3) (4.0) (61.8)
1) Cash & marketable securities includes cash & cash equivalent, marketable securities & short-term financial instruments
2) Other comprehensive income/loss include gains or losses on valuation of investment securities and derivatives