Embed Size (px)
Citation preview

288
WMO/CAS/WWW
SIXTH INTERNATIONAL WORKSHOP on TROPICAL CYCLONES Topic 2.3 : Operational Forecasting of Tropical Cyclone Formation Rapporteur: Jeff Callaghan Bureau of Meteorology, 295 Ann Street Brisbane 4001, Australia. E-mail [email protected] Fax: 61 7 32214895 Working Group: Peter Otto, Steve Ready, Todd Smith, Alipate Waqaicelua. Abstract: Tropical cyclone formation occurs mostly in data sparse oceanic regions and heavy reliance is made on satellite data to locate, analyse and forecast these processes. In the Australian region formation can occur near the coast and near observational data. We use this data to show that numerical models can at times accurately forecast tropical cyclone formation and in doing so also forecast accurately the thermal structure in the lower region of the troposphere. We also address the cases of rapid intensification of tropical cyclones in strong vertical wind shear that are often not forecast by the numerical models. 2.3.1 Introduction. Tropical cyclone formation at times is forecast extremely well by the numerical modes and we present several examples of these cases. In some other situations the models provide a general and useful hint at impending tropical cyclone formation by forecasting the development of a low pressure area in the general region of interest so that then continued monitoring is essential. At the other end of the forecasting scale there are events where the models do not forecast the rapid formation of small tropical lows into tropical cyclones and these continue to cause loss of life. We describe the mechanisms associated with this type of cyclogenesis, which was first cited as a serious problem for Island countries in the Southwest Pacific at a Coral Sea Region Tropical Cyclone Coordination meeting on 4-5 November 1999 in Brisbane. 2.3.2. Thermal structure and isentropic ascent. Many reports of torrential rainfall in the northeast Australian region indicate that this occurs mostly when the wind direction backs with height. Consistent with this are the long-term mean (more than fifty years) vertical wind profile for heavy rain events in Cairns Meteorological Station. Cairns is located at Latitude 160 52’25” South on the northeast coast of Australia. The mean wind producing 24 hour rainfall totals of 150mm or more and averaged over the 24 hours leading up to when the rain gauge is read is: -130/13 knots at 950 hPa backing to 095/17 knots at 850 hPa backing to 074/13 knots at 700 hPa and backing to 021/05 knots at 500 hPa.
Heavy tropical rain reports have been documented in Bonell, Callaghan and Connor (2005) and Callaghan and Bonell (2005). For weaker rainfall, Connor and Bonell (1998) found that warm air advection, particularly in the layer between 950 and 800 hPa, contributed significantly to trade wind precipitation amounts along the north Queensland coast. There are several studies, which focus on this

289
process of shear causing isentropic ascent, which leads to the generation of convection. These studies are Fritsch et al (1994), Raymond and Jiang (1990) and Raymond (1992). The warm and cold air advection patterns that we present here resemble in their simplest form Figure 6 in Raymond and Jiang (1990), which illustrated a 700 hPa surface where the upward (downward) motion was correlated with warm (cold) air advection. In our studies we have concentrated on this 700hPa level in an attempt to locate general areas of isentropic ascent and descent. The 850 to 500hPa vertical wind shear and thicknesses represent the thermal patterns on these 700hPa surfaces. These thermal structures can also be deduced operationally by attention to the synoptic 850 hPa and 500 hPa charts. In the simplest cases, patterns that bring cooler 700hPa air near to the cyclone, are associated with a trough system increasing in intensity with height between 850 hPa and 500 hPa or ridging decreasing with height. Therefore for an intensifying cyclone moving eastwards we see a short wave 500 hPa trough move closer to the cyclone. For a westward moving intensifying cyclone the synoptic charts show a weakness develop in the 500hPa ridge south of the cyclone. 2.3.3 Rapid cyclogenesis. Research by Holliday and Thompson (1979) indicates that 75% of all western North Pacific tropical cyclones deeper than 920 hPa have experienced a period of rapid intensification of 42hPa per day or more. Extreme deepening rates of nearly 100hPa per day have been observed. All tropical cyclones, even the weaker ones, should therefore be regarded as potentially serious. As an illustration of how quickly cyclogenesis can proceed with small tropical cyclones Figure 2.3.1 shows a weak tropical low surrounded by winds of only 10 to 15 knots at 0500UTC 26 January 1996 intensified into a category 3 tropical cyclone (Celeste) in 24 hours.
Figure 2.3.1 (left). The rapid cyclogenesis of tropical cyclone Celeste near from Townsville and Mackay radars and GMS satellite imagery bottom right panels. Figure 2.3.2 (right). The Madden Julian Oscillation (MJO) from 6 January 2006 to 12 February 2006. Examples in the Australian region include Chloe (1994 in WA) deepened from a central pressure of 995 hPa to 955hPa in 24 hours. Similarly Barry went from 990 hPa to 950hPa in 24 hours in the Gulf of Carpentaria. Coral Sea cyclones Celeste deepened from 995 to 965 hPa in 12 hours, Rona from 995 to
290
970hPa in 13 hours, and Steve from 996hPa to 980hPa in 12 hours. Recent Atlantic examples of extreme intensification rates include Wilma deepening 83hPa in 12 hours and Rita deepening 44hPa in 12 hours. 2.3.4 Predictable tropical cyclone formation associated with a burst in the Madden Julian Oscillation (MJO). In Figure 2.3.2 an active phase of the MJO can be seen to cross the Australian continent and move into the southwest Pacific from the Outgoing Longwave Radiation (OLR) sequence. This MJO helped form Western Australian (WA) tropical cyclones Clare (8 January) and Daryl (19 January), the Central Australian cyclone or the so called Landphoon (27 January), Coral Sea Cyclone Jim (28 January) and Fiji cyclone Vaianu (12 February. Below we compare the 144-hour European Centre for Medium Range Weather Forecasting Centre (EC) forecasts with the verifying analyses. The EC forecast at 0000UTC 13 January 2006 showed a 990hPa mean sea level (MSL) low just north of Broome on the northern WA coast at 0000UTC 19 January. At 0000UTC 19 January Tropical cyclone Daryl, category 1 was 100km north of the forecast position. Daryl was named 12 hours earlier. Below in Figure 2.3.3 the 700hPa forecasts and verifying analysis show similar thermal patterns at 700hPa with the main warm air advection region west of the centre where the microwave data (centre panels Figure 3) show the deep convection to be located.

291
Figure 2.3.3(top)…EC 700hPa winds (black) 850/500hPa shears (red) and 850/500hPa contours (blue) with actual observations plotted larger. Large red (blue) arrows highlight areas of warm (cold) air advection. For 144 hour forecast and verifying analyses at 0000UTC 19 January 2006. (Centre panels) 91 GHz horizontally polarised microwave image for 1220 UTC 18 January 2006 (left) and 1207UTC 19 January 2006 (right). (Lower panels) EC 200hPa winds for 144 hour forecast and verifying analyses at 0000UTC 19 January 2006 with actual observations plotted larger.

292
The upper patterns (lower panels) are also similar with a weak trough to the southeast of the cyclone and accelerating easterly flow to the west of the centre over the convection. Therefore as the large scale 850 and 500hPa flow generates the thermal structure the very accurate forecast of formation of the tropical cyclone was associated with an accurate forecast of the large scale environment of the tropical cyclone. Similarly both the EC 120 hour forecasts at 1200UTC 5 February 2006 and 1200UTC 6 February forecast a 1000hPa low to form east of Fiji. Again in Figure 2.3.4, the 120-hour forecasts and analyses at 0000UTC 11 February are compared. These are again found to be similar with the 700hPa warm air advection chiefly in the northwest quadrant where the microwave data located the deep convection (not shown) and the centre of the low being located under 200hPa diffluent flow between easterly and southerly winds. Tropical cyclone Vaianu formed in this area at 0000UTC 12 February 2006.
Figure 2.3.4 EC 700hPa and 200hPa as in Figure 3 except for 120 hour forecast and verifying analyses at 0000UTC 11 February 2006.
293
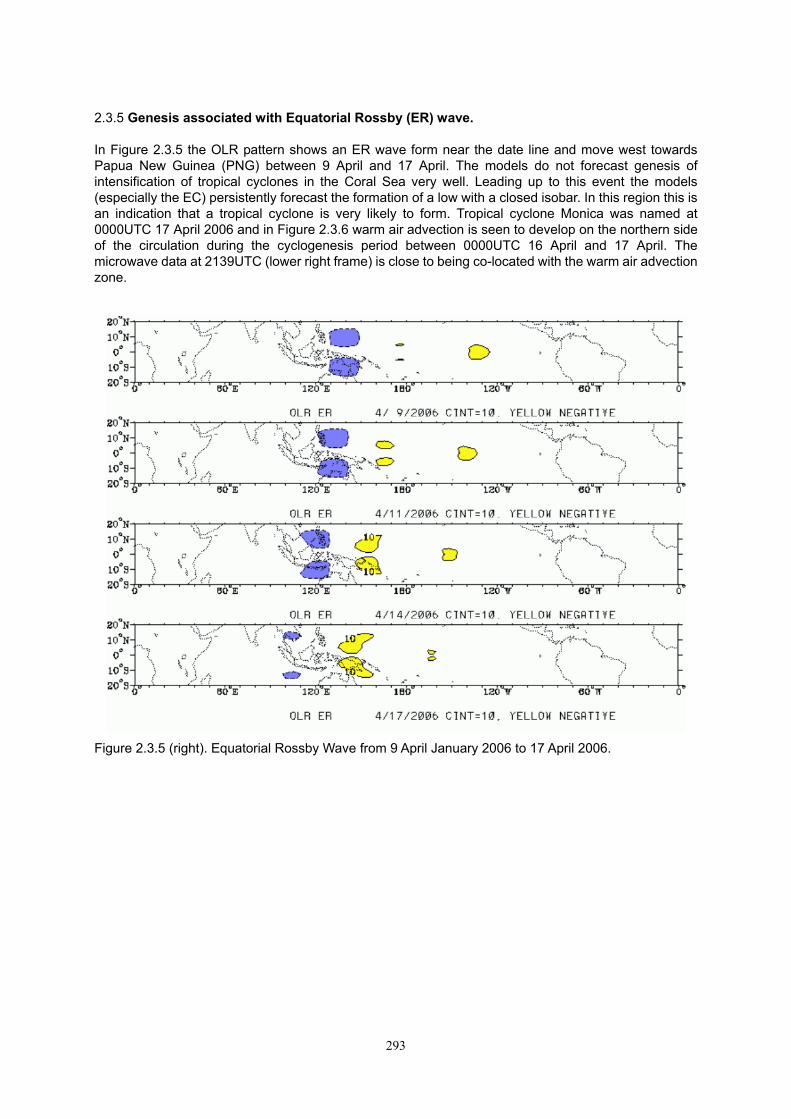
2.3.5 Genesis associated with Equatorial Rossby (ER) wave. In Figure 2.3.5 the OLR pattern shows an ER wave form near the date line and move west towards Papua New Guinea (PNG) between 9 April and 17 April. The models do not forecast genesis of intensification of tropical cyclones in the Coral Sea very well. Leading up to this event the models (especially the EC) persistently forecast the formation of a low with a closed isobar. In this region this is an indication that a tropical cyclone is very likely to form. Tropical cyclone Monica was named at 0000UTC 17 April 2006 and in Figure 2.3.6 warm air advection is seen to develop on the northern side of the circulation during the cyclogenesis period between 0000UTC 16 April and 17 April. The microwave data at 2139UTC (lower right frame) is close to being co-located with the warm air advection zone.
Figure 2.3.5 (right). Equatorial Rossby Wave from 9 April January 2006 to 17 April 2006.

294
Figure 2.3.6 700hPa analyses (left panels) as in Figure 3 except during the genesis of Monica. Microwave (right panels) depiction of the genesis of Monica near the southeast tip of PNG. 2.3.6 Genesis associated with southern Hemisphere influence. The initial vortex associated with the genesis of tropical cyclone Larry appeared to originate at middle levels from a trough system extending into the tropics from the south. This occurred during a suppressed phase of the MJO. Tropical cyclone Larry was named at 1800UTC 17 March and the 700hPa sequence (Figure 2.3.7) through the genesis period show an extensive area of warm air advection develop in the southeast quadrant with very little subsiding cold air advection near the system. The microwave sequence in Figure 2.3.8 covers the genesis period and the ultimate formation of an eye. Note how the convection is mostly confined to the southeast quadrant before wrapping around to form an eye.

295
Figure 2.3.7 700hPa analyses as in Figure 3 except during the genesis of Larry.
Figure 2.3.8 Microwave (lower panels) depiction of the genesis of Larry. 2.3.7 Tropical cyclone formation in strong vertical wind shear. This group of cyclones tend to be not properly warned for. This occurs due to their rapid rate of formation and the Dvorak (1984) satellite intensity analyses scheme does not indicate patterns which would be associated with conventional tropical cyclones. Tropical cyclone Kelvin. For the example in Figure 2.3.9, the 700hPa and 200hPa charts are at a time during the rapid genesis and intensification of tropical cyclone Kelvin when it developed from a weak tropical low into a hurricane force cyclone in 24 hours. At 700hPa there was an indication of a strong dipole of cold and warm air advection by the strong 850 to 500hPa vertical wind shears immediately

296
south of the developing cyclone. The NCEP/NCAR reanalyses showed a tropopause undulation near Mt Isa (where the temperature of -49oC is plotted. The system was moving towards 120 degrees at 18 knots and storm relative wind plots and streamlines are also shown in Figure 2.3.9. These show outflow from the developing cyclone rather than inflow from the warm tropopause undulation. Nearing peak intensity (Figure 2.3.10) it had yet to be named as the Dvorak analyses at the time indicated it was a shear pattern just below tropical cyclone intensity. However at 1230UTC 25 February 1991 (at the time of the satellite image in Figure 2.3.10) the wind at Willis Island was southerly averaging 65 knots and gusting to 85 knot. This placed the centre just outside the area of deep convective cloud tops.
Figure 2.3.9(left) 700hPa observations (as in Figure 2.3.3) except during rapid genesis of Kelvin 200hPa observations (right) and storm relative winds and streamlines.
Figure 2.3.10.. Enhanced Infrared satellite imagery of tropical cyclone Kelvin at Peak intensity near Willis Island at 12300UTC 25 February 1991. Port Moresby Cyclone 2005. The 700hPa sequence (Figure 2.3.11) shows the period of rapid intensification as the cyclone moved towards Port Moresby and causing severe damage at that centre soon after. Note how the thermal gradient and shears increase near the cyclone as a thermal trough extends up onto Cape York Peninsula. The 200hPa pattern initially (at 0000UTC 14 April 2005) was

297
diffluent over the region between Cape York Peninsula to the southeast area of PNG and this was a pattern we often see during cyclogenesis. However at 0000UTC 15 April the winds over the system were not visibly diffluent and the cyclone began rapidly weakening over the following 6 hours as it moved eastwards towards the southeast tip of PNG.
Figure 2.3.11.. 700hPa and 200hPa analyses as in Figure 3 except during the rapid genesis of the Port Moresby cyclone.
Figure 2.3.12. Rapid intensification of the Fiji 2004 cyclone from microwave data.

298
Figure 2.3.13. Enhanced Infrared satellite imagery shows rapid increase in cold cloud over a period of 5 hours.
Figure 2.3.14.700hPa and 200hPa analyses from actual observations and NCEP/NCAR reanalyses data during the rapid genesis of the Fiji (2004) tropical cyclone. Fiji Cyclone 2004. This was a small system and it proved quite difficult to track until it moved within the range of the Nadi radar. Minimum pressure recorded was 990hPa and one of the stations in Fiji reported sustained winds of 43 knots before it stopped transmitting. Numerical forecast models failed to

299
forecast the development of this system. The microwave sequence (Figure 2.3.12) clearly shows the rapid intensification of this system northwest of Nadi while the EIR sequence (Figure 2.3.13) indicated the rapid increase in convection up to 1125UTC when it would needed to have been named to provide any useful warning. The 700hPa sequence (Figure 2.3.14) has been reconstructed from the sparse actual data and a re adjustment of the NCEP/NCAR reanalyses which had the low level vortex in the wrong area. The intensification is associated with a thermal trough moving up towards Fiji. The 200hPa winds show a diffluent pattern over Fiji during the intensification. Hurricane Gabrielle. During the period covered by Figure 2.3.15 aircraft reconnaissance calculated the central pressure of Gabrielle fell from 992hPa to 972 hPa in 3 hours. As with the three southern Hemisphere cyclones above, the rapid formation and intensification occurred in the region of strong 700hPa thermal gradient. However the intensification of Gabrielle also occurred as it moved under a warm air advection zone at 200hPa. From Hirschberg and Fritsch 1993, this would force pressure falls in the centre of the hurricane. We will present examples where the interaction of a tropical cyclone and tropopause undulation has similarly been associated with rapid cyclogenesis including the so called hybrid systems.
Figure 2.3.15. 700hPa and 200hPa analyses using conventional observations, reconnaissance data and NCEP/NCAR reanalyses data. 700hPa analyses are as above but 200hPa analyses include isotherms that identify tropopause undulation from temperature maximum. The red arrows in the 200hPa analyses highlight the areas of warm air advection originating from the tropopause undulation.

300
2.3.8 Recent low latitude cyclogenesis in Appendix. In the Appendix we illustrate the rapid formation of typhoon Ewiniar. This shows the warm/cold air advection patterns even at low latitudes and the microwave indicating the convection being located on the warm air advection side of the storm. The typhoon was still a weak depression at 1200UTC 29 June 2006. At this time the EC correctly forecast the 700hPa thermal structure and advection patterns 72 hours in advance, when the rapid intensification to a super typhoon began. The favorable upper outflow structure both actual and forecast will also be presented. 2.3.9 Summary. We show how numerical models at times can provide excellent forecasts of the formation of tropical cyclones. Associated with these correct forecasts are similarly accurate forecasts of the thermal structure of tropical cyclones indicating that these structures are important to the intensification mechanism. We also discuss other events where knowledge of the model performance in the basin can alert forecasters to increase the monitoring of likely cyclogenesis. Events are also analysed where the models perform badly. Our aim here is to make forecasters aware of the patterns in which these systems evolve so as to give them the confidence to issue early warnings. We will also present null cases when strong upper winds aloft prevent or delay the cyclogenesis and also cases where low 850/200hPa vertical wind appears to favor tropical cyclone formation but the unfavorable shear is hidden in the layers between 850hPa and 500hPa.

301
2.3.10 Appendix
Figure A1 700hPa pattern as in Figure 3, showing the warm air advection pattern developing as typhoon Ewiniar formed between latitude 6 and 10 degrees North.

302
Figure A2. Formation of a microwave eye, note the main rainband on the warm air advection side of the storm and the lack of convection on the cold air advection side of the storm.
Figure A3. 700hPa pattern at the commencement of the period of rapid intensification to a super typhoon and compared with the forecast for this time from 72 hours earlier when the system was still a weak tropical depression.

303
2.3.11 Bibliography Bracken, W.E. and L. F. Bosart. 2000. The Role of Synoptic-Scale Flow during Tropical Cyclogenesis over the North Atlantic Ocean. Mon. Wea Rev. 128. pp 353–376.
Callaghan, J. J. 2004: Tropical Cyclone Intensification, Preprints, The International Conference on Storms Brisbane Queensland Australia July 2004.
Callaghan, J., and M.Bonell 2005: An overview of the Meteorology and climatology of the humid tropics. Forests, Water and People in the Humid Tropics International Hydrological Series Edited by M. Bonell and L. A. Bruijnzeel. Published by Cambridge University Press ISBN 0 521 82953 4, 925 pages
Connor, G. J. and Bonell, M. 1998. Air mass and dynamic parameters affecting trade wind precipitation on the northeast Queensland tropical coast. Int. J. Climatol., 18, 1357-1372.
DeMaria, M., J. A. Knaff, and B. H. Connell, 2001: A Tropical Cyclone Genesis Parameter for the Tropical Atlantic. _Wea. Forecasting, 16, 219-233. Dvorak, V.F. 1984: Tropical Cyclone Intensity Analysis Using Satellite Data. NOAA Technical Report NESDIS 11. 45pp
Dunion, J. P., and C. S. Velden, 2004: The impact of the Saharan air layer on Atlantic tropical cyclone activity. Bull. Amer. Meteor. Soc., 85, 353–365Hanley, D., J.
Hall, J. D., A. J. Matthews, and D. J. Karoly, 2001: The Modulation of Tropical Cyclone Activity in the Australian Region by the Madden-Julian Oscillation. Mon. Wea. Rev., 129, 2970-2982. Hendricks, E. A., M. T. Montgomery, and C. A. Davis, 2004: On the role of “vortical” hot towers in formation of tropical cyclone Diana (1984). J. Atmos. Sci., 61, 1209–1232.
Heymsfield, G. M., J. B. Halverson, J. Simpson, L. Tian, and T. P. Bui, 2001: ER-2 Doppler Radar Investigations of the Eyewall of Hurricane Bonnie during the Convection and Moisture Experiment-3. J. App. Meteor., 40, 1310-1330. Hirschberg Paul A. and J. Michael Fritsch 1993.On Understanding Height Tendency Mon.Wea. Rev. Vol. 121, No. 9, pp. 2646–2661.
Holland,G.J.1984. On the climatology and structure of tropical cyclones in the Australian/southwest Pacific region. Aust. Met. Mag., 32, 1-46.
Holliday, Charles R. and Aylmer H. Thompson 1979: Climatological Characteristics of Rapidly Intensifying Typhoons, Monthly Weather Review: Vol. 107, No. 8, pp. 1022–1034.
Li Tim and Bing Fu. 2006: Tropical Cyclogenesis Associated with Rossby Wave Energy Dispersion of a Preexisting Typhoon. Part I: Satellite Data Analyses. Journal of the Atmospheric Sciences: Vol. 63, No. 5, pp. 1377–1389.
Li Tim and Bing Fu. 2006: Tropical Cyclogenesis Associated with Rossby Wave Energy Dispersion of a Preexisting Typhoon. Part II: Numerical Simulations. Journal of the Atmospheric Sciences: Vol. 63, No. 5, pp. 1390–1409.
Molinari, J., and D. Vollaro, 2000: Planetary and synoptic scale influences on eastern Pacific tropical cyclogenesis. Mon. Wea. Rev., 128, 3296-3307.
304
Molinari, J., D. Vollaro, and K. L. Corbosiero, 2004: Tropical storm formation in a sheared environment. J. Atmos. Sci., 61, 2493–2509.
Molinari, J,Peter Dodge, David Vollaro and Kristen L. Corbosiero Marks Frank Jr. 2006: Mesoscale Aspects of the Downshear Reformation of a Tropical Cyclone. Journal of the Atmospheric Sciences: Vol. 63, No. 1, pp. 341–354.
Montgomery, M.T., M. E. Nicholls, T. A. Cram, and A. B. Saunders. 2006:A Vortical Hot Tower Route to Tropical Cyclogenesis Journal of the Atmospheric Sciences: Vol. 63, No. 1, pp. 355–386. Nakazawa, T., 2001: Suppressed Tropical Cyclone Formation over the Western North Pacific in 1998. J. Meteor. Soc. Japan, 79, 173-183. Paterson, Linda A. Barry N. Hanstrum, Noel E. Davidson, and Harry C. Weber. 2005: Influence of Environmental Vertical Wind Shear on the Intensity of Hurricane-Strength Tropical Cyclones in the Australian Region Monthly Weather Review: Vol. 133, No. 12, pp. 3644–3660. 131B137.
Reasor, P. D., M. T. Montgomery, and L. Bosart, 2005: Mesoscale observations of the genesis of Hurricane Dolly (1996). J. Atmos. Sci., 62, 3151–3171
Ritchie, E. A., 2003: Some aspects of midlevel vortex interaction in tropical cyclogenesis. Cloud Systems, Hurricanes, and the Tropical Rainfall Measuring Mission (TRMM), Meteor. Monogr., No. 51, Amer. Meteor. Soc., 165–174.
Saïdou Moustapha Sall and Henri Sauvageot. 2005: Cyclogenesis off the African Coast: The Case of Cindy in August 1999 Monthly Weather Review: Vol. 133, No. 9, pp. 2803–2813.
Yuh-Lang Lin, Katie E. Robertson, and Christopher M. Hill. 2005: Origin and Propagation of a Disturbance Associated with an African Easterly Wave as a Precursor of Hurricane Alberto (2000) Weather Review: Vol. 133, No. 11, pp. 3276–3298.
Zipser, E. J., 2003: Some views on “hot towers” after 50 years of tropical field programs and two years of. TRMM data. Cloud Systems, Hurricanes, and the Tropical Rainfall Measuring Mission (TRMM), Meteor. Monogr., No. 51, Amer. Meteor. Soc., 49–58.


![CHAPTER [5] - IWTC](https://img.pdfslide.us/doc/110x75/621b3c6140116a16a74cc803/chapter-5-iwtc.jpg)