Embed Size (px)
Citation preview

2016 RA-IV WMO Tropical Meteorology Course
8 March 2016
Stacy Stewart Senior Hurricane Specialist
NOAA/National Hurricane Center, Miami, Florida
WEATHER RADAR PRINCIPLES

COURSE OBJECTIVES
Part 1. Brief Review of Basic Radar Principles
1. Wavelengths suitable for weather surveillance
2. Beam height above the surface
3. Equivalent reflectivity or dBZ
4. Z-R relationships
5. Doppler velocities and the Doppler dilemma

Part 2. The NOAA WSR-88D Doppler Weather Radar
1. The operational system
2. A few practical examples
3. Interpretation of the data
4. Why we need algorithms
5. A glimpse into the future
COURSE OBJECTIVES (cont’d)

Vem = f
Propagation of Electromagnetic Radiation (EM)

Radar Operating Frequencies
Frequency (MHz) Wavelength (cm) Band
30,000……………………..1……………………….K
10,000……………………..3……………………….X
6,000………………………5……………………….C
3,000……………………..10……………………...S
1,500……………………..20……………………….L (air traffic control)
• The longer (shorter) the wavelength, the larger (smaller) the precipitation-size particle that can be detected.
• The longer (shorter) the wavelength, the less (more) likely
that precipitation attenuation of the radar signal will occur.
(scatterometer)

WEATHER RADAR BANDS
10 cm S-band
5 cm C-band
1 cm K-band
The NOAA National Weather Service WSR-88D Doppler radar is a 10-cm wavelength (S-band) weather detection radar that is excellent at sampling most precipitation particles without encountering any significant signal loss due to precipitation attenuation.

A large amount of horizontally polarized EM energy (~1,000,000 W) is transmitted…
…but only a fraction of that energy (~0.000001 W) is ‘reflected’ (i.e., returned) back to the radar receiver.

Radar Beam Propagation
Differences in atmospheric density will cause the radar beam to ‘bend’ (i.e., refract) differently causing differences in beam centerline height from “standard”.
Temperature Inversion
Standard Atmospheric Lapse Rate
Superadiabatic Lapse Rate

Radar Beamwidth Calculator http://www.wdtb.noaa.gov/tools/misc/beamwidth/beamwidth.html
-- RHI diagrams assume standard refractivity index --
OVERSHOOTING
UNDERSAMPLING

6DiameterP r
Reflectivity factor: 6
ii DnZ
RETURNED POWER
Large drops return the most power…but can contribute less total water mass!
Only a small increase in drop diameter can result in a large increase in reflectivity (Z).
number of drops of
diameter D
drop diameter(s)
Returned Power:

=
One 1/4-inch diameter drop returns as much energy as 64 drops of 1/8-inch diameter.
However, one 1/4-inch diameter drop has a volume of only 0.065 in3, whereas sixty-four 1/8-inch diameter drops yield a volume of 0.52 in3 …or 8 times as much total water mass!
Effect of Drop Size on Reflectivity

3
6
6
64
164
m
mmZ
Z
What would Z be for 64 drops having a diameter of only 1 mm ?
6
ii DnZ

6
ii DnZ
3
6
6
729
31
m
mmZ
Z
Now, what would Z be for only one drop having a diameter of 3 mm ?

DILEMMA
The one 3-mm diameter rain drop returns more power and produces a larger reflectivity than the sixty-four 1-mm drops do… yet the one 3-mm diameter rain drop contains less total water mass than the sixty-four 1-mm rain drops!

Estimating Rainfall Rate Using Radar Reflectivity Data

6
ii DnZ Since we do not know the actual drop size distribution in a radar volume sample, we use “equivalent reflectivity” instead of actual reflectivity.
const
RPZ r
e
2
Equivalent reflectivity
)log(10 ee ZdBZ
where, Pr = power returned
R = target range

)log(10 ee ZdBZ
Ze
100,000
Log Ze
5 50
1,000,000 6 60
Using 10 times the logarithm of Ze keeps the range of values of Ze small, but still operationally useful.
1,000 3 30
10,000 4 40
10 1 10
100 2 20
dBZe
10,000,000 7 70

Z-R or Reflectivity-Rainfall Relationships
we now have the input we need (i.e. Ze)
Rain gauge
Find an empirical relationship to estimate rainfall rate:
Ze = a R b
Ze = 300 R1.4

dBZ 300R1.4 200R1.6 486R1.37 2000R2
Rainfall Rates (in\mm hr-1) for Various Z-R Relationships
20 0.02\0.05 0.03\0.76 0.01\0.25 0.01\0.25
30 0.09\2.28 0.12\3.05 0.07\1.78 0.03\0.76
40 0.48\12.2 0.47\11.9 0.36\9.14 0.09\2.29
50 2.50\63.5 1.90\48.3 1.90\48.3 0.28\7.11
60 12.9\327 8.10\306 10.3\262 0.88\22.4
70 67.0\1702 34.1\866 55.4\1407 2.78\70.7
55 5.7\145 (55 dBZ = maximum reflectivity used for rainfall conversion by WSR-88D)
Probable Wet Hail
Contamination
WSR-88D Conventional Convective Snowfall

dBZ Z 250R
Rainfall Rates (in\mm hr -1) for WSR-88D Tropical Z-R Relationship
15 31.6 0.01\0.18
20 100.0 0.02\0.47
25 316.2 0.05\1.22
30 1000.0 0.12\3.17
35 3162.3 0.33\8.28
40 10000.0 0.85\21.6
45 31622.8 2.22\56.5
50 100000.0 5.80\147
55 316227.8 15.14\385
1.2 Z 250
R =
1.2
minimum radar reflectivity for determining eyewall diameter

Radar Detection of Atmospheric Motion
or
Doppler Velocities

In addition to a measurement of power (reflectivity), we also have a measurement of particle motion.
A Doppler weather radar measures a single component of motion, but only toward or away from the radar.

1. Speed of light c
2. Wavelength λ
3. PRF (pulse repetition frequency)
PRF
cR
2max
but,
4max
PRFV
The “Doppler Dilemma”

Va = actual target motion
Example of Actual Velocity => Va = 20 kt
Vr = Va x cos A
= 20 kt x cos 45o
= 20 x .707
Vr = 14.14 kt
radar
target
angle of incidence
A
Vr = Doppler radial motion

Part 2
NOAA WSR-88D Doppler Weather Radar
•Weather Surveillance Radar 1988-Doppler
•first working prototype installed in Norman, OK in 1988
•This is the radar used operationally by the U.S. National Weather Service
•NEXRAD is the name of the federal procurement program which developed the WSR-88D

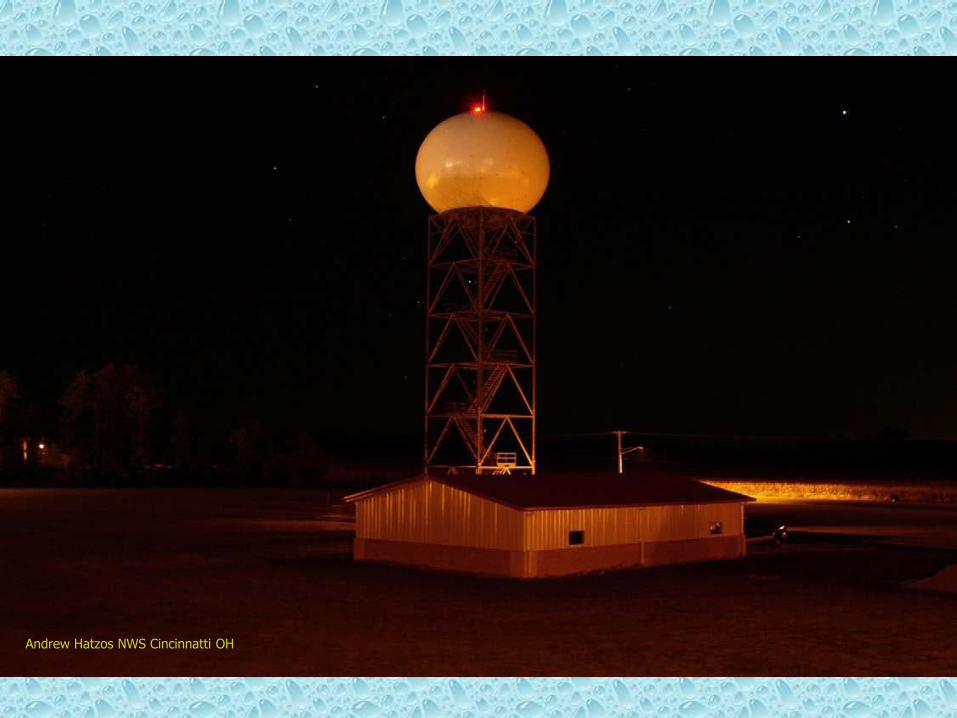
Andrew Hatzos NWS Cincinnatti OH

WSR-88D radar utilizes 9 different Volume Scans to collect reflectivity and Doppler velocity data
http://www.wdtb.noaa.gov/courses/dloc/topic2/rda/vcp.html

Hurricane Lenny, November 1999
135 kt 933 mb 1800Z, 17 NOV


Hurricane Lenny (1999) – 100 kt intensity at 0212 UTC

“Wrong-Way” Lenny (1999)
65,000 ft 18.5 DBz echo top!

Hurricane Lenny with 105-kt intensity at 0413 UTC -- but why did the radar only show 80-99 kt Doppler velocities?
…2 hours later…
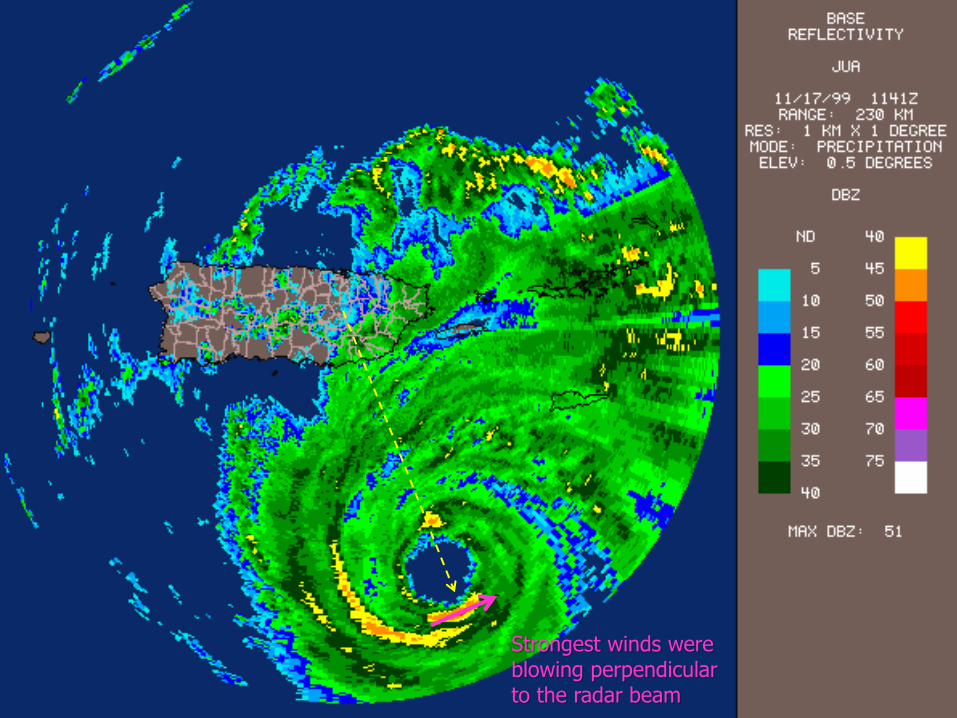
Strongest winds were blowing perpendicular to the radar beam

162 KT
161 KT
Recon flight-level winds:
144 kt

4000
5000 Radar beam is overshooting and not sampling strongest winds below 1,500 meters altitude at 0.5O elevation angle and at sea-level. However, when San Juan radar antenna altitude of 860 meters is factored in, the bottom of the radar beam is actually at 3,000 meters ASL!

Example -- Hurricane Debby (2000)


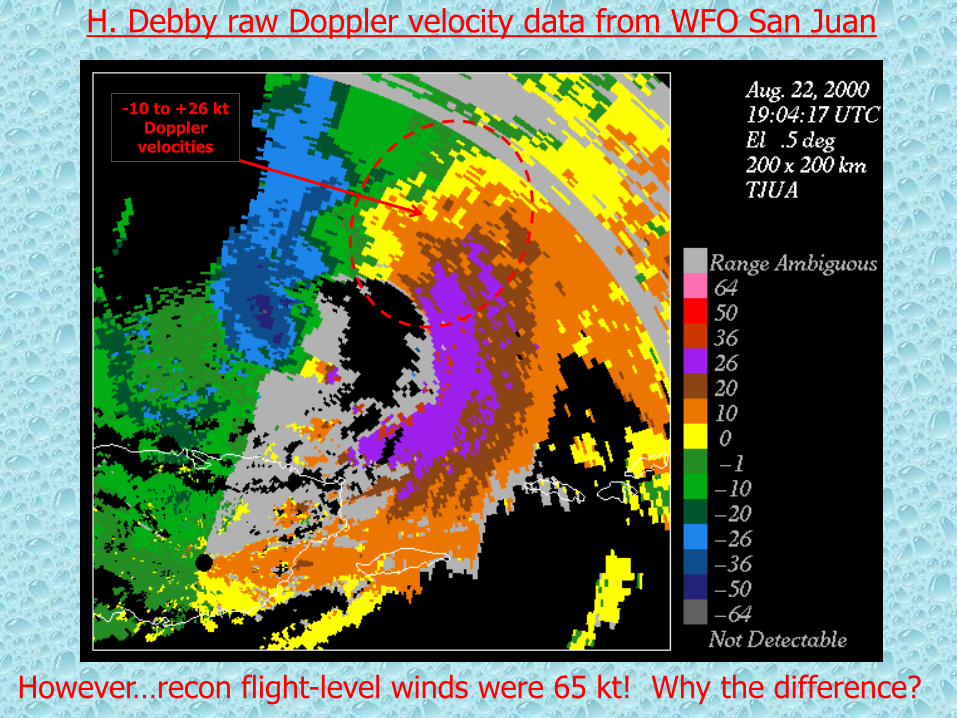
H. Debby raw Doppler velocity data from WFO San Juan
-10 to +26 kt Doppler
velocities
However…recon flight-level winds were 65 kt! Why the difference?

VORTRAC Ground-Based Velocity Tracking Display (GBVTD) -- decomposed Doppler velocities into tangential winds --
58 to 74 kt tangential
winds

GBVTD-derived tangential winds compared to reconnaissance aircraft 850 mb (~5,000 ft ASL) flight-level winds

T.S. Cindy 07-15*
H. Dennis 07-09
H. Dennis 07-10
H. Emily 07-20
H. Katrina 08-25
H. Ophelia 09-15
H. Katrina 08-29
H. Rita 09-20
H. Rita 09-24
T.S. Tammy 10-05 T.S. Arlene 06-11
H. Wilma 10-24
2005 Radar Interrogation of 9 Landfalling Tropical Cyclones

Example -- Hurricane Dennis (2005) 105 kt intensity at landfall in the Florida panhandle as determined by recon aircraft

STORM MOTION
Only 80kt Doppler velocities indicated!
Why?
Maximum actual wind speed not along the direction of the radar viewing angle!

Hurricane Katrina (2005) making landfall near Broward & Miami-Dade County line and later moved over the NHC

2005,AUG,25,1700,26.18,79.51,F,CLOSED CIRCULATION WITH DRY SLOT TO N AND W.,RM,KAMX
2005,AUG,25,1728,26.19,79.50,F,MAX WND 65 KT S QUAD AT 4730 FT,RM,KAMX
2005,AUG,25,1801,26.16,79.54,F,MAX WND 77 KT S QUAD AT 5075 FT,RM,KAMX
2005,AUG,25,1829,26.16,79.63,F,WEAK REF NW SEMICIRCLE...MAX WND 75 KT SE QUAD,RM,KAMX
2005,AUG,25,1902,26.14,79.67,F,80 KTS S OF CTR AT 3900 FT,RM,KAMX
2005,AUG,25,1929,26.14,79.74,F,85 KT MAX S QUAD AT 3417 FT JUST S OF CTR,RM,KAMX
2005,AUG,25,2002,26.07,79.84,F,CENTER RAGGED CMA GOOD ZERO ISODOP,CJM,KAMX
2005,AUG,25,2030,26.00,79.90,G,INBOUND MAX OVER SE BROWARD 75 KT 2300',CJM,KAMX
2005,AUG,25,2058,25.98,79.95,G,STRONGEST CONV S EYEWALL KEY BISCAYNE AREA,CJM,KAMX
2005,AUG,25,2134,25.99,79.96,G,CENTRAL CONV BECOMING MORE SYMMETRICAL,CJM,KAMX
2005,AUG,25,2204,25.97,80.03,G,- -,CJM,KAMX
2005,AUG,25,2231,25.96,80.10,G, CENTER OVER COAST BROWARD-DADE COUNTY LINE,CJM,KAMX
2005,AUG,25,2304,25.96,80.16,G,HIGHEST WINDS OFFSHORE ABOUT 70 KT 1500',CJM,KAMX
2005,AUG,25,2332,25.89,80.24,G,- -,CJM,KAMX
2005,AUG,26,0000,25.88,80.31,G,- - ,CJM,KAMX
2005,AUG,26,0034,25.78,80.39,G,NHC IN EYE - CALM OUTSIDE,CJM,KAMX
2005,AUG,26,0101,25.73,80.46,G,75 KT INBOUND OVER CENTRAL DADE 700 FT ,CJM,KAMX
2005,AUG,26,0126,25.70,80.53,G,- - ,CJM, KAMX
2005,AUG,26,0201,25.64,80.60,G,TIGHT VELOCITY COUPLET STILL EVIDENT IN VEL ,CJM,KAMX
2005,AUG,26,0228,25.61,80.71,G,- - ,CJM,KAMX
2005,AUG,26,0301,25.58,80.82,G,80 KT AT 900 FT OUTBOUND,CJM,KAMX
2005,AUG,26,0326,25.56,80.93,G,74 KT AT 1600 FT,HDC,KAMX
Hurricane Katrina radar observations from NHC – 25 AUG 2005

Example -- Hurricane Katrina (2005) Landfall along the southeast Louisiana coast


EYE
Maximum velocity Range is -123 kt to +123 kt due to not changing velocity increment to expand detectable velocity range to +248 kt

>123 kt @ 8-10 Kft
EYE But …90% of 128 kt = 115 kt or Cat 4! Only a 5-kt difference in peak average Doppler velocity value would have resulted in a Cat 4 instead of a Cat 3 hurricane at landfall! 90% of 123 kt = 111 kt or Cat 3

Example -- Hurricane Wilma (2005) Landfall along the southwest Florida coast


Wilma damages NHC satellite antenna dish

Example -- Hurricane Humberto (2007) Landfall along the upper Texas coast – System strengthened from a 25-kt TD to an 80-kt Hurricane in 24 hours prior to landfall

Houston-Galveston, TX radar loop, 12-13 Sep 2007


Next: Dual-Polarization Doppler Weather Radars
But first, we do the exercise…

Conventional Horizontal-Polarized Radar
Typical rain drop is a flat, oblate spheroid with a wider horizontal axis that returns more energy in the horizontal plane
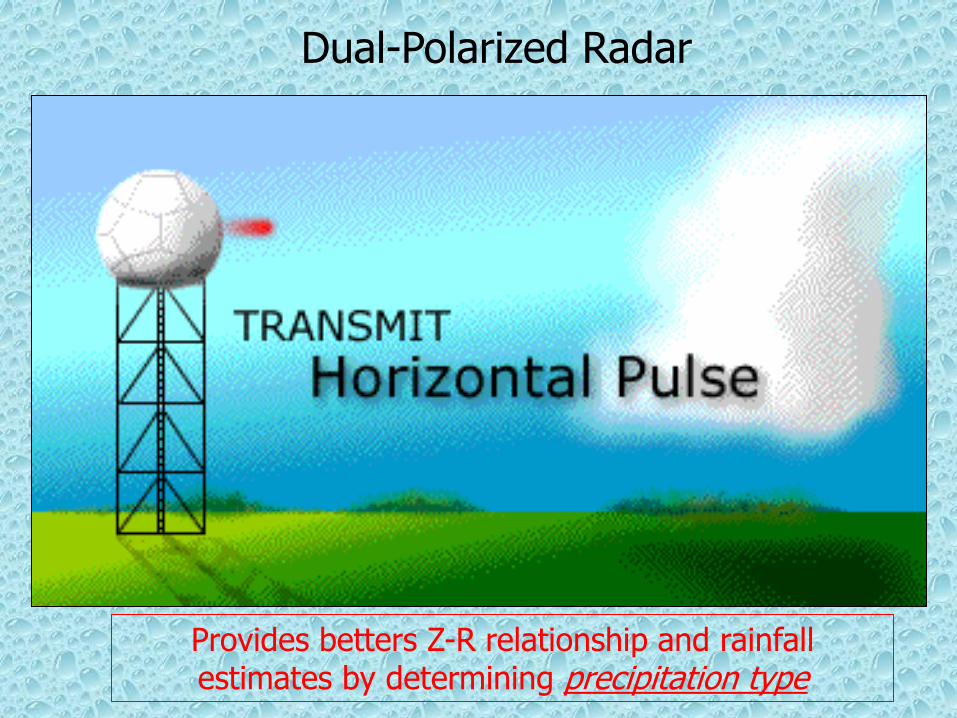
Dual-Polarized Radar
Provides betters Z-R relationship and rainfall estimates by determining precipitation type

New parameter called “Differential Reflectivity” or “ZDR” helps to determine precipitation type
dBZdr = 10 x log (Zh / Zv)
Zh = horizontal polarized reflectivity
Zv = vertical polarized reflectivity
Zh > Zv for raindrops
Zh < Zv for large wet hailstones

•Values of ZDR well above zero indicate the hydrometeors in the volume are horizontally oriented (e.g., rain) -- meaning their horizontal axis is longer than their vertical axis (Ph > Pv). •Values of ZDR well below zero indicate the hydrometeors in the volume are vertically oriented (e.g., large hail) -- meaning their vertical axis is longer than their horizontal axis (Ph < Pv). •Values of ZDR near zero indicate the hydrometeors in the volume have a nearly spherical shape (e.g., snow, giant hail), in the mean (Ph ~ Pv). http://www.wdtb.noaa.gov/courses/dualpol/outreach/DualPol-Flipchart.pdf
ZDR values for meteorological echoes
typically range between -2 dB and 6 dB

Example: Consider a field of large, falling raindrops. The drops tend to fall with an oblate, horizontal orientation. The field of drops, as a whole, will have a larger cross-section of water in the horizontal plane compared to the vertical. A horizontally-polarized radar pulse will, therefore, backscatter more energy/power in this field of drops than a vertically-polarized pulse will, resulting in more radar return for the horizontal pulse than the vertical pulse. In this case, Powerh > Powerv => Zh > Zv , so ZDR > 0.
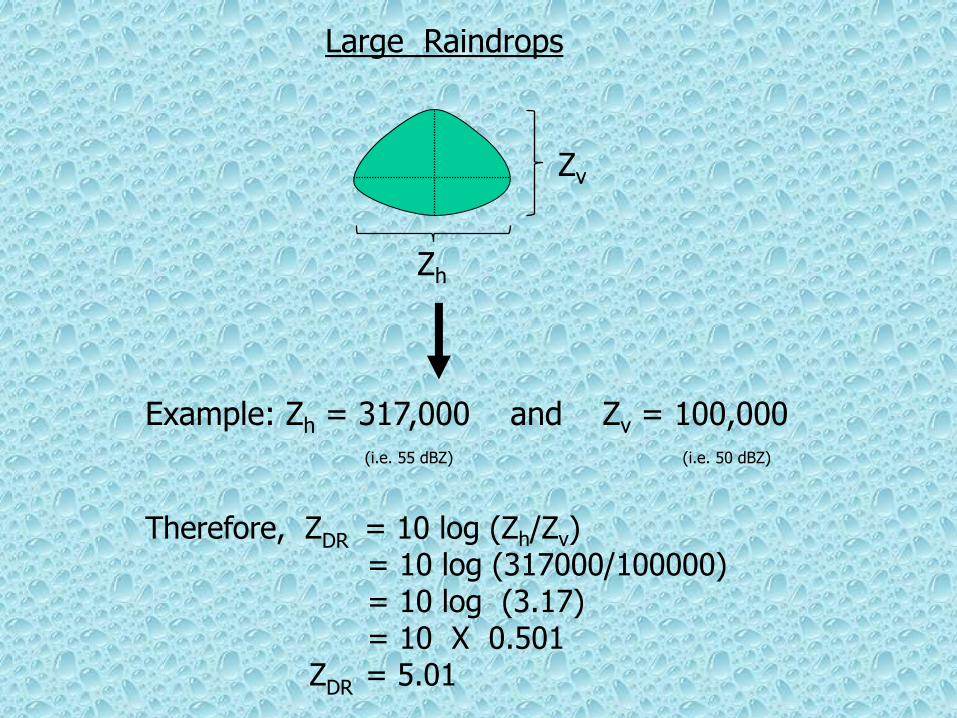
Example: Zh = 317,000 and Zv = 100,000 (i.e. 55 dBZ) (i.e. 50 dBZ)
Therefore, ZDR = 10 log (Zh/Zv) = 10 log (317000/100000) = 10 log (3.17) = 10 X 0.501 ZDR = 5.01
Zh
Zv
Large Raindrops

Example: Zh = 100,000 and Zv = 317,000 (i.e. 50 dBZ) (i.e. 55 dBZ)
Therefore, ZDR = 10 log (Zh/Zv) = 10 log (100000/317000) = 10 log (0.315) = 10 X -0.501 ZDR = -5.01
Zh
Zv
Large Wet Hailstones
• Differential reflectivity values above 2 dB are commonly observed in rain.
• Although hailstones are not necessarily spherical, studies have shown that they fall with a tumbling motion -- meaning a field of falling hailstones within the radar resolution volume will "appear" to consist of nearly spherical hydrometeors. Therefore, the value of dBZDR for hail is usually close to zero.
• Some graupel and hail hydrometeors with a conical shape can fall with their major axes oriented in the vertical. In these cases, the dBZDR will be found to be negative.

Dual-Pol Radar Example -- Hurricane Irene (2011)
Provides betters Z-R relationship and rainfall estimates by determining precipitation type
http://www.nws.noaa.gov/com/weatherreadynation/news/121311_irene.html
dBZ is same as WSR-88D
velocity is same as WSR-88D
ZDR denotes areas of intense
convection
KDP denotes areas of heavy
rainfall (light pink)
Specific Differential Phase Shift
>1.0

Caribbean Meteorological Organization (CMO) Doppler Weather RADAR Project
- €13-million (Euro) project that aims to replace old radars with new Doppler radars.
- Goal is to provide improved awareness of approaching tropical cyclones and heavy rainfall events.
- New radars in Barbados, Belize, Guyana, and Trinidad.
http://www.cmo.org.tt/radar.html http://www.cdera.org/workshop/un-spider/day2/LAYNE-CMO_Presentation.pdf
Barbados

NEXRAD- In-Space
The Future of Weather Radar?

Conclusions
• Wavelength is a key design consideration for weather radar (WSR-88D uses 10 cm)
• Doppler velocity is an effective tool in determining tropical cyclone intensity, and detecting rapid intensification.
• Future – dual polarization will give better precipitation estimates.
•NEXRAD-in-space will generate radar data for the entire Atlantic basin.