Embed Size (px)
DESCRIPTION
IWTC VI: 1.3 Air-Sea Interactions and Oceanic Influences. Lynn K. “Nick” Shay Committee: P. Black, D. Barbary, M. Donelan, K. Emanuel, I. Ginis, C. Lozano, E. Uhlhorn, C.-C. Wu - PowerPoint PPT Presentation
Citation preview

IWTC VI:1.3 Air-Sea Interactions and Oceanic
Influences
Lynn K. “Nick” ShayCommittee: P. Black, D. Barbary, M. Donelan, K. Emanuel, I.
Ginis, C. Lozano, E. Uhlhorn, C.-C. Wu Contributor(s): I.-I. Lin, W. Teague, R. Lumpkin, B. Haus, T. Sanford, J. Girton, C. Fairall, G. Halliwell, S. Jacob, M.
Mainelli, S. White, B. Jaimes, C. Gentemann

Background:
Objective: To document progress in this thematic area since IWTC-5 from experimental, observational, analytical, empirical and numerical perspectives.
Key Issues/Questions:1. Is SST alone a sufficient indicator of ocean’s influence on
TCs?2. What is the role of ocean shear on modulating oceanic heat
content (OHC) distributions?3. How do we initialize ocean models capable of resolving oceanic
structures such as Loop Current/Warm Rings/Cold Rings?4. Do momentum and heat transfers level off or decrease with
increasing winds?

Integrated thermal structure (OHC) and vertical shear.
Measuring current and shear central for mixing and cooling and, hence feedback to the storm.
Is SST Enough?
16 vs 126 kJ cm-2

Severe Storm (Cat 3 or above) Tracks (red) relative to the posit of the LC and WCR complex based on satellite radar data track in Aug/Sept 2005.
Altimetry data from Jason-1, GFO and Enviasat data from 2005 relative to track/intensity of Katrina with HRD wind fields.WCR
LC
FC
Hurricane Frances (04) EM-APEX Float Deployed at 1-2 Rmax (Sanford et al., 2006)

IVAN NRL ADCP (SEED) Data Relative to Track/Intensity and Velocity Structure (B. Teague).
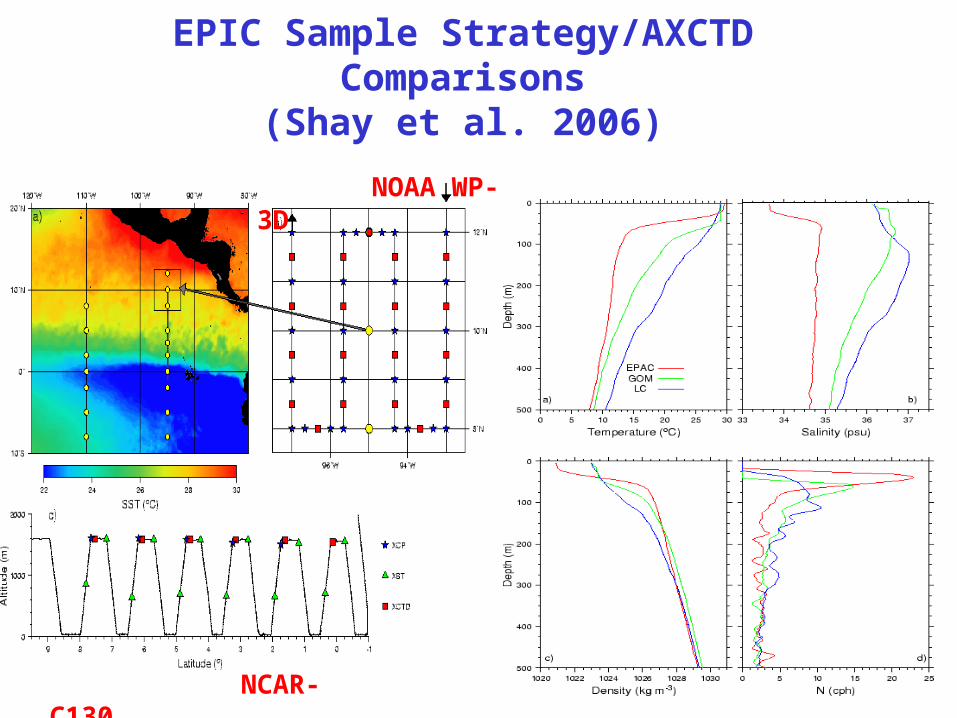
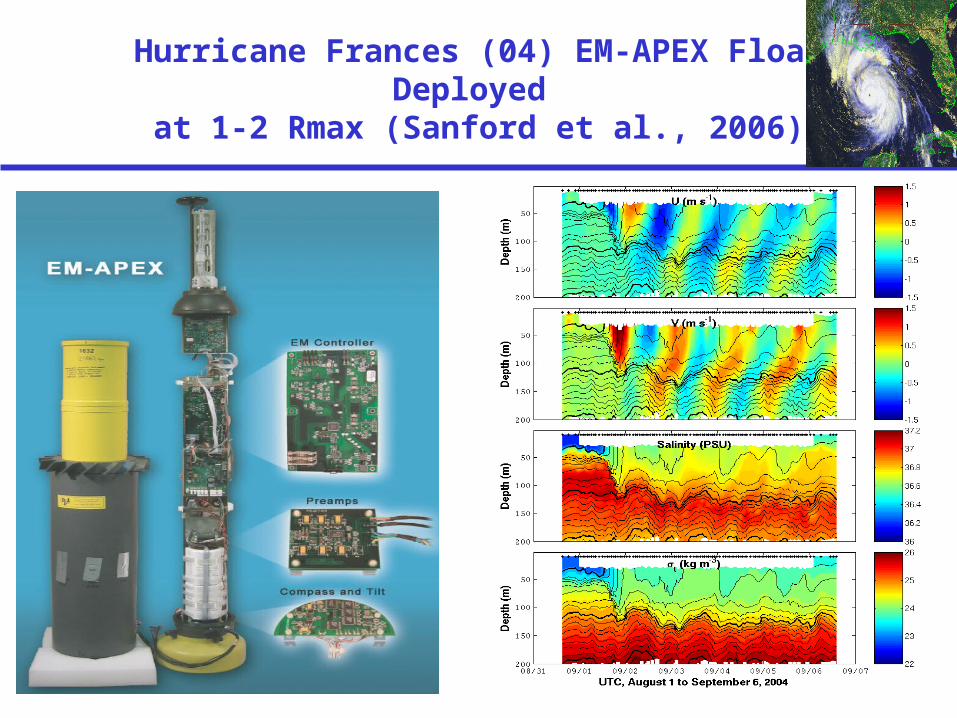
EPIC Sample Strategy/AXCTD Comparisons(Shay et al. 2006)
NOAA WP-3D
NCAR- C130

Altimeter tracks and locations of warm and cold features relative to track of Maemi and the Northern and Southern Zones of Eddy Variability (from Lin et al., 2005).
TMI and AMSR-E SSTs prior to Maemi

TMI Pre and Post Katrina SSTs and cooling (top);
Pre and Post Rita SSTs and cooling (bottom).
TMI Data courtesy of C. Gentemann.
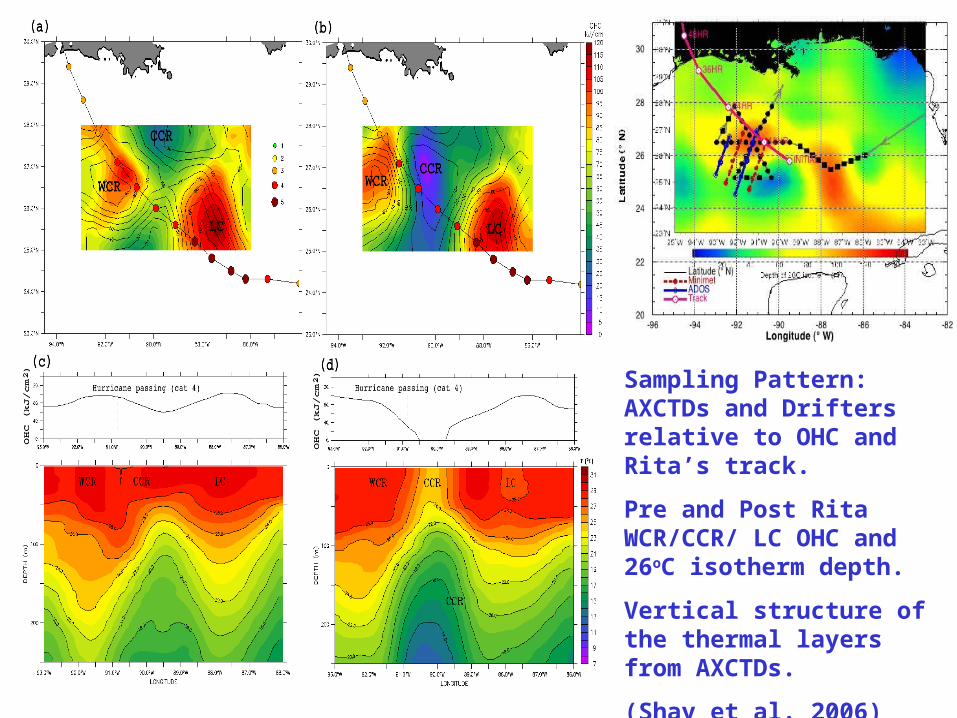
Sampling Pattern: AXCTDs and Drifters relative to OHC and Rita’s track.
Pre and Post Rita WCR/CCR/ LC OHC and 26oC isotherm depth.
Vertical structure of the thermal layers from AXCTDs.
(Shay et al. 2006)

NSF/NOAA Isidore/Lili (02) Experiments:
a) Caribbean (Pre)b) GOM (Pre)c) Isidore d) Wake 1 (Post)e) Wake 2 (Post)f) Lilih) Wake 1 (Post)
SHA field: TOPEX, GFO and ERS-2
1-Green; 2-Yellow3-Orange; 4-Red
SFMR-Mapping of Surface Winds in Lili(Uhlhorn and Black, 03)

T(x,z) and V(x,z) Section (left) and SST Change along 22oN
<1oC
>4.5oC
)( guufPWK k

Pre-Isidore Ocean Conditions in HYCOM
(Halliwell et al., 2006)
OHC Comparisons Vertical Structure
X

Air-Sea Differences (left) and Surface Heat Loss (right) (Shay and Uhlhorn 2006)

SFMR Emissivity Versus Surface Wind From GPS sondes (Uhlhorn et al., 2006)
SMFR measures emissions expressed in terms of brightness temperatures.
Foam coverage increases with winds-emits microwave energy more easily.
A new model of emissivity and surface winds is compared to GPS sonde data.
Model function behaves differently at about 32 m s-1.
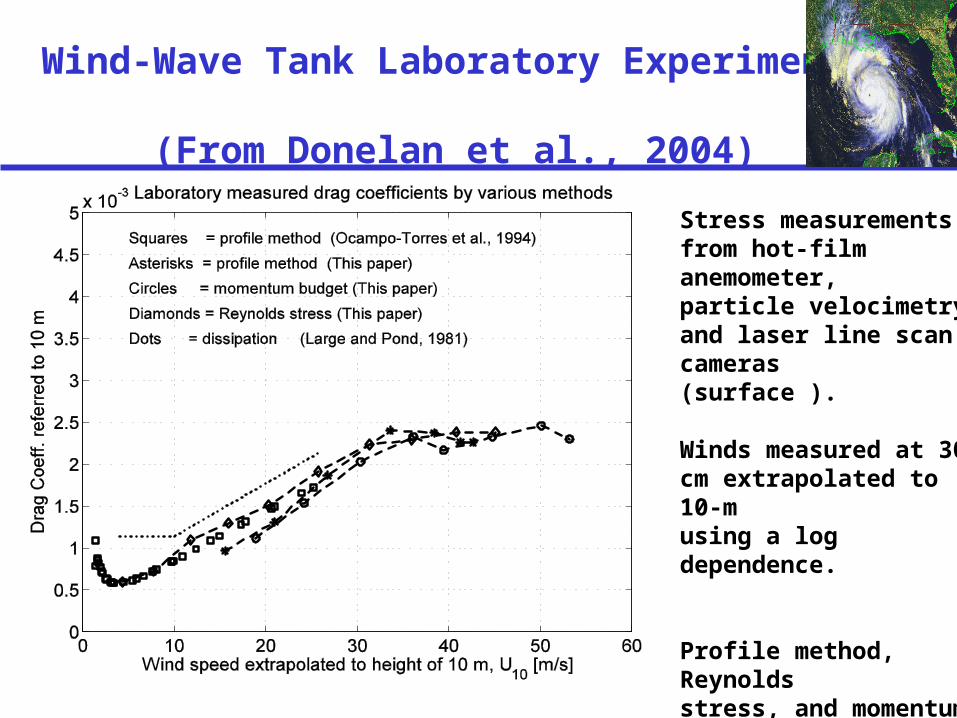
Wind-Wave Tank Laboratory Experiments (From Donelan et al., 2004)
Stress measurements from hot-film anemometer,particle velocimetry and laser line scan cameras (surface ).
Winds measured at 30 cm extrapolated to 10-m using a log dependence.
Profile method, Reynolds stress, and momentum budget (surface slope).
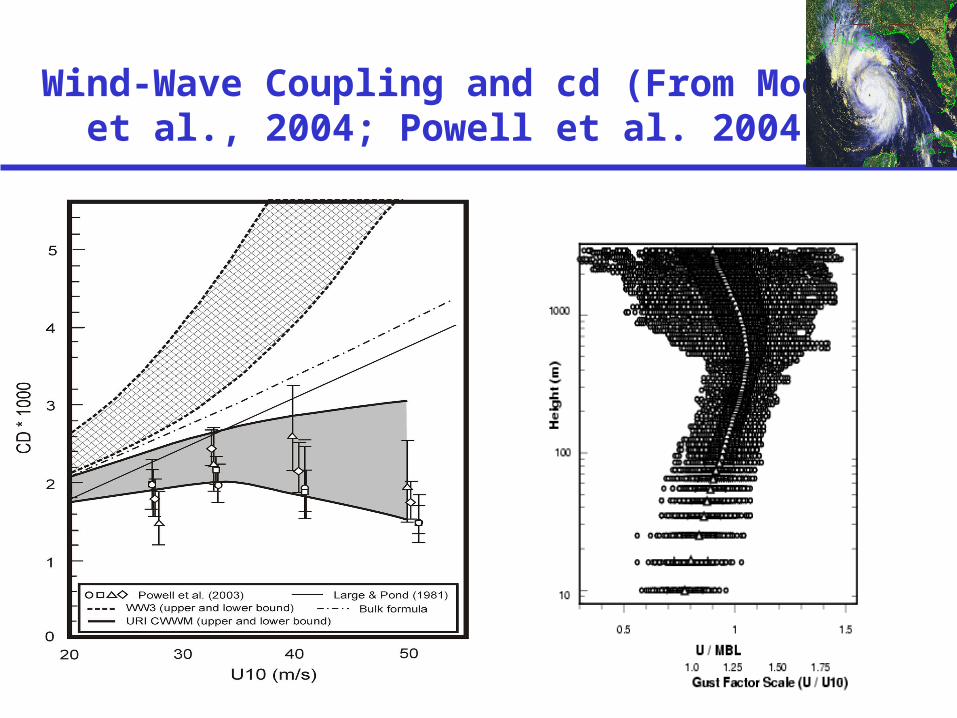
Wind-Wave Coupling and cd (From Moon et al., 2004; Powell et al. 2004)

Sea-Spray Formulations (From C. Fairall)
Momentum to enthalpy bulk transfer coefficientswhen sea spray is included for differing droplet source strengths
Implemented in GFDL for Ivan and Isabel indicated some sensitivity to the parameterization.
More testing is needed .

Wave Measurements From SEED During Ivan.
B) Hs (circles)Hmax (crosses)Radial Distance (green squares)Hs from buoy(dotted)
C) Hs and Hmax as a function of radius. Black (stars) simulationHmax=1.9Hs (blue line)
From Wang et al. (2005).
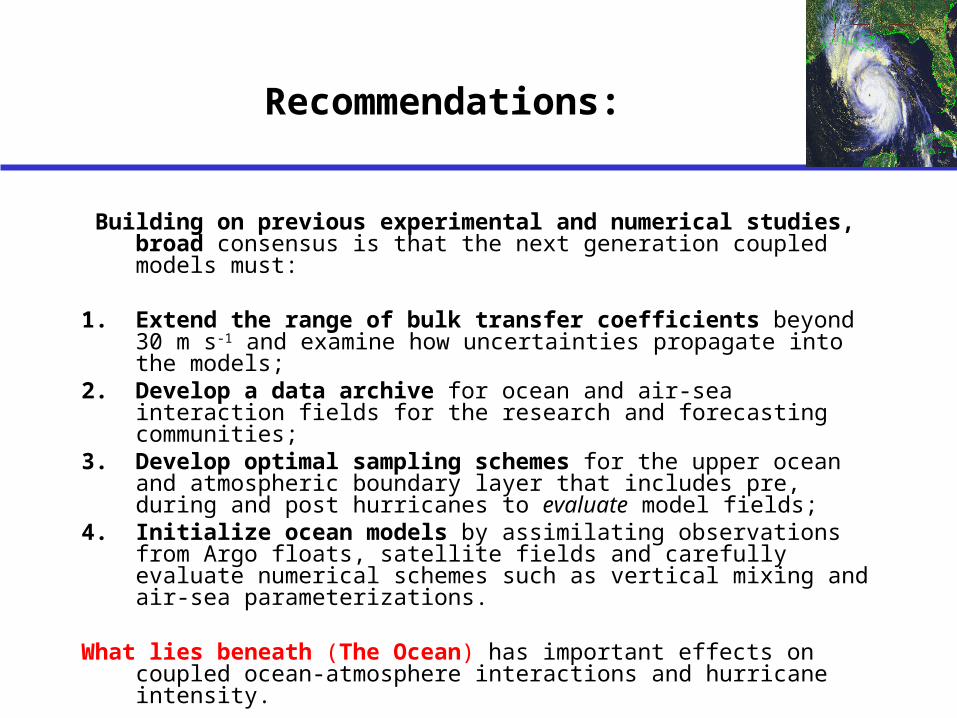
Recommendations:
Building on previous experimental and numerical studies, broad consensus is that the next generation coupled models must:
1. Extend the range of bulk transfer coefficients beyond 30 m s-1 and examine how uncertainties propagate into the models;
2. Develop a data archive for ocean and air-sea interaction fields for the research and forecasting communities;
3. Develop optimal sampling schemes for the upper ocean and atmospheric boundary layer that includes pre, during and post hurricanes to evaluate model fields;
4. Initialize ocean models by assimilating observations from Argo floats, satellite fields and carefully evaluate numerical schemes such as vertical mixing and air-sea parameterizations.
What lies beneath (The Ocean) has important effects on coupled ocean-atmosphere interactions and hurricane intensity.

Distribution of ARGO floats: note the void in the Caribbean Sea, GOM, and the Gulf Stream-warm ribbons of high currents….
Concluding Remarks:
Technology has evolved (in situ, satellite) : response to atmospheric forcing; atmospheric response to oceanic forcing (Perlroth’s (60’s); Leipper’s (70’s).
Cooling (negative feedback) patterns have been observed due to current and shear over thin OML – Only 8 focused experiments.
Positive feedback (less negative) regimes-26oC isotherm depth is deep (LC/WCR complex NW Caribbean Sea), strong background flows dampen forced currents and shears (Isidore, Lili, 05-Trifecta: Katrina, Rita Wilma).
EPAC-strong stratification (~20 cph) at the base of the OML in the warm pool (long inertial periods) preclude significant mixing events.
Ocean measurements initialization of basic state, improve mixing schemes and air-sea parameterizations under high winds
Oceanic measurements are critical for the 3-D ocean/atmospheric interactions over storm scales.