Embed Size (px)
Citation preview
Simulation of the cutting action of a single PDC cutter using DEM
B. Joodi, M. Sarmadivaleh, V. Rasouli & A. Nabipour Department of Petroleum Engineering, Curtin University, Australia
Abstract
Optimization of costly drilling operations is essential to reduce the overall costs of oil and gas extraction. Simulation of these operations can yield a better selection of parameters for maximum drilling efficiency. One of the most cost efficient methods to do so is by computer modeling. Because of the complex nature of the cutting process, no analytical methods can be used for its modeling and the numerical methods are the only option. FEM and Discrete Element Method (DEM) are the most commonly used numerical methods for this purpose. One of the best features of the DEM is that it is very suitable for discontinuous environment and no special treatment or process is required in tracking the produced cracks and fragmentation. Also depending on the depth of cut, it can both simulate ductile or brittle failures. In current study, a 2D computer model was developed using the particle flow code (PFC2D) to simulate the cutting action of a single cutter. PFC uses the DEM to model a rock sample by fine cylinders or disks. The properties of the Berea sandstone were considered in our modeling. A good match of mechanical properties was obtained for the rock model by adjusting micro parameters of the contacts between the constituting balls and the results of the simulation are compared to laboratory data. Keywords: single cutter test, numerical simulation, discrete element method, PFC2D.
1 Introduction
Due to the very complex nature of rock drilling with drilling bits, no analytical method is available to determine the optimum drilling parameters in different formations. Also it is of great interest to see the effects of using different weight
www.witpress.com, ISSN 1743-3533 (on-line) WIT Transactions on Engineering Sciences, Vol 81, © 201 WIT Press2
Petroleum and Mineral Resources 143
doi:10.2495/PMR120 113
on bit (WOB), rotation speed (RPM) and different drill bits on drilling performance; these parameters cannot be taken into consideration through analytical formulae. Simplifying the rock-bit interaction from a full faced drilling bit at wellbore scale to a single cutter that moves in a straight line on a cubical rock sample would be the simplest scenario to simulate in laboratory and numerically. Single cutter tests can be helpful in studying the information obtained from full-scale bit testing which concern the overall effects of all the cutters with different cutting and cleaning conditions; so the net effect of the individual cutters are difficult to distinguish [1]. It should be reminded that even with this simplification, the analytical simulation will be very difficult. Although there are a number of attempts by different authors to define a failure criterion by further simplifications and find an analytical solution to this, because of excessive simplifying assumptions no reliable analytical method found in the literature that can accurately represent the cutting action. Numerical modeling is an alternative to analytical methods to simulate complicated cases and to do sensitivity analysis of different parameters. The experimentally determined mechanical properties will be used to construct real like rock sample numerically which will be undergone several cutting tests. The results of these tests will be a good benchmark to design the experimental apparatus and test conditions as well as the test procedure. In addition, it is to be noted that conducting laboratory tests are expensive and time consuming. Different types of numerical methods have been used in the past for cutting modeling: these can be divided into continuum and discrete methods. Finite difference method (FDM) and finite element method (FEM) are the two continuum models which are mainly used when there is not a high deformation in rock. Continuum numerical methods are inefficient in modeling fracture planes which occur in the rock matrix during rock cutting action [2]. Discrete element method (DEM) is a discontinuum based numerical model which is used for simulating fractured rock masses. A DEM model represents the rock sample as a bonded assembly of rigid or deformable discrete blocks and with an explicit time matching scheme it can capture the kinematics of these discrete blocks [3]. Each bond may fail (micro crack) when the applied stress (normal, shear or rotation) exceeds a certain value and fracture will generate as a result of coalescing of these macro fractures. A hybrid form of these methods can be used to have the desired advantages of one method or avoid disadvantages of the others. A common practice is to use FEM – DEM hybrid method (FEDEM), with DEM in the rock-cutter interaction and FEM elsewhere to monitor the induced stresses etc. A good example of this approach is the work done by Rojek and Oñate where they applied combined FEM/DEM modeling to simulate underground excavation [4]. One of the best features of the DEM is that there is no need to any special treatment or process for fragmentation tracking and it is just the normal results of an analysis. This makes DEM as an efficient approach for modeling discontinuous environment such as rock cutting [5].
144 Petroleum and Mineral Resources
www.witpress.com, ISSN 1743-3533 (on-line) WIT Transactions on Engineering Sciences, Vol 81, © 201 WIT Press2
In this study 2D numerical simulation of cutting action with a single cutter is modeled. Particle flow code (PFC) which is a DEM based numerical code was used for this purpose. The results including the effect of cutting depth on drilling performance will be presented and compared with those presented in the literature.
2 The rock cutting model
The PFC uses an explicit solution scheme where the solutions are stable and can describe the non-linear behavior with an accuracy that cannot be matched by typical finite element programs [6]. The code representation of an intact rock sample is an assembly of round particles with a specified statistical size distribution. Once the bonds are installed between all the adjacent particles, the overall mechanical behavior of the assembly is controlled by the micro-properties of particles and bonds [7]. There are few bond types that were predefined in the code or alternatively the user may define a new bond for specific applications. The most common bonds are contact and parallel bonds. In this study, the parallel bond was used. This bond represents the cement like physical behavior of joining materials between the grains. While the contact to contact bond only transmits force between the grains, parallel bond can transfer the momentum as well as the force.
3 Sample generation
As it was mentioned earlier, the micro properties of the material in a DEM code should be chosen in a way that the generated assembly has macro mechanical properties (e.g. elastic Young’s modulus or uniaxial compressive strength, UCS) close to the real sample. This is done through an iterative process. Table 1 shows the rock mechanical properties of a Berea Sandstone used by Glowka for a Rock Scratch Test (RST) with a 0.52 in. sharp PDC cutter [8]. In this study we used this data in our simulations. The last row in this table lists similar parameters for the simulated sample that was built in this study for cutting performance analysis. The Unconfined Compressive Strength (UCS), Direct Tensile and Brazilian tests were measured for a 12×6cm sample with an approximately 30,000 round particles (discs) with their radii being uniformly distributed in the range of 0.2 to 0.32 mm. The particles micro properties are listed in Table 2. The tensile strength is the most challenging parameter to get a good match. The term match is used to show a good accordance between the targeted mechanical properties and macro behavior of the numerically generated sample. From Table 1 it is seen that the generated sample for numerical simulation is a good representative of Berea sandstone that was used by Glowka [8]. As an example, the result of a numerical UCS test is shown in Figure 1. The graph (red line) shows the axial stress-strain curve showing an ultimate strength of 48.8 MPa. The figure also shows the sample (yellow rectangular shape) in the middle in its final stage of the test.
Petroleum and Mineral Resources 145
www.witpress.com, ISSN 1743-3533 (on-line) WIT Transactions on Engineering Sciences, Vol 81, © 201 WIT Press2
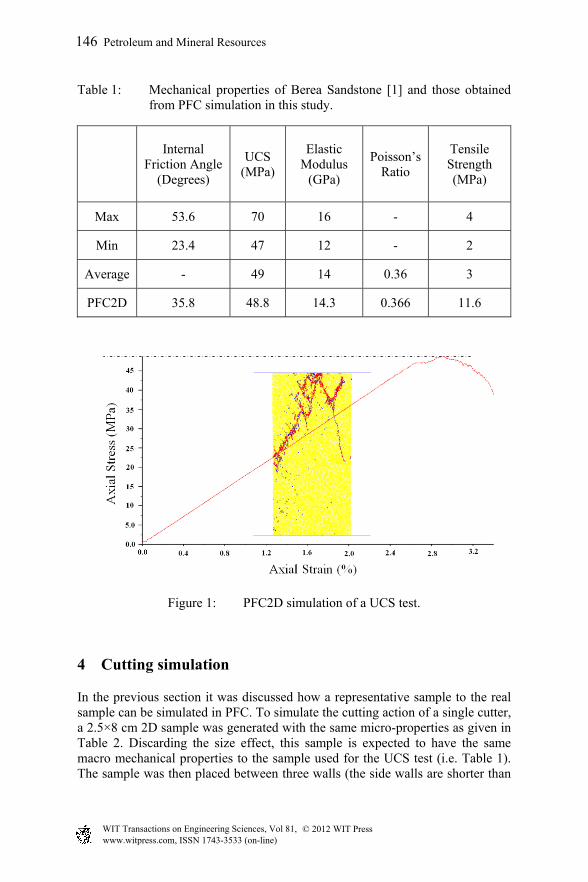
Table 1: Mechanical properties of Berea Sandstone [1] and those obtained from PFC simulation in this study.
Internal Friction Angle
(Degrees)
UCS (MPa)
Elastic Modulus
(GPa)
Poisson’s Ratio
Tensile Strength (MPa)
Max 53.6 70 16 - 4
Min 23.4 47 12 - 2
Average - 49 14 0.36 3
PFC2D 35.8 48.8 14.3 0.366 11.6
Figure 1: PFC2D simulation of a UCS test.
4 Cutting simulation
In the previous section it was discussed how a representative sample to the real sample can be simulated in PFC. To simulate the cutting action of a single cutter, a 2.5×8 cm 2D sample was generated with the same micro-properties as given in Table 2. Discarding the size effect, this sample is expected to have the same macro mechanical properties to the sample used for the UCS test (i.e. Table 1). The sample was then placed between three walls (the side walls are shorter than
146 Petroleum and Mineral Resources
www.witpress.com, ISSN 1743-3533 (on-line) WIT Transactions on Engineering Sciences, Vol 81, © 201 WIT Press2
the sample size) to keep it in place. There were no confining stresses applied to the sample.
Table 2: PFC2D model micro-properties.
Property Value Property Value
Sample size (cm) 12×6
Contact Young's modulus (GPa)
12.1
Particle density (kg/m3) 2050 Particle stiffness ratio 3.08 Minimum particle radius
(mm) 0.2
Particle friction coefficient
0.5
Particle size ratio
1.66
Parallel bond normal strength (MPa)
51.9
Number of particles 30,000
Parallel bond cohesion (MPa)
32.0
Parallel bond friction angle (Degree)
35.0
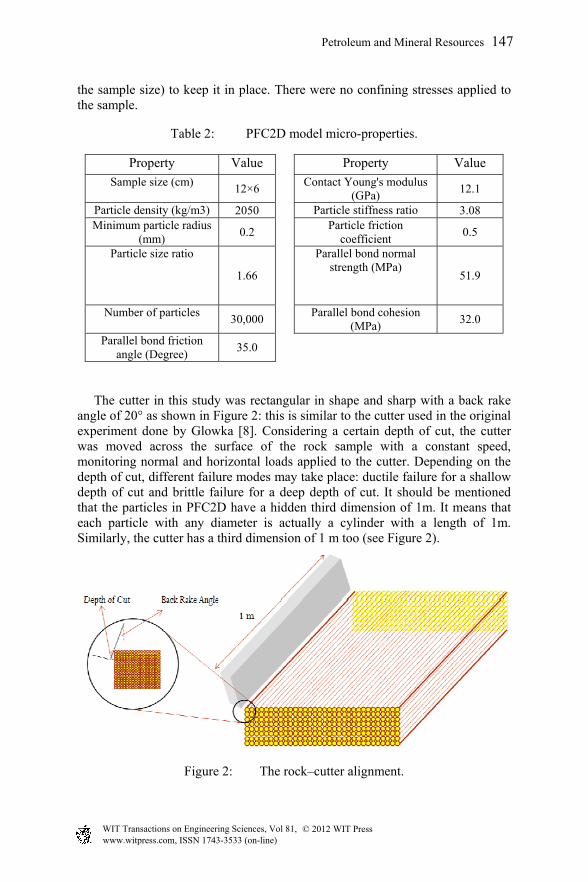
The cutter in this study was rectangular in shape and sharp with a back rake angle of 20° as shown in Figure 2: this is similar to the cutter used in the original experiment done by Glowka [8]. Considering a certain depth of cut, the cutter was moved across the surface of the rock sample with a constant speed, monitoring normal and horizontal loads applied to the cutter. Depending on the depth of cut, different failure modes may take place: ductile failure for a shallow depth of cut and brittle failure for a deep depth of cut. It should be mentioned that the particles in PFC2D have a hidden third dimension of 1m. It means that each particle with any diameter is actually a cylinder with a length of 1m. Similarly, the cutter has a third dimension of 1 m too (see Figure 2).
Figure 2: The rock–cutter alignment.
Petroleum and Mineral Resources 147
www.witpress.com, ISSN 1743-3533 (on-line) WIT Transactions on Engineering Sciences, Vol 81, © 201 WIT Press2
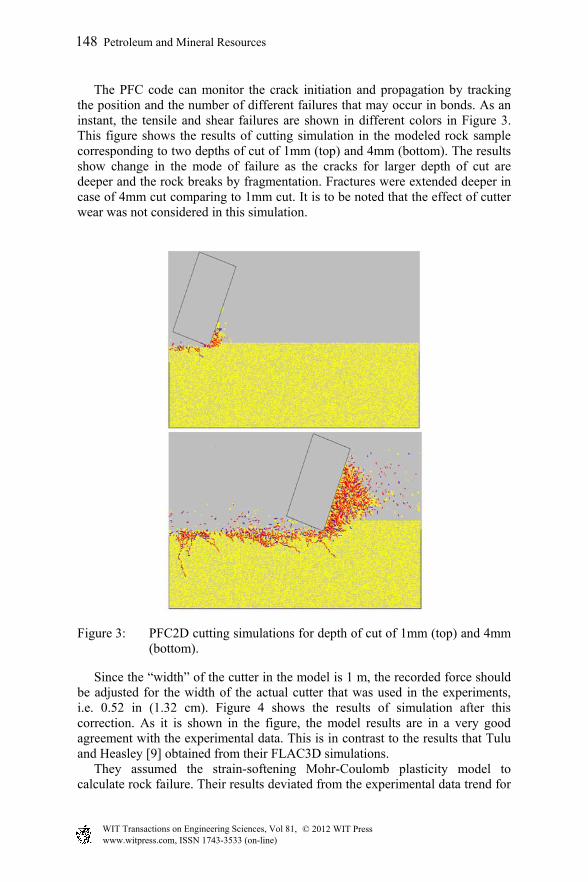
The PFC code can monitor the crack initiation and propagation by tracking the position and the number of different failures that may occur in bonds. As an instant, the tensile and shear failures are shown in different colors in Figure 3. This figure shows the results of cutting simulation in the modeled rock sample corresponding to two depths of cut of 1mm (top) and 4mm (bottom). The results show change in the mode of failure as the cracks for larger depth of cut are deeper and the rock breaks by fragmentation. Fractures were extended deeper in case of 4mm cut comparing to 1mm cut. It is to be noted that the effect of cutter wear was not considered in this simulation.
Figure 3: PFC2D cutting simulations for depth of cut of 1mm (top) and 4mm (bottom).
Since the “width” of the cutter in the model is 1 m, the recorded force should be adjusted for the width of the actual cutter that was used in the experiments, i.e. 0.52 in (1.32 cm). Figure 4 shows the results of simulation after this correction. As it is shown in the figure, the model results are in a very good agreement with the experimental data. This is in contrast to the results that Tulu and Heasley [9] obtained from their FLAC3D simulations. They assumed the strain-softening Mohr-Coulomb plasticity model to calculate rock failure. Their results deviated from the experimental data trend for
148 Petroleum and Mineral Resources
www.witpress.com, ISSN 1743-3533 (on-line) WIT Transactions on Engineering Sciences, Vol 81, © 201 WIT Press2
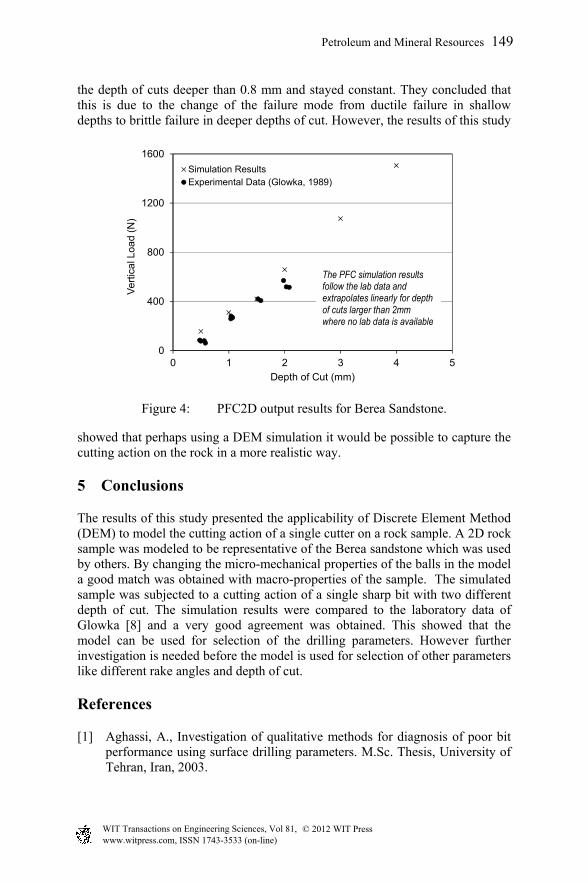
the depth of cuts deeper than 0.8 mm and stayed constant. They concluded that this is due to the change of the failure mode from ductile failure in shallow depths to brittle failure in deeper depths of cut. However, the results of this study
Figure 4: PFC2D output results for Berea Sandstone.
showed that perhaps using a DEM simulation it would be possible to capture the cutting action on the rock in a more realistic way.
5 Conclusions
The results of this study presented the applicability of Discrete Element Method (DEM) to model the cutting action of a single cutter on a rock sample. A 2D rock sample was modeled to be representative of the Berea sandstone which was used by others. By changing the micro-mechanical properties of the balls in the model a good match was obtained with macro-properties of the sample. The simulated sample was subjected to a cutting action of a single sharp bit with two different depth of cut. The simulation results were compared to the laboratory data of Glowka [8] and a very good agreement was obtained. This showed that the model can be used for selection of the drilling parameters. However further investigation is needed before the model is used for selection of other parameters like different rake angles and depth of cut.
References
[1] Aghassi, A., Investigation of qualitative methods for diagnosis of poor bit performance using surface drilling parameters. M.Sc. Thesis, University of Tehran, Iran, 2003.
0
400
800
1200
1600
0 1 2 3 4 5
Ve
rtic
al L
oa
d (
N)
Depth of Cut (mm)
Simulation ResultsExperimental Data (Glowka, 1989)
The PFC simulation results follow the lab data and extrapolates linearly for depth of cuts larger than 2mm where no lab data is available
Petroleum and Mineral Resources 149
www.witpress.com, ISSN 1743-3533 (on-line) WIT Transactions on Engineering Sciences, Vol 81, © 201 WIT Press2
[2] Jonak J, Podgórski J., Mathematical model and results of rock cutting modelling. Journal of Mining Science; vol 37: pp 615–8, 2001.
[3] Khan, M., Investigation of Discontinuous Deformation Analysis for Application in Jointed Rock Masses. Ph.D Thesis, University of Toronto, Canada, 2010.
[4] Rojek, J. and Oñate, E., Coupled discrete/finite element modelling of geotechnical problems. 8th.World Congress on Computational Mechanics, Venice, Italy, 2008.
[5] Mendoza, J.A., Gamwo, I.K., Zhang, W. and Lin, J.-S. Considerations for Discrete Modeling of Rock Cutting. 45th US Rock Mechanics /Geomechanics Symposium held in San Francisco, California, 2011.
[6] ITASCA, PFC2D Overview, http://www.itascacg.com/pfc2d/overview.php [7] Potyondy, D.O., P.A., Cundall, A bonded-particle model for rock.
International Journal of Rock Mechanics and Mining Sciences and Geomechanics Abstracts, Vol. 41, 2004.
[8] Glowka D. A, Use of Single Cutter Data in the Analysis of PDC Bit Designs: Part 1 – Development of a PDC Cutting Force Model, SPE, Sandia Natl. Laboratories, JPT, 1989.
[9] Tulu, I. B. and Heasley, K. A., Calibration of 3D Cutter-Rock Model with Single Cutter Tests. The 43rd US Rock Mechanics Symposium and 4th U.S.-Canada Rock Mechanics Symposium, Asheville. ARMA, 2009.
150 Petroleum and Mineral Resources
www.witpress.com, ISSN 1743-3533 (on-line) WIT Transactions on Engineering Sciences, Vol 81, © 201 WIT Press2