Embed Size (px)
Citation preview
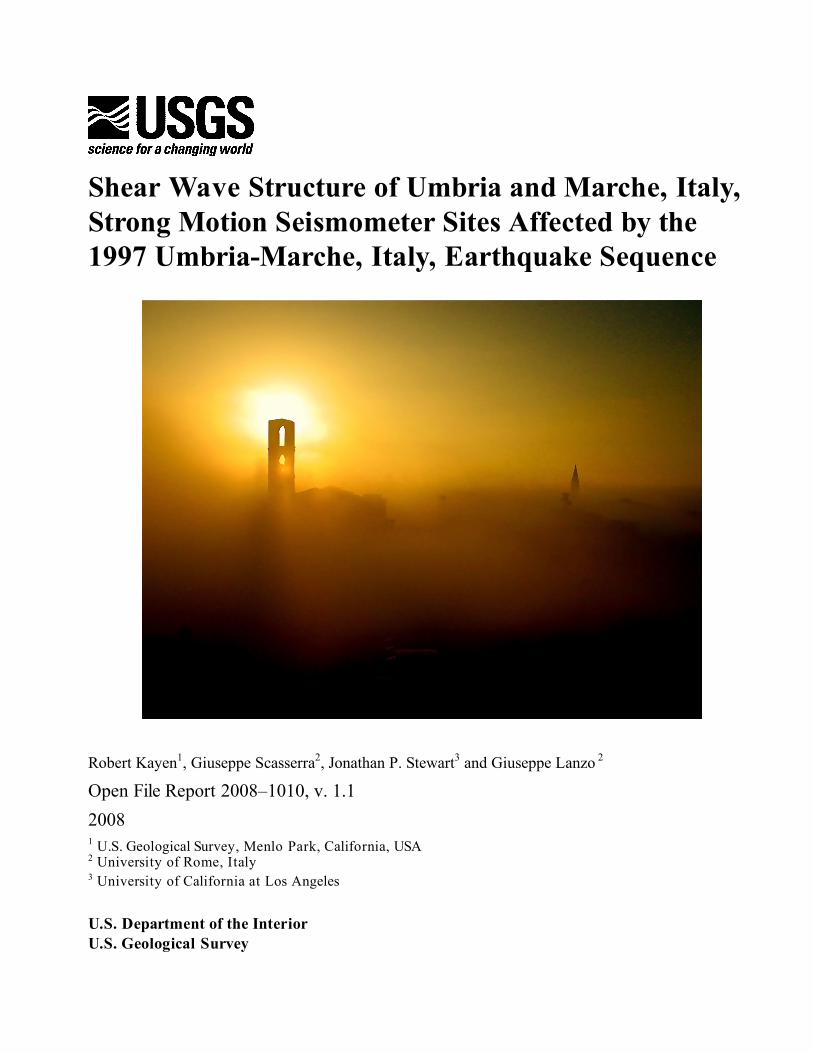
Shear Wave Structure of Umbria and Marche, Italy, Strong Motion Seismometer Sites Affected by the 1997 Umbria-Marche, Italy, Earthquake Sequence
Robert Kayen1, Giuseppe Scasserra2, Jonathan P. Stewart3 and Giuseppe Lanzo 2
Open File Report 2008–1010, v. 1.1 2008 1 U.S. Geological Survey, Menlo Park, California, USA 2 University of Rome, Italy 3 University of California at Los Angeles U.S. Department of the Interior U.S. Geological Survey
2
U.S. Department of the Interior Dirk Kempthorne, Secretary
U.S. Geological Survey Mark D. Myers, Director
U.S. Geological Survey, Reston, Virginia 2008 Revised 2009
For product and ordering information: World Wide Web: http://www.usgs.gov/pubprod Telephone: 1-888-ASK-USGS
For more information on the USGS—the Federal source for science about the Earth, its natural and living resources, natural hazards, and the environment: World Wide Web: http://www.usgs.gov Telephone: 1-888-ASK-USGS
Suggested citation: Robert Kayen, Giuseppe Scasserra , Jonathan P. Stewart, and Giuseppe Lanzo, 2008, revised 2009, Shear wave structure of Umbria and Marche, Italy, strong motion seismometer sites affected by the 1997 Umbria-Marche, Italy, earthquake sequence : U.S. Geological Survey, Open-File Report 2008-1010, v. 1.1, 51 p. [http://pubs.usgs.gov/of/2008/1010/].
Any use of trade, product, or firm names is for descriptive purposes only and does not imply endorsement by the U.S. Government.
Although this report is in the public domain, permission must be secured from the individual copyright owners to reproduce any copyrighted material contained within this report.
3
Shear Wave Structure of Umbria and Marche, Italy, Strong Motion Seismometer Sites Affected by the 1997-98 Umbria-Marche, Italy, Earthquake Sequence INTRODUCTION
A long sequence of earthquakes, eight with magnitudes between 5 and 6, struck the Umbria and Marche regions of central Italy between September 26, 1997 and July 1998. The earthquake swarm caused severe structural damage, particularly to masonry buildings, and resulted in the loss of twelve lives and about 150 injuries. The source of the events was a single seismogenic structure that consists of several faults with a prevailing northwest-southeast strike and crosses the Umbria-Marche border. The focal mechanism of the largest shocks indicates that the events were the product of shallow extensional normal faulting along a NE-SW extension perpendicular to the trend of the Apennines.
The network of analog seismometer stations in the Umbria and Marche regions recorded motions
of the main September and October 1997 events and a dense array of mobile digital stations, installed since September 29, recorded most of the swarm. The permanent national network Rete Accelerometrica Nazionale (RAN) is administered and maintained by Dipartimento delle Protezione Civile (DPC: Civil Protection Department); the temporary array was managed by Servizio Sismico Nazionale (SSN) in cooperation with small agencies and Universities (SSN, 2002) . ENEA, the operator of many seismometer stations in Umbria, is the public Italian National Agency for New Technologies, Energy and the Environment.
Many of the temporary and permanent stations in the Italian seismic network have little or no
characterization of seismic velocities (Scarserra, et al. 2008; Scarserra, et al. in press). In this study, we investigated 17 Italian sites using an active-source approach that employs low frequency harmonic waves to measure the dispersive nature of surface waves in the ground. We used the Spectral Analysis of Surface Wave (SASW) approach, coupled with an array of harmonic-wave electro-mechanical sources that are driven in-phase to excite the ground. An inversion algorithm using a non-linear least-squares best-fit method is used to compute shear wave velocities for up to 100 meters of the soil column. A draft report was published in the summer of 2008, followed by a comment period, lengthy discussions with Italian colleagues, and improved knowledge of the subsurface at the sites from soil logs. Four of the sites were reprocessed in order to correct issues with phase unwrapping of the field dispersion curves that complicated the velocity profile calculations at the lowest velocity sites. This report presents the final results from the reprocessing effort.
1997-98 Umbria-Marche, Italy, Earthquake Sequence
The regions of Umbria and Marche were shaken by two strong motion events on September 26, 1997 near Colfiorito on the Umbria-Marche border. Temporary stations were deployed in the epicentral region and recorded two large shocks on October 3 and 6. Later on October 12, 14, and November 9, swarms of quakes occurred in the vicinity of the town of Sellano.
4
After almost five months of relative seismic quiescence, two strong motion events occurred in the northern part of Umbria (Gualdo Tadino area) on March 26 and April 3 1998 (Decanini et al., 2002) with magnitudes of 5.6 and 5.3. The September events were the largest with magnitudes of M5.8 and M6.0. The two October quakes near Colfiorito were of M5.3 and the Sellano swarm had several major shocks that ranged from M4.5 to 5.7. In Colfiorito, the largest peak accelerations recorded were 0.38g and 0.44g horizontal and 0.33g vertical. In Nocera Umbra, the largest peak accelerations were 0.56g and 0.50g horizontal and 0.42g vertical (Trobiner et al., 1997).
The geologic setting of the rock in the mountainous Apennines of the Umbria-Marche regions consists of folded and thrust-faulted Mesozoic and Cenozoic marl, marl clays, and limestone. Valley alluvium of Pleistocene and Holocene age fill the drainages and lowland areas. In general, the region is dissected by a suite of NNW-trending Cenozoic thrust faults, now undergoing extension. The setting of faulted marine units has been the source of over a score of shallow damaging earthquakes in the past 800 years.
The Umbria-Marche earthquake swarm severely damaged hundreds of architecturally and culturally important structures, including the Basilica of St. Francesco in the town of Assisi, as well as palaces, towers, churches and historically important residences. In Foligno and Nocera Umbra, the towns’ medieval towers collapsed, and numerous city gates were damaged. Severe damage was found, almost exclusively, in the stone masonry constructed structures. Strong-motion stations located within these towns, and the temporary stations set up after the initial events in more rural settings, were the object of our SASW testing program. All of the sites tested using SASW were temporary and permanent stations set up in or near the hilltop towns, or surrounding agricultural fields. Velocity Measurements
The 17 strong-motion instrument sites were measured for velocity structure using a controlled sine wave source and the spectral analysis of surface waves (SASW) method. The SASW method of testing is a portable, inexpensive, and efficient means of non-invasively estimating the stiffness properties of the ground to depths up to 100 meters. Prior to the development of non-invasive surface wave methods, shear waves were measured in cased boreholes in rock or by penetration tests, both costly methods, using a conventional travel-time approach. For many of the sites we studied in Umbria and Marche regions, the penetration method could not sound to useful depths, and limited borehole data are available. The surface wave test apparatus is highly portable allowing us to measure in remote locations where only small all-wheel-drive vehicles can go: for example, site 263GBB, Gubbio Park Collo.
5
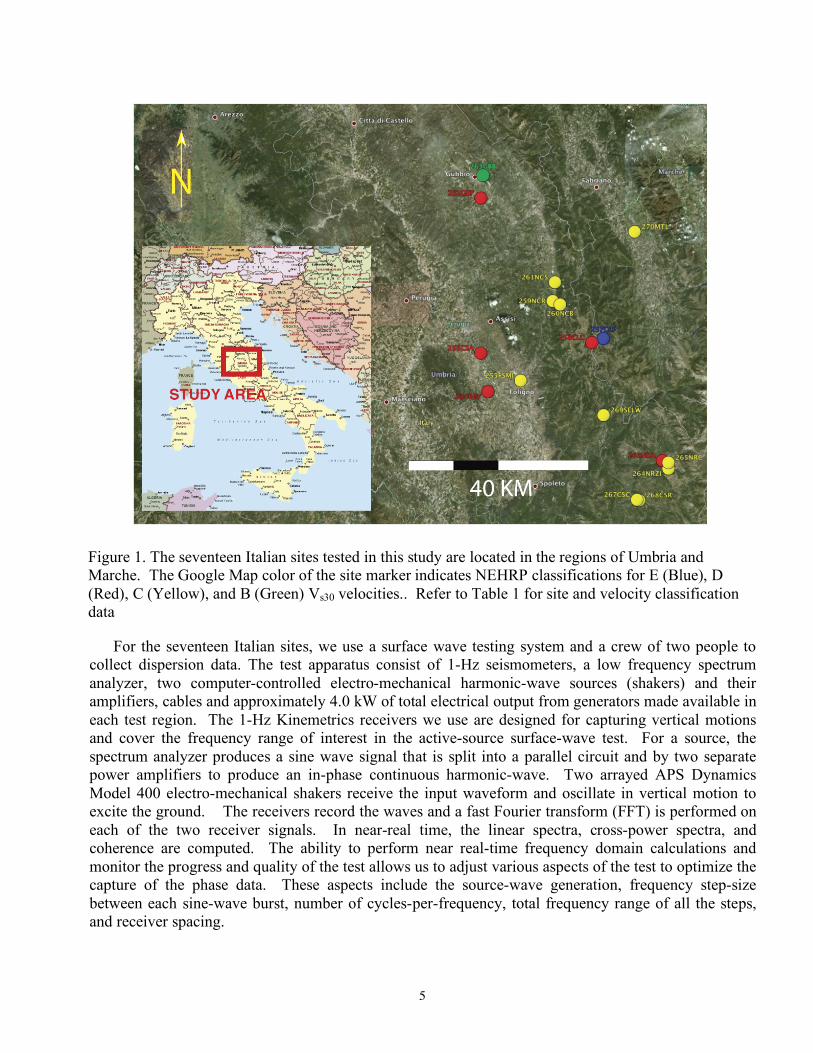
Figure 1. The seventeen Italian sites tested in this study are located in the regions of Umbria and Marche. The Google Map color of the site marker indicates NEHRP classifications for E (Blue), D (Red), C (Yellow), and B (Green) Vs30 velocities.. Refer to Table 1 for site and velocity classification data
For the seventeen Italian sites, we use a surface wave testing system and a crew of two people to collect dispersion data. The test apparatus consist of 1-Hz seismometers, a low frequency spectrum analyzer, two computer-controlled electro-mechanical harmonic-wave sources (shakers) and their amplifiers, cables and approximately 4.0 kW of total electrical output from generators made available in each test region. The 1-Hz Kinemetrics receivers we use are designed for capturing vertical motions and cover the frequency range of interest in the active-source surface-wave test. For a source, the spectrum analyzer produces a sine wave signal that is split into a parallel circuit and by two separate power amplifiers to produce an in-phase continuous harmonic-wave. Two arrayed APS Dynamics Model 400 electro-mechanical shakers receive the input waveform and oscillate in vertical motion to excite the ground. The receivers record the waves and a fast Fourier transform (FFT) is performed on each of the two receiver signals. In near-real time, the linear spectra, cross-power spectra, and coherence are computed. The ability to perform near real-time frequency domain calculations and monitor the progress and quality of the test allows us to adjust various aspects of the test to optimize the capture of the phase data. These aspects include the source-wave generation, frequency step-size between each sine-wave burst, number of cycles-per-frequency, total frequency range of all the steps, and receiver spacing.
6
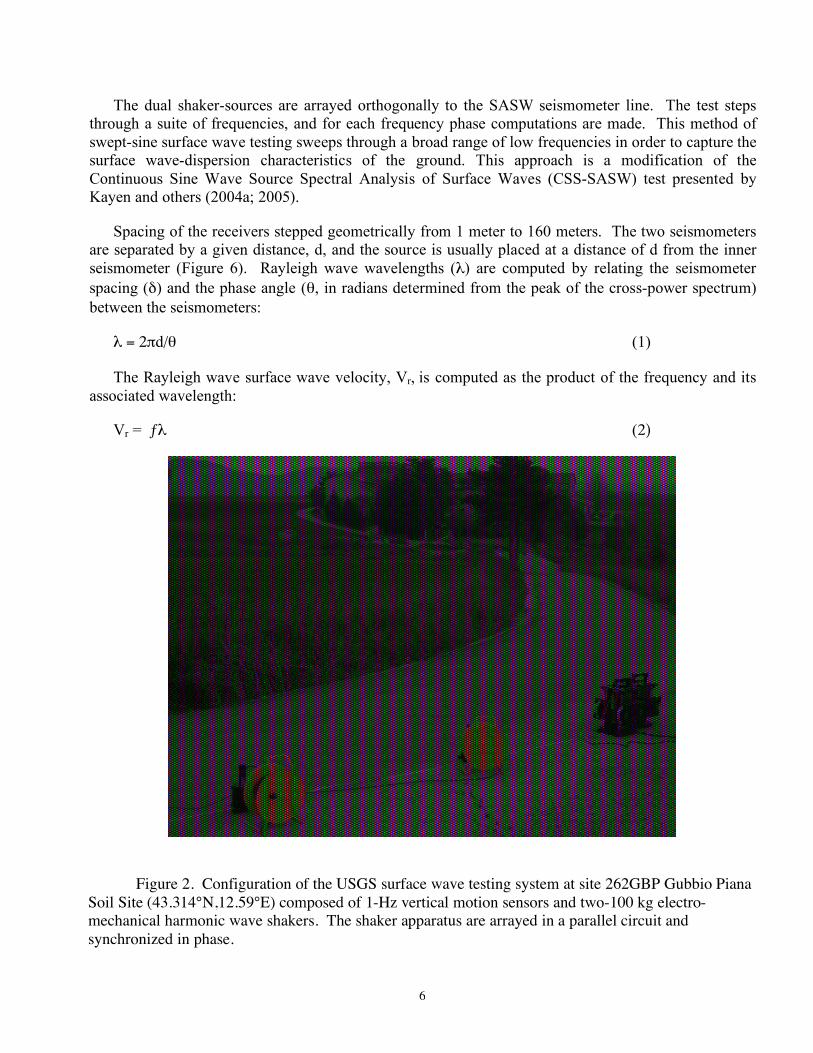
The dual shaker-sources are arrayed orthogonally to the SASW seismometer line. The test steps through a suite of frequencies, and for each frequency phase computations are made. This method of swept-sine surface wave testing sweeps through a broad range of low frequencies in order to capture the surface wave-dispersion characteristics of the ground. This approach is a modification of the Continuous Sine Wave Source Spectral Analysis of Surface Waves (CSS-SASW) test presented by Kayen and others (2004a; 2005).
Spacing of the receivers stepped geometrically from 1 meter to 160 meters. The two seismometers are separated by a given distance, d, and the source is usually placed at a distance of d from the inner seismometer (Figure 6). Rayleigh wave wavelengths (λ) are computed by relating the seismometer spacing (δ) and the phase angle (θ, in radians determined from the peak of the cross-power spectrum) between the seismometers:
λ = 2πd/θ (1)
The Rayleigh wave surface wave velocity, Vr, is computed as the product of the frequency and its associated wavelength:
Vr = ƒλ (2)
Figure 2. Configuration of the USGS surface wave testing system at site 262GBP Gubbio Piana Soil Site (43.314°N,12.59°E) composed of 1-Hz vertical motion sensors and two-100 kg electro-mechanical harmonic wave shakers. The shaker apparatus are arrayed in a parallel circuit and synchronized in phase.
7
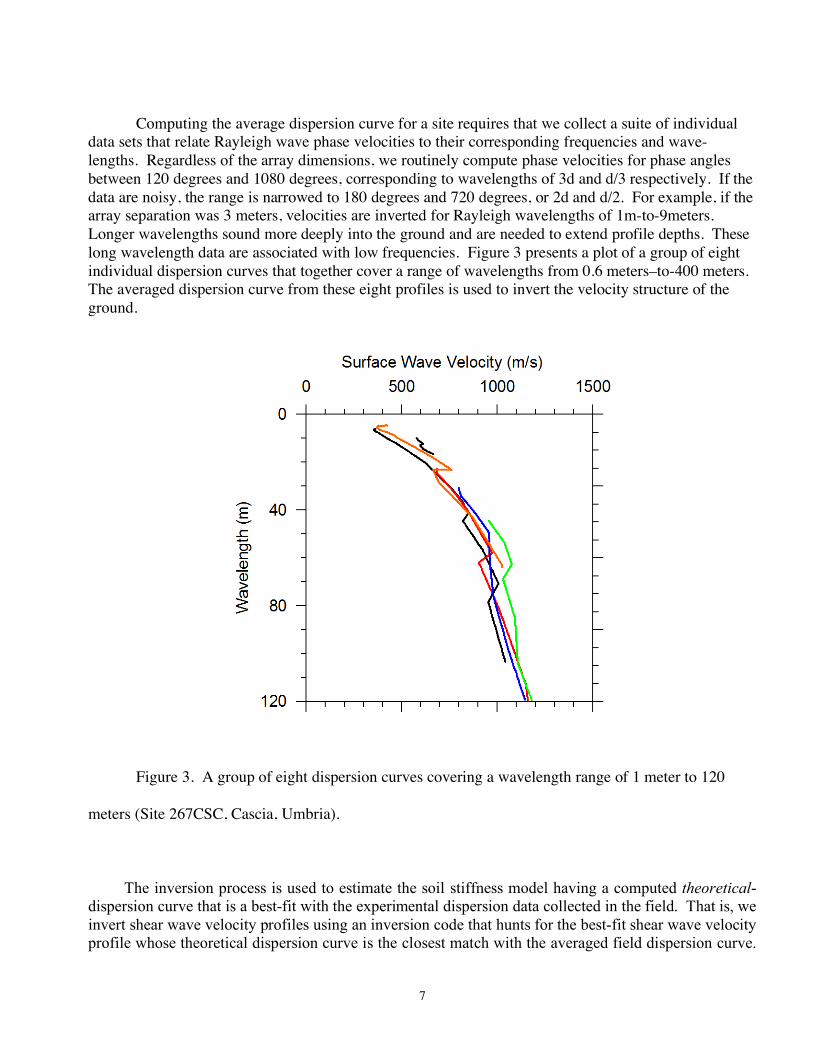
Computing the average dispersion curve for a site requires that we collect a suite of individual
data sets that relate Rayleigh wave phase velocities to their corresponding frequencies and wave-lengths. Regardless of the array dimensions, we routinely compute phase velocities for phase angles between 120 degrees and 1080 degrees, corresponding to wavelengths of 3d and d/3 respectively. If the data are noisy, the range is narrowed to 180 degrees and 720 degrees, or 2d and d/2. For example, if the array separation was 3 meters, velocities are inverted for Rayleigh wavelengths of 1m-to-9meters. Longer wavelengths sound more deeply into the ground and are needed to extend profile depths. These long wavelength data are associated with low frequencies. Figure 3 presents a plot of a group of eight individual dispersion curves that together cover a range of wavelengths from 0.6 meters–to-400 meters. The averaged dispersion curve from these eight profiles is used to invert the velocity structure of the ground.
Figure 3. A group of eight dispersion curves covering a wavelength range of 1 meter to 120
meters (Site 267CSC, Cascia, Umbria).
The inversion process is used to estimate the soil stiffness model having a computed theoretical-dispersion curve that is a best-fit with the experimental dispersion data collected in the field. That is, we invert shear wave velocity profiles using an inversion code that hunts for the best-fit shear wave velocity profile whose theoretical dispersion curve is the closest match with the averaged field dispersion curve.
8
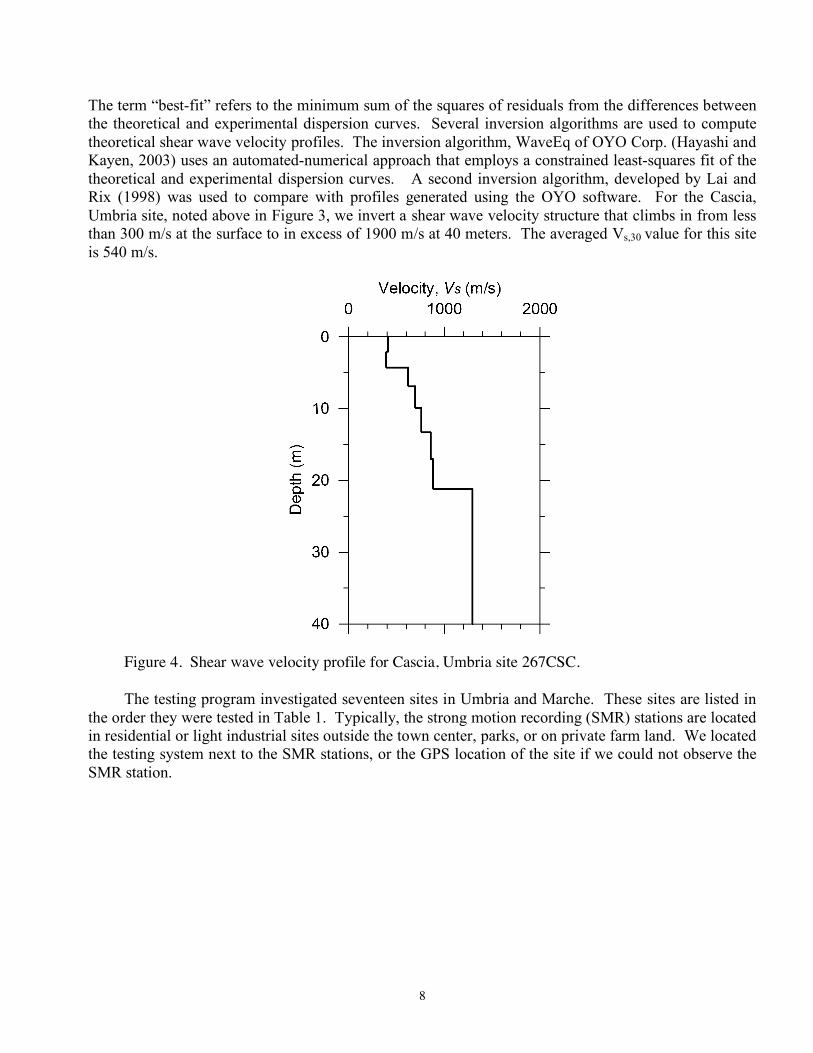
The term “best-fit” refers to the minimum sum of the squares of residuals from the differences between the theoretical and experimental dispersion curves. Several inversion algorithms are used to compute theoretical shear wave velocity profiles. The inversion algorithm, WaveEq of OYO Corp. (Hayashi and Kayen, 2003) uses an automated-numerical approach that employs a constrained least-squares fit of the theoretical and experimental dispersion curves. A second inversion algorithm, developed by Lai and Rix (1998) was used to compare with profiles generated using the OYO software. For the Cascia, Umbria site, noted above in Figure 3, we invert a shear wave velocity structure that climbs in from less than 300 m/s at the surface to in excess of 1900 m/s at 40 meters. The averaged Vs,30 value for this site is 540 m/s.
Figure 4. Shear wave velocity profile for Cascia, Umbria site 267CSC.
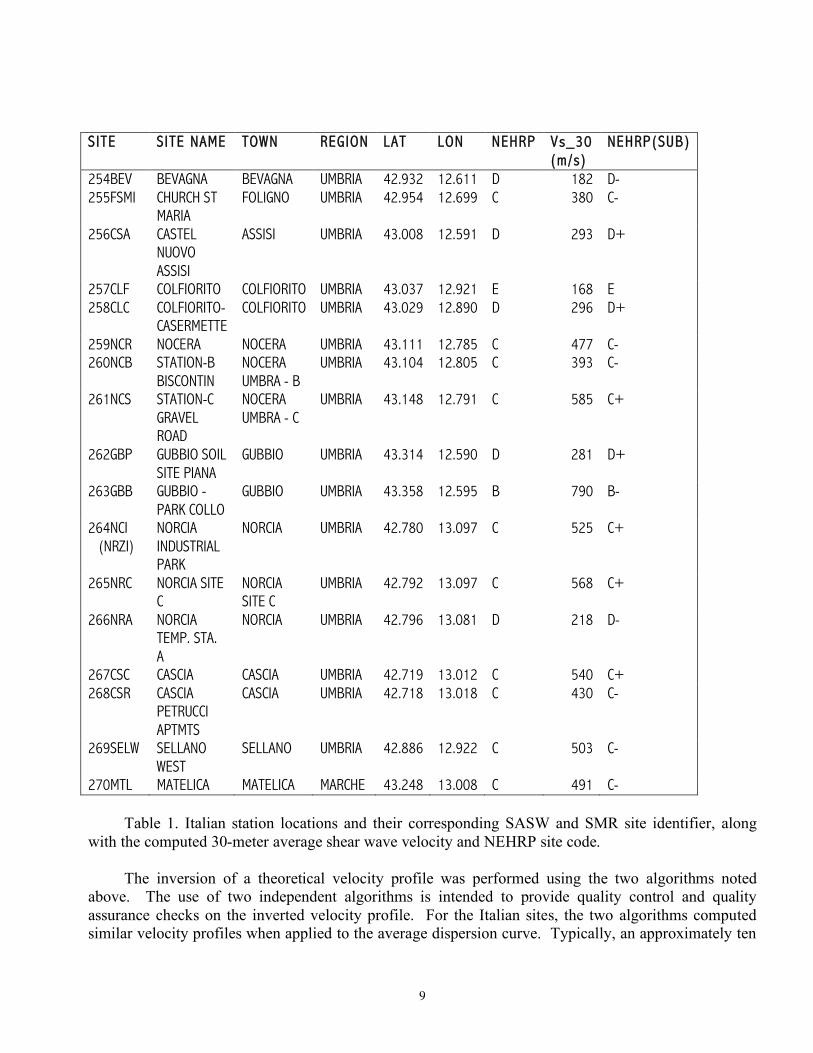
The testing program investigated seventeen sites in Umbria and Marche. These sites are listed in
the order they were tested in Table 1. Typically, the strong motion recording (SMR) stations are located in residential or light industrial sites outside the town center, parks, or on private farm land. We located the testing system next to the SMR stations, or the GPS location of the site if we could not observe the SMR station.
9
SITE SITE NAME TOWN REGION LAT LON NEHRP Vs_30 (m/s)
NEHRP(SUB)
254BEV BEVAGNA BEVAGNA UMBRIA 42.932 12.611 D 182 D- 255FSMI CHURCH ST
MARIA FOLIGNO UMBRIA 42.954 12.699 C 380 C-
256CSA CASTEL NUOVO ASSISI
ASSISI UMBRIA 43.008 12.591 D 293 D+
257CLF COLFIORITO COLFIORITO UMBRIA 43.037 12.921 E 168 E 258CLC COLFIORITO-
CASERMETTE COLFIORITO UMBRIA 43.029 12.890 D 296 D+
259NCR NOCERA NOCERA UMBRIA 43.111 12.785 C 477 C- 260NCB STATION-B
BISCONTIN NOCERA UMBRA - B
UMBRIA 43.104 12.805 C 393 C-
261NCS STATION-C GRAVEL ROAD
NOCERA UMBRA - C
UMBRIA 43.148 12.791 C 585 C+
262GBP GUBBIO SOIL SITE PIANA
GUBBIO UMBRIA 43.314 12.590 D 281 D+
263GBB GUBBIO - PARK COLLO
GUBBIO UMBRIA 43.358 12.595 B 790 B-
264NCI (NRZI)
NORCIA INDUSTRIAL PARK
NORCIA UMBRIA 42.780 13.097 C 525 C+
265NRC NORCIA SITE C
NORCIA SITE C
UMBRIA 42.792 13.097 C 568 C+
266NRA NORCIA TEMP. STA. A
NORCIA UMBRIA 42.796 13.081 D 218 D-
267CSC CASCIA CASCIA UMBRIA 42.719 13.012 C 540 C+ 268CSR CASCIA
PETRUCCI APTMTS
CASCIA UMBRIA 42.718 13.018 C 430 C-
269SELW SELLANO WEST
SELLANO UMBRIA 42.886 12.922 C 503 C-
270MTL MATELICA MATELICA MARCHE 43.248 13.008 C 491 C- Table 1. Italian station locations and their corresponding SASW and SMR site identifier, along
with the computed 30-meter average shear wave velocity and NEHRP site code. The inversion of a theoretical velocity profile was performed using the two algorithms noted
above. The use of two independent algorithms is intended to provide quality control and quality assurance checks on the inverted velocity profile. For the Italian sites, the two algorithms computed similar velocity profiles when applied to the average dispersion curve. Typically, an approximately ten
10
layer model was used for the inversion, with layer thicknesses geometrically expanding with depth. The increasing layer thicknesses correspond with decreasing dispersion information in the longer wavelength (deeper) portion of the dispersion curve. The profiles generally increase in stiffness with depth, though low velocity layers are present in several of the profiles.
The simplest way of characterizing the overall site condition is to use the average shear wave
velocity in the uppermost 30 meters of the subsurface (Vs30 from the IBC, 2002). Equation 3 is used to compute this average velocity based on the unit layer thickness (di) and the corresponding interval-velocity (VSi).
!
VS"depth"averaged
=
dii=1
n
#
di
VSii=1
n
# (3)
The Italian SMR averaged velocities for the upper 30 meters ranged from 168 to 790 m/s. The
velocities fall within NEHRP categories “E”-through- “B”. Data reprocessing of slow sites To perform the SASW tests, we used two electromechanical shakers that work in parallel-phase to
load the ground with 200-kg of dynamic force. With a frequency controlled source, the test starts from a high frequency and progresses in a stepped ('swept') sine mode to the lowest frequency setting. At four sites (Colfiorito sites 257CLF and 258CLF, Gubbio Piana site 262GBP, and Norcia temporary site 266NRA) there are very low velocity lake or marsh deposits. At these sites, the field data collection was performed incorrectly with a lowest frequency setting that was too high to capture the first phase jump (first 180° of data). For these cases, a given seismometer separation was tested with a frequency sweep range designed in order to capture data from below 180 degrees, to 720 degrees, but actually captured data above 180 degrees, so that the first phase jump was at 540 degrees. For these sites, a simple reprocessing was done to the data to add the required one phase jump (360°) to correct the dispersion curves to the proper wrapped phase number. This adjustment of exactly one phase jump of 360° properly positions the dispersion curves to their true phase. The two effects of the correction of the phase is the decrease in the computed wavelengths and velocities. The wavelength is decreased by:
λ(corrected)=2πd/(θ+2π) (4) . The velocities decrease by
Vr = ƒ•2πd/(θ+2π) (5) The effect of correcting the phase wrap and reducing the calculated wavelength, is to ultimately
reduce the depth of the sub-surface velocity profile.
11
Besides the reprocessing of four sites, we used the opportunity to reevaluate the other thirteen sites using the OYO code and an alternate inversion code developed by Georgia Tech University (Lai and Rix, 1998). The velocity characteristics for these sites are, either, the same or similar to the 2008 open-file report results.
Field sites Seventeen field sites were investigated in Umbria and Marche States between November 11, 2006
and November 21, 2006. At each of these sites, we deployed SASW and micro tremor equipment to capture surface waves either actively generated by our shaker or ambient vibrations.
Site 254BVG Located in Bevagna, Umbria State, Italy. This site data was collected on November
11, 2006 at latitude N42.932, longitude E12.611. The site is located in an agricultural field several blocks from the walled town of Bevagna. This site is listed in the INGV catalog as a ITDPC network seismometer, located at the boundary of fluvial sedimentary deposits and argillaceous lacustrian deposits. The SASW test was measured on a dirt road immediately adjacent to the accelerometer structure, a masonry building. The soil profile and microtremor recording are available for the site from the INGV website. Generally, the soil profile at BVG consists of organic and inorganic fine-grained deposits to a maximum depth of 51 m, and a clean sand layer between 1.5 and 5.2 m. The location and seismometer information for the site, as well as the soil log, can be found at http://itaca.mi.ingv.it/ItacaNet/CadmoDriver, under station code BVG.
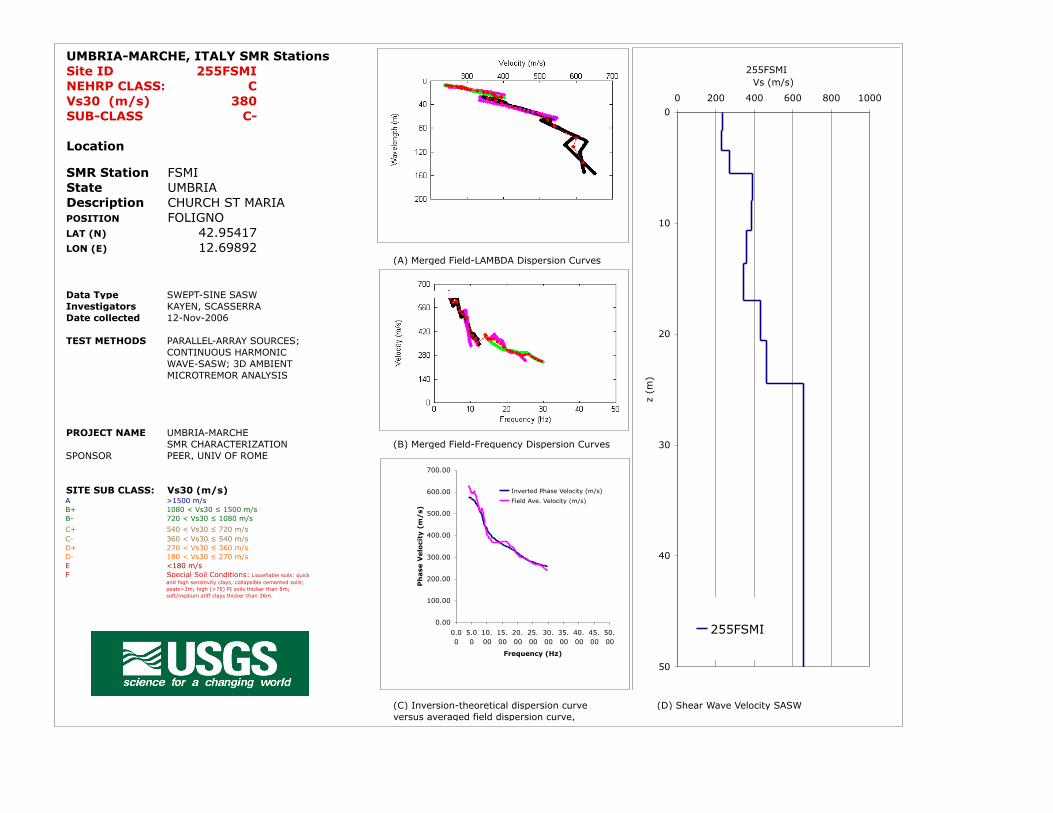
Site 255FSMI, located in Foligno city, Umbria State, Italy. This site data was collected on
November 12, 2006 at latitude N42.95417, longitude E12.6989. The site is located in the urban center of the city of Foligno near the church of Santa Maria. This site is listed in the INGV catalog as the ENEA seismometer station FSMI and is located at the boundary of fluvial sedimentary deposits and argillaceous lacustrian deposits. The SASW test was measured in a parking lot adjacent to tennis courts, approximately one block (100 m) northwest the recording station. A station Monograph can be found at http://itaca.mi.ingv.it/ItacaNet/CadmoDriver, under station code FSMI, and includes a map showing the location of the station, and seismometer information for the site, as well as the surface geology and microtremor recording.
Site 256CSA is located in the Castelnuovo Assisi industrial park of Cannara, near Assisi. In
Umbria State. Data for this site were collected on November 12, 2006 at latitude N43.00806°, E12.59052°. This industrial park is a light industry neighborhood approximately 1 km in area, converted from agricultural fields. The test site is 7 km southwest of the two top castle town of Assisi. The SASW test was located immediately adjacent to the CSA seismometer site, administered under the seismic network ITDPC, on recent fluvial and lake sediments of Pleistocene - Holocene age. On the INGV site CSA has a shear-wave velocity profile, surface geology map, and microtremor data. The INGV velocity profile and soil boring indicate that the upper 10 m of the site is an argillaceous lacustrian deposit, with an average velocity of 200 m/s.
In the zone from 10-50 m, there are unconsolidated sand and gravel with an average velocity of published 600 m/s. Below 50 m, the sand and gravel deposits increase in velocity to as much as 1000 m/s. A station Monograph can be found at http://itaca.mi.ingv.it/ItacaNet/CadmoDriver, under station code CSAD, a new station placed near the location of the original station CSA, and includes a map
12
showing the location of the station, seismometer information for the site, surface geology, borehole data, a shear-wave velocity profile, a geologic cross-section of the site, and a micro tremor recording.
Site 257CLF is located in an agricultural area near the city of Colfiorito, in Umbria State. The
sasw test was performed at latitude 43.03737° north, and Longitude 12.92118° east, approximately 90 m north east of the ENEL Seismometer station. Several detailed geologic maps are available for this site on the plane of Colfiorito, a Pleistocene and Holocene lakebed and low-lying marshy area that receives the title input from the adjacent hills. A station Monograph can be found at http://itaca.mi.ingv.it/ItacaNet/CadmoDriver, under station code CLF and includes a map showing the location of the station, photographs, seismometer information for the site, surface geology, a shear-wave velocity profile, and a micro tremor recording. The velocity log from the INGV site indicates a very low velocity deposit from the surface to 54 m depth that ranges between 126 and 200 m per second. Beneath the 54 m, the site enters the underlying bedrock with the published velocity of approximately 1500 m/s.
Site 258CLC is located in the town center of Colfiorito-Casermette, in a state of Umbria State.
The test site was located at latitude 43.02865° north, and longitude 12.89037° East, approximately 2.5 Kilometers west southwest of site 257CLF. The data set was recorded on November 13, 2006. A station Monograph for the ITDPC station can be found at http://itaca.mi.ingv.it/ItacaNet/CadmoDriver, under station code CLC and includes a map showing the location of the seismometer station, photographs, surface geology, and a micro tremor recording.
Site 259NCR is located in Nocera Umbra, in Umbria State, at latitude 43.11134° north, and
longitude 12.78467° East, is a residential area approximately 300 m west of the town center, on a sloped hillside. Data this site was recorded on November 14, 2006. The INGV website has information for Site NCR and a second Seismometer at the same location coded NCR two, both ENEL administered stations. The Seismometer site is founded on colluvium composed of clay silt and sand lenses to a depth of 4 m, with a velocity of approximately 200 m per sec. Beneath the surface soil deposit, is a layered clayey silty marl to a depth of approximately 8 m, with a published velocity ranging from 400- 500 m/s. Below 8m is calcareous marl with the published shear-wave velocity of between 700-950 m/s. A station Monograph can be found at http://itaca.mi.ingv.it/ItacaNet/CadmoDriver, under station code NCR and includes a map showing the location of the station, photographs, seismometer information for the site, surface geology, a shear-wave glossary log, and microtremor recording. No Monograph has been provided for station NCR2.
Site 260NCB is located in Nocera Umbra and is designated station “B” Biscontini. Data for this site was collected on November 14, 2006, and was located at latitude 43.10358° north, and Longitude 12.80518° East, approximately 1.5 km southeast of the town. This site is located in a alluvium-filled Valley. At the time of this writing no stratigraphic information was available for this ITDPC site at the INGV website. Basic information about the location and Operational time-window of site NCB can be found at http://itaca.mi.ingv.it/ItacaNet/CadmoDriver.
Site 261NCS is located at Nocera Umbra station “S”. Data for the site was collected on November
15, 2006 at location latitude 43.14835° north, and Longitude 12.79134° east, approximately 4 km north of the town. This site is at the end of a country road in a sloping stream drainage carrying alluvium from
13
the adjacent hill slopes to the east. At the time of this writing no information was available for this site at the INGV website.
Site 262GBP is located in an agricultural site 4 km south of the town of Gubbio. The SASW test
was located at latitude 43.311° north, and Longitude 12.5906° East, and collected on November 17, 2006. The local designation for this site is Gubbio Piana soil site. A published shear-wave profile for the ITDPC site is available on the INGV website and indicates a thin veneer of soil with high velocity in the range of 500 m/s, rests upon high velocity bedrock between 1500 m/s and 2000 m/s.
Site 263GBB is a steep sloping rock site above an east of the town of Gubbio at an location called
Park Collo. Data for this site was collected on November 17, 2006 and is located at latitude 43.35786° north, and longitude 12.59470° East. This site is situated on limestone and marl deposits, with no soil cover. The INGV website has photographs, and a surface geology map for this site in a station Monograph at http://itaca.mi.ingv.it/ItacaNet/CadmoDriver, under station code GBB. The monograph includes a map showing the location of the station, photographs, seismometer information, and surface geology.
Site 264NCI(NRZI) is located in Norcia industrial park, on Via Del Lavoro, in Norcia in Umbria
State. Data for the site was collected on November 18, 2006 and is located at latitude 42.77974° North, and Longitude 13.09729° East. At the time of this writing no stratigraphy information was available for this site at the INGV website. Basic seismometer location information can be found at http://itaca.mi.ingv.it/ItacaNet/CadmoDriver under station code NRZI.
Site 265NRC is located one block south of the walled town of Norcia. The data was collected on
November 18, 2006 on Vaile Enrico Lonbrici at latitude 42.79223° north, and longitude 13.09700° East, approximately 220 m from ITDPC seismometer station NRC. A station Monograph can be found at http://itaca.mi.ingv.it/ItacaNet/CadmoDriver, under station code NRC and includes a map showing the location of the station, photographs, seismometer information for the site, surface geology, a shear-wave velocity profile, a standard penetration test log, and a micro tremor recording. The webpage for the site also has downloadable geotechnical data. The surface geology of the SASW test is sandy gravel fluvial and lake deposits. The shear-wave velocity profile from the ITACA web site has surface velocities of approximately 200 m/s at the surface to 665 m/s at 2 m. From 2 m to 47 m, the velocity varies between 665 m/s and 850 m/s, with the exception of a low velocity layer between 30 and 32 m. Most of this layer is composed a calcareous sand and gravel. Deeper than 48 m, the velocity drops significantly to between 240 m/s and 480 m/s in an organic rich fine-grained deposit.
Site 266NRA is located at an ENEA seismometer station site in Norcia-Altavilla, located at
latitude 42.79556° north, and Longitude 13.08096° East. This site is located approximately 700 m west of the Western wall of the city of Norcia, along a roadside pullout off Vaile Umbria Road. At the time of this writing no stratigraphic information was available for this site at the INGV website. Basic seismometer location information can be found at http://itaca.mi.ingv.it/ItacaNet/CadmoDriver under station code NRA.
Site 267CSC is located in the town of Cascia, in Umbria State, located at 42.71875° north, and
13.012° East behind the Hotel Delle Rose, approximately 170 m from the Monastery of Santa Rita. The data was collected on November 20, 2006. The SASW site is located on a steep hill slope is on the
14
western side of the town. The location and seismometer information for the ITDPC site can be found at http://itaca.mi.ingv.it/ItacaNet/CadmoDriver, under station code CSC, as well as a map of the surface geology.
Site 268CSR is located on the hill slope east of the central town of Cascia. The SASW test was performed at latitude 42.7178 80° north, Longitude 13.01840° East, on November 20, 2006. The ITDPC seismometer site is located at the ground floor level of the Petrucci Apartments, whereas the SASW test was performed on a 100 m straight stretch of road named Via Filippo Tagliolini, off the main road Viale Cavour. At the time of this writing no stratigraphic information was available for Casca-Petrucci site at the INGV website. The location and seismometer information for the site can be found at http://itaca.mi.ingv.it/ItacaNet/CadmoDriver, under station code CSR.
Site 269SELW is located on the hilltop ridge in the western part of the Sellano in Umbria State.
The SASW test was located at latitude 42.8860° north, longitude12.9220° East along Viale Guglielmo Marconi. A station Monograph for Sellano West can be found at http://itaca.mi.ingv.it/ItacaNet/CadmoDriver under station code SELW, and includes a map showing the location of the station, photographs, seismometer information for the site, surface geology, a shear-wave velocity profile, a standard penetration test log, and a micro tremor recording. The webpage for the site also has downloadable geotechnical data. The published shear-wave velocity log for the site indicates that a low velocity surface layer (less than 200 m/s) in the upper 3 m rapidly gives away to an increasingly stiff deposit that climbs to 600 m/s or greater by 10 m. This ridge top profile probably represents surface soil over a weathered bedrock surface.
Site 270MTL in the city of Matellica in the state of Marche. The site is located at latitude 43.24841° north, Longitude 13.0079° East, and was collected on November 21, 2006. site 270 MTL has stratigraphic information on the INGV website. A 30 m borehole indicates that beneath a 1 m layer of man made-fill, is a silty sandy gravel deposit to a depth of G-8 leaders with it with thin inter-beds a finer grain inorganic silts and clays. Weathered bedrock was identified at 28 m. The location and seismometer information for the site can be found at http://itaca.mi.ingv.it/ItacaNet/CadmoDriver, under station code MTL.
Acknowledgments The authors would like to thank is the Pacific Earthquake Engineering Research (PEER) Center for support of work to better characterize strong-motion recording sites shaken by significant recent events. The reprocessing of several sites are the result of improved site information available from the website of DPC-INGV, from comments and discussions with Sebastiano Foti whose interactions with the authors is supported within the framework of the S4 Project 2007-2009 grant of DPC-INGV.
References Decanini, L., Mollaioli, F., Oliveto, G. (2002) Structural and seismological implications of the 1997
seismic sequence in Umbria and Marche, Italy. Innovative approach to Earthquake engineering. WIT Press, 229-323.
15
Hauksson, E., P. Small, K. Hafner, R. Busby, R. Clayton, J. Goltz, T. Heaton, K. Hutton, H. Kanamori, J. Polet, D. Given, L. M. Jones, and D. Wald, Southern California Seismic Network: Caltech/USGS Element of Italian 1997-2001, Seism. Res. Lett. 72, 697-711, 2001
Hayashi, K. and Kayen, R. (2003) comparative test of three surface wave methods at Williams Street
Park in San Jose, USA. Paper S051-009, 2003 Joint Meeting of Japan Earth and Planetary Science, University of Tokyo, Tokyo, Japan 2003 Joint Meeting, May 26-29, 2003.
International Code Council, Inc., 2002. 2003 International Building Code, Falls Church, VA. Kayen, R (2005) The spectral analysis of surface waves measured at William
Street Park, San Jose, California, using swept-sine harmonic waves. in Asten and Boore, eds., Blind comparisons of shear-wave velocities at closely-spaced sites in San Jose, California. US Geological Survey Open File Report 2005. http://pubs.usgs.gov/of/2005/1169
Kayen, R., Carkin, B., Minasian, D., and Tinsley, J. (2005) Shear Wave Velocity of the Ground Near
Southern California TRINET Sites Using the Spectral Analysis of Surface Waves Method (SASW) and Parallel-Arrayed Harmonic-Wave Sources. Open-File Report 2005-1169, http://pubs.usgs.gov/of/2005/1365
Kayen, R., Seed, R. B., Moss, R.E., Cetin, O., Tanaka, Y., and Tokimatsu, K. (2004) Global Shear
Wave Velocity Database for Probabilistic Assessment of the Initiation of Seismic-Soil Liquefaction. Proceedings of the 11th Int’l. Conf. On Soil Dynamics and Earthquake Engineering, January 7-9, 2004, Berkeley, CA, p. 506-512.
Kayen, R., Thompson, E., Minasian, D., Moss, R.E.S., Collins, B.D., Sitar, N., Dreger, D., Carver, G.
(2004) Geotechnical Reconnaissance of the November 3, 2002 M7.9 Denali Fault Earthquake, Earthquake Spectra, 20(3) p. 639-667.
Lai, C.G., and G. J. Rix (1998) Simultaneous Inversion of Rayleigh Phase Velocity and Attenuation
for Near-Surface Site Characterization," Report No. GIT-CEE/GEO-98-2, Georgia Institute of Technology, School of Civil and Environmental Engineering, 258 pp.
Scasserra G., Stewart J.P., Kayen R., Lanzo G. (2008). "Site characterization of Italian strong motion
recording stations,” in Proceedings of the 2008 Seismic Engineering Conference commemorating the 1908 Messina and Reggio Calabria Earthquake,, MERCEA’08, A. Santini and N. Moraci (eds), July 8-11, Reggio Calabria, Italy, Vol. 1, 338-345.S.S.N-Monitoring System Group - The Strong Motion Records of Umbria-Marche Sequence, (September 1997 - June 1998). CD-ROM, 2002.
Scasserra G., Stewart J.P., Kayen R., Lanzo G. (in press). " DATABASE FOR EARTHQUAKE
STRONG MOTION STUDIES IN ITALY”, Journal of Earthquake Engineering. Stokoe, K. and Nazarian, S. (1985) Use of Raleigh Waves in liquefaction Studies, in, R.D. Woods, ed.,
Measurement and use of Shear Wave Velocity for Evaluating Dynamic Soil Properties. ASCE, N.Y., 1-17.

16
Trobiner, S. et al. (1997) Reconnaissance Report on the Umbria-Marche, Italy, Earthquakes of 1997,
EERI Special Earthquake Report – December 1997, 12 p.

17
Appendix 1: Seismic s-wave velocity profile and dispersion data for seventeen Italian stations in Umbria and Marche states.

UMBRIA-MARCHE, ITALY SMR StationsSite ID 254BEVNEHRP CLASS: DVs30 (m/s) 182SUB-CLASS D-
Location
SMR Station SMI
State UMBRIADescriptionPOSITION BEVAGNALAT (N) 42.9324LON (E) 12.6111
(A) Merged Field-LAMBDA Dispersion Curves
Data Type SWEPT-SINE SASWInvestigators KAYEN, SCASSERRADate collected 11-Nov-2006
TEST METHODS PARALLEL-ARRAY SOURCES;CONTINUOUS HARMONICWAVE-SASW; 3D AMBIENT MICROTREMOR ANALYSIS
PROJECT NAME UMBRIA-MARCHE SMR CHARACTERIZATION (B) Merged Field-Frequency Dispersion Curves
SPONSOR PEER, UNIV OF ROME
SITE SUB CLASS: Vs30 (m/s)A >1500 m/sB+ 1080 < Vs30 ≤ 1500 m/sB- 720 < Vs30 ≤ 1080 m/s
C+ 540 < Vs30 ≤ 720 m/sC- 360 < Vs30 ≤ 540 m/sD+ 270 < Vs30 ≤ 360 m/sD- 180 < Vs30 ≤ 270 m/sE <180 m/sF Special Soil Conditions: Liquefiable soils; quick
and high sensitivity clays; collapsible cemented soils; peats>3m; high (>75) PI soils thicker than 8m; soft/medium stiff clays thicker than 36m.
(C) Inversion-theoretical dispersion curve versus averaged field dispersion curve,
(D) Shear Wave Velocity SASW
254BEV
0
10
20
30
40
50
60
70
80
90
100
0 200 400 600 800
Vs (m/s)
z (m
)
254BEV0
100
200
300
400
500
600
0 5 10 15 20 25 30
Frequency (Hz)
Ph
ase
Velo
city
(m
/s)
Field Ave. Velocity (m/s)
Inverted Phase Velocity (m/s)
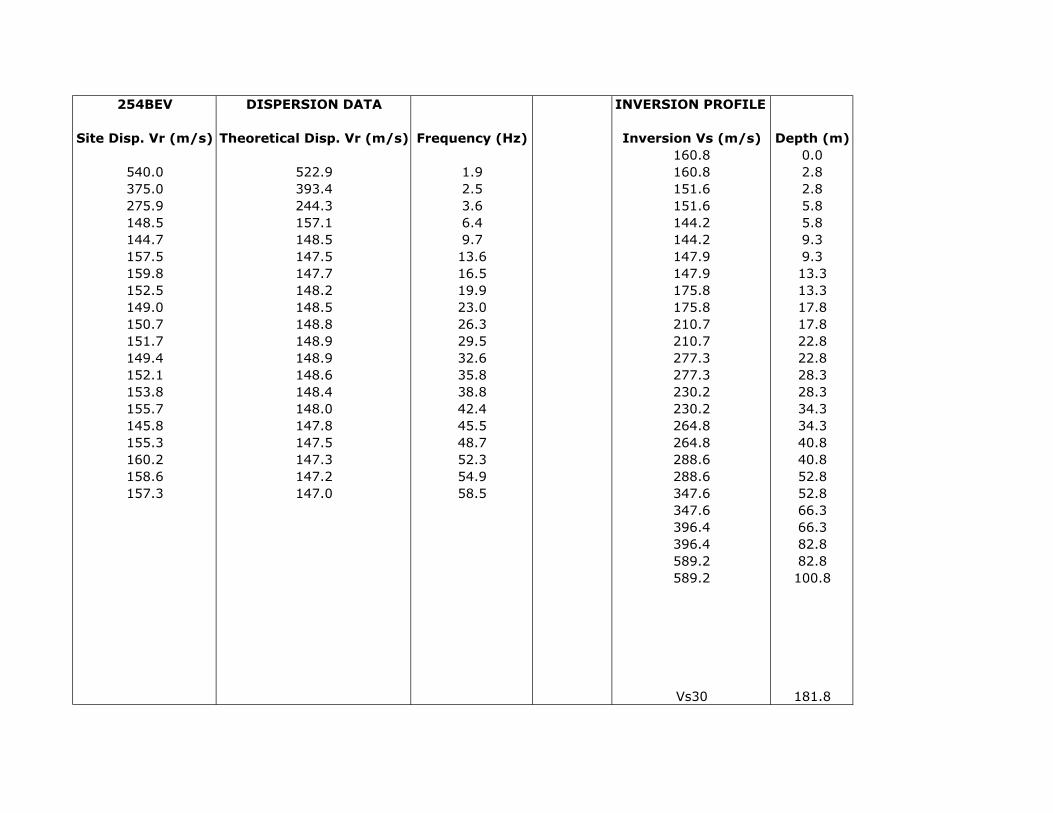
254BEV DISPERSION DATA INVERSION PROFILE
Site Disp. Vr (m/s) Theoretical Disp. Vr (m/s) Frequency (Hz) Inversion Vs (m/s) Depth (m)160.8 0.0
540.0 522.9 1.9 160.8 2.8375.0 393.4 2.5 151.6 2.8275.9 244.3 3.6 151.6 5.8148.5 157.1 6.4 144.2 5.8144.7 148.5 9.7 144.2 9.3157.5 147.5 13.6 147.9 9.3159.8 147.7 16.5 147.9 13.3152.5 148.2 19.9 175.8 13.3149.0 148.5 23.0 175.8 17.8150.7 148.8 26.3 210.7 17.8151.7 148.9 29.5 210.7 22.8149.4 148.9 32.6 277.3 22.8152.1 148.6 35.8 277.3 28.3153.8 148.4 38.8 230.2 28.3155.7 148.0 42.4 230.2 34.3145.8 147.8 45.5 264.8 34.3155.3 147.5 48.7 264.8 40.8160.2 147.3 52.3 288.6 40.8158.6 147.2 54.9 288.6 52.8157.3 147.0 58.5 347.6 52.8
347.6 66.3396.4 66.3396.4 82.8589.2 82.8589.2 100.8
Vs30 181.8
UMBRIA-MARCHE, ITALY SMR StationsSite ID 255FSMINEHRP CLASS: CVs30 (m/s) 380SUB-CLASS C-
Location
SMR Station FSMI
State UMBRIADescription CHURCH ST MARIAPOSITION FOLIGNOLAT (N) 42.95417LON (E) 12.69892
(A) Merged Field-LAMBDA Dispersion Curves
Data Type SWEPT-SINE SASWInvestigators KAYEN, SCASSERRADate collected 12-Nov-2006
TEST METHODS PARALLEL-ARRAY SOURCES;CONTINUOUS HARMONICWAVE-SASW; 3D AMBIENT MICROTREMOR ANALYSIS
PROJECT NAME UMBRIA-MARCHE SMR CHARACTERIZATION (B) Merged Field-Frequency Dispersion Curves
SPONSOR PEER, UNIV OF ROME
SITE SUB CLASS: Vs30 (m/s)A >1500 m/sB+ 1080 < Vs30 ≤ 1500 m/sB- 720 < Vs30 ≤ 1080 m/s
C+ 540 < Vs30 ≤ 720 m/sC- 360 < Vs30 ≤ 540 m/sD+ 270 < Vs30 ≤ 360 m/sD- 180 < Vs30 ≤ 270 m/sE <180 m/sF Special Soil Conditions: Liquefiable soils; quick
and high sensitivity clays; collapsible cemented soils; peats>3m; high (>75) PI soils thicker than 8m; soft/medium stiff clays thicker than 36m.
(C) Inversion-theoretical dispersion curve versus averaged field dispersion curve,
(D) Shear Wave Velocity SASW
255FSMI
0
10
20
30
40
50
0 200 400 600 800 1000
Vs (m/s)
z (m
)
255FSMI0.00
100.00
200.00
300.00
400.00
500.00
600.00
700.00
0.00
5.00
10.00
15.00
20.00
25.00
30.00
35.00
40.00
45.00
50.00
Frequency (Hz)
Ph
ase
Velo
city
(m
/s)
Inverted Phase Velocity (m/s)
Field Ave. Velocity (m/s)
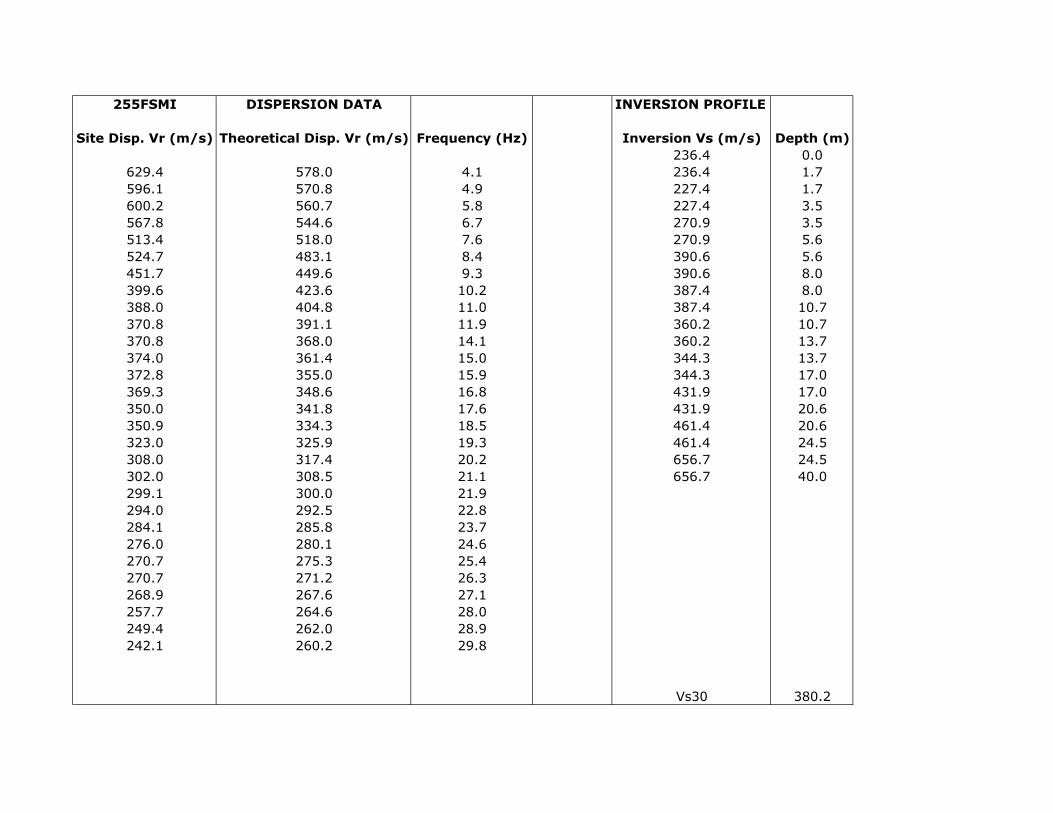
255FSMI DISPERSION DATA INVERSION PROFILE
Site Disp. Vr (m/s) Theoretical Disp. Vr (m/s) Frequency (Hz) Inversion Vs (m/s) Depth (m)236.4 0.0
629.4 578.0 4.1 236.4 1.7596.1 570.8 4.9 227.4 1.7600.2 560.7 5.8 227.4 3.5567.8 544.6 6.7 270.9 3.5513.4 518.0 7.6 270.9 5.6524.7 483.1 8.4 390.6 5.6451.7 449.6 9.3 390.6 8.0399.6 423.6 10.2 387.4 8.0388.0 404.8 11.0 387.4 10.7370.8 391.1 11.9 360.2 10.7370.8 368.0 14.1 360.2 13.7374.0 361.4 15.0 344.3 13.7372.8 355.0 15.9 344.3 17.0369.3 348.6 16.8 431.9 17.0350.0 341.8 17.6 431.9 20.6350.9 334.3 18.5 461.4 20.6323.0 325.9 19.3 461.4 24.5308.0 317.4 20.2 656.7 24.5302.0 308.5 21.1 656.7 40.0299.1 300.0 21.9294.0 292.5 22.8284.1 285.8 23.7276.0 280.1 24.6270.7 275.3 25.4270.7 271.2 26.3268.9 267.6 27.1257.7 264.6 28.0249.4 262.0 28.9242.1 260.2 29.8
Vs30 380.2
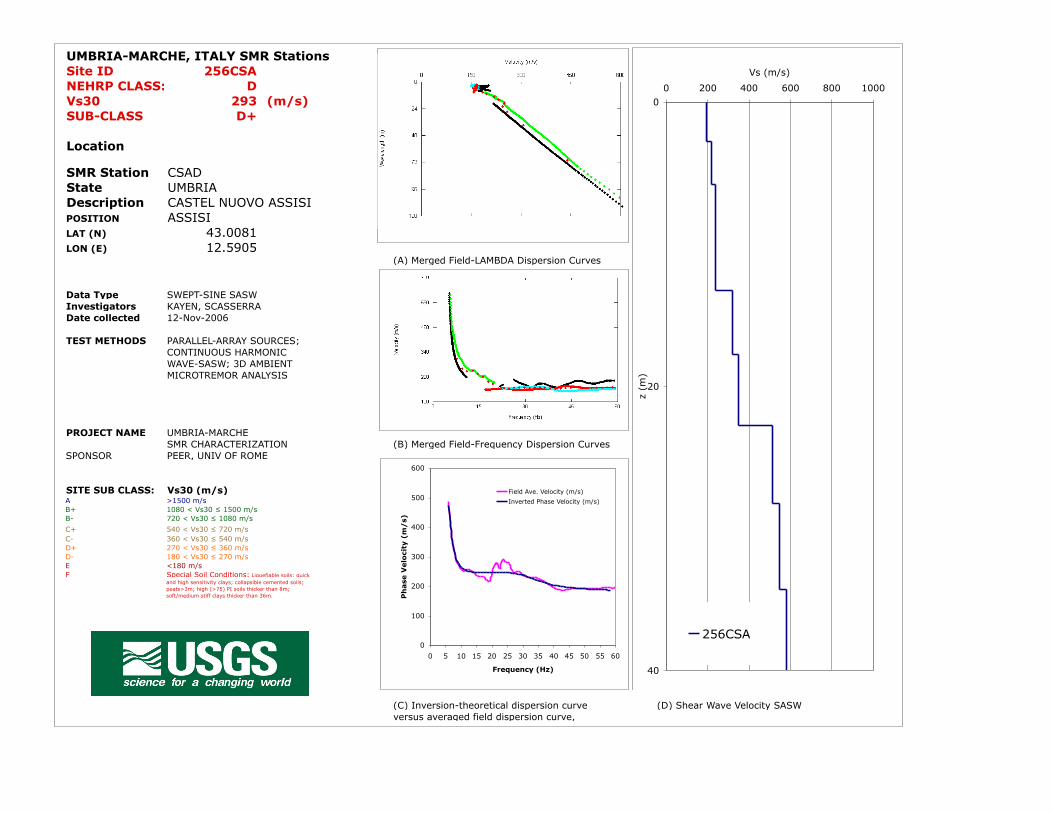
UMBRIA-MARCHE, ITALY SMR StationsSite ID 256CSANEHRP CLASS: DVs30 293 (m/s)SUB-CLASS D+
Location
SMR Station CSAD
State UMBRIADescription CASTEL NUOVO ASSISIPOSITION ASSISI LAT (N) 43.0081LON (E) 12.5905
(A) Merged Field-LAMBDA Dispersion Curves
Data Type SWEPT-SINE SASWInvestigators KAYEN, SCASSERRADate collected 12-Nov-2006
TEST METHODS PARALLEL-ARRAY SOURCES;CONTINUOUS HARMONICWAVE-SASW; 3D AMBIENT MICROTREMOR ANALYSIS
PROJECT NAME UMBRIA-MARCHE SMR CHARACTERIZATION (B) Merged Field-Frequency Dispersion Curves
SPONSOR PEER, UNIV OF ROME
SITE SUB CLASS: Vs30 (m/s)A >1500 m/sB+ 1080 < Vs30 ≤ 1500 m/sB- 720 < Vs30 ≤ 1080 m/s
C+ 540 < Vs30 ≤ 720 m/sC- 360 < Vs30 ≤ 540 m/sD+ 270 < Vs30 ≤ 360 m/sD- 180 < Vs30 ≤ 270 m/sE <180 m/sF Special Soil Conditions: Liquefiable soils; quick
and high sensitivity clays; collapsible cemented soils; peats>3m; high (>75) PI soils thicker than 8m; soft/medium stiff clays thicker than 36m.
(C) Inversion-theoretical dispersion curve versus averaged field dispersion curve,
(D) Shear Wave Velocity SASW
0
20
40
0 200 400 600 800 1000
Vs (m/s)
z (m
)256CSA
0
100
200
300
400
500
600
0 5 10 15 20 25 30 35 40 45 50 55 60
Frequency (Hz)
Ph
ase
Velo
city
(m
/s)
Field Ave. Velocity (m/s)
Inverted Phase Velocity (m/s)

256CSA DISPERSION DATA INVERSION PROFILE
Site Disp. Vr (m/s) Theoretical Disp. Vr (m/s) Frequency (Hz) Inversion Vs (m/s) Depth (m)192.7 0.0
486.1 475.3 5.9 192.7 2.8360.5 367.6 6.9 215.4 2.8303.5 306.9 8.0 215.4 5.8273.0 279.2 9.0 236.1 5.8257.8 265.3 10.0 236.1 9.3252.1 258.2 10.9 236.6 9.3257.8 253.1 12.1 236.6 13.3253.7 250.5 13.1 319.3 13.3246.1 249.0 14.1 319.3 17.8246.1 248.1 15.2 349.3 17.8246.1 247.7 16.2 349.3 22.8246.1 247.5 17.2 510.1 22.8246.1 247.5 18.3 510.1 28.3232.7 247.5 19.3 545.3 28.3255.7 247.5 20.2 545.3 34.3251.4 247.5 21.4 578.2 34.3251.4 247.5 22.4 578.2 40.8251.4 247.3 23.4 565.8 40.8251.4 246.9 24.4251.4 246.2 25.5251.4 245.3 26.6246.9 243.9 27.6252.1 242.1 28.6240.1 239.6 29.6235.4 236.5 30.6231.1 232.9 31.6229.5 228.9 32.6231.8 224.7 33.7228.4 220.6 34.8224.0 217.0 35.8218.1 213.7 36.8211.3 210.5 37.8 Vs30 293.2
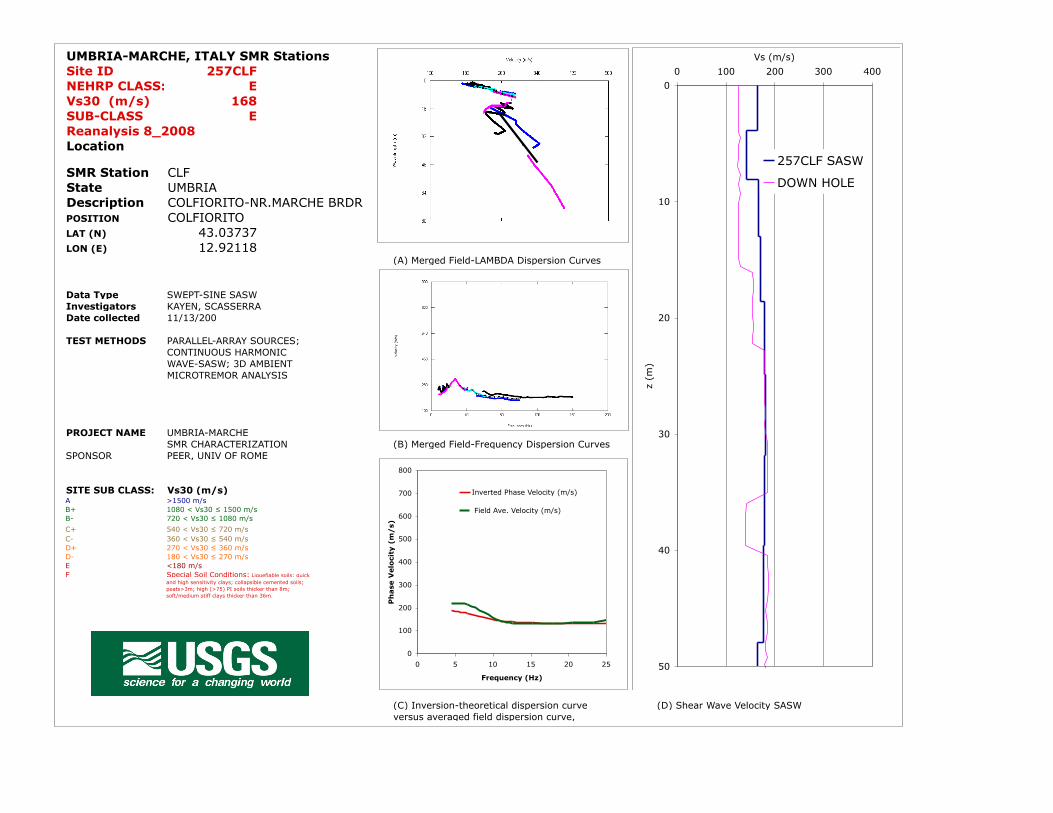
UMBRIA-MARCHE, ITALY SMR StationsSite ID 257CLFNEHRP CLASS: EVs30 (m/s) 168SUB-CLASS E
Reanalysis 8_2008Location
SMR Station CLF
State UMBRIADescription COLFIORITO-NR.MARCHE BRDRPOSITION COLFIORITOLAT (N) 43.03737LON (E) 12.92118
(A) Merged Field-LAMBDA Dispersion Curves
Data Type SWEPT-SINE SASWInvestigators KAYEN, SCASSERRADate collected 11/13/200
TEST METHODS PARALLEL-ARRAY SOURCES;CONTINUOUS HARMONICWAVE-SASW; 3D AMBIENT MICROTREMOR ANALYSIS
PROJECT NAME UMBRIA-MARCHE SMR CHARACTERIZATION (B) Merged Field-Frequency Dispersion Curves
SPONSOR PEER, UNIV OF ROME
SITE SUB CLASS: Vs30 (m/s)A >1500 m/sB+ 1080 < Vs30 ≤ 1500 m/sB- 720 < Vs30 ≤ 1080 m/s
C+ 540 < Vs30 ≤ 720 m/sC- 360 < Vs30 ≤ 540 m/sD+ 270 < Vs30 ≤ 360 m/sD- 180 < Vs30 ≤ 270 m/sE <180 m/sF Special Soil Conditions: Liquefiable soils; quick
and high sensitivity clays; collapsible cemented soils; peats>3m; high (>75) PI soils thicker than 8m; soft/medium stiff clays thicker than 36m.
(C) Inversion-theoretical dispersion curve versus averaged field dispersion curve,
(D) Shear Wave Velocity SASW
0
10
20
30
40
50
0 100 200 300 400
Vs (m/s)
z (m
)
257CLF SASW
DOWN HOLE
0
100
200
300
400
500
600
700
800
0 5 10 15 20 25
Frequency (Hz)
Ph
ase
Velo
city
(m
/s)
Inverted Phase Velocity (m/s)
Field Ave. Velocity (m/s)

257CLF DISPERSION DATA INVERSION PROFILE
Site Disp. Vr (m/s) Theoretical Disp. Vr (m/s) Frequency (Hz) Inversion Vs (m/s) Depth (m)164.8 0.0
221.6 190.0 4.5 164.8 3.9214.7 176.5 6.6 142.9 3.9145.3 144.7 10.9 142.9 8.1134.2 140.1 12.5 167.2 8.1131.6 136.7 15.2 167.2 13.0131.2 135.5 17.9 171.1 13.0135.6 135.3 20.6 171.1 18.6136.4 135.5 23.3 178.4 18.6159.0 135.8 26.2 178.4 24.9166.7 136.2 28.7 180.6 24.9167.5 136.6 31.4 180.6 31.9164.9 136.9 34.1 180.1 31.9161.1 137.1 36.8 180.1 39.6157.4 137.2 39.3 176.3 39.6139.4 137.2 42.1 176.3 48.0145.2 137.1 44.8 165.4 48.0147.6 136.8 47.5 165.4 57.1144.0 136.5 50.2 161.7 57.1161.5 136.1 53.0163.8 135.6 55.6161.9 135.2 58.3180.5 134.8 60.7191.6 134.3 63.7188.7 133.8 66.4185.7 133.4 69.1183.8 133.0 71.8185.1 132.7 74.5186.4 132.3 77.2187.2 132.0 79.9184.1 131.7 82.6179.1 131.4 85.3176.6 131.2 88.0 Vs30 168.0
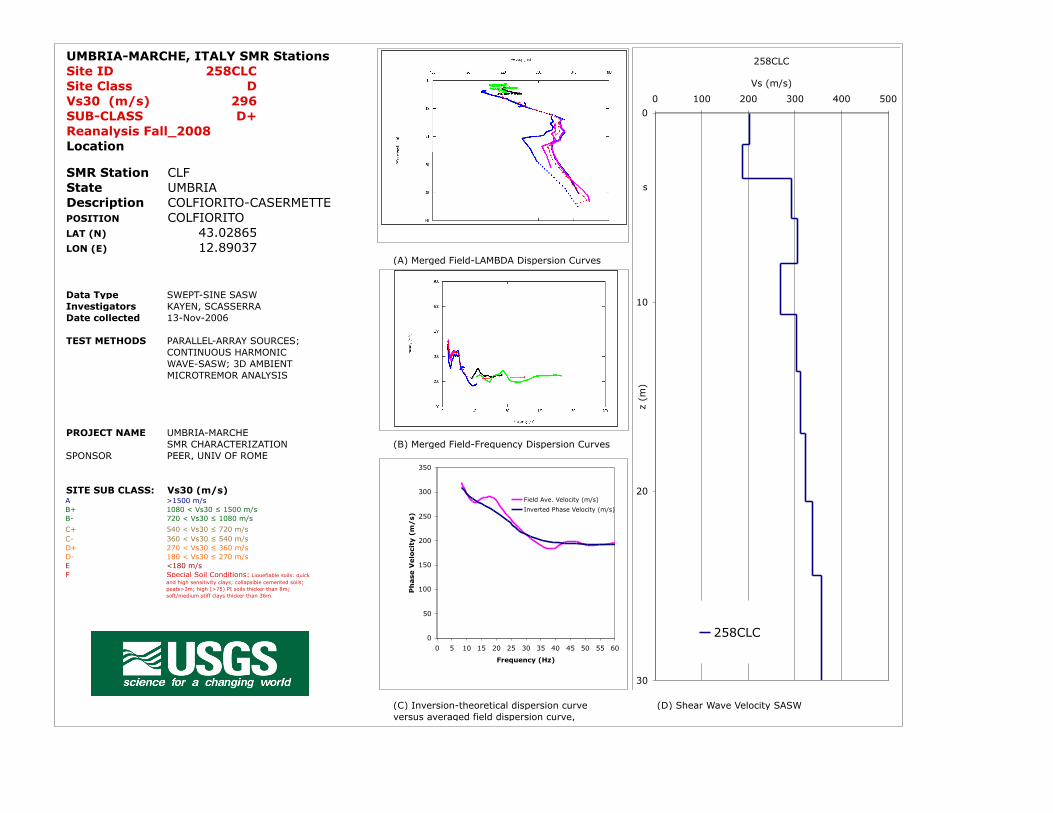
UMBRIA-MARCHE, ITALY SMR StationsSite ID 258CLCSite Class DVs30 (m/s) 296SUB-CLASS D+
Reanalysis Fall_2008Location
SMR Station CLF
State UMBRIADescription COLFIORITO-CASERMETTEPOSITION COLFIORITOLAT (N) 43.02865LON (E) 12.89037
(A) Merged Field-LAMBDA Dispersion Curves
Data Type SWEPT-SINE SASWInvestigators KAYEN, SCASSERRADate collected 13-Nov-2006
TEST METHODS PARALLEL-ARRAY SOURCES;CONTINUOUS HARMONICWAVE-SASW; 3D AMBIENT MICROTREMOR ANALYSIS
PROJECT NAME UMBRIA-MARCHE SMR CHARACTERIZATION (B) Merged Field-Frequency Dispersion Curves
SPONSOR PEER, UNIV OF ROME
SITE SUB CLASS: Vs30 (m/s)A >1500 m/sB+ 1080 < Vs30 ≤ 1500 m/sB- 720 < Vs30 ≤ 1080 m/s
C+ 540 < Vs30 ≤ 720 m/sC- 360 < Vs30 ≤ 540 m/sD+ 270 < Vs30 ≤ 360 m/sD- 180 < Vs30 ≤ 270 m/sE <180 m/sF Special Soil Conditions: Liquefiable soils; quick
and high sensitivity clays; collapsible cemented soils; peats>3m; high (>75) PI soils thicker than 8m; soft/medium stiff clays thicker than 36m.
(C) Inversion-theoretical dispersion curve versus averaged field dispersion curve,
(D) Shear Wave Velocity SASW
258CLC
0
10
20
30
0 100 200 300 400 500
Vs (m/s)
z (m
)258CLC
s
0
50
100
150
200
250
300
350
0 5 10 15 20 25 30 35 40 45 50 55 60
Frequency (Hz)
Ph
ase
Velo
city
(m
/s)
Field Ave. Velocity (m/s)
Inverted Phase Velocity (m/s)
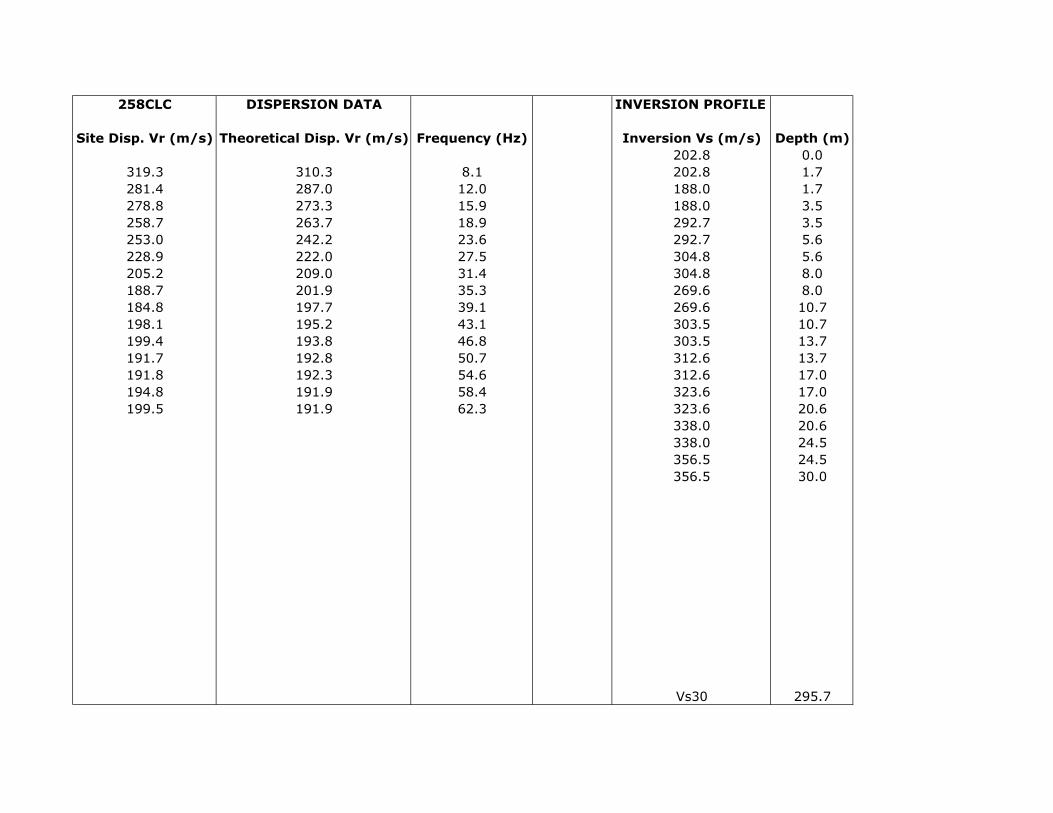
258CLC DISPERSION DATA INVERSION PROFILE
Site Disp. Vr (m/s) Theoretical Disp. Vr (m/s) Frequency (Hz) Inversion Vs (m/s) Depth (m)202.8 0.0
319.3 310.3 8.1 202.8 1.7281.4 287.0 12.0 188.0 1.7278.8 273.3 15.9 188.0 3.5258.7 263.7 18.9 292.7 3.5253.0 242.2 23.6 292.7 5.6228.9 222.0 27.5 304.8 5.6205.2 209.0 31.4 304.8 8.0188.7 201.9 35.3 269.6 8.0184.8 197.7 39.1 269.6 10.7198.1 195.2 43.1 303.5 10.7199.4 193.8 46.8 303.5 13.7191.7 192.8 50.7 312.6 13.7191.8 192.3 54.6 312.6 17.0194.8 191.9 58.4 323.6 17.0199.5 191.9 62.3 323.6 20.6
338.0 20.6338.0 24.5356.5 24.5356.5 30.0
Vs30 295.7
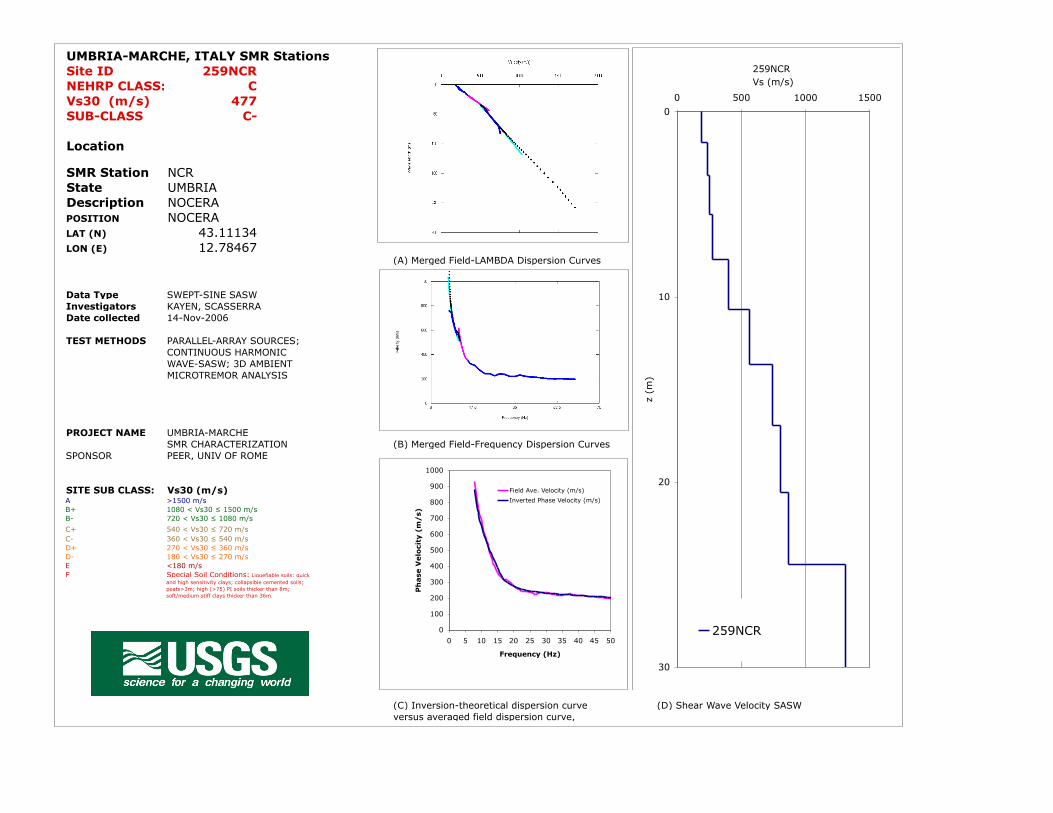
UMBRIA-MARCHE, ITALY SMR StationsSite ID 259NCRNEHRP CLASS: CVs30 (m/s) 477SUB-CLASS C-
Location
SMR Station NCR
State UMBRIADescription NOCERAPOSITION NOCERALAT (N) 43.11134LON (E) 12.78467
(A) Merged Field-LAMBDA Dispersion Curves
Data Type SWEPT-SINE SASWInvestigators KAYEN, SCASSERRADate collected 14-Nov-2006
TEST METHODS PARALLEL-ARRAY SOURCES;CONTINUOUS HARMONICWAVE-SASW; 3D AMBIENT MICROTREMOR ANALYSIS
PROJECT NAME UMBRIA-MARCHE SMR CHARACTERIZATION (B) Merged Field-Frequency Dispersion Curves
SPONSOR PEER, UNIV OF ROME
SITE SUB CLASS: Vs30 (m/s)A >1500 m/sB+ 1080 < Vs30 ≤ 1500 m/sB- 720 < Vs30 ≤ 1080 m/s
C+ 540 < Vs30 ≤ 720 m/sC- 360 < Vs30 ≤ 540 m/sD+ 270 < Vs30 ≤ 360 m/sD- 180 < Vs30 ≤ 270 m/sE <180 m/sF Special Soil Conditions: Liquefiable soils; quick
and high sensitivity clays; collapsible cemented soils; peats>3m; high (>75) PI soils thicker than 8m; soft/medium stiff clays thicker than 36m.
(C) Inversion-theoretical dispersion curve versus averaged field dispersion curve,
(D) Shear Wave Velocity SASW
259NCR
0
10
20
30
0 500 1000 1500
Vs (m/s)
z (m
)
259NCR0
100
200
300
400
500
600
700
800
900
1000
0 5 10 15 20 25 30 35 40 45 50
Frequency (Hz)
Ph
ase
Velo
city
(m
/s)
Field Ave. Velocity (m/s)
Inverted Phase Velocity (m/s)

259NCR DISPERSION DATA INVERSION PROFILE
Site Disp. Vr (m/s) Theoretical Disp. Vr (m/s) Frequency (Hz) Inversion Vs (m/s) Depth (m)192.4 0.0
929.0 885.2 7.8 192.4 1.7764.1 717.3 9.1 239.1 1.7632.7 609.3 10.5 239.1 3.5550.7 539.5 11.8 253.6 3.5425.8 462.0 13.5 253.6 5.6364.5 396.7 14.8 275.9 5.6327.3 332.8 16.4 275.9 8.0311.8 299.5 17.9 398.8 8.0287.2 279.6 19.4 398.8 10.7264.2 267.1 20.9 564.7 10.7246.6 258.1 22.3 564.7 13.7242.8 251.2 23.8 738.1 13.7235.9 245.7 25.3 738.1 17.0228.0 241.3 26.8 805.3 17.0237.4 237.7 28.3 805.3 20.6238.8 234.6 29.7 868.1 20.6232.3 231.7 31.2 868.1 24.5221.2 229.1 32.7 1309.1 24.5218.8 226.6 34.2 1309.1 30.0222.6 224.5 35.6229.5 222.4 37.1223.9 220.3 38.6218.8 218.3 40.1215.8 216.4 41.6213.4 214.5 43.1211.3 212.8 44.5208.2 211.2 45.9203.7 209.5 47.4202.1 207.9 48.9200.9 206.4 50.4200.3 205.0 51.9201.4 203.7 53.3 Vs30 477.4
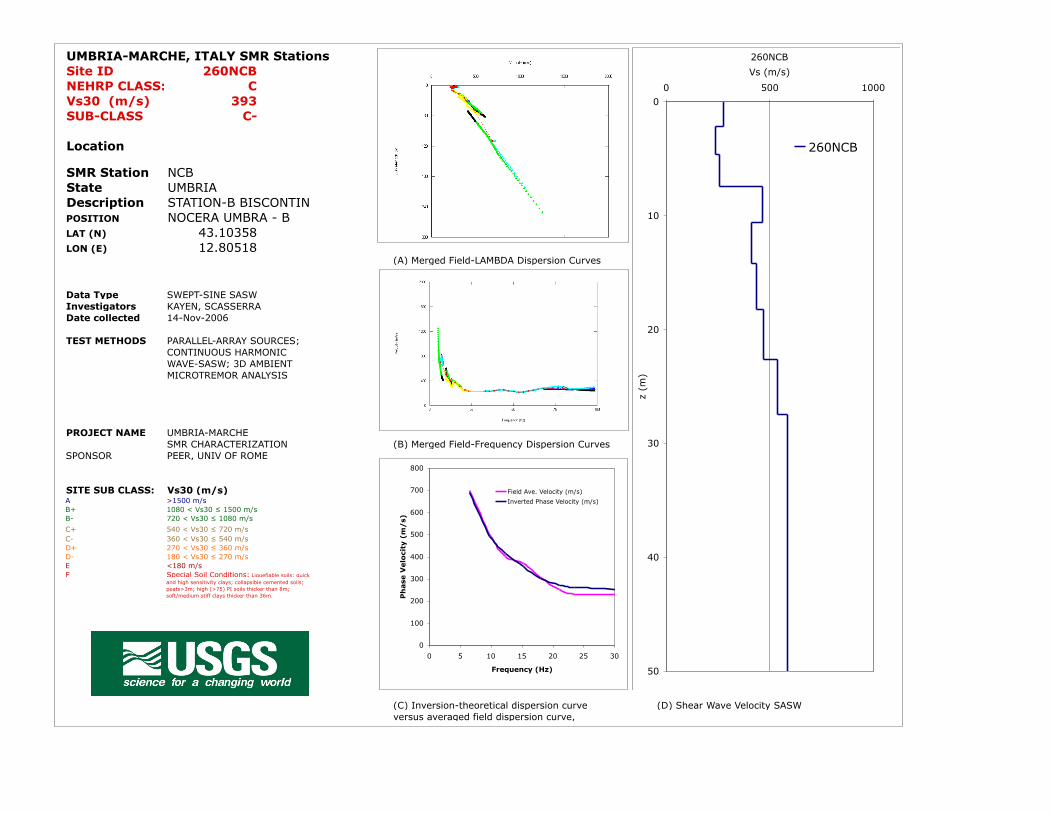
UMBRIA-MARCHE, ITALY SMR StationsSite ID 260NCBNEHRP CLASS: CVs30 (m/s) 393SUB-CLASS C-
Location
SMR Station NCB
State UMBRIADescription STATION-B BISCONTINPOSITION NOCERA UMBRA - BLAT (N) 43.10358LON (E) 12.80518
(A) Merged Field-LAMBDA Dispersion Curves
Data Type SWEPT-SINE SASWInvestigators KAYEN, SCASSERRADate collected 14-Nov-2006
TEST METHODS PARALLEL-ARRAY SOURCES;CONTINUOUS HARMONICWAVE-SASW; 3D AMBIENT MICROTREMOR ANALYSIS
PROJECT NAME UMBRIA-MARCHE SMR CHARACTERIZATION (B) Merged Field-Frequency Dispersion Curves
SPONSOR PEER, UNIV OF ROME
SITE SUB CLASS: Vs30 (m/s)A >1500 m/sB+ 1080 < Vs30 ≤ 1500 m/sB- 720 < Vs30 ≤ 1080 m/s
C+ 540 < Vs30 ≤ 720 m/sC- 360 < Vs30 ≤ 540 m/sD+ 270 < Vs30 ≤ 360 m/sD- 180 < Vs30 ≤ 270 m/sE <180 m/sF Special Soil Conditions: Liquefiable soils; quick
and high sensitivity clays; collapsible cemented soils; peats>3m; high (>75) PI soils thicker than 8m; soft/medium stiff clays thicker than 36m.
(C) Inversion-theoretical dispersion curve versus averaged field dispersion curve,
(D) Shear Wave Velocity SASW
260NCB
0
10
20
30
40
50
0 500 1000
Vs (m/s)
z (m
)
260NCB
0
100
200
300
400
500
600
700
800
0 5 10 15 20 25 30
Frequency (Hz)
Ph
ase
Velo
city
(m
/s)
Field Ave. Velocity (m/s)
Inverted Phase Velocity (m/s)

260NCB DISPERSION DATA INVERSION PROFILE
Site Disp. Vr (m/s) Theoretical Disp. Vr (m/s) Frequency (Hz) Inversion Vs (m/s) Depth (m)276.1 0.0
701.9 690.3 6.5 276.1 2.2501.5 494.0 9.8 238.3 2.2402.6 418.2 12.3 238.3 4.6373.7 356.2 15.2 258.5 4.6309.1 303.6 18.0 258.5 7.4252.5 274.3 21.1 464.2 7.4234.1 263.7 23.4 464.2 10.6234.2 250.7 33.3 414.0 10.6232.6 250.1 35.6 414.0 14.2239.2 249.7 38.5 435.6 14.2251.3 249.7 41.5 435.6 18.2251.9 249.8 44.3 467.6 18.2236.0 250.1 47.3 467.6 22.6228.8 250.4 50.3 538.3 22.6214.5 250.7 53.1 538.3 27.4220.6 251.1 56.0 584.7 27.4235.1 251.4 59.0 584.7 32.6247.1 251.7 61.8 584.7 50.0267.1 252.0 64.8275.7 252.2 68.0275.0 252.4 70.6281.0 252.5 73.6288.4 252.6 76.7284.3 252.7 79.3269.8 252.7 82.3264.1 252.6 85.3263.2 252.5 88.1263.4 252.3 91.1264.7 252.1 94.0266.9 252.1 96.8
Vs30 392.6
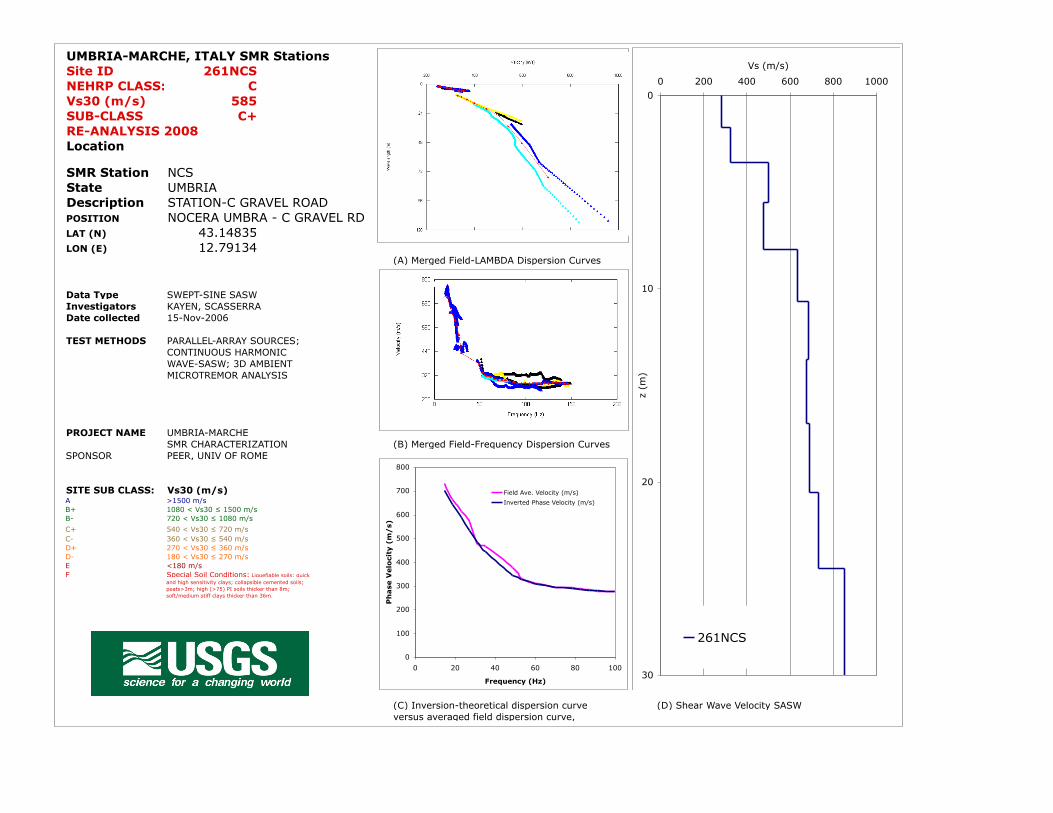
UMBRIA-MARCHE, ITALY SMR StationsSite ID 261NCSNEHRP CLASS: CVs30 (m/s) 585SUB-CLASS C+
RE-ANALYSIS 2008Location
SMR Station NCS
State UMBRIADescription STATION-C GRAVEL ROADPOSITION NOCERA UMBRA - C GRAVEL RDLAT (N) 43.14835LON (E) 12.79134
(A) Merged Field-LAMBDA Dispersion Curves
Data Type SWEPT-SINE SASWInvestigators KAYEN, SCASSERRADate collected 15-Nov-2006
TEST METHODS PARALLEL-ARRAY SOURCES;CONTINUOUS HARMONICWAVE-SASW; 3D AMBIENT MICROTREMOR ANALYSIS
PROJECT NAME UMBRIA-MARCHE SMR CHARACTERIZATION (B) Merged Field-Frequency Dispersion Curves
SPONSOR PEER, UNIV OF ROME
SITE SUB CLASS: Vs30 (m/s)A >1500 m/sB+ 1080 < Vs30 ≤ 1500 m/sB- 720 < Vs30 ≤ 1080 m/s
C+ 540 < Vs30 ≤ 720 m/sC- 360 < Vs30 ≤ 540 m/sD+ 270 < Vs30 ≤ 360 m/sD- 180 < Vs30 ≤ 270 m/sE <180 m/sF Special Soil Conditions: Liquefiable soils; quick
and high sensitivity clays; collapsible cemented soils; peats>3m; high (>75) PI soils thicker than 8m; soft/medium stiff clays thicker than 36m.
(C) Inversion-theoretical dispersion curve versus averaged field dispersion curve,
(D) Shear Wave Velocity SASW
0
10
20
30
0 200 400 600 800 1000
Vs (m/s)
z (m
)261NCS
0
100
200
300
400
500
600
700
800
0 20 40 60 80 100
Frequency (Hz)
Ph
ase
Velo
city
(m
/s)
Field Ave. Velocity (m/s)
Inverted Phase Velocity (m/s)
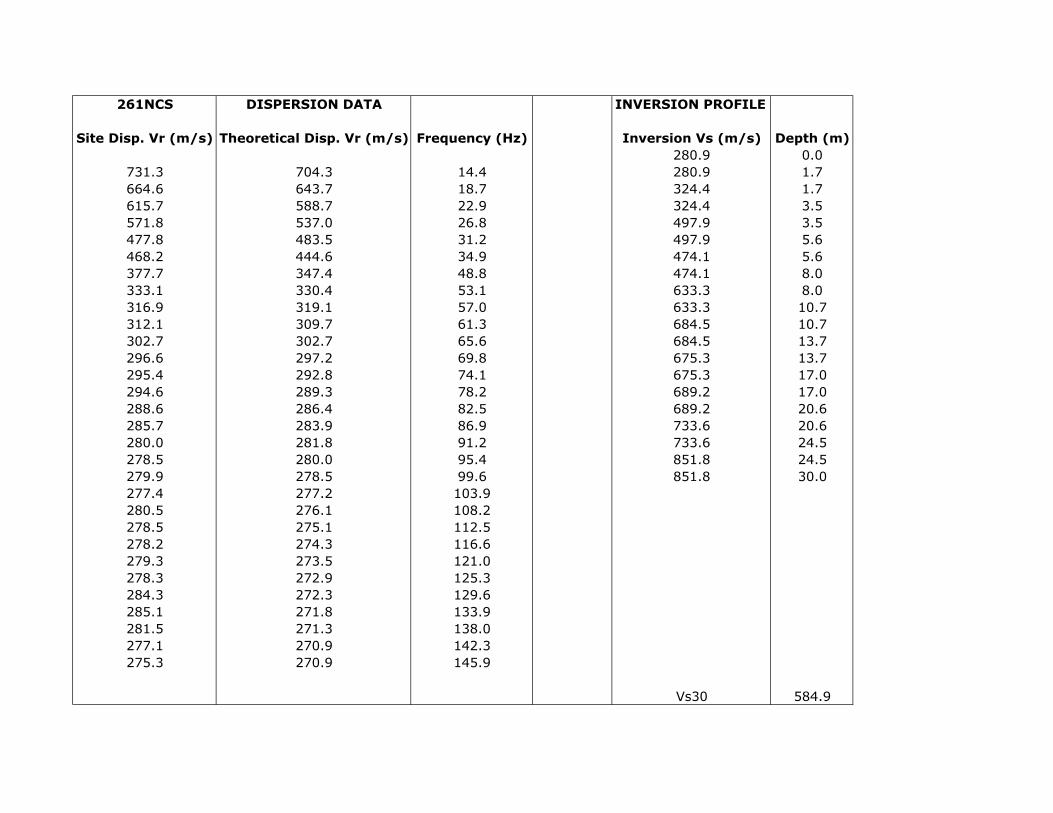
261NCS DISPERSION DATA INVERSION PROFILE
Site Disp. Vr (m/s) Theoretical Disp. Vr (m/s) Frequency (Hz) Inversion Vs (m/s) Depth (m)280.9 0.0
731.3 704.3 14.4 280.9 1.7664.6 643.7 18.7 324.4 1.7615.7 588.7 22.9 324.4 3.5571.8 537.0 26.8 497.9 3.5477.8 483.5 31.2 497.9 5.6468.2 444.6 34.9 474.1 5.6377.7 347.4 48.8 474.1 8.0333.1 330.4 53.1 633.3 8.0316.9 319.1 57.0 633.3 10.7312.1 309.7 61.3 684.5 10.7302.7 302.7 65.6 684.5 13.7296.6 297.2 69.8 675.3 13.7295.4 292.8 74.1 675.3 17.0294.6 289.3 78.2 689.2 17.0288.6 286.4 82.5 689.2 20.6285.7 283.9 86.9 733.6 20.6280.0 281.8 91.2 733.6 24.5278.5 280.0 95.4 851.8 24.5279.9 278.5 99.6 851.8 30.0277.4 277.2 103.9280.5 276.1 108.2278.5 275.1 112.5278.2 274.3 116.6279.3 273.5 121.0278.3 272.9 125.3284.3 272.3 129.6285.1 271.8 133.9281.5 271.3 138.0277.1 270.9 142.3275.3 270.9 145.9
Vs30 584.9
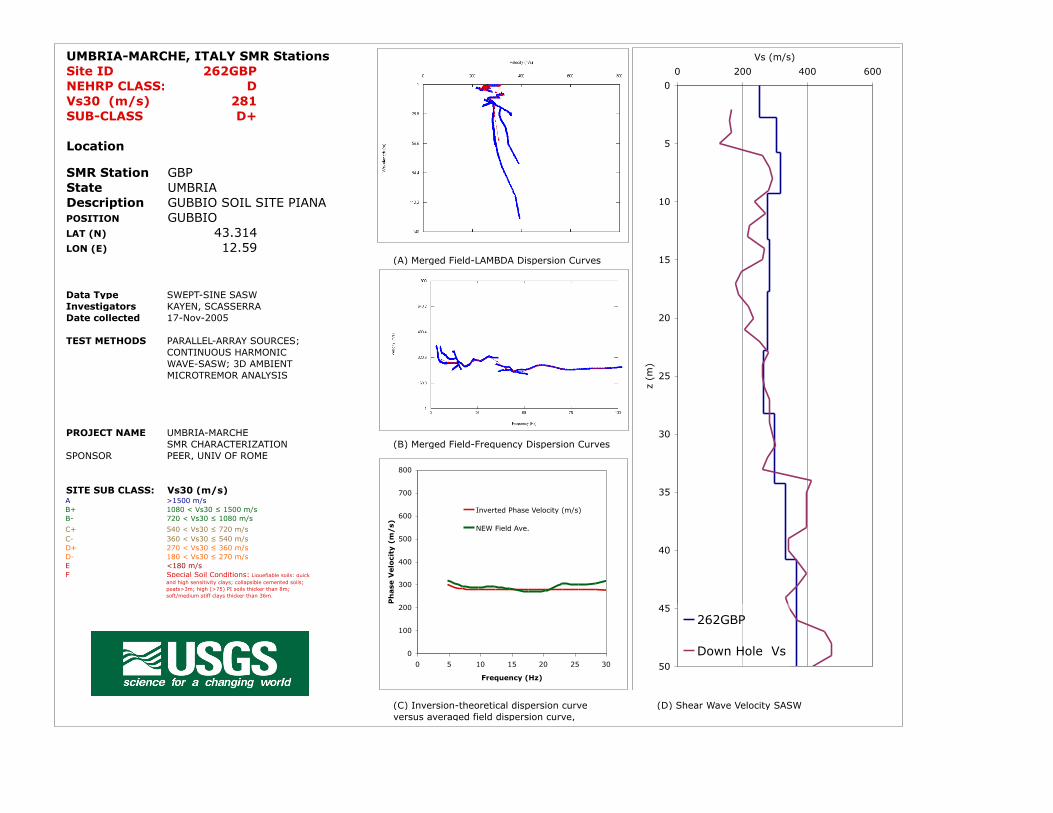
UMBRIA-MARCHE, ITALY SMR StationsSite ID 262GBPNEHRP CLASS: DVs30 (m/s) 281SUB-CLASS D+
Location
SMR Station GBP
State UMBRIADescription GUBBIO SOIL SITE PIANAPOSITION GUBBIOLAT (N) 43.314LON (E) 12.59
(A) Merged Field-LAMBDA Dispersion Curves
Data Type SWEPT-SINE SASWInvestigators KAYEN, SCASSERRADate collected 17-Nov-2005
TEST METHODS PARALLEL-ARRAY SOURCES;CONTINUOUS HARMONICWAVE-SASW; 3D AMBIENT MICROTREMOR ANALYSIS
PROJECT NAME UMBRIA-MARCHE SMR CHARACTERIZATION (B) Merged Field-Frequency Dispersion Curves
SPONSOR PEER, UNIV OF ROME
SITE SUB CLASS: Vs30 (m/s)A >1500 m/sB+ 1080 < Vs30 ≤ 1500 m/sB- 720 < Vs30 ≤ 1080 m/s
C+ 540 < Vs30 ≤ 720 m/sC- 360 < Vs30 ≤ 540 m/sD+ 270 < Vs30 ≤ 360 m/sD- 180 < Vs30 ≤ 270 m/sE <180 m/sF Special Soil Conditions: Liquefiable soils; quick
and high sensitivity clays; collapsible cemented soils; peats>3m; high (>75) PI soils thicker than 8m; soft/medium stiff clays thicker than 36m.
(C) Inversion-theoretical dispersion curve versus averaged field dispersion curve,
(D) Shear Wave Velocity SASW
0
5
10
15
20
25
30
35
40
45
50
0 200 400 600
Vs (m/s)
z (m
)
262GBP
Down Hole Vs0
100
200
300
400
500
600
700
800
0 5 10 15 20 25 30
Frequency (Hz)
Ph
ase
Velo
city
(m
/s)
Inverted Phase Velocity (m/s)
NEW Field Ave.
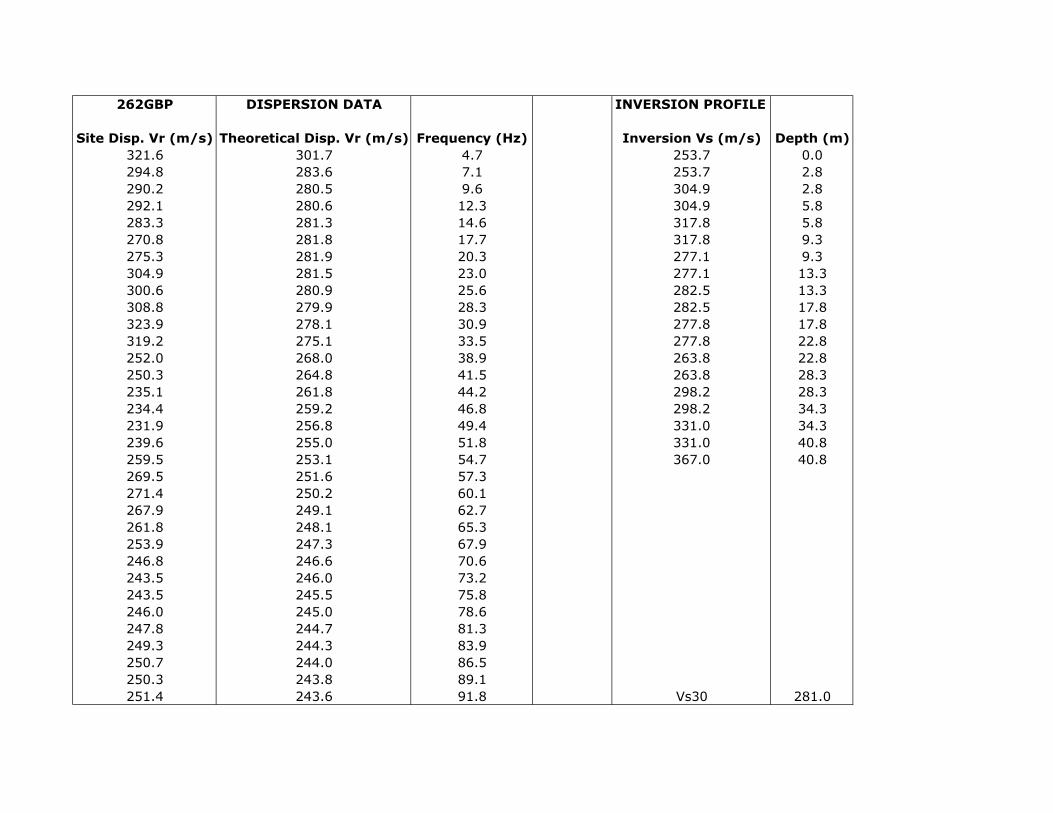
262GBP DISPERSION DATA INVERSION PROFILE
Site Disp. Vr (m/s) Theoretical Disp. Vr (m/s) Frequency (Hz) Inversion Vs (m/s) Depth (m)321.6 301.7 4.7 253.7 0.0294.8 283.6 7.1 253.7 2.8290.2 280.5 9.6 304.9 2.8292.1 280.6 12.3 304.9 5.8283.3 281.3 14.6 317.8 5.8270.8 281.8 17.7 317.8 9.3275.3 281.9 20.3 277.1 9.3304.9 281.5 23.0 277.1 13.3300.6 280.9 25.6 282.5 13.3308.8 279.9 28.3 282.5 17.8323.9 278.1 30.9 277.8 17.8319.2 275.1 33.5 277.8 22.8252.0 268.0 38.9 263.8 22.8250.3 264.8 41.5 263.8 28.3235.1 261.8 44.2 298.2 28.3234.4 259.2 46.8 298.2 34.3231.9 256.8 49.4 331.0 34.3239.6 255.0 51.8 331.0 40.8259.5 253.1 54.7 367.0 40.8269.5 251.6 57.3271.4 250.2 60.1267.9 249.1 62.7261.8 248.1 65.3253.9 247.3 67.9246.8 246.6 70.6243.5 246.0 73.2243.5 245.5 75.8246.0 245.0 78.6247.8 244.7 81.3249.3 244.3 83.9250.7 244.0 86.5250.3 243.8 89.1251.4 243.6 91.8 Vs30 281.0
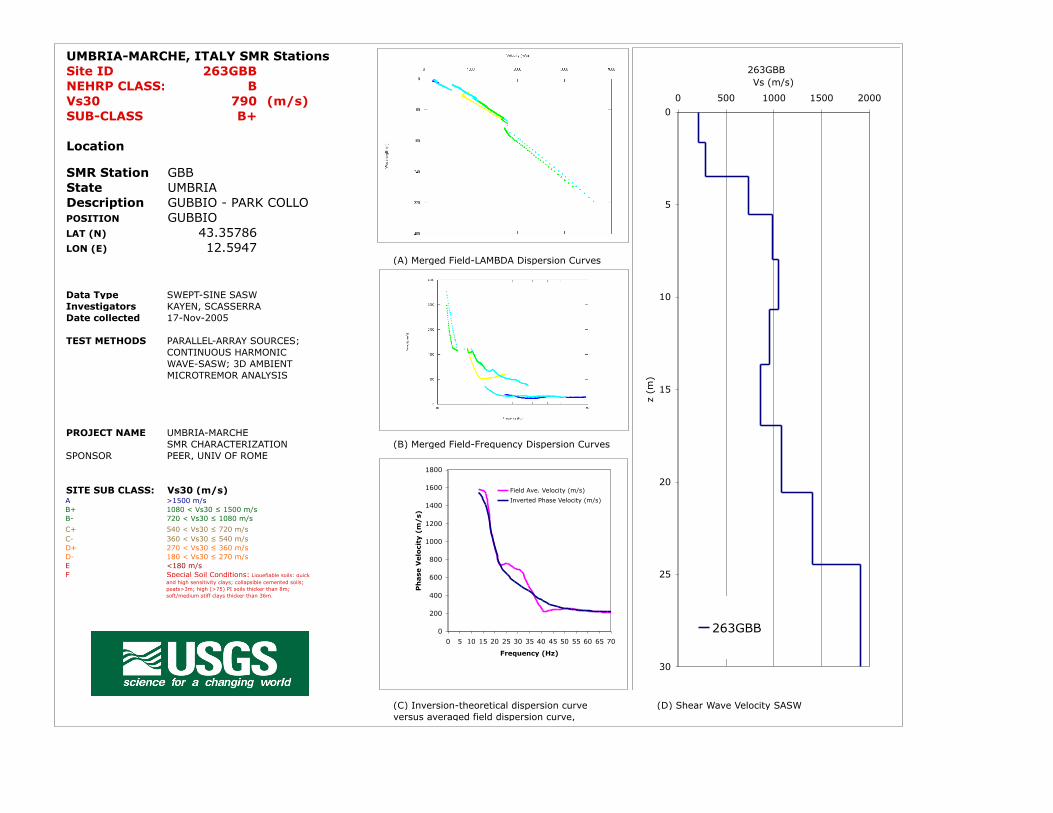
UMBRIA-MARCHE, ITALY SMR StationsSite ID 263GBBNEHRP CLASS: BVs30 790 (m/s)SUB-CLASS B+
Location
SMR Station GBB
State UMBRIADescription GUBBIO - PARK COLLOPOSITION GUBBIOLAT (N) 43.35786LON (E) 12.5947
(A) Merged Field-LAMBDA Dispersion Curves
Data Type SWEPT-SINE SASWInvestigators KAYEN, SCASSERRADate collected 17-Nov-2005
TEST METHODS PARALLEL-ARRAY SOURCES;CONTINUOUS HARMONICWAVE-SASW; 3D AMBIENT MICROTREMOR ANALYSIS
PROJECT NAME UMBRIA-MARCHE SMR CHARACTERIZATION (B) Merged Field-Frequency Dispersion Curves
SPONSOR PEER, UNIV OF ROME
SITE SUB CLASS: Vs30 (m/s)A >1500 m/sB+ 1080 < Vs30 ≤ 1500 m/sB- 720 < Vs30 ≤ 1080 m/s
C+ 540 < Vs30 ≤ 720 m/sC- 360 < Vs30 ≤ 540 m/sD+ 270 < Vs30 ≤ 360 m/sD- 180 < Vs30 ≤ 270 m/sE <180 m/sF Special Soil Conditions: Liquefiable soils; quick
and high sensitivity clays; collapsible cemented soils; peats>3m; high (>75) PI soils thicker than 8m; soft/medium stiff clays thicker than 36m.
(C) Inversion-theoretical dispersion curve versus averaged field dispersion curve,
(D) Shear Wave Velocity SASW
263GBB
0
5
10
15
20
25
30
0 500 1000 1500 2000
Vs (m/s)
z (m
)
263GBB0
200
400
600
800
1000
1200
1400
1600
1800
0 5 10 15 20 25 30 35 40 45 50 55 60 65 70
Frequency (Hz)
Ph
ase
Velo
city
(m
/s)
Field Ave. Velocity (m/s)
Inverted Phase Velocity (m/s)
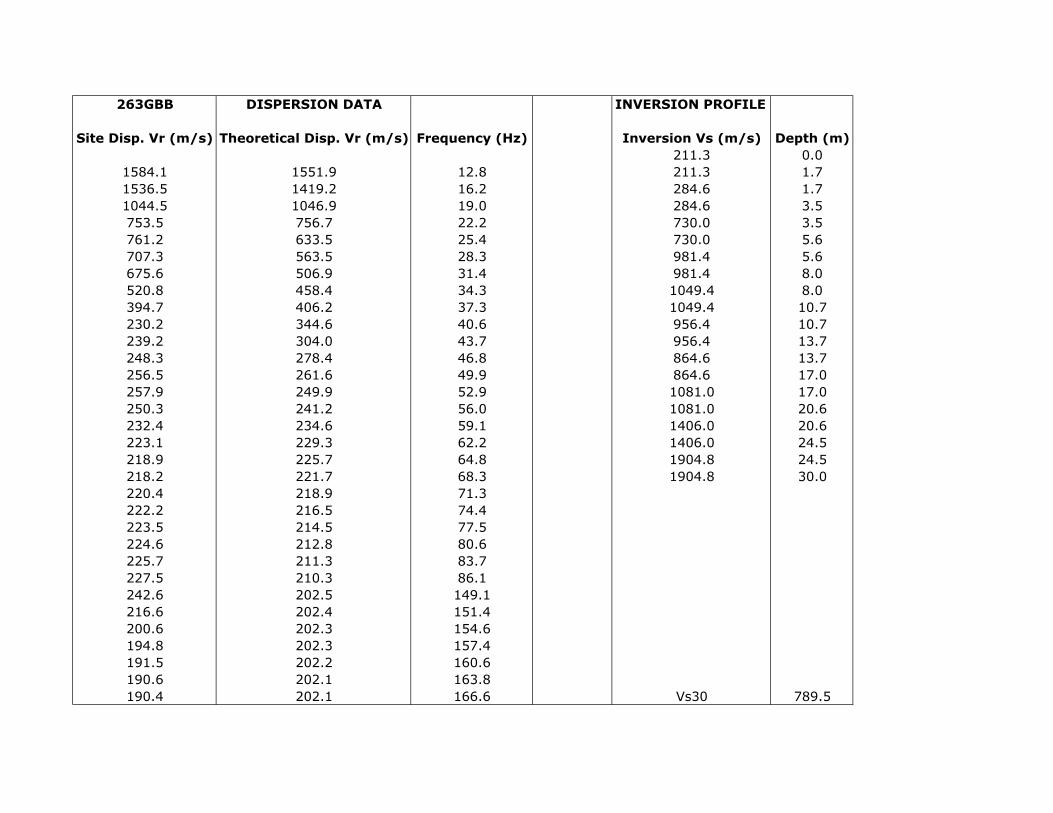
263GBB DISPERSION DATA INVERSION PROFILE
Site Disp. Vr (m/s) Theoretical Disp. Vr (m/s) Frequency (Hz) Inversion Vs (m/s) Depth (m)211.3 0.0
1584.1 1551.9 12.8 211.3 1.71536.5 1419.2 16.2 284.6 1.71044.5 1046.9 19.0 284.6 3.5753.5 756.7 22.2 730.0 3.5761.2 633.5 25.4 730.0 5.6707.3 563.5 28.3 981.4 5.6675.6 506.9 31.4 981.4 8.0520.8 458.4 34.3 1049.4 8.0394.7 406.2 37.3 1049.4 10.7230.2 344.6 40.6 956.4 10.7239.2 304.0 43.7 956.4 13.7248.3 278.4 46.8 864.6 13.7256.5 261.6 49.9 864.6 17.0257.9 249.9 52.9 1081.0 17.0250.3 241.2 56.0 1081.0 20.6232.4 234.6 59.1 1406.0 20.6223.1 229.3 62.2 1406.0 24.5218.9 225.7 64.8 1904.8 24.5218.2 221.7 68.3 1904.8 30.0220.4 218.9 71.3222.2 216.5 74.4223.5 214.5 77.5224.6 212.8 80.6225.7 211.3 83.7227.5 210.3 86.1242.6 202.5 149.1216.6 202.4 151.4200.6 202.3 154.6194.8 202.3 157.4191.5 202.2 160.6190.6 202.1 163.8190.4 202.1 166.6 Vs30 789.5
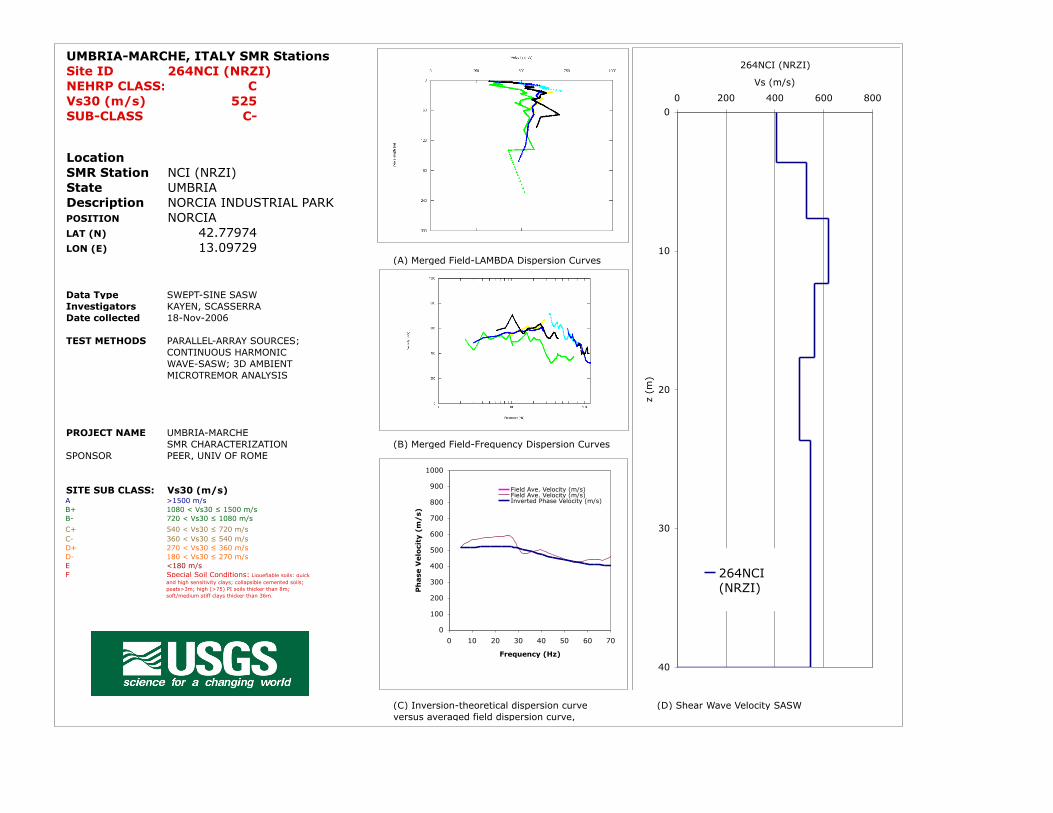
UMBRIA-MARCHE, ITALY SMR StationsSite ID 264NCI (NRZI)NEHRP CLASS: CVs30 (m/s) 525SUB-CLASS C-
LocationSMR Station NCI (NRZI)
State UMBRIADescription NORCIA INDUSTRIAL PARKPOSITION NORCIALAT (N) 42.77974LON (E) 13.09729
(A) Merged Field-LAMBDA Dispersion Curves
Data Type SWEPT-SINE SASWInvestigators KAYEN, SCASSERRADate collected 18-Nov-2006
TEST METHODS PARALLEL-ARRAY SOURCES;CONTINUOUS HARMONICWAVE-SASW; 3D AMBIENT MICROTREMOR ANALYSIS
PROJECT NAME UMBRIA-MARCHE SMR CHARACTERIZATION (B) Merged Field-Frequency Dispersion Curves
SPONSOR PEER, UNIV OF ROME
SITE SUB CLASS: Vs30 (m/s)A >1500 m/sB+ 1080 < Vs30 ≤ 1500 m/sB- 720 < Vs30 ≤ 1080 m/s
C+ 540 < Vs30 ≤ 720 m/sC- 360 < Vs30 ≤ 540 m/sD+ 270 < Vs30 ≤ 360 m/sD- 180 < Vs30 ≤ 270 m/sE <180 m/sF Special Soil Conditions: Liquefiable soils; quick
and high sensitivity clays; collapsible cemented soils; peats>3m; high (>75) PI soils thicker than 8m; soft/medium stiff clays thicker than 36m.
(C) Inversion-theoretical dispersion curve versus averaged field dispersion curve,
(D) Shear Wave Velocity SASW
264NCI (NRZI)
0
10
20
30
40
0 200 400 600 800
Vs (m/s)
z (m
)
264NCI(NRZI)
0
100
200
300
400
500
600
700
800
900
1000
0 10 20 30 40 50 60 70
Frequency (Hz)
Ph
ase
Velo
city
(m
/s)
Field Ave. Velocity (m/s)Field Ave. Velocity (m/s)Inverted Phase Velocity (m/s)
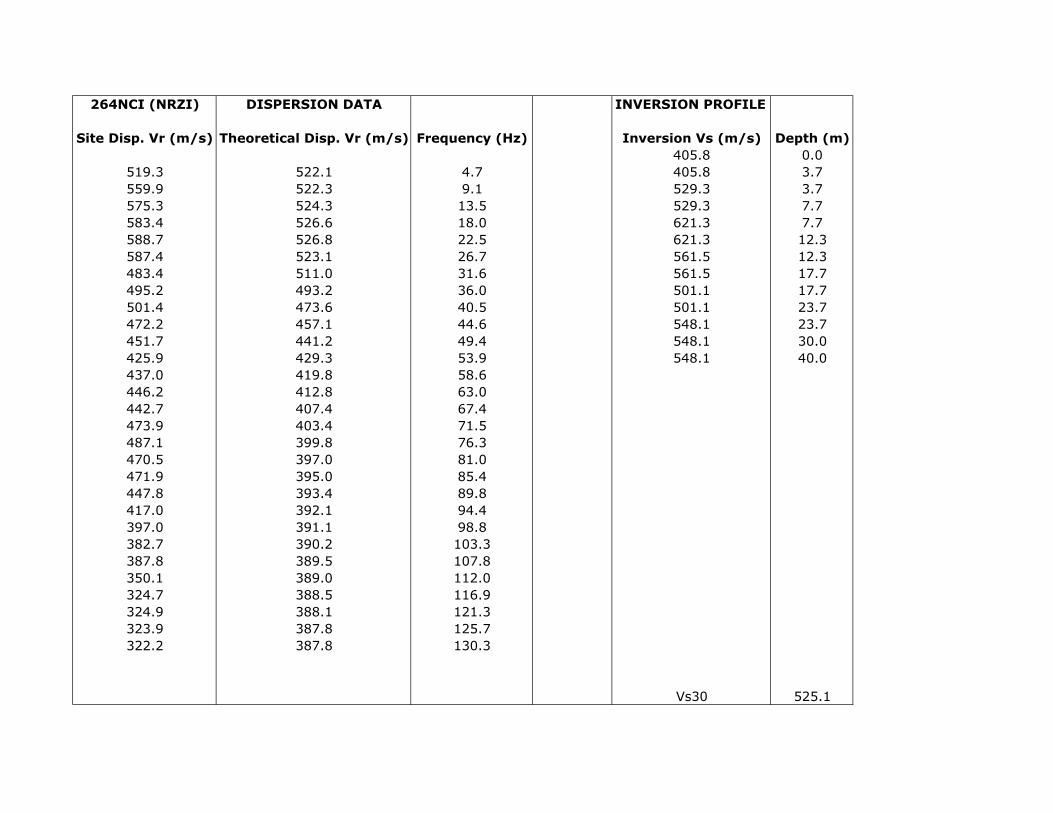
264NCI (NRZI) DISPERSION DATA INVERSION PROFILE
Site Disp. Vr (m/s) Theoretical Disp. Vr (m/s) Frequency (Hz) Inversion Vs (m/s) Depth (m)405.8 0.0
519.3 522.1 4.7 405.8 3.7559.9 522.3 9.1 529.3 3.7575.3 524.3 13.5 529.3 7.7583.4 526.6 18.0 621.3 7.7588.7 526.8 22.5 621.3 12.3587.4 523.1 26.7 561.5 12.3483.4 511.0 31.6 561.5 17.7495.2 493.2 36.0 501.1 17.7501.4 473.6 40.5 501.1 23.7472.2 457.1 44.6 548.1 23.7451.7 441.2 49.4 548.1 30.0425.9 429.3 53.9 548.1 40.0437.0 419.8 58.6446.2 412.8 63.0442.7 407.4 67.4473.9 403.4 71.5487.1 399.8 76.3470.5 397.0 81.0471.9 395.0 85.4447.8 393.4 89.8417.0 392.1 94.4397.0 391.1 98.8382.7 390.2 103.3387.8 389.5 107.8350.1 389.0 112.0324.7 388.5 116.9324.9 388.1 121.3323.9 387.8 125.7322.2 387.8 130.3
Vs30 525.1
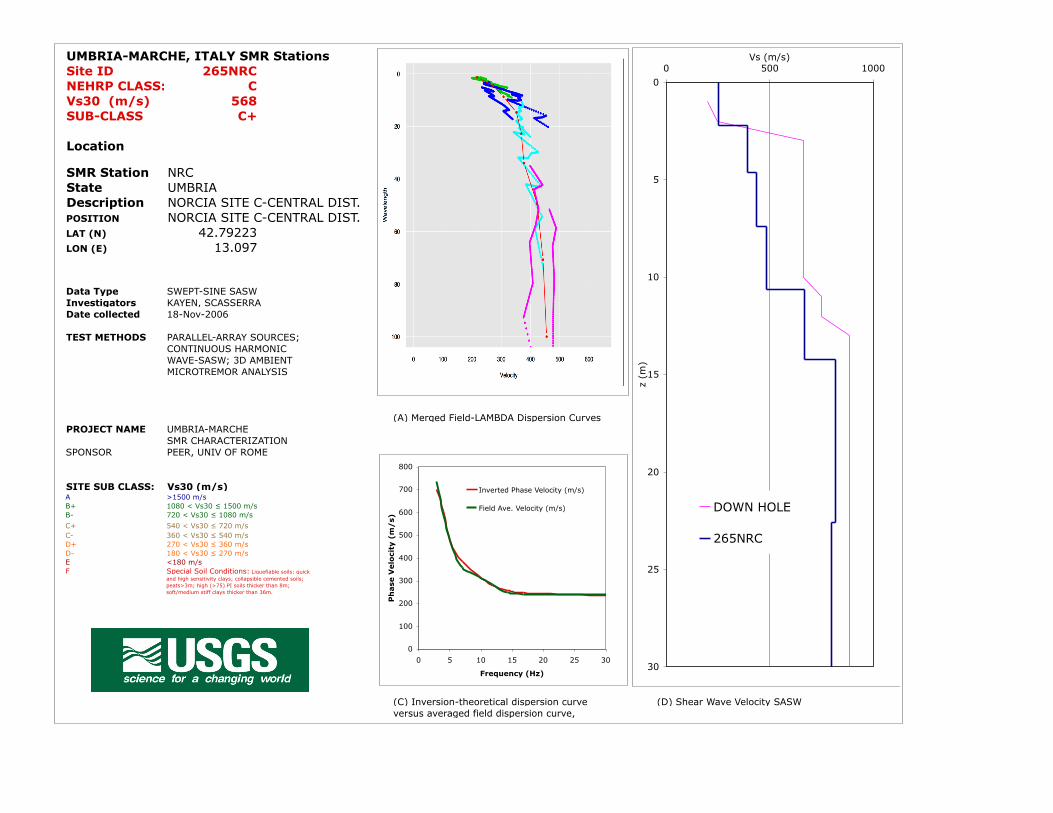
UMBRIA-MARCHE, ITALY SMR StationsSite ID 265NRCNEHRP CLASS: CVs30 (m/s) 568SUB-CLASS C+
Location
SMR Station NRC
State UMBRIADescription NORCIA SITE C-CENTRAL DIST.POSITION NORCIA SITE C-CENTRAL DIST.LAT (N) 42.79223LON (E) 13.097
Data Type SWEPT-SINE SASWInvestigators KAYEN, SCASSERRADate collected 18-Nov-2006
TEST METHODS PARALLEL-ARRAY SOURCES;CONTINUOUS HARMONICWAVE-SASW; 3D AMBIENT MICROTREMOR ANALYSIS
(A) Merged Field-LAMBDA Dispersion CurvesPROJECT NAME UMBRIA-MARCHE
SMR CHARACTERIZATIONSPONSOR PEER, UNIV OF ROME
SITE SUB CLASS: Vs30 (m/s)A >1500 m/sB+ 1080 < Vs30 ≤ 1500 m/sB- 720 < Vs30 ≤ 1080 m/s
C+ 540 < Vs30 ≤ 720 m/sC- 360 < Vs30 ≤ 540 m/sD+ 270 < Vs30 ≤ 360 m/sD- 180 < Vs30 ≤ 270 m/sE <180 m/sF Special Soil Conditions: Liquefiable soils; quick
and high sensitivity clays; collapsible cemented soils; peats>3m; high (>75) PI soils thicker than 8m; soft/medium stiff clays thicker than 36m.
(C) Inversion-theoretical dispersion curve versus averaged field dispersion curve,
(D) Shear Wave Velocity SASW
0
5
10
15
20
25
30
0 500 1000Vs (m/s)
z (m
)
DOWN HOLE
265NRC
0
100
200
300
400
500
600
700
800
0 5 10 15 20 25 30
Frequency (Hz)
Ph
ase
Velo
city
(m
/s)
Inverted Phase Velocity (m/s)
Field Ave. Velocity (m/s)

265NRC DISPERSION DATA INVERSION PROFILE
Site Disp. Vr (m/s) Theoretical Disp. Vr (m/s) Frequency (Hz) Inversion Vs (m/s) Depth (m)251.5 0.0
735.0 704.6 2.8 251.5 2.2590.0 605.4 4.0 390.2 2.2471.4 473.3 5.0 390.2 4.6360.5 385.2 7.0 437.8 4.6321.2 324.7 9.5 437.8 7.4283.7 282.5 11.7 483.9 7.4248.9 258.6 14.2 483.9 10.6243.0 249.9 16.8 669.8 10.6233.8 213.0 55.3 669.8 14.2233.3 210.3 57.8 817.9 14.2233.7 208.3 60.1 817.9 18.2226.6 206.7 62.3 819.5 18.2216.2 205.2 64.8 819.5 22.6209.8 204.0 67.3 800.1 22.6209.0 203.0 69.7 800.1 27.4215.1 202.1 72.2 799.9 27.4218.1 201.4 74.6 799.9 32.6216.9 200.8 77.1 799.9 32.6213.6 200.3 79.5210.7 199.9 81.8208.5 199.6 84.1207.7 199.2 86.5204.9 199.0 88.9202.4 198.7 91.4200.5 257.4 93.8198.9 198.0 96.3197.5 197.2 98.8196.4 196.5 101.0191.2 195.9 103.3191.3 195.2 105.8192.9 194.7 108.2192.5 194.1 110.7 Vs30 568.3
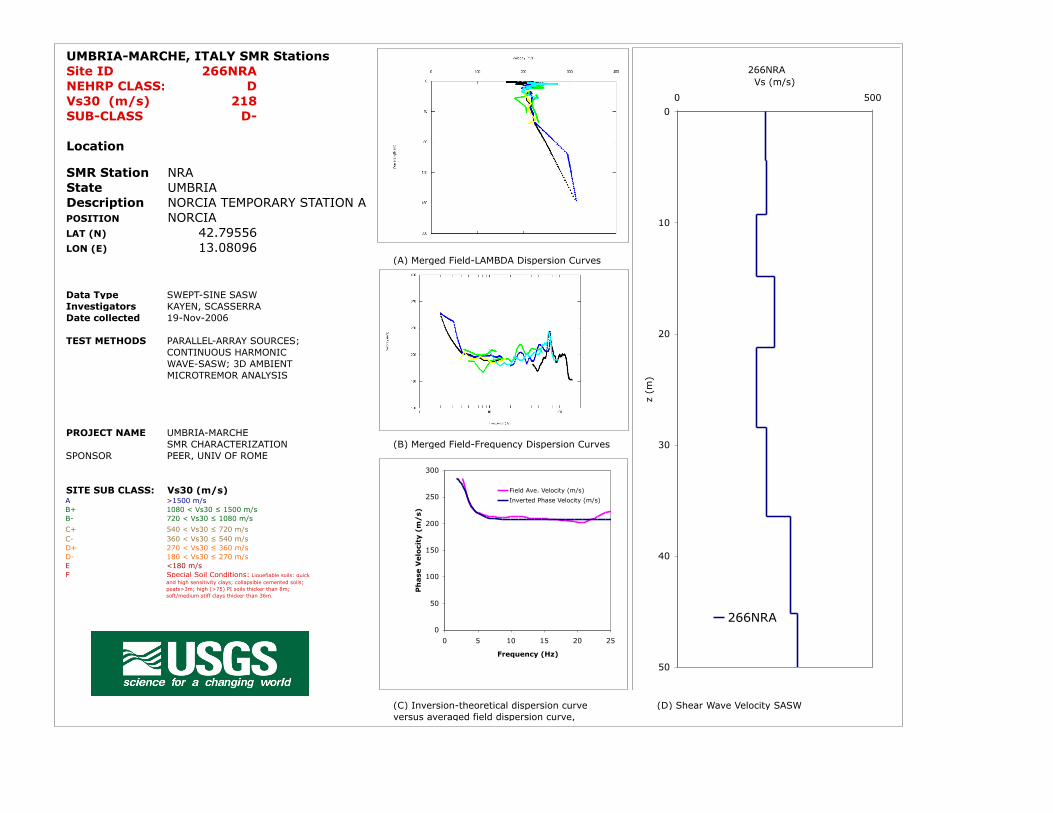
UMBRIA-MARCHE, ITALY SMR StationsSite ID 266NRANEHRP CLASS: DVs30 (m/s) 218SUB-CLASS D-
Location
SMR Station NRA
State UMBRIADescription NORCIA TEMPORARY STATION APOSITION NORCIALAT (N) 42.79556LON (E) 13.08096
(A) Merged Field-LAMBDA Dispersion Curves
Data Type SWEPT-SINE SASWInvestigators KAYEN, SCASSERRADate collected 19-Nov-2006
TEST METHODS PARALLEL-ARRAY SOURCES;CONTINUOUS HARMONICWAVE-SASW; 3D AMBIENT MICROTREMOR ANALYSIS
PROJECT NAME UMBRIA-MARCHE SMR CHARACTERIZATION (B) Merged Field-Frequency Dispersion Curves
SPONSOR PEER, UNIV OF ROME
SITE SUB CLASS: Vs30 (m/s)A >1500 m/sB+ 1080 < Vs30 ≤ 1500 m/sB- 720 < Vs30 ≤ 1080 m/s
C+ 540 < Vs30 ≤ 720 m/sC- 360 < Vs30 ≤ 540 m/sD+ 270 < Vs30 ≤ 360 m/sD- 180 < Vs30 ≤ 270 m/sE <180 m/sF Special Soil Conditions: Liquefiable soils; quick
and high sensitivity clays; collapsible cemented soils; peats>3m; high (>75) PI soils thicker than 8m; soft/medium stiff clays thicker than 36m.
(C) Inversion-theoretical dispersion curve versus averaged field dispersion curve,
(D) Shear Wave Velocity SASW
266NRA
0
10
20
30
40
50
0 500
Vs (m/s)
z (m
)
266NRA0
50
100
150
200
250
300
0 5 10 15 20 25
Frequency (Hz)
Ph
ase
Velo
city
(m
/s)
Field Ave. Velocity (m/s)
Inverted Phase Velocity (m/s)

266NRA DISPERSION DATA INVERSION PROFILE
Site Disp. Vr (m/s) Theoretical Disp. Vr (m/s) Frequency (Hz) Inversion Vs (m/s) Depth (m)226.2 0.0
310.0 285.5 1.8 226.2 4.4285.6 273.1 2.6 227.8 4.4233.8 236.2 3.9 227.8 9.2221.1 219.7 5.0 203.3 9.2215.2 213.1 6.2 203.3 14.8214.1 210.5 7.4 248.0 14.8212.4 209.3 8.6 248.0 21.2214.4 208.9 9.8 202.3 21.2214.7 208.8 11.0 202.3 28.4212.4 208.7 12.2 228.8 28.4210.0 208.7 13.4 228.8 36.4211.1 208.7 14.6 289.9 36.4207.9 208.6 15.9 289.9 45.2207.8 208.5 16.9 307.7 45.2205.5 208.4 18.2 307.7 54.8203.8 208.4 19.5 325.5 54.8203.0 208.3 20.7 325.5 65.2207.7 208.3 21.9 337.4 65.2213.8 208.3 23.0 337.4 80.0221.2 208.3 24.3226.2 208.3 25.5229.1 208.3 26.7226.8 208.3 27.9227.8 207.5 29.1224.2 207.5 30.3220.6 206.7 31.5218.2 205.9 32.7217.0 205.2 33.9219.2 204.4 35.1219.9 203.7 36.3221.8 203.0 37.5222.6 202.3 38.7 Vs30 218.4
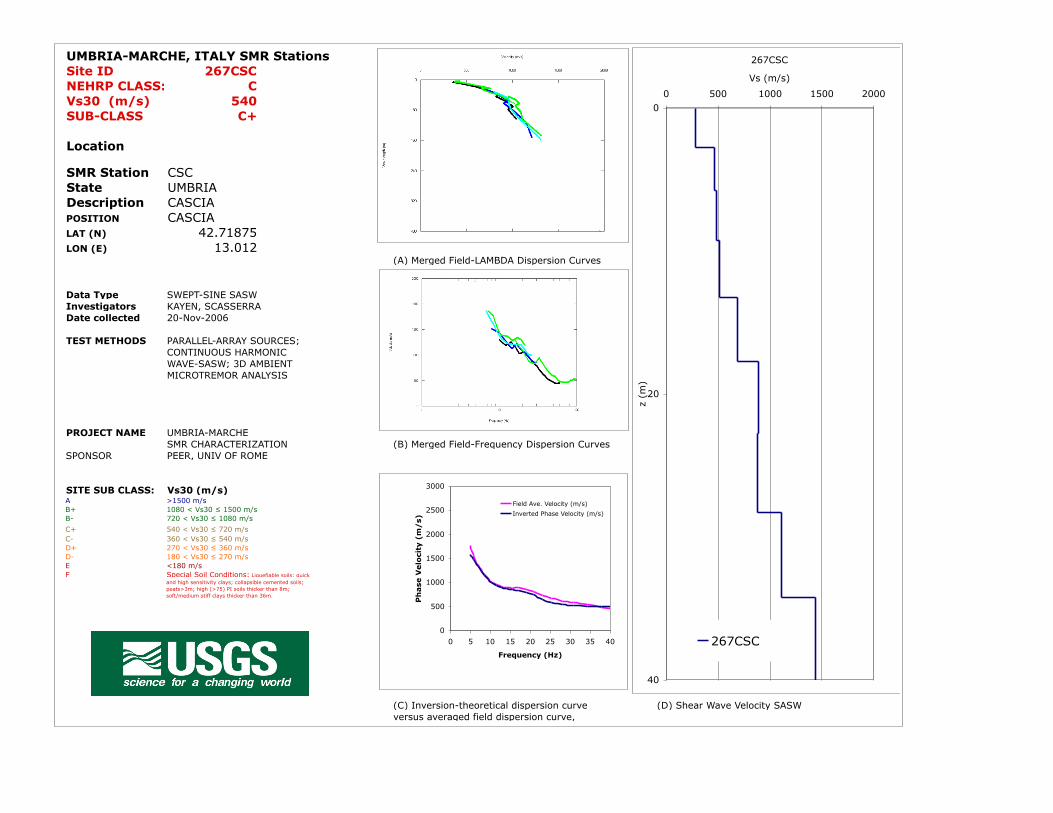
UMBRIA-MARCHE, ITALY SMR StationsSite ID 267CSCNEHRP CLASS: CVs30 (m/s) 540SUB-CLASS C+
Location
SMR Station CSC
State UMBRIADescription CASCIAPOSITION CASCIALAT (N) 42.71875LON (E) 13.012
(A) Merged Field-LAMBDA Dispersion Curves
Data Type SWEPT-SINE SASWInvestigators KAYEN, SCASSERRADate collected 20-Nov-2006
TEST METHODS PARALLEL-ARRAY SOURCES;CONTINUOUS HARMONICWAVE-SASW; 3D AMBIENT MICROTREMOR ANALYSIS
PROJECT NAME UMBRIA-MARCHE SMR CHARACTERIZATION (B) Merged Field-Frequency Dispersion Curves
SPONSOR PEER, UNIV OF ROME
SITE SUB CLASS: Vs30 (m/s)A >1500 m/sB+ 1080 < Vs30 ≤ 1500 m/sB- 720 < Vs30 ≤ 1080 m/s
C+ 540 < Vs30 ≤ 720 m/sC- 360 < Vs30 ≤ 540 m/sD+ 270 < Vs30 ≤ 360 m/sD- 180 < Vs30 ≤ 270 m/sE <180 m/sF Special Soil Conditions: Liquefiable soils; quick
and high sensitivity clays; collapsible cemented soils; peats>3m; high (>75) PI soils thicker than 8m; soft/medium stiff clays thicker than 36m.
(C) Inversion-theoretical dispersion curve versus averaged field dispersion curve,
(D) Shear Wave Velocity SASW
267CSC
0
20
40
0 500 1000 1500 2000
Vs (m/s)
z (m
)267CSC
0
500
1000
1500
2000
2500
3000
0 5 10 15 20 25 30 35 40
Frequency (Hz)
Ph
ase
Velo
city
(m
/s)
Field Ave. Velocity (m/s)
Inverted Phase Velocity (m/s)
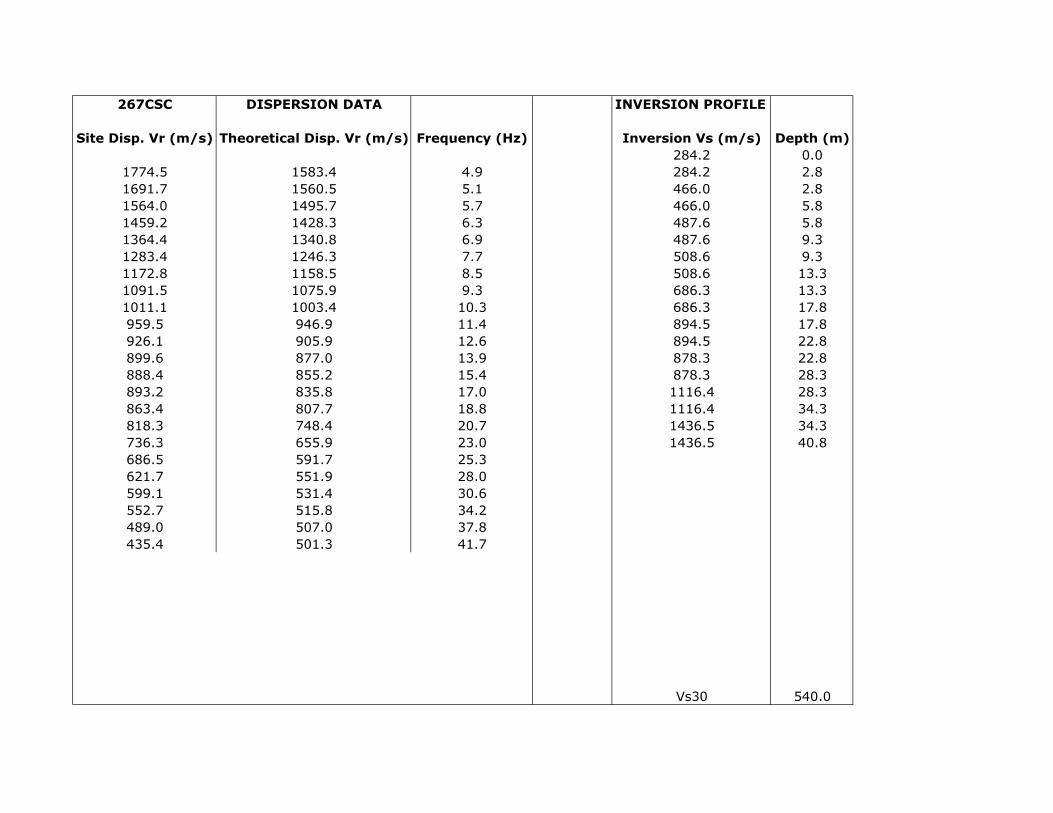
267CSC DISPERSION DATA INVERSION PROFILE
Site Disp. Vr (m/s) Theoretical Disp. Vr (m/s) Frequency (Hz) Inversion Vs (m/s) Depth (m)284.2 0.0
1774.5 1583.4 4.9 284.2 2.81691.7 1560.5 5.1 466.0 2.81564.0 1495.7 5.7 466.0 5.81459.2 1428.3 6.3 487.6 5.81364.4 1340.8 6.9 487.6 9.31283.4 1246.3 7.7 508.6 9.31172.8 1158.5 8.5 508.6 13.31091.5 1075.9 9.3 686.3 13.31011.1 1003.4 10.3 686.3 17.8959.5 946.9 11.4 894.5 17.8926.1 905.9 12.6 894.5 22.8899.6 877.0 13.9 878.3 22.8888.4 855.2 15.4 878.3 28.3893.2 835.8 17.0 1116.4 28.3863.4 807.7 18.8 1116.4 34.3818.3 748.4 20.7 1436.5 34.3736.3 655.9 23.0 1436.5 40.8686.5 591.7 25.3621.7 551.9 28.0599.1 531.4 30.6552.7 515.8 34.2489.0 507.0 37.8435.4 501.3 41.7
Vs30 540.0
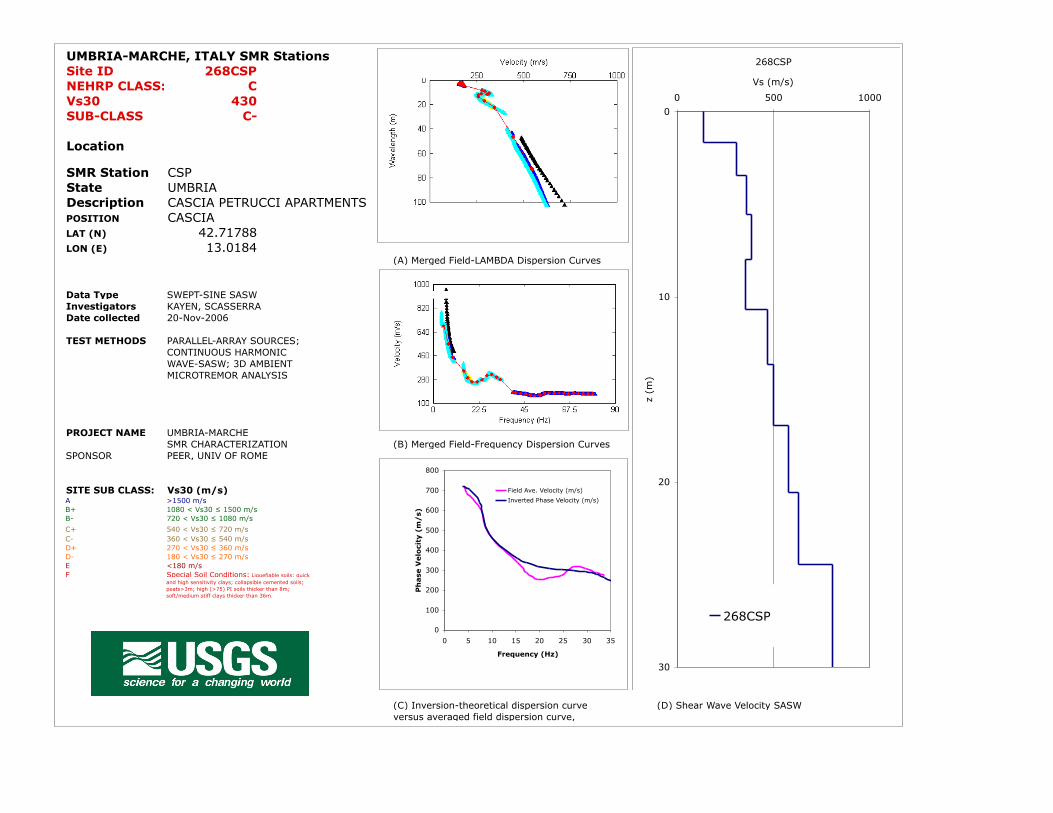
UMBRIA-MARCHE, ITALY SMR StationsSite ID 268CSPNEHRP CLASS: CVs30 430SUB-CLASS C-
Location
SMR Station CSP
State UMBRIADescription CASCIA PETRUCCI APARTMENTSPOSITION CASCIALAT (N) 42.71788LON (E) 13.0184
(A) Merged Field-LAMBDA Dispersion Curves
Data Type SWEPT-SINE SASWInvestigators KAYEN, SCASSERRADate collected 20-Nov-2006
TEST METHODS PARALLEL-ARRAY SOURCES;CONTINUOUS HARMONICWAVE-SASW; 3D AMBIENT MICROTREMOR ANALYSIS
PROJECT NAME UMBRIA-MARCHE SMR CHARACTERIZATION (B) Merged Field-Frequency Dispersion Curves
SPONSOR PEER, UNIV OF ROME
SITE SUB CLASS: Vs30 (m/s)A >1500 m/sB+ 1080 < Vs30 ≤ 1500 m/sB- 720 < Vs30 ≤ 1080 m/s
C+ 540 < Vs30 ≤ 720 m/sC- 360 < Vs30 ≤ 540 m/sD+ 270 < Vs30 ≤ 360 m/sD- 180 < Vs30 ≤ 270 m/sE <180 m/sF Special Soil Conditions: Liquefiable soils; quick
and high sensitivity clays; collapsible cemented soils; peats>3m; high (>75) PI soils thicker than 8m; soft/medium stiff clays thicker than 36m.
(C) Inversion-theoretical dispersion curve versus averaged field dispersion curve,
(D) Shear Wave Velocity SASW
268CSP
0
10
20
30
0 500 1000
Vs (m/s)
z (m
)
268CSP0
100
200
300
400
500
600
700
800
0 5 10 15 20 25 30 35
Frequency (Hz)
Ph
ase
Velo
city
(m
/s)
Field Ave. Velocity (m/s)
Inverted Phase Velocity (m/s)
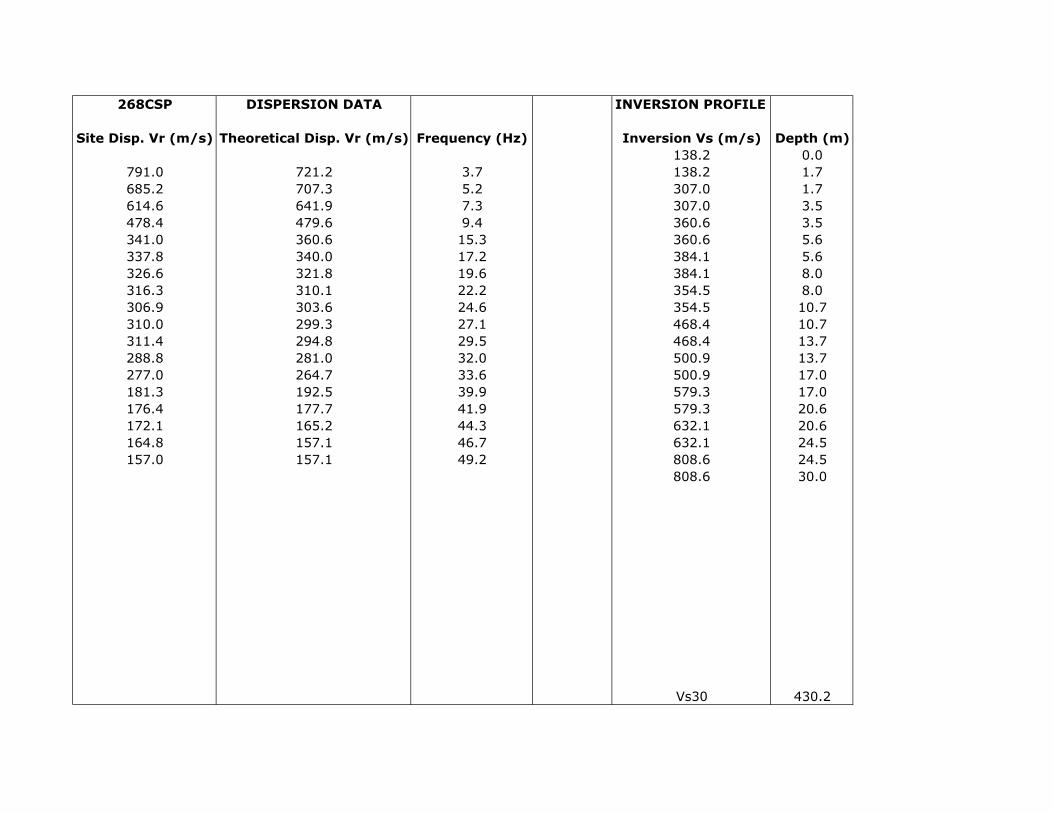
268CSP DISPERSION DATA INVERSION PROFILE
Site Disp. Vr (m/s) Theoretical Disp. Vr (m/s) Frequency (Hz) Inversion Vs (m/s) Depth (m)138.2 0.0
791.0 721.2 3.7 138.2 1.7685.2 707.3 5.2 307.0 1.7614.6 641.9 7.3 307.0 3.5478.4 479.6 9.4 360.6 3.5341.0 360.6 15.3 360.6 5.6337.8 340.0 17.2 384.1 5.6326.6 321.8 19.6 384.1 8.0316.3 310.1 22.2 354.5 8.0306.9 303.6 24.6 354.5 10.7310.0 299.3 27.1 468.4 10.7311.4 294.8 29.5 468.4 13.7288.8 281.0 32.0 500.9 13.7277.0 264.7 33.6 500.9 17.0181.3 192.5 39.9 579.3 17.0176.4 177.7 41.9 579.3 20.6172.1 165.2 44.3 632.1 20.6164.8 157.1 46.7 632.1 24.5157.0 157.1 49.2 808.6 24.5
808.6 30.0
Vs30 430.2
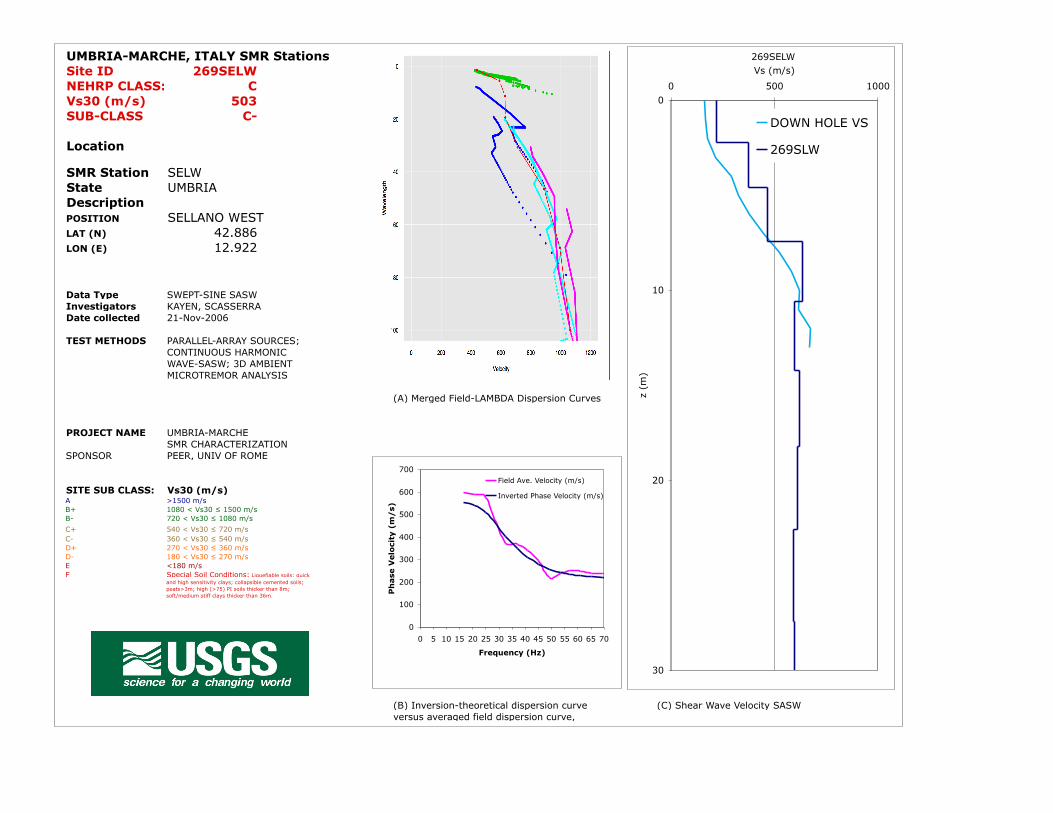
UMBRIA-MARCHE, ITALY SMR StationsSite ID 269SELWNEHRP CLASS: CVs30 (m/s) 503SUB-CLASS C-
Location
SMR Station SELW
State UMBRIADescriptionPOSITION SELLANO WESTLAT (N) 42.886LON (E) 12.922
Data Type SWEPT-SINE SASWInvestigators KAYEN, SCASSERRADate collected 21-Nov-2006
TEST METHODS PARALLEL-ARRAY SOURCES;CONTINUOUS HARMONICWAVE-SASW; 3D AMBIENT MICROTREMOR ANALYSIS
(A) Merged Field-LAMBDA Dispersion Curves
PROJECT NAME UMBRIA-MARCHE SMR CHARACTERIZATION
SPONSOR PEER, UNIV OF ROME
SITE SUB CLASS: Vs30 (m/s)A >1500 m/sB+ 1080 < Vs30 ≤ 1500 m/sB- 720 < Vs30 ≤ 1080 m/s
C+ 540 < Vs30 ≤ 720 m/sC- 360 < Vs30 ≤ 540 m/sD+ 270 < Vs30 ≤ 360 m/sD- 180 < Vs30 ≤ 270 m/sE <180 m/sF Special Soil Conditions: Liquefiable soils; quick
and high sensitivity clays; collapsible cemented soils; peats>3m; high (>75) PI soils thicker than 8m; soft/medium stiff clays thicker than 36m.
(B) Inversion-theoretical dispersion curve versus averaged field dispersion curve,
(C) Shear Wave Velocity SASW
269SELW
0
10
20
30
0 500 1000
Vs (m/s)
z (m
)
DOWN HOLE VS
269SLW
0
100
200
300
400
500
600
700
0 5 10 15 20 25 30 35 40 45 50 55 60 65 70
Frequency (Hz)
Ph
ase
Velo
city
(m
/s)
Field Ave. Velocity (m/s)
Inverted Phase Velocity (m/s)
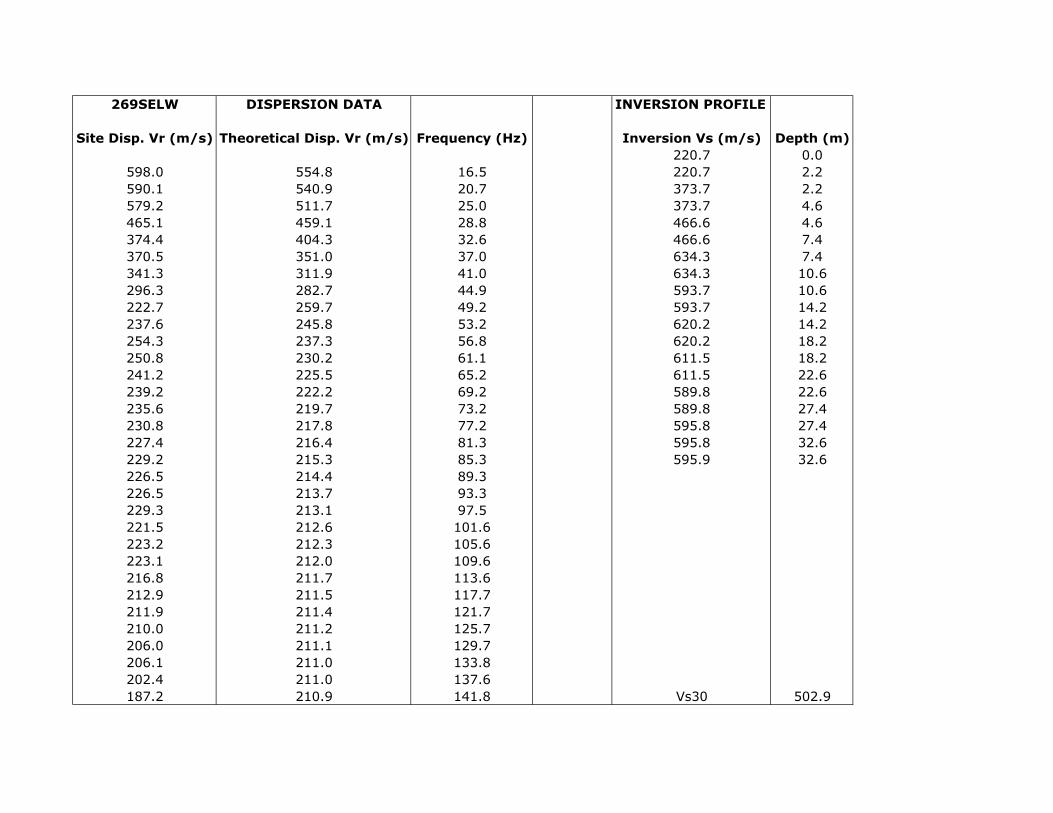
269SELW DISPERSION DATA INVERSION PROFILE
Site Disp. Vr (m/s) Theoretical Disp. Vr (m/s) Frequency (Hz) Inversion Vs (m/s) Depth (m)220.7 0.0
598.0 554.8 16.5 220.7 2.2590.1 540.9 20.7 373.7 2.2579.2 511.7 25.0 373.7 4.6465.1 459.1 28.8 466.6 4.6374.4 404.3 32.6 466.6 7.4370.5 351.0 37.0 634.3 7.4341.3 311.9 41.0 634.3 10.6296.3 282.7 44.9 593.7 10.6222.7 259.7 49.2 593.7 14.2237.6 245.8 53.2 620.2 14.2254.3 237.3 56.8 620.2 18.2250.8 230.2 61.1 611.5 18.2241.2 225.5 65.2 611.5 22.6239.2 222.2 69.2 589.8 22.6235.6 219.7 73.2 589.8 27.4230.8 217.8 77.2 595.8 27.4227.4 216.4 81.3 595.8 32.6229.2 215.3 85.3 595.9 32.6226.5 214.4 89.3226.5 213.7 93.3229.3 213.1 97.5221.5 212.6 101.6223.2 212.3 105.6223.1 212.0 109.6216.8 211.7 113.6212.9 211.5 117.7211.9 211.4 121.7210.0 211.2 125.7206.0 211.1 129.7206.1 211.0 133.8202.4 211.0 137.6187.2 210.9 141.8 Vs30 502.9

UMBRIA-MARCHE, ITALY SMR StationsSite ID 270MTLNEHRP CLASS: CVs30 (m/s) 491SUB-CLASS C-
Location
SMR Station MTL
State MARCHE'Description MATELICAPOSITION
LAT (N) 43.24841LON (E) 13.0079
(A) Merged Field-LAMBDA Dispersion Curves
Data Type SWEPT-SINE SASWInvestigators KAYEN, SCASSERRADate collected 21-Nov-2006
TEST METHODS PARALLEL-ARRAY SOURCES;CONTINUOUS HARMONICWAVE-SASW; 3D AMBIENT MICROTREMOR ANALYSIS
PROJECT NAME UMBRIA-MARCHE SMR CHARACTERIZATION (B) Merged Field-Frequency Dispersion Curves
SPONSOR PEER, UNIV OF ROME
SITE SUB CLASS: Vs30 (m/s)A >1500 m/sB+ 1080 < Vs30 ≤ 1500 m/sB- 720 < Vs30 ≤ 1080 m/s
C+ 540 < Vs30 ≤ 720 m/sC- 360 < Vs30 ≤ 540 m/sD+ 270 < Vs30 ≤ 360 m/sD- 180 < Vs30 ≤ 270 m/sE <180 m/sF Special Soil Conditions: Liquefiable soils; quick
and high sensitivity clays; collapsible cemented soils; peats>3m; high (>75) PI soils thicker than 8m; soft/medium stiff clays thicker than 36m.
(C) Inversion-theoretical dispersion curve versus averaged field dispersion curve,
(D) Shear Wave Velocity SASW
270MTL
0
10
20
30
40
0 200 400 600 800 1000
Vs (m/s)
z (m
)
270MTL0
100
200
300
400
500
600
700
800
0 5 10 15 20 25 30 35 40 45 50 55 60 65 70
Frequency (Hz)
Ph
ase
Velo
city
(m
/s)
Field Ave. Velocity (m/s)
Inverted Phase Velocity (m/s)
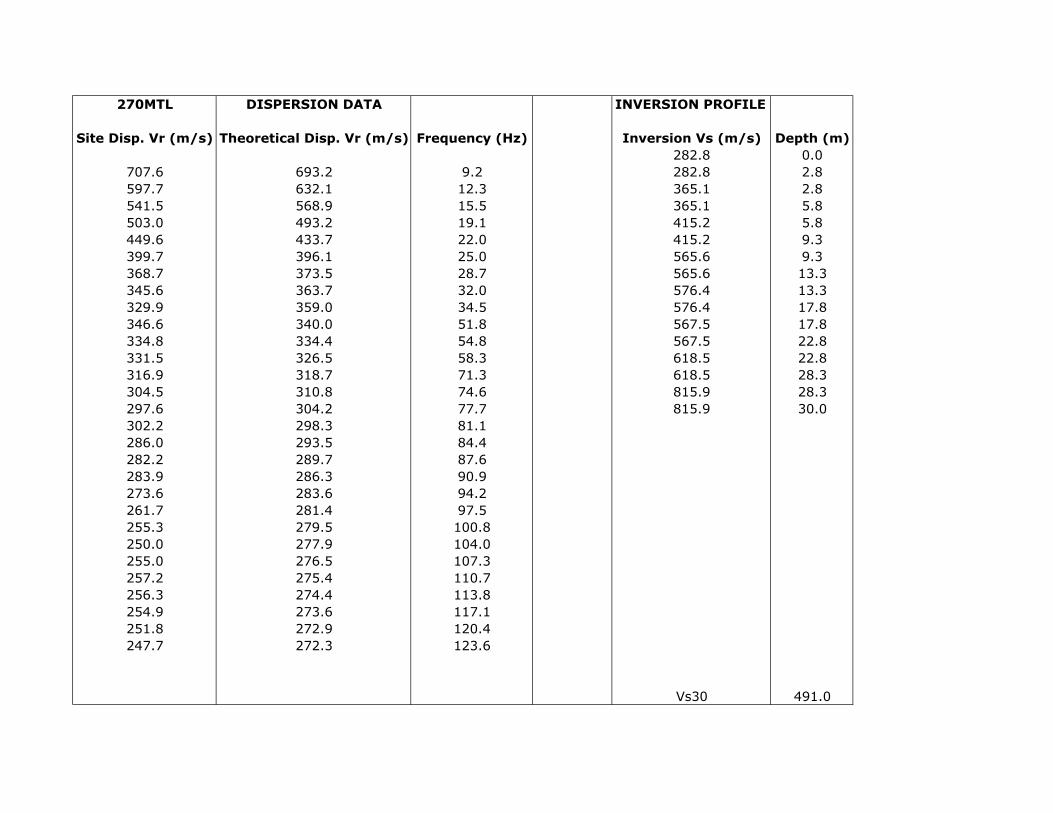
270MTL DISPERSION DATA INVERSION PROFILE
Site Disp. Vr (m/s) Theoretical Disp. Vr (m/s) Frequency (Hz) Inversion Vs (m/s) Depth (m)282.8 0.0
707.6 693.2 9.2 282.8 2.8597.7 632.1 12.3 365.1 2.8541.5 568.9 15.5 365.1 5.8503.0 493.2 19.1 415.2 5.8449.6 433.7 22.0 415.2 9.3399.7 396.1 25.0 565.6 9.3368.7 373.5 28.7 565.6 13.3345.6 363.7 32.0 576.4 13.3329.9 359.0 34.5 576.4 17.8346.6 340.0 51.8 567.5 17.8334.8 334.4 54.8 567.5 22.8331.5 326.5 58.3 618.5 22.8316.9 318.7 71.3 618.5 28.3304.5 310.8 74.6 815.9 28.3297.6 304.2 77.7 815.9 30.0302.2 298.3 81.1286.0 293.5 84.4282.2 289.7 87.6283.9 286.3 90.9273.6 283.6 94.2261.7 281.4 97.5255.3 279.5 100.8250.0 277.9 104.0255.0 276.5 107.3257.2 275.4 110.7256.3 274.4 113.8254.9 273.6 117.1251.8 272.9 120.4247.7 272.3 123.6
Vs30 491.0