Embed Size (px)
Citation preview
Technological Forecasting & Social Change 78 (2011) 729–735
Contents lists available at ScienceDirect
Technological Forecasting & Social Change
Sharing mobile phones in developing countries: Implications for thedigital divide
Jeffrey JamesTilburg University, The Netherlands
a r t i c l e i n f o
E-mail address: [email protected] This synonymity assumption is just a simplificatio2 A similar problem arises with the use of the Interne
use it. In reality however there are numerous ways infrom the Internet to those who own radios or via inte
0040-1625/$ – see front matter © 2010 Elsevier Inc.doi:10.1016/j.techfore.2010.11.008
a b s t r a c t
Article history:Received 12 March 2010Received in revised form 16 November 2010Accepted 18 November 2010Available online 12 January 2011
Current estimates of thedigital divide inmobilephones between richandpoor countries are basedon the ethnocentric assumption that in both regions the use of these products takes place throughindividual ownership. But while this assumption may be largely true in the former countries, itdoes not match the circumstances in the latter regions where a considerable amount of sharing isshown to take place (partly for cultural reasons). Using the available survey evidence and a simplearithmetic framework, I show thatwhen sharing is taken into account, thedivide entirely ceases toexist or is greatly reduced (though there are one or two exceptions to this general pattern).Improvements in data collection practice will tend, as I see it, to strengthen rather than cast doubtupon this novel finding. If so, questions arise as to the need for a gap analysis per se.As defined by most international organizations, the digital divide in mobile phones is the ratio ofsubscribers in developed countries to subscribers in developing countries (I use the terms ownersand subscribers synonymously1). This definition however assumes that the only way in whichbenefits accrue to individuals is by individual ownership of mobile phones.2 And while this maymake sense in developed countries where ownership is indeed widespread, it does not makemuch sense in poor countries where benefits from use are more heavily derived by sharing of thetechnology. The problem here is created by the illegitimate transposition of an assumption fromone set of circumstances to a highly different environment, a phenomenon described, amongothers, byMyrdal [5]. My purpose below is to examine the implications of this assumption for thedigital divide in mobile phones between rich and poor countries. In particular, I will argue thatcurrent measures of this divide are quite heavily overstated, in some cases to the point where thedivide disappears altogether. For this purpose I will rely mainly on household survey data thatpertains to the middle of the past decade. The first part of the paper deals with the context of thedigital divide and a description of themajor socio-economic effects of mobile phones. The secondpart is concernedwith the concepts andmeasures of sharingwhile thefinal part is concernedwithempirical evidence. Both parts 2 and 3 are based on a distinction between two major types ofsharing behavior. And both parts use a measure of mobile phones per 100 inhabitants.
© 2010 Elsevier Inc. All rights reserved.
Keywords:Household sharingInformation technologyAppropriate technology
1. Introduction
The digital divide is meant to reflect the differential benefits of information in rich as opposed to poor countries. The divide, asnoted above, is usually measured as the ratio of the stock of IT in the former countries divided by the stock in the latter. It is
n. It need not always be true.t in developing countries. It is assumed that those who derive benefits from the technology have to actuallywhich poor communities gain benefits without use. I am thinking for example of broadcasting informationrmediaries with loudspeakers.
All rights reserved.
730 J. James / Technological Forecasting & Social Change 78 (2011) 729–735
generally accepted that the digital gap is greater for the Internet than mobile phones. This is partly because the former is moredemanding in terms of skills, affordability, infrastructure and so on and partly because it is the relatively poor countries that aremost lacking in these features. In some ways the digital divide is similar to other technological gaps between rich and poorcountries, yet, at the same time information technology is different from other products imported from advanced countriesbecause it can be described as “general purpose” (meaning, among other things, that it involves changes that transform householdlife as well as the ways in which firms conduct business).
The digital divide is also closely related in the literature to so called “digital readiness indicators”which cover a broad range ofvariables, such as skills, the regulatory and legal environment and so on. In particular the divide is included as one additivecomponent of these indicators such as the “network readiness index” (NRI) of the World Economic Forum. The NRI is defined as‘the degree of preparation of a nation or community to participate in and benefit from ICT developments’ [1]. The idea is that thedigital divide in phones contributes to the overall readiness index, thereby promoting growth and poverty reduction (since thetwo are known to be closely related). However, methodological doubts arise as to whether the mobile gap can be used in this wayas an input to and an outcome of the process. James [2] for example has argued that the gap should be regarded as an outcome of allthe other inputs used in digital network indexes.
The literature also includes an extensive treatment of the effects of the divide in mobile phones especially since this technologyis growing so fast in much of the developing world as shown for example in annual reports of the InternationalTelecommunications Union (ITU). My goal here is not to summarize all the research on impacts but rather to deal only withsome of the most prominent studies. From a sociological point of view the relationship betweenmobile phone and social capital isone of the most important. According to many people for example the mobile phone can be thought of as an additional means ofcommunication which is able to promote existing social relationships and to follow patterns of civic engagement. Goodman [3] forexample has studied the effects of mobiles on the social capital in South Africa and Tanzania. What he found was that ‘mobileswere facilitating participation in social networks, helping to maintain both strong and weak links, including participation incommunity group activity’ [3]. From an economics point of view, the main causality runs from mobile phones to higherproductivity to increased growth and poverty reduction. Waverman et al find that indeed mobile telephony has a positive andsignificant impact on growth and this impact may be twice as large in developing countries compared to developed countries… Thegrowth dividend is far larger because here mobiles provide, by and large, the main communications networks; hence theysupplant the information gathering role of fixed-line systems’ [4, emphasis in original].
2. Concepts, explanations and measures of sharing
a) The culture of sharingSharing of goods and services is not an alien concept in developing countries. On the contrary, it seems to be deeply rooted inthe culture of many such countries. Sharing information technology in general and mobile phones in particular can thus beviewed as a new application of a pre-existing trait that can be found on at least two different continents. In Asia, for example,‘the Philippines have a culture in which household members generally share resources’ [6]. And on that continent in general,‘shared mobile phones… are used within a culture of sharing.…Material resources are often shared at the level of householdand neighborhood. … Domestic communication technologies are seen not only as enablers but support devices for familyinteraction and co-ordination.… Asian cultures privilege the family over the individual. Though, there are several social unitscompeting as identify markers, the individual is not seen as the primary unit of social organization’ [6]. Or again, on a differentcontinent, ‘Although a mobile phone may nominally belong to a single person, in some African countries it is regarded as theproperty of the community, because there is a culture of sharing the tools of communication’ [7].
b) Underdevelopment and sharingThere is also reason to think that sharing of mobile phones may be a function of underdevelopment itself. For example, there ismore of a need to freely share mobile phones in developing as opposed to developed countries. On the one hand, the size ofhousehold tends to be greater in the former than in the latter regions. Moreover, family size tends to be greater within rural thanurban areas, reflecting partly the lower incomes andmore traditional values in these areas. In developed countries household sizehas fallen from around 5.5 to 2.6 during the past 100 years or so. By the turn of the century, however, therewere still many regionsin the developing world with an average of twice that amount [8].3 On the other hand, a large family size usually tends to becorrelated with higher poverty, thereby making it more difficult for family members to buy their own phones.A negative relationship between the degree of sharing and income has been identified at the country level by Stork [9] in his fieldstudy of Namibia. As he puts it, “The percentage of respondents that share their mobiles with family, friends or neighbors isdistinguished by household income. One can clearly observe a trend of higher income households tending to share their mobilesless, which can also be attributed tomoremobiles being owned per household” [9]. Stork also observes ‘that respondents living inrural areas are more willing to share their mobiles with others than respondents in major urban or other urban areas …
Interestingly, only 2.77% of respondents that share theirmobile phones charge friends, family or neighbors a fee for the use of theircell phones’ [9].The same logic that applies to the relationships at the country level can probably be extended to the cross-country level as well,which would then take the form shown in Fig. 1.
3 See below the household size in Ethiopia.
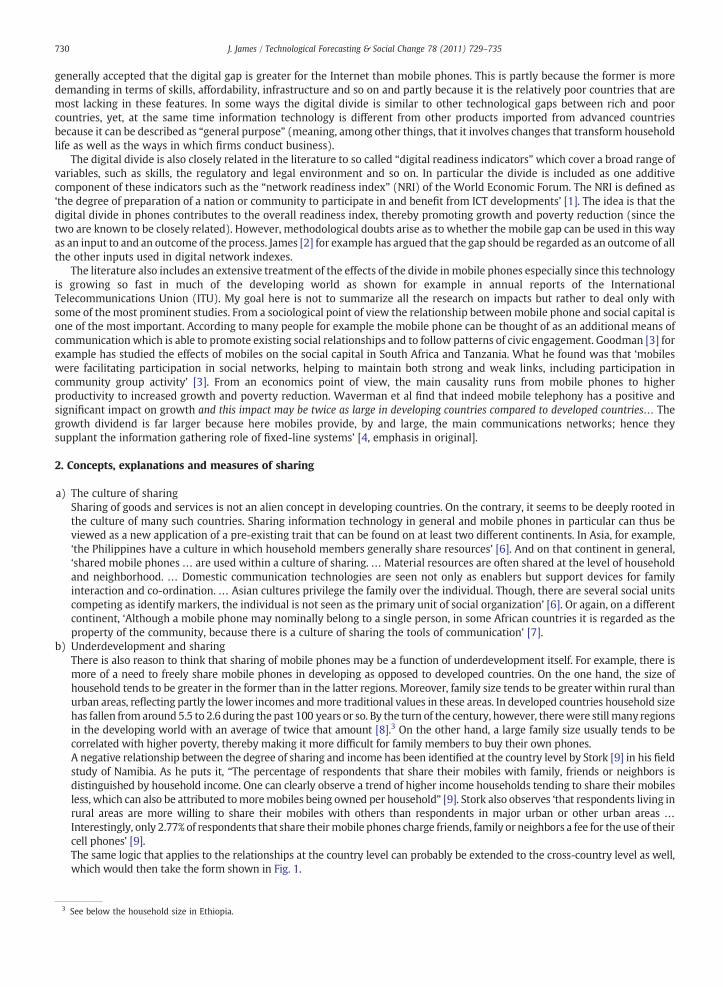
Fig. 1. Sharing in rich and poor countries.
4 It is worth emphasizing though that from a welfare point of view having access to a mobile phone is not the same as actually owning one. Sharing foexample may not be available at all times and the use of a payphone usually requires time and effort.
5 It is commercial in the sense that payment for the use of a phone is required, albeit in very small amounts.
731J. James / Technological Forecasting & Social Change 78 (2011) 729–735
In thefirst panel I have arbitrarily assigned the amount of sharing as 0 .5 per individual in thedeveloped countries and 3 in thepoorcountries. The difference between them reflects the source of overstatement in the digital divide because this is what is ignored inthe conventional measure.4 The second panel of Fig. 1 also shows the negative relationship between owning and sharing amobilephone across countries, a relationship thatwas discussed above. The numbers 0.5 and 3 represent the number of persons towhomthe owner lends his/her phone.
c) Types of sharingI distinguish between two types of sharing behavior, one that is commercial5 in the sense that phone calls have to be paid for,albeit in small amounts, and the other where sharing takes place without payment. Probably the best-known example of theformer is one that is based on micro-credit and the Grameen Bank in particular. Known as Grameen Telecom the project hashad a considerable impact in Bangladesh and elsewhere. ‘As an extension of the original Grameen Bank endeavor tomake smallgroup loans to its (female) members, the idea of the Telecom project is to lend money to a bank member in each village inBangladesh for the purpose of purchasing a mobile phone. The phone owner then sells call-time to the other villagers, who, itseems, are willing to pay a relatively high proportion of their incomes on this service’ [10].The activities of Vodacom in South Africa also bearmention under this category of sharing. I am referring here specifically to themodel of the Community Phone Shop
In its essence, the community phone shop is designed to function as a local phone booth, equipped with 5 to 10 phones andhoused in a spaza shop, a garage or a shipping container for example. In thismodel, the phone shop is owned andmanaged by amember of the community, and the relationship between the shop owner and Vodacom is one of franchisee and franchiser.Vodacomsells pre-paid airtime atdiscounted rates,which the community shopowner then sells on tohis or her customers. Thismicro-franchise model has been a resounding success: by May 2008, almost 90,000 such ventures were operating under theVodacom brand all over South Africa [11].(A spaza shop is a small informal unit often run from a private home).
The second form of sharing differs from the first in that it takes place between households, friends and neighbors, and usuallyinvolves no payment. As such it fits in closelywith the culture of sharingmentioned above. Just as a newspapermay be read by upto 10 people in Africa, so too domobile phones tend to be shared by family and friends, thus raising the number of subscribers andcausing an overstatement of the digital divide as conventionally measured (see below).The third and final category is the composite of the two that have just been described. It recognizes that in calculating the totalnumber of users per 100 inhabitants in a country both these groups need to be considered. For, apart from those individuals whouse commercial and non-commercial forms of sharing, the correct number of users is an additive combination of both. Because ofdata limitations, however, I can usually dealwith only the one or the other formof sharing per country and thismakesmost ofmyestimates of overstatementhighly conservative to beconsideredasminimumamounts. Even then, though, I try to showbelow thatmany of these estimates are enough to cast serious doubt on the existing measures of the digital divide in mobile phones.
d) Sharing and the digital divideAs already noted, the digital divide is conventionally measured as the ratio of mobile subscribers per 100 inhabitants indeveloped countries to those in poor countries.What one is really after however is the ratio of users in the two regions, (for thatis what ultimatelymatters from awelfare point of view). [4] If use was derived everywhere from ownership alone, there wouldbe no distortion in the way the divide is conventionally conceived and measured. As also noted above, however, in developing(as opposed to developed) countries a substantial amount of use derives instead from variousmodes of sharingmobile phones.Neglect of this phenomenon, therefore, leads to an overstatement of the digital divide. In other words, if use rather than
r
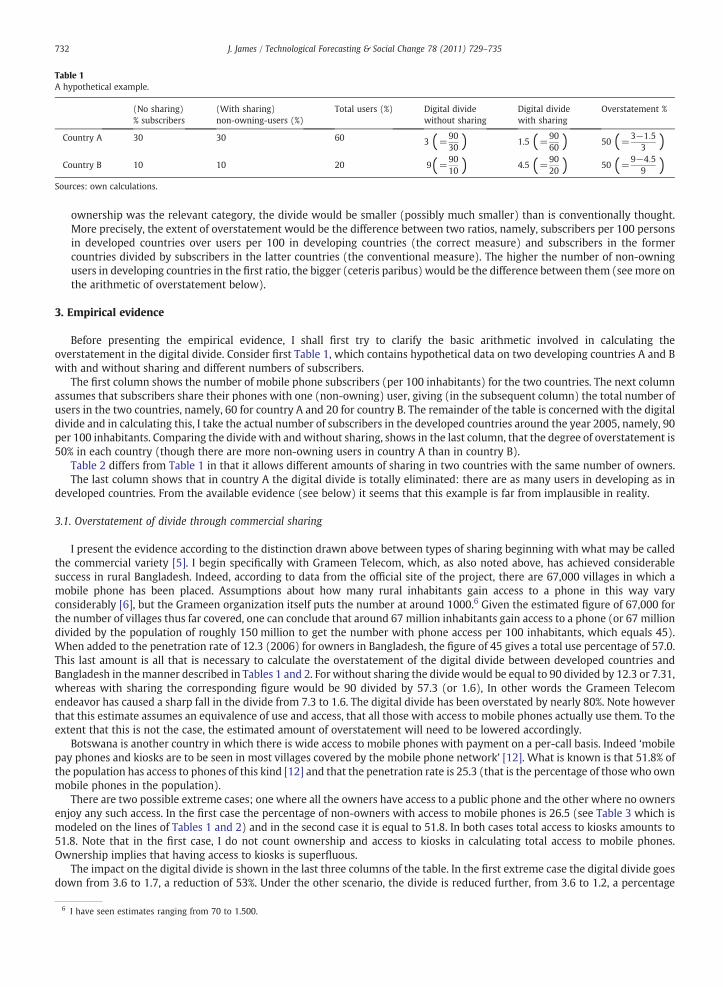
Table 1A hypothetical example.
(No sharing)% subscribers
(With sharing)non-owning-users (%)
Total users (%) Digital dividewithout sharing
Digital dividewith sharing
Overstatement %
Country A 30 30 60 3 (=9030 ) 1.5 (=
9060 ) 50 (=
3−1:53 )
Country B 10 10 20 9(=9010 ) 4.5 (=
9020 ) 50 (=
9−4:59 )
Sources: own calculations.
6 I have seen estimates ranging from 70 to 1.500.
732 J. James / Technological Forecasting & Social Change 78 (2011) 729–735
ownership was the relevant category, the divide would be smaller (possibly much smaller) than is conventionally thought.More precisely, the extent of overstatement would be the difference between two ratios, namely, subscribers per 100 personsin developed countries over users per 100 in developing countries (the correct measure) and subscribers in the formercountries divided by subscribers in the latter countries (the conventional measure). The higher the number of non-owningusers in developing countries in the first ratio, the bigger (ceteris paribus) would be the difference between them (see more onthe arithmetic of overstatement below).
3. Empirical evidence
Before presenting the empirical evidence, I shall first try to clarify the basic arithmetic involved in calculating theoverstatement in the digital divide. Consider first Table 1, which contains hypothetical data on two developing countries A and Bwith and without sharing and different numbers of subscribers.
The first column shows the number of mobile phone subscribers (per 100 inhabitants) for the two countries. The next columnassumes that subscribers share their phones with one (non-owning) user, giving (in the subsequent column) the total number ofusers in the two countries, namely, 60 for country A and 20 for country B. The remainder of the table is concerned with the digitaldivide and in calculating this, I take the actual number of subscribers in the developed countries around the year 2005, namely, 90per 100 inhabitants. Comparing the divide with andwithout sharing, shows in the last column, that the degree of overstatement is50% in each country (though there are more non-owning users in country A than in country B).
Table 2 differs from Table 1 in that it allows different amounts of sharing in two countries with the same number of owners.The last column shows that in country A the digital divide is totally eliminated: there are as many users in developing as in
developed countries. From the available evidence (see below) it seems that this example is far from implausible in reality.
3.1. Overstatement of divide through commercial sharing
I present the evidence according to the distinction drawn above between types of sharing beginning with what may be calledthe commercial variety [5]. I begin specifically with Grameen Telecom, which, as also noted above, has achieved considerablesuccess in rural Bangladesh. Indeed, according to data from the official site of the project, there are 67,000 villages in which amobile phone has been placed. Assumptions about how many rural inhabitants gain access to a phone in this way varyconsiderably [6], but the Grameen organization itself puts the number at around 1000.6 Given the estimated figure of 67,000 forthe number of villages thus far covered, one can conclude that around 67 million inhabitants gain access to a phone (or 67 milliondivided by the population of roughly 150 million to get the number with phone access per 100 inhabitants, which equals 45).When added to the penetration rate of 12.3 (2006) for owners in Bangladesh, the figure of 45 gives a total use percentage of 57.0.This last amount is all that is necessary to calculate the overstatement of the digital divide between developed countries andBangladesh in themanner described in Tables 1 and 2. For without sharing the divide would be equal to 90 divided by 12.3 or 7.31,whereas with sharing the corresponding figure would be 90 divided by 57.3 (or 1.6), In other words the Grameen Telecomendeavor has caused a sharp fall in the divide from 7.3 to 1.6. The digital divide has been overstated by nearly 80%. Note howeverthat this estimate assumes an equivalence of use and access, that all those with access to mobile phones actually use them. To theextent that this is not the case, the estimated amount of overstatement will need to be lowered accordingly.
Botswana is another country in which there is wide access to mobile phones with payment on a per-call basis. Indeed ‘mobilepay phones and kiosks are to be seen in most villages covered by the mobile phone network’ [12]. What is known is that 51.8% ofthe population has access to phones of this kind [12] and that the penetration rate is 25.3 (that is the percentage of those who ownmobile phones in the population).
There are two possible extreme cases; one where all the owners have access to a public phone and the other where no ownersenjoy any such access. In the first case the percentage of non-owners with access to mobile phones is 26.5 (see Table 3 which ismodeled on the lines of Tables 1 and 2) and in the second case it is equal to 51.8. In both cases total access to kiosks amounts to51.8. Note that in the first case, I do not count ownership and access to kiosks in calculating total access to mobile phones.Ownership implies that having access to kiosks is superfluous.
The impact on the digital divide is shown in the last three columns of the table. In the first extreme case the digital divide goesdown from 3.6 to 1.7, a reduction of 53%. Under the other scenario, the divide is reduced further, from 3.6 to 1.2, a percentage
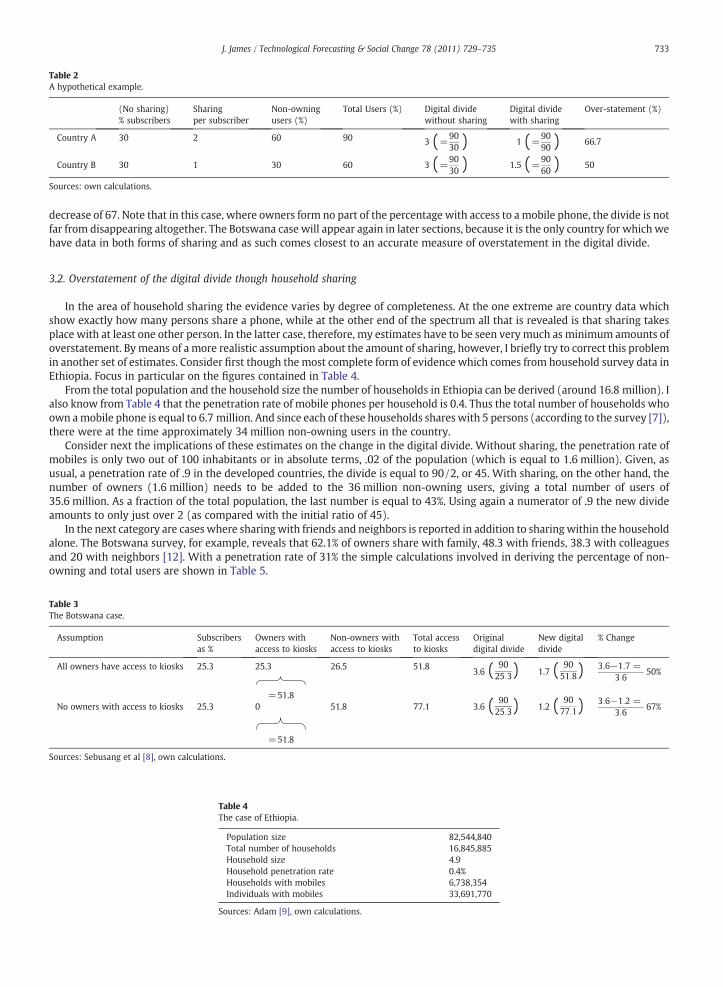
Table 2A hypothetical example.
(No sharing)% subscribers
Sharingper subscriber
Non-owningusers (%)
Total Users (%) Digital dividewithout sharing
Digital dividewith sharing
Over-statement (%)
Country A 30 2 60 90 3 (=9030 ) 1 (=
9090 ) 66.7
Country B 30 1 30 60 3 (=9030 ) 1.5 (=
9060 ) 50
Sources: own calculations.
Table 3The Botswana case.
Assumption Subscribersas %
Owners withaccess to kiosks
Non-owners withaccess to kiosks
Total accessto kiosks
Originaldigital divide
New digitaldivide
% Change
All owners have access to kiosks 25.3 25.3 26.5 51.83.6 ( 90
25:3) 1.7 ( 9051:8) 3:6−1:7 =
3:650%
=51.8No owners with access to kiosks 25.3 0 51.8 77.1 3.6 ( 90
25:3) 1.2 ( 9077:1)
3:6−1:2 =3:6
67%
=51.8
Sources: Sebusang et al [8], own calculations.
Table 4The case of Ethiopia.
Population size 82,544,840Total number of households 16,845,885Household size 4.9Household penetration rate 0.4%Households with mobiles 6,738,354Individuals with mobiles 33,691,770
Sources: Adam [9], own calculations.
733J. James / Technological Forecasting & Social Change 78 (2011) 729–735
decrease of 67. Note that in this case, where owners form no part of the percentage with access to a mobile phone, the divide is notfar from disappearing altogether. The Botswana case will appear again in later sections, because it is the only country for which wehave data in both forms of sharing and as such comes closest to an accurate measure of overstatement in the digital divide.
3.2. Overstatement of the digital divide though household sharing
In the area of household sharing the evidence varies by degree of completeness. At the one extreme are country data whichshow exactly how many persons share a phone, while at the other end of the spectrum all that is revealed is that sharing takesplace with at least one other person. In the latter case, therefore, my estimates have to be seen very much as minimum amounts ofoverstatement. Bymeans of a more realistic assumption about the amount of sharing, however, I briefly try to correct this problemin another set of estimates. Consider first though the most complete form of evidence which comes from household survey data inEthiopia. Focus in particular on the figures contained in Table 4.
From the total population and the household size the number of households in Ethiopia can be derived (around 16.8 million). Ialso know from Table 4 that the penetration rate of mobile phones per household is 0.4. Thus the total number of households whoown amobile phone is equal to 6.7 million. And since each of these households shares with 5 persons (according to the survey [7]),there were at the time approximately 34 million non-owning users in the country.
Consider next the implications of these estimates on the change in the digital divide. Without sharing, the penetration rate ofmobiles is only two out of 100 inhabitants or in absolute terms, .02 of the population (which is equal to 1.6 million). Given, asusual, a penetration rate of .9 in the developed countries, the divide is equal to 90/2, or 45. With sharing, on the other hand, thenumber of owners (1.6 million) needs to be added to the 36 million non-owning users, giving a total number of users of35.6 million. As a fraction of the total population, the last number is equal to 43%. Using again a numerator of .9 the new divideamounts to only just over 2 (as compared with the initial ratio of 45).
In the next category are cases where sharingwith friends and neighbors is reported in addition to sharingwithin the householdalone. The Botswana survey, for example, reveals that 62.1% of owners share with family, 48.3 with friends, 38.3 with colleaguesand 20 with neighbors [12]. With a penetration rate of 31% the simple calculations involved in deriving the percentage of non-owning and total users are shown in Table 5.
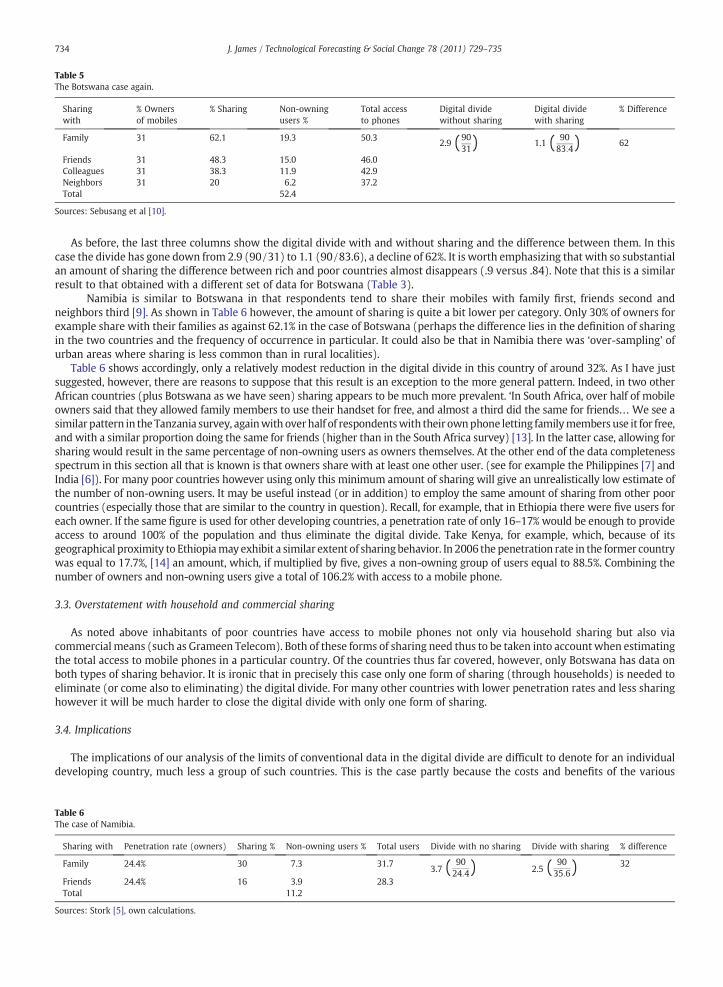
Table 5The Botswana case again.
Sharingwith
% Ownersof mobiles
% Sharing Non-owningusers %
Total accessto phones
Digital dividewithout sharing
Digital dividewith sharing
% Difference
Family 31 62.1 19.3 50.32.9 (90
31) 1.1 ( 9083:4) 62
Friends 31 48.3 15.0 46.0Colleagues 31 38.3 11.9 42.9Neighbors 31 20 6.2 37.2Total 52.4
Sources: Sebusang et al [10].
734 J. James / Technological Forecasting & Social Change 78 (2011) 729–735
As before, the last three columns show the digital divide with and without sharing and the difference between them. In thiscase the divide has gone down from 2.9 (90/31) to 1.1 (90/83.6), a decline of 62%. It is worth emphasizing that with so substantialan amount of sharing the difference between rich and poor countries almost disappears (.9 versus .84). Note that this is a similarresult to that obtained with a different set of data for Botswana (Table 3).
Namibia is similar to Botswana in that respondents tend to share their mobiles with family first, friends second andneighbors third [9]. As shown in Table 6 however, the amount of sharing is quite a bit lower per category. Only 30% of owners forexample share with their families as against 62.1% in the case of Botswana (perhaps the difference lies in the definition of sharingin the two countries and the frequency of occurrence in particular. It could also be that in Namibia there was ‘over-sampling’ ofurban areas where sharing is less common than in rural localities).
Table 6 shows accordingly, only a relatively modest reduction in the digital divide in this country of around 32%. As I have justsuggested, however, there are reasons to suppose that this result is an exception to the more general pattern. Indeed, in two otherAfrican countries (plus Botswana as we have seen) sharing appears to be much more prevalent. ‘In South Africa, over half of mobileowners said that they allowed family members to use their handset for free, and almost a third did the same for friends… We see asimilar pattern in the Tanzania survey, againwith overhalf of respondentswith their ownphone letting familymembers use it for free,and with a similar proportion doing the same for friends (higher than in the South Africa survey) [13]. In the latter case, allowing forsharing would result in the same percentage of non-owning users as owners themselves. At the other end of the data completenessspectrum in this section all that is known is that owners share with at least one other user. (see for example the Philippines [7] andIndia [6]). For many poor countries however using only this minimum amount of sharing will give an unrealistically low estimate ofthe number of non-owning users. It may be useful instead (or in addition) to employ the same amount of sharing from other poorcountries (especially those that are similar to the country in question). Recall, for example, that in Ethiopia there were five users foreach owner. If the same figure is used for other developing countries, a penetration rate of only 16–17% would be enough to provideaccess to around 100% of the population and thus eliminate the digital divide. Take Kenya, for example, which, because of itsgeographical proximity to Ethiopiamay exhibit a similar extent of sharingbehavior. In 2006 the penetration rate in the former countrywas equal to 17.7%, [14] an amount, which, if multiplied by five, gives a non-owning group of users equal to 88.5%. Combining thenumber of owners and non-owning users give a total of 106.2% with access to a mobile phone.
3.3. Overstatement with household and commercial sharing
As noted above inhabitants of poor countries have access to mobile phones not only via household sharing but also viacommercial means (such as Grameen Telecom). Both of these forms of sharing need thus to be taken into account when estimatingthe total access to mobile phones in a particular country. Of the countries thus far covered, however, only Botswana has data onboth types of sharing behavior. It is ironic that in precisely this case only one form of sharing (through households) is needed toeliminate (or come also to eliminating) the digital divide. For many other countries with lower penetration rates and less sharinghowever it will be much harder to close the digital divide with only one form of sharing.
3.4. Implications
The implications of our analysis of the limits of conventional data in the digital divide are difficult to denote for an individualdeveloping country, much less a group of such countries. This is the case partly because the costs and benefits of the various
Table 6The case of Namibia.
Sharing with Penetration rate (owners) Sharing % Non-owning users % Total users Divide with no sharing Divide with sharing % difference
Family 24.4% 30 7.3 31.73.7 ( 90
24:4) 2.5 ( 9035:6) 32
Friends 24.4% 16 3.9 28.3Total 11.2
Sources: Stork [5], own calculations.
735J. James / Technological Forecasting & Social Change 78 (2011) 729–735
alternatives are not well understood. How much for example does policy-making towards IT suffer from a reliance on theconventional measure (eq. seeking to close a divide that does not still exist)? Do the gains from retention of this measure – mostnotably from ease of data collection and availability – outweigh the costs of using it? How high are the costs of gathering sharingdata for a wide cross-section of countries? Much depends on how this information is gathered. It is probably most effectivelyachieved for example if questions about sharing are added on to existing surveys of household expenditure or use of phones. Onehas also to take into account that sharing is in some ways a different phenomenon from using an owned phone, with differentwelfare implications (with regard say to incoming calls).
Depending on the answers to these and other questions one may decide to abandon gap analysis entirely or to argue insteadthat something is better than nothing ( an argument which would apply most forcefully to the internet where sharing as notedtends to be much less prevalent). In any event the study of sharing needs to be extended beyond the small sample considered inthis note (according to some of the quotations listed above there is some reason to believe that our findings are likely to generalizeacross wide regions such as Sub-Saharan Africa and parts of Asia). Note finally that even if information about sharing was widelyavailable it would not cover all the factors that determine the benefits of mobile phones in developing countries. These includespeed, reliability, frequency of use and how much social capital is built up.
3.5. Conclusions
In developed countries the use of mobile phones occurs almost entirely via individual ownership and current measures of thedigital divide assume that the same holds true for developing countries as well. As I have tried to show in this paper, however,much of the use of mobile phones in the latter countries occurs through sharing rather than ownership. This behavior, we saw,takes place in a context which numerous authors refer to as a culture of sharing. My goal has been to present evidence of the formand extent of sharing in selected poor countries and to analyze the implications of this evidence for the size of the digital divide.What I find is that for some of the countries surveyed, under reasonable assumptions, the said divide almost or entirely ceases toexist. In other cases the difference in users between rich and poor countries was substantially reduced. All in all it seems fair toconclude that current estimates – because they exclude non-owning users – heavily overstate the true size of the gap in mobilephones. I also found that in the majority of cases the relevant information about sharing was only partially available. I am referringhere firstly to a lack of data about both forms of sharing described above. Secondly there are only a few cases which estimate theprecise number of users who share the mobile phone with an owner of this technology. Both these limitations will need to beaddressed in future surveys of information technology use in developing countries. Possible implications of our findings involveusing existing surveys to gather more data about sharing and whether to abandon the use of conventional gap analysis in mobilephones.
References
[1] World Economic Forum, The digital networked readiness of nations, 2002-3.[2] J. James, Digital preparedness versus the digital divide: a confusion of means and ends, J. AM. SOC. INF. SCI. TECHNOL. 59 (5) (2008).[3] J. Goodman, Linking mobile phone ownership and use to social capital in rural South Africa and Tanzania, The Vodafone Policy Paper Series, vol. 3, 2005.[4] L. Waverman, M. Meschi, M. Fuss, The impact of telecoms on economic growth in developing countries, The Vodafone Policy Paper series, vol. 3, 2005.[5] G. Myrdal, Asian Drama, Pantheon, 1968.[6] N. Rangaswamy, S. Singh, Personalizing the shared mobile phone, Human–Computer Interaction Institute, 2009.[7] A. Lopez, The South Goes Mobile, UNESCO COURIER, July–August 2000.[8] J. Bongaarts, Fertility & reproductive preferences in post-transitional societies, in: R. Bulatao, J. Casterline (Eds.), Global Fertility Transition, Population
Council, New York, 2001.[9] C. Stork, Namibia, in: A. Gillwald (Ed.), Towards an African E-index: ICT Access & Usage, The LINK Centre, Wits university School of Public & Development
Management, Johannesburg, 2005.[10] J. James, From origins to implications: key aspects in the debate over the Digital Divide, J. INF. TECHNOL. 22 (2007).[11] Vodacom, Fact sheet, August 2008 (available at http://www.web.me.com/reciprocity2/BOP_Lab/publications_files/Vodacom08.pdf).[12] S. Sebusang, S. Masupe, J. Chumai, Botswana, in: A. Gillwald (Ed.), Towards an African E-index: ICT Access & Usage, The LINK Centre, Wits University School of
Public & Development Management, Johannesburg, 2005.[13] J. Samuel, N. Shah, W. Hadingham, Mobile communications in South Africa, Tanzania & Egypt: results from community & business surveys, The Vodafone
Policy Paper Series, vol. 3, March 2005.[14] World Bank, ICT at-a-glance tables.


![ROOTKITS ON SMART PHONES: ATTACKS, IMPLICATIONS, …vinodg/students/jeffreybickford_msthesis.pdfOver 115 million such smart phones were sold worldwide in 2007 [7] with 54.3 million](https://img.pdfslide.us/doc/110x75/5f6ccbafba8adf00110286be/rootkits-on-smart-phones-attacks-implications-vinodgstudentsjeffreybickfordmsthesispdf.jpg)