Embed Size (px)
Citation preview

2021 Half year results presentation
SGS GROUP RESULTS


Disclaimer
Certain matters discussed in this presentation may constitute forward-looking statements that are neither historical facts nor guarantees of future performance. Because these statements involve risks and uncertainties that are beyond control or estimation of SGS, there are important factors that could cause actual results to differ materially from those expressed or implied by these forward-looking statements.
These statements speak only as of the date of this document. Except as required by any applicable law or regulation, SGS expressly disclaims any obligation to release publicly any updates or revisions to any forward-looking statements contained herein to reflect any change in SGS Group’s expectations with regard thereto or any change in events or conditions on which any such statements are based.
1 © SGS SA 2021 all rights reserved.Half year results presentation 19 July 2021

STRONG OPERATING PERFORMANCE DELIVERED ACROSS OUR GLOBAL NETWORK
HIGHLIGHTS FINANCIAL REVIEW BUSINESS REVIEW OUTLOOK Q&A APPENDIX

■ The global situation is improving, but remains challenging in parts of the network
■ Additional measures adopted by Operational Integrity remain in place (work from home, cleaning stations, additional hygiene and disinfection procedures, mask wearing, social distancing)
■ We continue to ensure that Personal Protective Equipment is available globally
■ Crisis Management Teams remain mobilized
Maintaining Covid-19 readinessEmployee safety remains our paramount priority
HIGHLIGHTS FINANCIAL REVIEW BUSINESS REVIEW OUTLOOK Q&A APPENDIX
© SGS SA 2021 all rights reserved.3 Half year results presentation 19 July 2021

A strong start to 2021H1 2021 highlights
FREE CASH FLOW*
CHF 93 MIO (57.7%) +59.1%
ADJUSTED OPERATING INCOME*
CHF 457 MIO +40.6%2
BASIC EARNINGS PER SHARE
CHF 36.29
REVENUE
CHF 3.1 BN + 16.8%¹ +17.9%² +12.4% organic*
* Alternative Performance Measures (APM), refer to the ‘2021 Half Year APM’ document1. Historical currency – 2. Constant currency (CCY) – Definition in APM
2021 | 93
2020 | 220
2021 | 457
2020²| 325
2021 | 36.29
2020 | 22.81
2021 | 3.1
2020²| 2.6
4
HIGHLIGHTS FINANCIAL REVIEW BUSINESS REVIEW OUTLOOK Q&A APPENDIX
© SGS SA 2021 all rights reserved.Half year results presentation 19 July 2021

Continued investment in our strategic priority areasH1 2021 Acquisitions
Division: H&NLocation: United Kingdom
Division: C&PLocation: Netherlands
Division: H&NLocation: Ireland
Division: I&ELocation: France
Division: I&ELocation: Germany
Division: I&ELocation: France
Analytical & Development Services (ADS) International Service Laboratory (ISL) BZH GmbH Deutsches Beratungszentrum für Hygiene (MAJORITY STAKE)
Brightsight MetairAutoscope/CTOK
5
HIGHLIGHTS FINANCIAL REVIEW BUSINESS REVIEW OUTLOOK Q&A APPENDIX
© SGS SA 2021 all rights reserved.Half year results presentation 19 July 2021

■ A number of sustainability milestones achieved in H1 ■ Brightsight materially accelerates our ambition to become the global TIC leader in cybersecurity
■ Digicomply increasingly adopted by food industry leaders ■ Continuing the evolution to globally harmonize Laboratory Information Management Systems (LIMS)
■ World Class Services is progressing well
Strategic progressBecoming a more sustainable, data-driven company
HIGHLIGHTS FINANCIAL REVIEW BUSINESS REVIEW OUTLOOK Q&A APPENDIX
© SGS SA 2021 all rights reserved.Half year results presentation 19 July 20216

OUR OPERATING PERFORMANCE WAS SUPPORTED BY OUR STRONG FINANCIAL DISCIPLINE
HIGHLIGHTS FINANCIAL REVIEW BUSINESS REVIEW OUTLOOK Q&A APPENDIX

A very strong operating performanceH1 2021 financial highlights
(CHF million) June 2021 June 2020Change
in %June 2020
CCY1
Change in CCY 1 %
REVENUE 3 094 2 650 16.8 2 625 17.9
OPERATING INCOME (EBIT) 430 302 42.4 299 43.8
OPERATING INCOME (EBIT) MARGIN 13.9% 11.4% 11.4%
ADJUSTED OPERATING INCOME* 457 330 38.5 325 40.6
ADJUSTED OPERATING INCOME MARGIN* 14.8% 12.5% 12.4%
PROFIT FOR THE PERIOD 290 177 63.8
PROFIT ATTRIBUTABLE TO EQUITY HOLDERS OF SGS SA 272 171 59.1
BASIC EPS (CHF) 36.29 22.81 59.1
CASH FLOW FROM OPERATING ACTIVITIES 342 413 (17.2)
FREE CASH FLOW* 93 220 (57.7)
* Alternative Performance Measures (APM), refer to the ‘2021 Half Year APM’ document1. Constant currency (CCY) – Definition in APM
HIGHLIGHTS FINANCIAL REVIEW
HIGHLIGHTS
BUSINESS REVIEW
OUTLOOK Q&A APPENDIX
8 © SGS SA 2021 all rights reserved.Half year results presentation 19 July 2021

Double-digit organic growthH1 2021 Revenue growth composition
Revenue June 2020
Organic Disposals Currency impact
2 650146325
325
(2) (25)3 094
(0.1%) (1.1%) 16.8% 12.4% 5.6%
Constant currency* 17.9%
Revenue June 2021
Acquisitions
(CHF million)
* Alternative Performance Measures (APM), refer to the ‘2021 Half Year APM’ document
9
HIGHLIGHTS FINANCIAL REVIEW
REVENUE
BUSINESS REVIEW
OUTLOOK Q&A APPENDIX
© SGS SA 2021 all rights reserved.Half year results presentation 19 July 2021

C&P
H&N
I&E
NR
Kn
Total Group
20.0%
13.4%
33.4%
23.1%
10.1%
H&N, C&P and Kn continued to lead organic growth
* Alternative Performance Measures (APM), refer to the ‘2021 Half Year APM’ document1. Constant currency (CCY) – Definition in APM
0.5%
12.4%(0.1%)
11.2%10.0%
20.9%
13.3%
5.6%
26.2%
14.4%
0.4%5.8%
Growth1
H1 2021
13.8%
35.3%
21.2%
5.9%
26.2%
17.9%
Organic* Acquisitions Disposals
H1 2021 Revenue growth¹ by division
(0.3%)
10
HIGHLIGHTS FINANCIAL REVIEW
REVENUE
BUSINESS REVIEW
OUTLOOK Q&A APPENDIX
© SGS SA 2021 all rights reserved.Half year results presentation 19 July 2021

EUROPE/AFRICA/MIDDLE EAST
AMERICAS
ASIA/PACIFIC
Total Group
Strong growth across our global network
Organic* Acquisitions Disposals
10.8%
12.4%
2.2%
10.5%(0.2%)
5.6%
13.1%
14.1%
21.1%
13.1%
16.3%
17.9%
Growth1
H1 2021H1 2021 Revenue growth1 by region
* Alternative Performance Measures (APM), refer to the ‘2021 Half Year APM’ document1. Constant currency (CCY) – Definition in APM
46.9%
18.7%
34.4%
(0.1%)
11
HIGHLIGHTS FINANCIAL REVIEW
REVENUE
BUSINESS REVIEW
OUTLOOK Q&A APPENDIX
© SGS SA 2021 all rights reserved.Half year results presentation 19 July 2021

June 2020
FTE
Acqui. Dispos./ Restr.
3.3% (1.2%)
Remaining organic
4.8%
June 2021
6.8%
86 828 2 826(1 006)
4 204 92 750
Increase: 5 922 6.8%
June 2020
Eur./Afr./Mid. East
Americas Asia/Pacific
June 2021
89 226(505)
2 507 915 92 143
FTE
REVENUE
6.9%
21.1%
(2.8%)
13.1%
2.6%
16.3%
3.3%
17.9%
Increase: 2 917 3.3%
Disciplined workforce managementFTE1 End of period FTE1 Average by region
1. Full Time Equivalent (FTE) Employees 1. Full Time Equivalent (FTE) Employees
(102)
(0.1)%
Cost. Optim.
12
HIGHLIGHTS FINANCIAL REVIEW
REVENUE
BUSINESS REVIEW
OUTLOOK Q&A APPENDIX
© SGS SA 2021 all rights reserved.Half year results presentation 19 July 2021

H1 2021 Adjusted operating income* (CHF million)
Adj. op. inc. June 2020
Organic Acquisitions Disposals Currency impact
Adj. op. inc. June 2021
330
12121(1) (5)
457
(0.3%) (2.1%) 38.5% 37.2% 3.7%
Constant currency* 40.6%
Very strong AOI growth
12.5%
14.8%
* Alternative Performance Measures (APM), refer to the ‘2021 Half Year APM’ document
HIGHLIGHTS FINANCIAL REVIEW
ADJUSTED OPERATING INCOME
BUSINESS REVIEW
OUTLOOK Q&A APPENDIX
13 © SGS SA 2021 all rights reserved.Half year results presentation 19 July 2021

The integration of SGS Analytics progressing according to schedule(former A&S division of Synlab) integration is expected to unlock cost synergies of CHF 20 million
2021 2022 2023H1 H2 H1 H2 H1 H2
Integration Management Team Mgt. Team
Branding Communications Communications
Rebranding
Website & Media
Human Resources Insurance, Benefits Systems
Finance Treasury, Proc., CRE
Tax, NWC management, Internal Controls
Controlling & Reporting, FSSC implementation
Information Technology TSA IT Services
Network, Workspace, ERP Germany & Nordics ERP Benelux, UK
Infrastructure
LIMS Nordics, Germany LIMS Benelux, UK LIMS Finland, France
Legal Liability & Risk mgt. Legal Entity consolidation
Operational Integrity Onboarding OI personnel gap analysis & launch OI Integration program
Bd/Sales & Delivery BD / Sales
Hub & Spoke model integration
H&N footprint consolidation
I&E footprint consolidation
14 © SGS SA 2021 all rights reserved.Half year results presentation 19 July 2021
HIGHLIGHTS FINANCIAL REVIEW
ADJUSTED OPERATING INCOME
BUSINESS REVIEW
OUTLOOK Q&A APPENDIX

BUILDERS ORGANIZATION OUR FRAMEWORK OUR PROGRESS
Objectives and Key Results (OKR) is a method to manage goals and performance. It is a framework that combines strategies and results and helps to optimize processes, promote employees and drive change.
■ Combines vision, mission, values and strategy with day-to-day work
■ Establishes objectives and enables the best use of resources
■ Helps to set and track the right priorities
■ Accelerates time to implementation
■ Creates transparency and improves communication
■ Encourages an autonomous work environment
■ FSSC on-boarding (incl. Group standard ERP) for Nordics, Germany (A&S) and Southern Africa
■ Go – live of centralized billing in India and Mexico & centralizing cash collection for Spain
■ Global roll-out of the standardized, fully integrated and digitalized 3rd party certification system (until Q1 2022) for Knowledge
■ Design of the CORE for the digital lab model for the Environment, Food and Life lab testing activities
■ Four laboratories passed their first WCS (World Class Services) audit
Level up initiative
DESIGN
BUILD EXTERNAL DELIVERYPARTNERS
INTEGRATION LAYER
SGS DIGITALASSETS
BUSINESSANALYST
ITEXPERTS
ITENGINEERS
AGILEPROFILES
ITCOMMUNITY
PRODUCTA
PRODUCTB
PRODUCTC
PRODUCTD
BUSINESSCOMMUNITY
© SGS SA 2021 all rights reserved.Half year results presentation 19 July 2021
HIGHLIGHTS FINANCIAL REVIEW
ADJUSTED OPERATING INCOME
BUSINESS REVIEW
OUTLOOK Q&A APPENDIX
15

0
5
10
15
20
25
30
C&P H&N I&E NR Kn Total Group
Overall improved divisional margin performance
* Alternative Performance Measures (APM), refer to the ‘2021 Half Year APM’ document1. Constant currency (CCY) – Definition in APM
H1 2021 Adjusted operating income margin1,*
23.0%21.4%
10.8%
15.5%
6.5%
9.6%
14.1%12.6%
10.5%
19.8%
12.4%
14.8%
HY 2021 HY 2020
16 © SGS SA 2021 all rights reserved.Half year results presentation 19 July 2021
HIGHLIGHTS FINANCIAL REVIEW
ADJUSTED OPERATING INCOME
BUSINESS REVIEW
OUTLOOK Q&A APPENDIX

H1 2021 Consolidated balance sheet
* Alternative Performance Measures (APM), refer to the ‘2021 Half Year APM’ document
Assets
(CHF million) June 2021 December 2020
Property, plant and equipment 914 872Right-of-use assets 632 590Goodwill 1 774 1 651Other intangible assets 372 333Investments in joint ventures, associates and other companies 35 34Deferred tax assets 172 161Other non-current assets 167 154
NON-CURRENT ASSETS 4 066 3 795
Inventories 59 57Unbilled revenues and work in progress 207 160Trade receivables 951 856Other receivables and prepayments 257 188Current tax assets 105 77Marketable securities 8 9Cash and cash equivalents 1 169 1 766CURRENT ASSETS 2 756 3 113TOTAL 6 822 6 908NET DEBT* (2 085) (1 478)
Equity and liabilities
(CHF million) June 2021 December 2020
Equity holder of SGS SA 861 1 060Non-controlling interests 95 74EQUITY 956 1 134Loans and other financial liabilities 2 928 2 390Lease liabilities 502 470Deferred tax liabilities 64 53Defined benefit obligations 98 136Provisions 93 88NON-CURRENT LIABILITIES 3 685 3 137
Loans and other financial liabilities 334 863Lease liabilities 165 151Trade and other payables 690 658Provisions 67 85Current tax liabilities 154 140Contract liabilities 234 189Other creditors and accruals 537 551CURRENT LIABILITIES 2 181 2 637TOTAL 6 822 6 908
HIGHLIGHTS FINANCIAL REVIEW
BALANCE SHEET
BUSINESS REVIEW
OUTLOOK Q&A APPENDIX
17 © SGS SA 2021 all rights reserved.Half year results presentation 19 July 2021

H1 2021 Condensed cash flow
(CHF million) June 2021 June 2020
PROFIT FOR THE PERIOD 290 177 Non-cash and non-operating items 404 361 (Increase) in working capital (202) –Taxes paid (150) (125)CASH FLOW FROM OPERATING ACTIVITIES 342 413 Net purchase of fixed assets (147) (103)Acquisition of businesses (103) (23)Proceeds from sales of businesses – 71 Increase in interest received and other 9 4 CASH FLOW USED BY INVESTING ACTIVITIES (241) (51)Dividends paid to equity holders of SGS SA (599) (598)Dividends paid to non-controlling interests (4) (2)Transaction with non-controlling interests (11) –Cash paid on treasury shares – (189)Proceeds from corporate bonds 817 499 Payment of corporate bonds (276) –Interest paid (38) (41)Payment of lease liabilities (91) (80)Proceeds from borrowings 44 –Payment of borrowings (553) –CASH FLOW USED BY FINANCING ACTIVITIES (711) (411)Currency translation 13 (15)DECREASE IN CASH AND CASH EQUIVALENTS (597) (64)
* Alternative Performance Measures (APM), refer to the ‘2021 Half Year APM’ document
(CHF million) June 2021 June 2020
CASH FLOW FROM OPERATING ACTIVITIES 342 413 Purchase of property, plant and equipment and other intangible assets (150) (108)Disposal of property, plant and equipment and other intangible assets 3 5 Operating lease outflows (102) (90)FREE CASH FLOW* 93 220
HIGHLIGHTS FINANCIAL REVIEW
CASH FLOW
BUSINESS REVIEW
OUTLOOK Q&A APPENDIX
18 © SGS SA 2021 all rights reserved.Half year results presentation 19 July 2021

-20
-10
0
50
100
150
200
250
HY2018 HY2019 HY2020 HY2021
-1%
-2%
0%
1%
2%
3%
4%
5%
Working capital normalizing following H1 2020
* Alternative Performance Measures (APM), refer to the ‘2021 Half Year APM’ document
Operating Net Working Capital (CHF million) In % of Revenue
Operating net working capital* in % of LTM revenue
3.5%
2.9%
(0.1%)(0.2%)
196
233
(4)
(12)
Negative Operating Net Working Capital in Half Year 2021 driven by:
■ EVA performance management ■ Centralized cash collection ■ Centralized in-country billing projects
HIGHLIGHTS FINANCIAL REVIEW
CASH FLOW
BUSINESS REVIEW
OUTLOOK Q&A APPENDIX
19 © SGS SA 2021 all rights reserved.Half year results presentation 19 July 2021

0
25
50
75
100
125
150
175
200
HY2018 HY2019 HY2020 HY2021
5%
4%
3%
2%
1%
0%
Accelerating our investment in strategic priority areasCapex in % of revenue Capital expenditure by business
Capital Expenditure (Capex) In % of Revenue
(CHF million)
144
108
150130
4.4%
3.9%
4.1%
4.8%
CHF 150 MIO
2%Kn
17%H&N
29%I&E
28%C&P
24%NR
HIGHLIGHTS FINANCIAL REVIEW
CASH FLOW
BUSINESS REVIEW
OUTLOOK Q&A APPENDIX
20 © SGS SA 2021 all rights reserved.Half year results presentation 19 July 2021
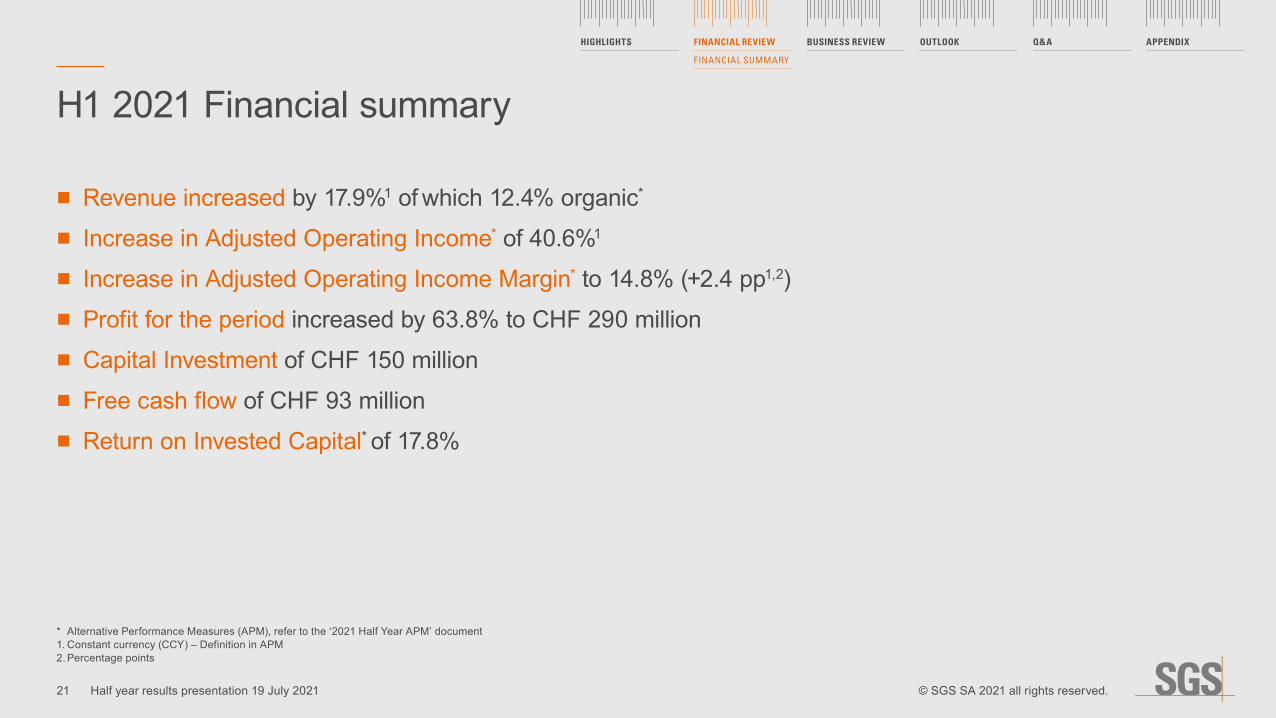
* Alternative Performance Measures (APM), refer to the ‘2021 Half Year APM’ document1. Constant currency (CCY) – Definition in APM2. Percentage points
■ Revenue increased by 17.9%1 of which 12.4% organic*
■ Increase in Adjusted Operating Income* of 40.6%1
■ Increase in Adjusted Operating Income Margin* to 14.8% (+2.4 pp1,2) ■ Profit for the period increased by 63.8% to CHF 290 million ■ Capital Investment of CHF 150 million ■ Free cash flow of CHF 93 million ■ Return on Invested Capital* of 17.8%
H1 2021 Financial summary
HIGHLIGHTS FINANCIAL REVIEW
FINANCIAL SUMMARY
BUSINESS REVIEW
OUTLOOK Q&A APPENDIX
21 © SGS SA 2021 all rights reserved.Half year results presentation 19 July 2021

BUSINESS REVIEW
HIGHLIGHTS FINANCIAL REVIEW BUSINESS REVIEW OUTLOOK Q&A APPENDIX

Overview ■ Organic growth of 13.3% supported by post-pandemic
recovery and investment in Connectivity ■ Excellent performance in all Connectivity activities ■ Solid growth in Softlines from retailers and brands ■ Full recovery from Hardlines in Hardgoods and Toys.
Improving market conditions for Auto Laboratories ■ Trade Facilitation services benefiting from eCustoms services
in Europe following Brexit ■ Strategic milestone acquisition of Brightsight cybersecurity
evaluation laboratory
Outlook ■ Growth expected to continue in H2 ■ Connectivity to be the major growth driver benefiting
from new capabilities and capacity. Newly acquired Brightsight to make a positive impact
■ Solid activity level expected to continue in Softlines from retailers and brands, but lower PPE volumes
■ Hardgoods remains the growth driver of Hardlines, while Auto Laboratories should improve
■ Solid growth expected from eCustoms solutions and improvement of PCA volumes in Trade Facilitation services
Leveraging our long-term strategic investmentConnectivity & Products (C&P)
(CHF million) June 2021 June 20202 Change in %June 2020
CCY1Change in
CCY %1
REVENUE 618 547 13.0 543 13.8 ADJUSTED OPERATING INCOME*
142 116 22.4 116 22.4
MARGIN %* 23.0 21.2 21.4
* Alternative Performance Measures (APM), refer to the ‘2021 Half Year APM’ document1. Constant currency (CCY) – Definition in APM – 2. See note 2 on Segment information restatement of the HY 2021 Press Release
23
HIGHLIGHTS FINANCIAL REVIEW BUSINESS REVIEW OUTLOOK Q&A APPENDIX
Half year results presentation 19 July 2021 © SGS SA 2021 all rights reserved.

Overview ■ Organic growth at 20.9% with double-digit growth in all SBUs
and all geographies ■ Food growth was driven by new regulations and an expanded
client base ■ Health Science grew well above the divisional average
boosted by Covid-19 vaccines ■ Cosmetics & Hygiene grew in line with the organic divisional
average benefiting from a strong rebound in activity
Outlook ■ Strong performance to continue in H2 ■ Covid-19 rebound to continue but growth to
ease versus strong Q4 comparatives ■ Health Science and Food to lead the growth
supported by outsourcing and regulations ■ Momentum to continue in Cosmetics & Hygiene
led by strong demand in the USA ■ Continued integration of acquired companies
and a solid pipeline of potential targets
A very strong performance across the global portfolioHealth & Nutrition (H&N)
(CHF million) June 2021 June 20202 Change in %June 2020
CCY1Change in
CCY %1
REVENUE 414 306 35.3 306 35.3 ADJUSTED OPERATING INCOME*
64 33 93.9 33 93.9
MARGIN %* 15.5 10.8 10.8
* Alternative Performance Measures (APM), refer to the ‘2021 Half Year APM’ document1. Constant currency (CCY) – Definition in APM – 2. See note 2 on Segment information restatement of the HY 2021 Press Release
24
HIGHLIGHTS FINANCIAL REVIEW BUSINESS REVIEW OUTLOOK Q&A APPENDIX
Half year results presentation 19 July 2021 © SGS SA 2021 all rights reserved.

Overview ■ Organic growth of 10.0% driven by a strong rebound across
Europe, Asia and Latin America ■ Field services and Inspection growth was above divisional
average supported by renewables projects ■ Industrial and Public Health and Safety outperformed, fueled
by the industrial safety laboratory network ■ Technical Assessment and Advisory benefited from a good
volume of projects and a strong performance from recently acquired Ryobi Geotechnique
Outlook ■ Acceleration of energy transition and infrastructure
improvement trends will foster growth ■ Some recovery expected in existing O&G related services
due to a favorable oil price and increasing demand ■ Strong focus on scalable bolt-on acquisitions ■ Synlab A&S integration on track delivering operational
synergies and the expansion of Hub and Spoke model
Growth accelerated through H1Industries & Environment (I&E)
(CHF million) June 2021 June 20202 Change in %June 2020
CCY1Change in
CCY %1
REVENUE 1 033 859 20.3 852 21.2 ADJUSTED OPERATING INCOME*
99 55 80.0 55 80.0
MARGIN %* 9.6 6.4 6.5
* Alternative Performance Measures (APM), refer to the ‘2021 Half Year APM’ document1. Constant currency (CCY) – Definition in APM – 2. See note 2 on Segment information restatement of the HY 2021 Press Release
25
HIGHLIGHTS FINANCIAL REVIEW BUSINESS REVIEW OUTLOOK Q&A APPENDIX
Half year results presentation 19 July 2021 © SGS SA 2021 all rights reserved.

Overview ■ Natural Resources grew by 5.8% organically ■ Trade & Inspection grew moderately ■ High single-digit growth in Minerals commodities offset the
impact from lower oil demand and poor crop season in most European countries
■ Double-digit growth in Laboratory testing boosted by surge in exploration sample volumes
■ Metallurgy and Consulting benefited from 2020 project delays
Outlook ■ Mineral commodities to maintain momentum ■ Improving crop season for AGRI commodities ■ OGC Commodities volumes dependent on recovery ■ Strong activity to continue in commercial and onsite
laboratory testing ■ Solid pipeline for Metallurgy and Consulting ■ Launch of Smart Warehouse, a digital solution for cargo
condition monitoring
Strong momentum in Minerals partially offset by O&G and AGRINatural Resources (NR)
(CHF million) June 2021 June 20202 Change in %June 2020
CCY1Change in
CCY %1
REVENUE 716 689 3.9 676 5.9 ADJUSTED OPERATING INCOME*
90 100 (10.0) 95 (5.3)
MARGIN %* 12.6 14.5 14.1
* Alternative Performance Measures (APM), refer to the ‘2021 Half Year APM’ document1. Constant currency (CCY) – Definition in APM – 2. See note 2 on Segment information restatement of the HY 2021 Press Release
26
HIGHLIGHTS FINANCIAL REVIEW BUSINESS REVIEW OUTLOOK Q&A APPENDIX
Half year results presentation 19 July 2021 © SGS SA 2021 all rights reserved.

Overview ■ Knowledge organic growth at 26.2% with excellent
performance in Certification across geographies ■ Management System Certification grew above divisional
level, driven by postponed work, recertification and increased demand for Food and Information Security Certification
■ Consulting and Training grew below the divisional average due to slower market recovery
Outlook ■ Growth to moderate in H2 as the benefit from the post-
lockdown Audit catch-up is completed ■ ESG Assurance Solutions and Supplier Risk Management
services to generate new revenue streams ■ Continued roll-out of CertIQ, the new Knowledge Certification
platform, which will further digitalize our audit data and drive efficiencies
An excellent performance in CertificationKnowledge (Kn)
(CHF million) June 2021 June 20202 Change in %June 2020
CCY1Change in
CCY %1
REVENUE 313 249 25.7 248 26.2 ADJUSTED OPERATING INCOME*
62 26 138.5 26 138.5
MARGIN %* 19.8 10.4 10.5
* Alternative Performance Measures (APM), refer to the ‘2021 Half Year APM’ document1. Constant currency (CCY) – Definition in APM – 2. See note 2 on Segment information restatement of the HY 2021 Press Release
27
HIGHLIGHTS FINANCIAL REVIEW BUSINESS REVIEW OUTLOOK Q&A APPENDIX
Half year results presentation 19 July 2021 © SGS SA 2021 all rights reserved.

OUTLOOK
HIGHLIGHTS FINANCIAL REVIEW BUSINESS REVIEW OUTLOOK Q&A APPENDIX

■ Solid organic* growth normalizing for the impact of Covid-19 ■ Improving the adjusted operating income margin* ■ Strong cash conversion ■ Maintaining best-in-class organic return on invested capital* ■ Accelerating investment into our strategic focus areas with M&A as a key enabler
■ At least maintaining or growing the dividend
Guidance 2021
* Alternative Performance Measures (APM), refer to the ‘2021 Half Year APM’ document
HIGHLIGHTS FINANCIAL REVIEW BUSINESS REVIEW OUTLOOK Q&A APPENDIX
29 Half year results presentation 19 July 2021 © SGS SA 2021 all rights reserved.

Mid-term targets 2020-2023
PLANET PERFORMANCE PEOPLE
Reducing our CO2 emissionsSupport the transition to a low-carbon world by meeting our Science-based Target of reducing our CO2 emissions per revenue by 35%¹
High single-digit constant currency revenue CAGRDriven by mid-single-digit organic growth p.a. and a focus on M&A
Ensuring DiversityNurture diversity and inclusion based on merit by ensuring equal opportunity to all employees and evolving our gender diversity to 30% women in leadership at CEO-3 positions and above
Sustainability SolutionsSupport our customers on their journey to sustainability by increasing the proportion of revenue generated by our sustainability solutions to above 50%
> 10% Adjusted Operating Income CAGR World Class Service (WCS)Promote a culture of operational safety, efficiency and excellence through our WCS program: 20% of our WCS labs (2020 perimeter) reaching WCS Bronze award level
Integrity PrinciplesReduce the impact that our supply chain has on society by achieving 100% of our strategic suppliers trained on our integrity principles
Strong EVA discipline Supporting personal developmentSupport the personal development of our employees by increasing the completion rate of job-related training by 10%²
Energy EfficiencyIncreasing annually the number of energy efficiency measures in our 100 most energy intensive owned buildings
Maintain or grow the Dividend Per Share Positive impact on communitiesIncrease by 10%² our positive impact on our communities through employee volunteering, focusing on vulnerable groups including those affected by pandemics
1. Against a 2014 baseline 2. Against a 2019 baseline
HIGHLIGHTS FINANCIAL REVIEW BUSINESS REVIEW OUTLOOK Q&A APPENDIX
30 Half year results presentation 19 July 2021 © SGS SA 2021 all rights reserved.

Q&A
HIGHLIGHTS FINANCIAL REVIEW BUSINESS REVIEW OUTLOOK Q&A APPENDIX

TO REGISTER FOR QUESTIONS PRESS * AND 1 ON YOUR TELEPHONE
HIGHLIGHTS FINANCIAL REVIEW BUSINESS REVIEW OUTLOOK Q&A APPENDIX

APPENDIX
HIGHLIGHTS FINANCIAL REVIEW BUSINESS REVIEW OUTLOOK Q&A APPENDIX

CAGR Compound Annual Growth Rate
CAPEX Capital Expenditure ESG Environmental, Social and Governance
EVA Economic Value Added
FTE Full Time Equivalent Employees
NWC Net Working Capital
PCA Product Conformity Assessment
PPE Personal Protective Equipment
OGC Oil, Gas and Chemicals
O&G Oil and Gas
SBU Strategic Business Unit
LTM Last Twelve Months
Acronyms and other abbreviations
34
HIGHLIGHTS FINANCIAL REVIEW BUSINESS REVIEW OUTLOOK Q&A APPENDIX
Half year results presentation 19 July 2021 © SGS SA 2021 all rights reserved.

Long-term shareholder value creation
H1 REVENUE CHF BN2021 | 3.1
2020 | 2.6
2019 | 3.3
2018 | 3.3
2017 | 3.0
H1 RETURN ON INVESTED CAPITAL* %2021 | 17.8
2020 | 18.7
2019 | 23.7
2018 | 20.8
2017 | 19.4
H1 ADJUSTED OPERATING INCOME* CHF MIO 2021 | 457
2020 | 330
2019 | 489
2018 | 481
2017 | 428
H1 FREE CASH FLOW* CHF MIO
2021 | 93
2020 | 220
2019 | 216
2018 | 176
2017 | 210
H1 NET PROFIT CHF MIO 2021 | 290
2020 | 177
2019 | 399
2018 | 296
2017 | 293
* Alternative Performance Measures (APM), refer to the ‘2021 Half Year APM’ document
35
HIGHLIGHTS FINANCIAL REVIEW BUSINESS REVIEW OUTLOOK Q&A APPENDIX
Half year results presentation 19 July 2021 © SGS SA 2021 all rights reserved.

1. Constant currency (CCY) – Definition in APM
H1 2021 revenue portfolio
A well-balanced portfolio
33.4%I&E
20.0%C&P
23.1%NR
13.4%H&N
10.1%Kn
Change1
0.8%
1.7%
0.9%
Change1
(2.7%)
(0.7%)
36
HIGHLIGHTS FINANCIAL REVIEW BUSINESS REVIEW OUTLOOK Q&A APPENDIX
Half year results presentation 19 July 2021 © SGS SA 2021 all rights reserved.

H1 2021 adjusted operating income* portfolio
* Alternative Performance Measures (APM), refer to the ‘2021 Half Year APM’ document1. Constant currency (CCY) – Definition in APM
A well-balanced portfolio
Change1 Change1
31.1%C&P
21.7%I&E
19.7%NR
14.0%H&N
13.5%Kn 5.5%
3.8%
(4.6%)
(9.5%)
4.8%
37
HIGHLIGHTS FINANCIAL REVIEW BUSINESS REVIEW OUTLOOK Q&A APPENDIX
Half year results presentation 19 July 2021 © SGS SA 2021 all rights reserved.

EUR, USD and CNY represent 52% of 2021 revenueH1 2021 foreign currency revenues
27.5%EUR
29.2%OTHER
1.9%RUB
3.0%GBP
15.4%CNY
2.1%KRW
3.4%CAD
2.0%CLP
8.8%USD
2.4%AUD
4.3%TWD
38
HIGHLIGHTS FINANCIAL REVIEW BUSINESS REVIEW OUTLOOK Q&A APPENDIX
Half year results presentation 19 July 2021 © SGS SA 2021 all rights reserved.

-20%
-15%
-10%
-5%
0%
5%
10%
Main currencies’ variation against CHF in H1 2021Foreign currency average rate change H1 2021 versus H1 2020 rate
1.0943 0.1403 0.9081 0.0324 0.7279 1.2601 0.7002 0.0008 0.0013 0.01221.0645 0.1374 0.9664 0.0322 0.7092 1.2192 0.6358 0.0008 0.0012 0.01402.8% 2.1% (6.0%) 0.6% 2.6% 3.4% 10.1% 1.4% 6.0% (12.6%)
EUR CNY USD TWD CAD GBP AUD KRW CLP RUB June 2021
June 2020
Change
2.8% 2.1%
(6.0)%
0.6%2.6% 3.4%
10.1%
6.0%
1.4%
(12.6)%
39
HIGHLIGHTS FINANCIAL REVIEW BUSINESS REVIEW OUTLOOK Q&A APPENDIX
Half year results presentation 19 July 2021 © SGS SA 2021 all rights reserved.

Investor relations information and events dates
SGS SA CORPORATE OFFICE 1 place des Alpes P.O. Box 2152 CH – 1211 Geneva 1 t +41 (0)22 739 91 11 f +41 (0)22 739 98 86 e [email protected]
INVESTOR AND MEDIA RELATIONSToby Reeks SGS SA 1 place des Alpes P.O. Box 2152 CH – 1211 Geneva 1 t +41 (0)22 739 99 87 m +41 (0)79 641 83 02
STOCK EXCHANGE TRADINGSIX Swiss Exchange
COMMON STOCK SYMBOLSBloomberg: Registered Share: SGSN.SW Reuters: Registered Share: SGSN.S Telekurs: Registered Share: SGSN ISIN: Registered Share: CH0002497458 Swiss security number: 249745
STOCK EXCHANGE LISTINGSIX Swiss Exchange, SGSN
INVESTOR DAYS November 2022
2021 FULL YEAR RESULTSThursday, 27 January 2022
ANNUAL GENERAL MEETING OF SHAREHOLDERSTuesday, 29 March 2022 Geneva, Switzerland
40
HIGHLIGHTS FINANCIAL REVIEW BUSINESS REVIEW OUTLOOK Q&A APPENDIX
Half year results presentation 19 July 2021 © SGS SA 2021 all rights reserved.


www.sgs.com SGS is a registered trademark of SGS Société Générale de Surveillance SA