Embed Size (px)
Citation preview

JUNE 2017
201620172016201720162017
20162017
20162017
20162017
2017HALF YEAR RESULTS
CHF 3.0 BN
+4.9%1
CHF 428 MIO
+4.9%1
CHF 293 MIO
+5.8%
14.1%
CHF 210 MIO
-13.2%
CHF 36.58+7.5%
2.913.0 4081428277
29314.1%114.1%
34.0236.58 242 210
REVENUEADJUSTED OPERATING INCOME2
ADJUSTED OPERATING MARGIN2 PROFIT FOR THE PERIOD
BASIC EARNINGS PER SHARE FREE CASH FLOW3
1. Constant currency basis. – 2. Before amortisation of acquisition intangibles and other non-recurring items. – 3. Cash flow from operating activities net of capital expenditure.


3
FINANCIAL HIGHLIGHTS
(CHF million) JUNE 2017JUNE 2016
PRO-FORMA1 JUNE 2016
REVENUE 3 047 2 904 2 901
Change in % 4.9 5.0
ADJUSTED EBITDA2 570 547 550
Change in % 4.2 3.6
ADJUSTED OPERATING INCOME2 428 408 411
Change in % 4.9 4.3
ADJUSTED OPERATING MARGIN IN %2 14.1 14.1 14.2
OPERATING INCOME (EBIT) 410 391 394
Change in % 4.9 4.1
PROFIT FOR THE PERIOD 293 274 277
Change in % 6.9 5.8
PROFIT ATTRIBUTABLE TO EQUITY HOLDERS OF SGS SA 276 256 258
Change in % 7.8 7.0
ADJUSTED PROFIT ATTRIBUTABLE TO EQUITY HOLDERS OF SGS SA2 293 272 274
Change in % 7.7 6.9
ADJUSTED BASIC EPS (CHF)2 38.88 35.83 36.13
BASIC EPS (CHF) 36.58 33.71 34.02
DILUTED EPS (CHF) 36.51 33.67 33.99
FREE CASH FLOW3 210 242
(NET DEBT) (1 136) (990)
WEIGHTED AVERAGE NUMBER OF SHARES ('000) 7 540 7 593
AVERAGE NUMBER OF EMPLOYEES 92 065 88 376
1. Constant currency basis.2. Before amortisation of acquisition intangibles and other non-recurring items. 3. Cash flow from operating activities net of capital expenditure.
4
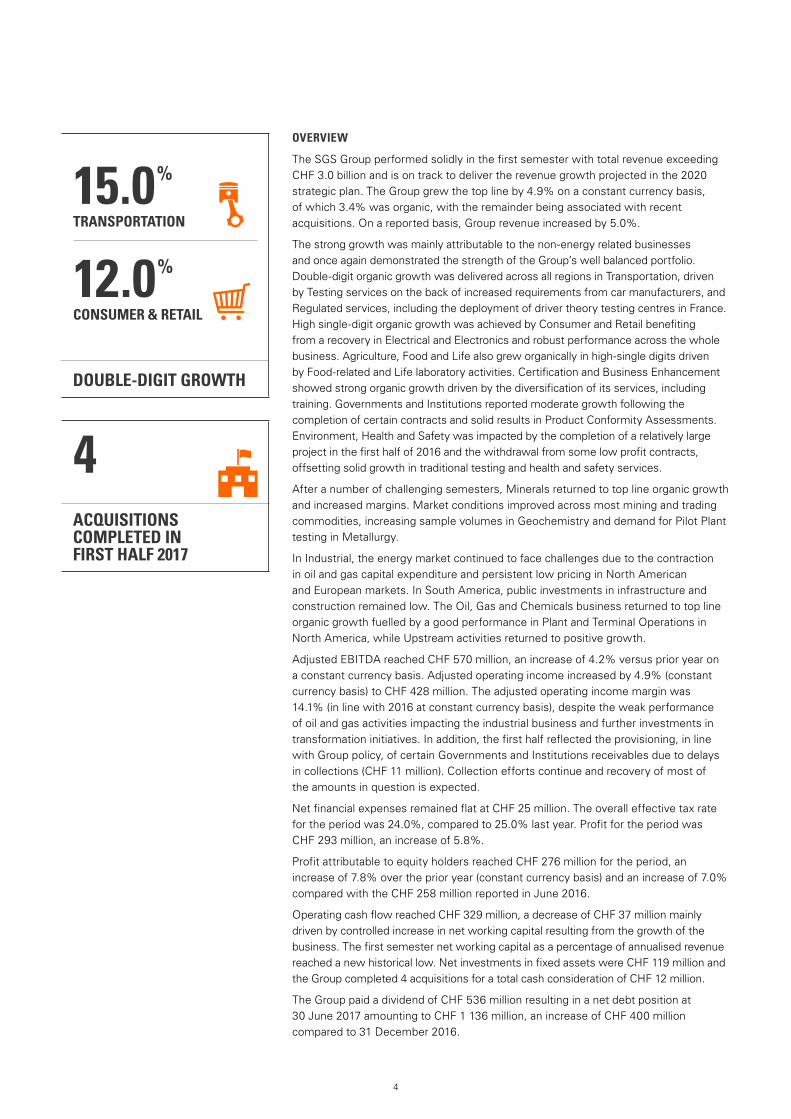
ACQUISITIONS COMPLETED IN FIRST HALF 2017
DOUBLE-DIGIT GROWTH
4
15.0%
TRANSPORTATION
12.0%
CONSUMER & RETAIL
OVERVIEW
The SGS Group performed solidly in the first semester with total revenue exceeding CHF 3.0 billion and is on track to deliver the revenue growth projected in the 2020 strategic plan. The Group grew the top line by 4.9% on a constant currency basis, of which 3.4% was organic, with the remainder being associated with recent acquisitions. On a reported basis, Group revenue increased by 5.0%.
The strong growth was mainly attributable to the non-energy related businesses and once again demonstrated the strength of the Group’s well balanced portfolio. Double-digit organic growth was delivered across all regions in Transportation, driven by Testing services on the back of increased requirements from car manufacturers, and Regulated services, including the deployment of driver theory testing centres in France. High single-digit organic growth was achieved by Consumer and Retail benefiting from a recovery in Electrical and Electronics and robust performance across the whole business. Agriculture, Food and Life also grew organically in high-single digits driven by Food-related and Life laboratory activities. Certification and Business Enhancement showed strong organic growth driven by the diversification of its services, including training. Governments and Institutions reported moderate growth following the completion of certain contracts and solid results in Product Conformity Assessments. Environment, Health and Safety was impacted by the completion of a relatively large project in the first half of 2016 and the withdrawal from some low profit contracts, offsetting solid growth in traditional testing and health and safety services.
After a number of challenging semesters, Minerals returned to top line organic growth and increased margins. Market conditions improved across most mining and trading commodities, increasing sample volumes in Geochemistry and demand for Pilot Plant testing in Metallurgy.
In Industrial, the energy market continued to face challenges due to the contraction in oil and gas capital expenditure and persistent low pricing in North American and European markets. In South America, public investments in infrastructure and construction remained low. The Oil, Gas and Chemicals business returned to top line organic growth fuelled by a good performance in Plant and Terminal Operations in North America, while Upstream activities returned to positive growth.
Adjusted EBITDA reached CHF 570 million, an increase of 4.2% versus prior year on a constant currency basis. Adjusted operating income increased by 4.9% (constant currency basis) to CHF 428 million. The adjusted operating income margin was 14.1% (in line with 2016 at constant currency basis), despite the weak performance of oil and gas activities impacting the industrial business and further investments in transformation initiatives. In addition, the first half reflected the provisioning, in line with Group policy, of certain Governments and Institutions receivables due to delays in collections (CHF 11 million). Collection efforts continue and recovery of most of the amounts in question is expected.
Net financial expenses remained flat at CHF 25 million. The overall effective tax rate for the period was 24.0%, compared to 25.0% last year. Profit for the period was CHF 293 million, an increase of 5.8%.
Profit attributable to equity holders reached CHF 276 million for the period, an increase of 7.8% over the prior year (constant currency basis) and an increase of 7.0% compared with the CHF 258 million reported in June 2016.
Operating cash flow reached CHF 329 million, a decrease of CHF 37 million mainly driven by controlled increase in net working capital resulting from the growth of the business. The first semester net working capital as a percentage of annualised revenue reached a new historical low. Net investments in fixed assets were CHF 119 million and the Group completed 4 acquisitions for a total cash consideration of CHF 12 million.
The Group paid a dividend of CHF 536 million resulting in a net debt position at 30 June 2017 amounting to CHF 1 136 million, an increase of CHF 400 million compared to 31 December 2016.

5
ACQUISITIONS AND STRATEGIC PARTNERSHIPS
The Group completed 4 acquisitions in the first semester of 2017. These acquisitions expand the Group’s service offering and footprint in Agriculture, Food and Life, Consumer and Retail and Industrial. Combined, these companies have added CHF 4 million to the Group’s revenue and CHF 1 million to the operating income in the first half of 2017.
These acquisitions include, BF Machinery Pty and CBF Engineering Pty Ltd in Australia, providing testing, repair, engineering and maintenance services for pumps, valves, hydraulics and plastics systems; Laboratoire LCA in Morocco, providing analytical services, including soil fertility testing, to the agricultural sector; ILC Micro-Chem Inc. in Canada, providing microbiology and food chemistry testing services specialising in the analysis of raw food materials, finished food products and environmental swabs for the food manufacturing industry; and Harrison Research Laboratories Inc. in the USA, offering services to the cosmetic and personal care industry including sunscreen and dermal patch testing as well as safety, efficacy and claims substantiation support testing.
In support of the Testing, Inspection and Certification (TIC) 4.0 strategic initiative on digitalisation and data, the Group made an investment in Sensima Inspection in Switzerland. The business provides testing services and equipment using a proprietary core technology based on electromagnetic response measurements for non-destructive testing applications.
SUBSEQUENT EVENTS
The following acquisitions were made after the close of the period: SGS Leicester Ltd., a UKAS-accredited textile testing laboratory performing physical, chemical and flammability testing services for the garment industry in the United Kingdom; and Central Illinois Grain Inspection Inc., a USDA licensed agency inspecting grains and by-products for export and domestic quality settlements with growers in the USA.
MANAGEMENT
Fabrice Egloff, the former Managing Director of France, has been appointed to the Operations Council as Chief Operating Officer (COO) of Africa. Fred Herren, who previously held the post of COO of Africa, has taken over the role of Senior Vice President of Digital and Innovation, a newly created position.
José María Hernández-Sampelayo, the former Managing Director of Spain, has been promoted to the position of Senior Vice President of Human Resources and has joined the Operations Council.
SIGNIFICANT SHAREHOLDERS
As at 30 June 2017, Groupe Bruxelles Lambert acting through Serena SARL held 16.20%. Mr. August von Finck and members of his family acting in concert held 15.03% and BlackRock, Inc. held 3.03% of the share capital and voting rights of the Company.
At the same date, SGS Group held 3.60% of the share capital of the Company.
GUIDANCE 2017
The Group expects to deliver solid organic revenue growth and higher adjusted operating income on a constant currency basis, and a continuation of its robust cash flow generation.
OUTLOOK 2020
The Group remains committed to the objectives of its 2020 plan, which are:
• To average mid single-digit organic growth, with improvement over the period underpinned by the new structure and new strategic initiatives.
• To accelerate Mergers and Acquisition activities with acquired revenue in the range of CHF 1 billion over the 2016-2020 period.
• To achieve an adjusted operating income margin of at least 18% by the end of the period bolstered by efficiency improvement initiatives and improved pricing.
• To ensure strong cash conversion.
• To see robust returns on invested capital.
• To offer solid dividend distributions, in line with the improvement in net earnings.
17 July 2017
Sergio Marchionne Chairman of the Board
Frankie Ng Chief Executive Officer

6
(CHF million) JUNE 2017JUNE 2016
PRO-FORMA2 JUNE 2016
REVENUE 478.3 442.2 444.0
Change in % 8.2 7.7
ADJUSTED OPERATING INCOME¹ 71.5 62.7 62.7
Change in % 14.0 14.0
MARGIN %¹ 14.9 14.2 14.1
1. Before amortisation of acquisition intangibles and other non-recurring items. – 2. Constant currency basis.
AGRICULTURE, FOOD AND LIFE
GROWTH AND REVENUE
Agriculture, Food and Life achieved solid revenue growth of 8.2% (of which 7.2% organic) to CHF 478 million for the period, driven by strong growth in Food and Life activities complemented with performance from recent acquisitions.
Food activities delivered double-digit growth stemming from a continued ramp up of recently launched services around food safety, particularly in the Americas and Europe. Recent acquisitions also contributed favourably to the good performance. Laboratory investments made in the prior year drove strong growth across Asia.
Trade inspection activities experienced a slower start to the year due to poor crop quality in Europe. The underperforming logistics and pest management activities in Africa and parts of Asia have been discontinued, impacting top line growth but ultimately improving profitability.
Seed and Crop benefited from market improvement compared to the prior year, which was impacted by the deferral of Research and Development expenditure due to industry consolidation. Precision farming activities also performed well.
Life Science laboratory activities continued to deliver strong growth, driven by solid organic performance across all regions.
ADJUSTED OPERATING MARGIN
Adjusted operating margin for the period improved to 14.9% from 14.2% in prior year (constant currency basis), with strong incremental margins on increased volume and optimisation of the Life laboratory activities.
ACQUISITIONS
During the semester, the Group acquired Laboratoire LCA in Morocco, offering analytical services, including soil fertility testing, to the agricultural sector and ILC Micro-Chem Inc. in Canada, an independent laboratory providing access to the food safety testing market in Ontario.
SGS and Transparency One, in collaboration with Blippar, are working with Mars Food to help the company map its supply chain from farm to fork as part of its commitment to supply UNCLE BEN’S® rice from sustainable sources by 2020.

7
(CHF million) JUNE 2017JUNE 2016
PRO-FORMA2 JUNE 2016
REVENUE 323.2 313.4 305.2
Change in % 3.1 5.9
ADJUSTED OPERATING INCOME¹ 44.7 41.0 39.3
Change in % 9.0 13.7
MARGIN %¹ 13.8 13.1 12.9
1. Before amortisation of acquisition intangibles and other non-recurring items. – 2. Constant Currency basis.
MINERALS
GROWTH AND REVENUE
Minerals delivered revenue growth of 3.1% (of which 2.1% organic) to CHF 323 million for the period, as market conditions improved across most mining and trading commodities.
Trade Services achieved strong performance across the network as volumes increased for major bulk commodities.
Energy Minerals performed well in Africa, Russia and Indonesia, however the results were partially offset by inconsistent trading conditions in China.
Geochemistry laboratories delivered strong growth as sample volumes continued to increase, particularly in Africa and Australia.
Demand remained robust in the onsite laboratory segment with six new contracts awarded to the business, helping to strengthen its leadership position.
Metallurgical testing demonstrated signs of recovery, with an increase in demand for pilot plant testing and traditional metallurgical test work.
The Mine and Plant Services, added to the business portfolio in 2016, grew in Russia and Africa, providing support for the other Minerals service lines.
Despite the improvement in market conditions, the Process Engineering sector continued to experience difficulties due to delays in project commencement.
ADJUSTED OPERATING MARGIN
The adjusted operating margin for the period improved to 13.8% from 13.1% in prior year (constant currency basis), due to higher volumes and the effect of the substantial restructuring of the business which was carried out in prior periods.
A new Geochemistry feeder laboratory is currently in construction in Seville, Spain and is expected to be operational in Q3 2017.
8
(CHF million) JUNE 2017JUNE 2016
PRO-FORMA2 JUNE 2016
REVENUE 556.4 549.1 549.0
Change in % 1.3 1.3
ADJUSTED OPERATING INCOME¹ 55.8 54.1 54.3
Change in % 3.1 2.8
MARGIN %¹ 10.0 9.9 9.9
1. Before amortisation of acquisition intangibles and other non-recurring items. – 2. Constant currency basis.
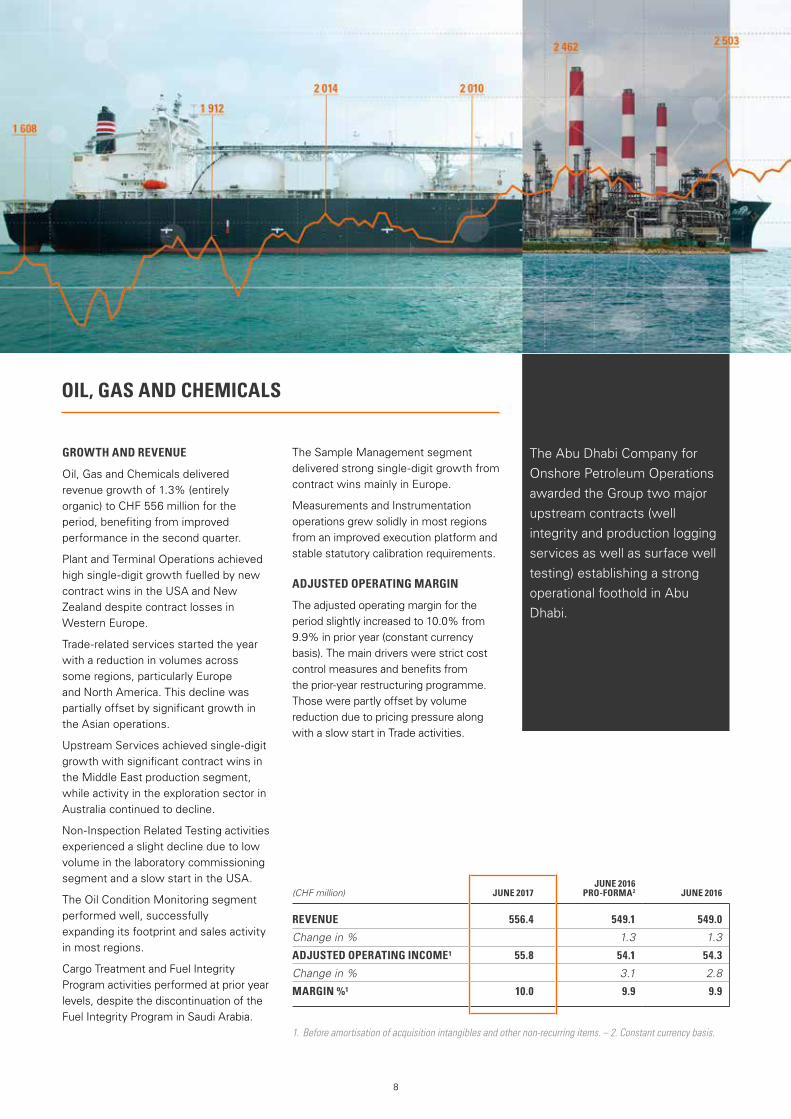
OIL, GAS AND CHEMICALS
GROWTH AND REVENUE
Oil, Gas and Chemicals delivered revenue growth of 1.3% (entirely organic) to CHF 556 million for the period, benefiting from improved performance in the second quarter.
Plant and Terminal Operations achieved high single-digit growth fuelled by new contract wins in the USA and New Zealand despite contract losses in Western Europe.
Trade-related services started the year with a reduction in volumes across some regions, particularly Europe and North America. This decline was partially offset by significant growth in the Asian operations.
Upstream Services achieved single-digit growth with significant contract wins in the Middle East production segment, while activity in the exploration sector in Australia continued to decline.
Non-Inspection Related Testing activities experienced a slight decline due to low volume in the laboratory commissioning segment and a slow start in the USA.
The Oil Condition Monitoring segment performed well, successfully expanding its footprint and sales activity in most regions.
Cargo Treatment and Fuel Integrity Program activities performed at prior year levels, despite the discontinuation of the Fuel Integrity Program in Saudi Arabia.
The Sample Management segment delivered strong single-digit growth from contract wins mainly in Europe.
Measurements and Instrumentation operations grew solidly in most regions from an improved execution platform and stable statutory calibration requirements.
ADJUSTED OPERATING MARGIN
The adjusted operating margin for the period slightly increased to 10.0% from 9.9% in prior year (constant currency basis). The main drivers were strict cost control measures and benefits from the prior-year restructuring programme. Those were partly offset by volume reduction due to pricing pressure along with a slow start in Trade activities.
The Abu Dhabi Company for Onshore Petroleum Operations awarded the Group two major upstream contracts (well integrity and production logging services as well as surface well testing) establishing a strong operational foothold in Abu Dhabi.

9
(CHF million) JUNE 2017JUNE 2016
PRO-FORMA2 JUNE 2016
REVENUE 463.7 414.2 416.4
Change in % 12.0 11.4
ADJUSTED OPERATING INCOME¹ 116.4 100.7 102.1
Change in % 15.6 14.0
MARGIN %¹ 25.1 24.3 24.5
1. Before amortisation of acquisition intangibles and other non-recurring items. – 2. Constant currency basis.
CONSUMER AND RETAIL
GROWTH AND REVENUE
Consumer and Retail delivered strong revenue growth of 12.0% (of which 8.3% organic) to CHF 464 million for the period, with double-digit growth achieved in North East Asia and North and Central Europe. Solid growth was also experienced in Eastern Europe and Middle East and South East Asia Pacific.
Electrical and Electronics achieved impressive growth benefiting from strong volumes in the Restrictive Substance Testing activities, in Electromagnetic Compatibility and Safety activities, fuelled by the acquisition of the Compliance Certification Services Inc. in 2016. Wireless testing activities improved and is set to embrace the challenges and opportunities of the Internet of Things (IoT).
Softlines continued to deliver solid growth attributable to the acquisition of several new global customers, continued benefits from the Detox and Zero Discharge of Hazardous Chemicals campaigns, and success stemming from solutions provided to the textile industry addressing chemical risk management in the supply chain.
Cosmetics, Personal Care and Household achieved strong growth driven by China, Taiwan, Germany and North America.
Hardlines provided robust performance from increased testing of e-toys, expansion in new sourcing countries and benefits from the rapid development of e-retailers and e-platforms.
ADJUSTED OPERATING MARGIN
The adjusted operating margin for the period improved to 25.1% from 24.3% in prior year (constant currency basis), driven by improvement in Wireless activities and efficiency gains in the network.
ACQUISITIONS
During the semester, the Group acquired Harrison Research Laboratories Inc. in the USA, a leading independent clinical research organisation providing services to the cosmetic and personal care industry. Services include sunscreen and dermal patch testing as well as safety, efficacy and claims substantiation.
In February 2017, Bluesign Technologies AG, a Group’s subsidiary and leader in sustainability solutions for the textile industry, signed a partnership with the Outdoor Industry Association to help members improve the chemical integrity of their products and supply chains.

10
(CHF million) JUNE 2017JUNE 2016
PRO-FORMA2 JUNE 2016
REVENUE 160.7 154.7 156.3
Change in % 3.9 2.8
ADJUSTED OPERATING INCOME¹ 27.5 23.1 23.6
Change in % 19.0 16.5
MARGIN %¹ 17.1 14.9 15.1
1. Before amortisation of acquisition intangibles and other non-recurring items. – 2. Constant currency basis.
CERTIFICATION AND BUSINESS ENHANCEMENT
GROWTH AND REVENUE
Certification and Business Enhancement delivered revenue growth of 3.9% (entirely organic) to CHF 161 million for the period, driven by Business Enhancement services with Performance assessment activities and Training reporting double-digit growth.
Management System Certification reported moderate growth. The transition to the new ISO 9000:2015 and 14000:2015 standards progressed as expected, particularly in Asia, with Europe and North America gaining traction towards the end of the period. Medical device certification remained strong driven by new regulations and the continuation of unannounced audits.
Performance assessment performed solidly, driven by the extension of existing contracts and several new contract wins, mainly for the Hospitality Excellence Program and customer programs in social and ethical standards.
Training activities delivered double-digit growth with high demand for transition to the new standard for both Management and Environment Management systems as well as for International Automotive Task Force 16949 standard. Strong growth was delivered in blended learning contracts to key accounts, combining both the SGS Academy classroom learning and the Learning Management System (LMS). The LMS will be rolled out in a total of 20 countries by the end of 2017.
ADJUSTED OPERATING MARGIN
The adjusted operating margin for the period improved significantly to 17.1% from 14.9% in prior year (constant currency basis), as a result of strong growth in the UK and in the USA.
In ongoing efforts to consolidate back-office operations to strengthen service quality and reduce costs, a total of 14 countries have relocated their activities to one of the two global business service centres. In Australia, the Safe Stax activity was sold, greatly improving the margins and bringing the country back to double-digit margin.
SGS won an ISO 20121 (sustainable event certification) to certify 12 Formula E races per year. The FIA Formula E Championship is a class of motor racing that uses only electric-powered cars.

11
(CHF million) JUNE 2017JUNE 2016
PRO-FORMA2 JUNE 2016
REVENUE 435.2 440.8 433.8
Change in % (1.3) 0.3
ADJUSTED OPERATING INCOME¹ 30.9 41.3 41.2
Change in % (25.2) (25.0)
MARGIN %¹ 7.1 9.4 9.5
1. Before amortisation of acquisition intangibles and other non-recurring items. – 2. Constant currency basis.
INDUSTRIAL
GROWTH AND REVENUE
Industrial reported a decline in revenue of -1.3% (of which -4.9% organic) to CHF 435 million for the period with the contraction in oil and gas capital expenditure, persistent low prices and reduced investments impacting the Energy and Construction activities.
In the Energy sector, the mature European and North American markets were affected by severe pricing pressure. Political uncertainties in some South American countries led to a reduction in investments impacting revenues. The Power and Utilities sector grew steadily, particularly in the nuclear field in Europe, as well as in the conventional field in China and Africa.
Reduced public investment in Infrastructure and Construction markets in South America and in parts of Europe was partially offset by the growth and high profitability of laboratory testing activities in Asia and by the acquisitions.
A new online service to monitor the health of steel structures using advanced sensor technology and data analytics was successfully launched and is currently being used in the USA on various steel bridges.
ADJUSTED OPERATING MARGIN
The adjusted operating margin for the period declined from 9.4% in prior year (constant currency basis) to 7.1%, as a result of reduced volume and price affecting oil and gas activities. Strong competition for public tenders in the Infrastructure and Construction market in South America and Spain also led to lower margins.
ACQUISITIONS
During the period, the Group acquired BF Machinery Pty Ltd and CBF Engineering Pty Ltd in Australia, specialising in testing, maintenance and repair of pumps for the water and manufacturing markets. This acquisition provides the Group with an opportunity to replicate services outside of the current operating areas.
SGS enjoys a leading position in the Calibration Laboratory activity in China. The SGS Shanghai laboratory was the first foreign invested company to be accredited by the Chinese government, leading the way for similar laboratories in Hangzhou, Shenzhen and Tianjin. The significant organic growth complements the strong market position for the business.

12
(CHF million) JUNE 2017JUNE 2016
PRO-FORMA2 JUNE 2016
REVENUE 230.8 229.2 227.2
Change in % 0.7 1.6
ADJUSTED OPERATING INCOME¹ 18.6 24.3 24.0
Change in % (23.5) (22.5)
MARGIN %¹ 8.1 10.6 10.6
1. Before amortisation of acquisition intangibles and other non-recurring items. – 2. Constant currency basis.
ENVIRONMENT, HEALTH AND SAFETY
GROWTH AND REVENUE
Environment, Health and Safety delivered revenue growth of 0.7% (of which -1.5% organic) to CHF 231 million for the period, aligning to seasonal expectations.
Strong sales growth in traditional Testing and Health and Safety services in Europe, East Asia and Australia was offset by the completion in the first half of 2016 of a relatively large project in Europe, a business exit in Africa as well as the withdrawal from some low profit contracts. Robust growth in Health and Safety services was driven by global contract wins in hospitality, real estate and retail sectors.
Laboratory services continued to perform solidly driven by network optimisation and a diversified customer base across the regions. In North America, the recent acquisition of AXYS Analytical Services Ltd. came into alignment with the business strategy expanding the service offering. In the USA, Accutest revenue was impacted by the non-renewal of non-profitable contracts and the associated closure of laboratory sites.
China and Taiwan benefited from increased activity related to dioxins testing. Solid improvement was seen in South East Asia Pacific, particularly in Australia, due to prior year restructuring measures from site consolidation. South America experienced a challenging first semester but is expected to pick up in the second half of the year.
ADJUSTED OPERATING MARGIN
The adjusted operating margin for the period decreased from 10.6% in prior year (constant currency basis) to 8.1%, impacted by the completion of a large, non-repeating project in 2016. Excluding this, the margin would have improved driven by an overall good performance in Europe and a turnaround in Australia.
Recently acquired AXYS Analytical Services Ltd. in Canada, together with the USA network, have excelled in providing expertise to meet growing demand for PFOS/PFAS* analysis to detect environmental contaminants in soil and groundwater.
* PFOS: Perfluorooctanesulfonic acid / PFAS: polyfluoroalkyl substances
13
(CHF million) JUNE 2017JUNE 2016
PRO-FORMA2 JUNE 2016
REVENUE 271.8 236.3 239.6
Change in % 15.0 13.4
ADJUSTED OPERATING INCOME¹ 48.9 37.7 38.1
Change in % 29.7 28.3
MARGIN %¹ 18.0 16.0 15.9
1. Before amortisation of acquisition intangibles and other non-recurring items. – 2. Constant currency basis.
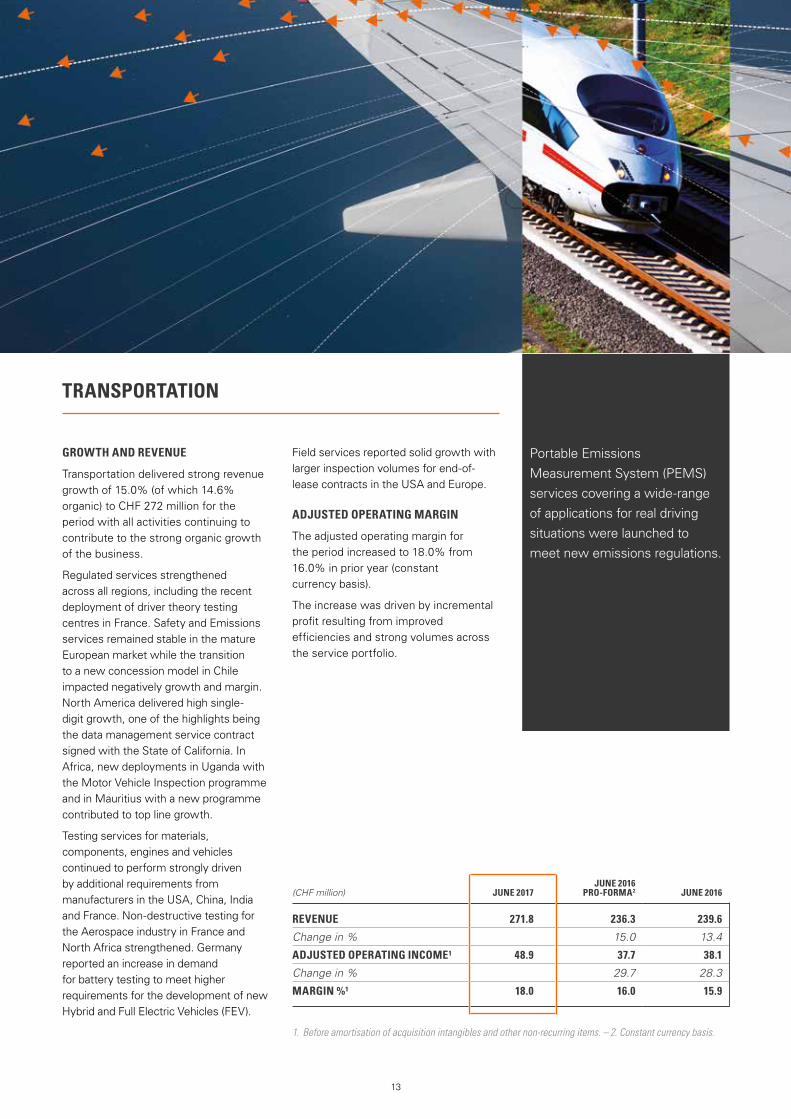
TRANSPORTATION
GROWTH AND REVENUE
Transportation delivered strong revenue growth of 15.0% (of which 14.6% organic) to CHF 272 million for the period with all activities continuing to contribute to the strong organic growth of the business.
Regulated services strengthened across all regions, including the recent deployment of driver theory testing centres in France. Safety and Emissions services remained stable in the mature European market while the transition to a new concession model in Chile impacted negatively growth and margin. North America delivered high single-digit growth, one of the highlights being the data management service contract signed with the State of California. In Africa, new deployments in Uganda with the Motor Vehicle Inspection programme and in Mauritius with a new programme contributed to top line growth.
Testing services for materials, components, engines and vehicles continued to perform strongly driven by additional requirements from manufacturers in the USA, China, India and France. Non-destructive testing for the Aerospace industry in France and North Africa strengthened. Germany reported an increase in demand for battery testing to meet higher requirements for the development of new Hybrid and Full Electric Vehicles (FEV).
Field services reported solid growth with larger inspection volumes for end-of-lease contracts in the USA and Europe.
ADJUSTED OPERATING MARGIN
The adjusted operating margin for the period increased to 18.0% from 16.0% in prior year (constant currency basis).
The increase was driven by incremental profit resulting from improved efficiencies and strong volumes across the service portfolio.
Portable Emissions Measurement System (PEMS) services covering a wide-range of applications for real driving situations were launched to meet new emissions regulations.

14
(CHF million) JUNE 2017JUNE 2016
PRO-FORMA2 JUNE 2016
REVENUE 126.9 124.6 129.8
Change in % 1.8 (2.2)
ADJUSTED OPERATING INCOME¹ 14.1 23.5 25.5
Change in % (40.0) (44.7)
MARGIN %¹ 11.1 18.9 19.6
1. Before amortisation of acquisition intangibles and other non-recurring items. – 2. Constant Currency basis.
GOVERNMENTS AND INSTITUTIONS
GROWTH AND REVENUE
Governments and Institutions delivered revenue growth of 1.8% (entirely organic) to CHF 127 million for the period, driven by solid results in Product Conformity Assessments (PCA), despite the completion of the Kurdistan mandate. These results were achieved on the back of the strong performance of the United Arab Emirates and the Saudi Arabia mandates, both proving to be stable, as well as a new mandate in Cameroon.
The business successfully transformed the Pre-Shipment Inspections (PSI) programme, operated on behalf of the Government of Cameroon, into an innovative and unique 100% cargo scanning system. The new solution combines SGS DTect®, a universal remote scanning analysis, and SGS E-ValuatorTM, a valuation assistance solution, therefore aligning with recommendations set forth by the World Customs Organisation and World Trade Organisation.
Single Window solutions performed well, as seen by the extension of a mandate in Ghana as well as good results in Mozambique and Madagascar due to growth in import volumes.
TransitNet services delivered strong revenue growth driven by solid volumes in the existing countries and the expansion in Eastern Europe.
Some contracts in Africa and the Middle East were completed and not renewed. Other activities, including cargo in transit monitoring, Layer 4 and Forestry remained stable with promising prospects for the future.
ADJUSTED OPERATING MARGIN
The adjusted operating margin for the period decreased from 18.9% in prior year (constant currency basis) to 11.1%. impacted by the provisioning of accounts receivables in line with Group policy. Without these, margins would have been 19.8%. Collection efforts continue and recovery of most of the amounts in question is expected.
A new contract with the port authority in Indonesia demonstrates that the business diversification strategy to move beyond customs within the logistic chain offers new and exciting opportunities.

15
CONDENSED INTERIM FINANCIAL STATEMENTSFOR THE PERIOD ENDED 30 JUNE 2017
(CHF million) NOTES JUNE 2017 JUNE 2016
REVENUE 3 047 2 901
Salaries, wages and subcontractors’ expenses (1 749) (1 653)
Depreciation, amortisation and impairment (157) (152)
Other operating expenses (731) (702)
OPERATING INCOME (EBIT) 3 410 394
Net financial expenses (25) (25)
PROFIT BEFORE TAXES 385 369
Taxes (92) (92)
PROFIT FOR THE PERIOD 293 277
Profit attributable to:
Equity holders of SGS SA 276 258
Non-controlling interests 17 19
BASIC EARNINGS PER SHARE (IN CHF) 4 36.58 34.02
DILUTED EARNINGS PER SHARE (IN CHF) 4 36.51 33.99
CONDENSED CONSOLIDATED INCOME STATEMENT
CONDENSED CONSOLIDATED STATEMENT OF COMPREHENSIVE INCOME
(CHF million) NOTES JUNE 2017 JUNE 2016
Actuarial gains/(losses) on defined benefit plans 8 16 (64)
Income tax on actuarial gains/(losses) taken directly to equity (3) 12
Items that will be not subsequently reclassified to income statement 13 (52)
Exchange differences and other (85) (28)
Items that may be subsequently reclassified to income statement (85) (28)
OTHER COMPREHENSIVE INCOME FOR THE PERIOD (72) (80)
Profit for the period 293 277
TOTAL COMPREHENSIVE INCOME FOR THE PERIOD 221 197
Attributable to:
Equity holders of SGS SA 208 184
Non-controlling interests 13 13

16
CONDENSED CONSOLIDATED BALANCE SHEET
(CHF million) JUNE 2017 DEC 2016
NON-CURRENT ASSETS
Land, buildings and equipment 933 972
Goodwill and other intangible assets 1 409 1 441
Other non-current assets 332 325
TOTAL NON-CURRENT ASSETS 2 674 2 738
CURRENT ASSETS
Trade accounts and notes receivable 943 997
Other current assets 765 630
Cash and marketable securities 962 984
TOTAL CURRENT ASSETS 2 670 2 611
TOTAL ASSETS 5 344 5 349
TOTAL EQUITY 1 552 1 853
NON-CURRENT LIABILITIES
Loans and obligations under finance leases 2 090 1 719
Provisions and other non-current liabilities 266 289
TOTAL NON-CURRENT LIABILITIES 2 356 2 008
CURRENT LIABILITIES
Trade and other payables 615 641
Other liabilities 821 847
TOTAL CURRENT LIABILITIES 1 436 1 488
TOTAL LIABILITIES 3 792 3 496
TOTAL EQUITY AND LIABILITIES 5 344 5 349
CONDENSED STATEMENT OF CHANGES IN CONSOLIDATED EQUITY
ATTRIBUTABLE TO:
(CHF million) EQUITY HOLDERS
OF SGS SA NON-CONTROLLING
INTERESTS TOTAL EQUITY
BALANCE AT 1 JANUARY 2016 1 906 75 1 981
Total comprehensive income for the period 184 13 197
Dividends paid (517) (7) (524)
Share-based payments 10 - 10
Movement in non-controlling interests (1) - (1)
Movement on treasury shares (65) - (65)
BALANCE AS AT 30 JUNE 2016 1 517 81 1 598
BALANCE AT 1 JANUARY 2017 1 773 80 1 853
Total comprehensive income for the period 208 13 221
Dividends paid (528) (8) (536)
Share-based payments 8 - 8
Movement in non-controlling interests 2 (1) 1
Movement on treasury shares 5 - 5
BALANCE AS AT 30 JUNE 2017 1 468 84 1 552
17
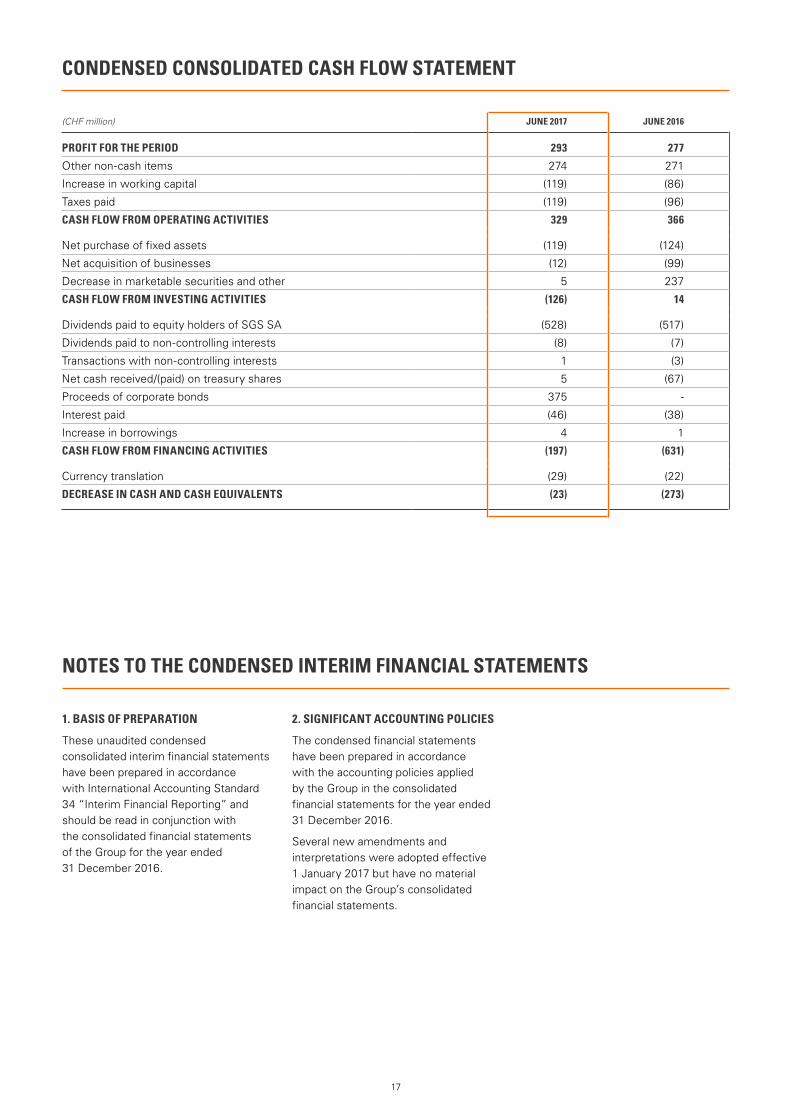
CONDENSED CONSOLIDATED CASH FLOW STATEMENT
(CHF million) JUNE 2017 JUNE 2016
PROFIT FOR THE PERIOD 293 277
Other non-cash items 274 271
Increase in working capital (119) (86)
Taxes paid (119) (96)
CASH FLOW FROM OPERATING ACTIVITIES 329 366
Net purchase of fixed assets (119) (124)
Net acquisition of businesses (12) (99)
Decrease in marketable securities and other 5 237
CASH FLOW FROM INVESTING ACTIVITIES (126) 14
Dividends paid to equity holders of SGS SA (528) (517)
Dividends paid to non-controlling interests (8) (7)
Transactions with non-controlling interests 1 (3)
Net cash received/(paid) on treasury shares 5 (67)
Proceeds of corporate bonds 375 -
Interest paid (46) (38)
Increase in borrowings 4 1
CASH FLOW FROM FINANCING ACTIVITIES (197) (631)
Currency translation (29) (22)
DECREASE IN CASH AND CASH EQUIVALENTS (23) (273)
1. BASIS OF PREPARATION
These unaudited condensed consolidated interim financial statements have been prepared in accordance with International Accounting Standard 34 “Interim Financial Reporting” and should be read in conjunction with the consolidated financial statements of the Group for the year ended 31 December 2016.
2. SIGNIFICANT ACCOUNTING POLICIES
The condensed financial statements have been prepared in accordance with the accounting policies applied by the Group in the consolidated financial statements for the year ended 31 December 2016.
Several new amendments and interpretations were adopted effective 1 January 2017 but have no material impact on the Group’s consolidated financial statements.
NOTES TO THE CONDENSED INTERIM FINANCIAL STATEMENTS

18
JUNE 2016
(CHF million) REVENUE
ADJUSTED OPERATING
INCOME
AMORTISATION OF ACQUISITION
INTANGIBLES
OTHER NON- RECURRING
ITEMS
OPERATING INCOME
BY BUSINESS
2016
Agriculture, Food and Life 444 63 (1) - 62
Minerals 305 39 (1) - 38
Oil, Gas and Chemicals 549 54 (1) - 53
Consumer and Retail 416 102 (1) (1) 100
Certification and Business Enhancement 156 24 - - 24
Industrial 434 41 (3) (1) 37
Environment, Health and Safety 227 24 (2) (1) 21
Transportation 240 38 (4) (1) 33
Governments and Institutions 130 26 - - 26
TOTAL 2 901 411 (13) (4) 394
All segments revenues reported above are from external customers. The adjusted operating income represents the profit earned by each segment. This is the main measure reported to the chief operating decision makers for the purposes of resource allocation and assessment of segmental performances.
ANALYSIS OF OPERATING INCOME
(CHF million) 2017 2016
Adjusted operating income 428 411
Amortisation of acquisition intangibles (15) (13)
Restructuring costs - -
Other non-recurring items (3) (4)
OPERATING INCOME 410 394
JUNE 2017
(CHF million) REVENUE
ADJUSTED OPERATING
INCOME
AMORTISATION OF ACQUISITION
INTANGIBLES
OTHER NON- RECURRING
ITEMS
OPERATING INCOME
BY BUSINESS
2017
Agriculture, Food and Life 478 71 (1) (1) 69
Minerals 323 45 (1) - 44
Oil, Gas and Chemicals 556 56 (1) - 55
Consumer and Retail 464 116 (1) (1) 114
Certification and Business Enhancement 161 27 - - 27
Industrial 435 31 (4) (1) 26
Environment, Health and Safety 231 19 (3) - 16
Transportation 272 49 (4) - 45
Governments and Institutions 127 14 - - 14
TOTAL 3 047 428 (15) (3) 410
3. ANALYSIS OF OPERATING INCOME AND SEGMENT INFORMATION

19
4. EARNINGS PER SHAREJUNE 2017 JUNE 2016
Profit attributable to equity holders of SGS SA (CHF million) 276 258
Weighted average number of shares ('000) 7 540 7 593
BASIC EARNINGS PER SHARE (CHF) 36.58 34.02
JUNE 2017 JUNE 2016
Profit attributable to equity holders of SGS SA (CHF million) 276 258
Diluted weighted average number of shares ('000) 7 553 7 600
DILUTED EARNINGS PER SHARE (CHF) 36.51 33.99
Adjusted earnings per share:
(CHF million) JUNE 2017 JUNE 2016
Profit attributable to equity holders of SGS SA 276 258
Amortisation of acquisition intangibles 15 13
Other non-recurring items net of tax 2 3
ADJUSTED PROFIT ATTRIBUTABLE TO EQUITY HOLDERS OF SGS SA1 293 274
ADJUSTED BASIC EARNINGS PER SHARE (CHF)1 38.88 36.13
ADJUSTED DILUTED EARNINGS PER SHARE (CHF)1 38.82 36.10
1. Before amortisation of acquisition intangibles and other non-recurring items.

20
5. FAIR VALUE MEASUREMENT RECOGNISED IN THE BALANCE SHEET
Marketable securities and derivative assets and liabilities are the only financial instruments measured at fair value subsequent to their initial recognition.
Marketable securities of CHF 10 million qualify as Level 1 fair value measurement category. Derivative assets of CHF 30 million and liabilities of CHF 24 million qualify as Level 2 fair value measurement category in accordance with the fair value hierarchy.
Level 1 fair value measurements are those derived from the quoted price in active markets. Level 2 fair value measurements are those derived from inputs other than quoted prices that are observable for the asset and liability, either directly (i.e. as prices) or indirectly (i.e. derived from prices).
Derivative assets and liabilities consist of foreign currency forward contracts that are measured using quoted forward exchange rates and yield curves derived from quoted interest rates matching maturities of the contract.
6. ACQUISITIONS
Since January 2017, the Group has completed 4 acquisitions.
• 100% of Laboratoire LCA, offering analytical services, including soil fertility testing, to the agricultural sector, based in Morocco (effective 3 January 2017).
• 100% of BF Machinery Pty Ltd and CBF Engineering Pty Ltd, providing testing, repair, engineering and maintenance services for pumps, valves, hydraulics and plastics systems, based in Australia (effective 10 January 2017).
• 100% of ILC Micro-Chem Inc., specialised in the analysis of raw food materials, finished food products and environmental swabs for the food manufacturing industry, based in Canada (effective 9 March 2017).
• 100% of Harrison Research Laboratories, Inc., providing services to the cosmetic and personal care industry. Services include sunscreen and dermal patch testing as well as safety, efficacy and claims substantiation support testing, based in the USA (effective 20 June 2017).
Due to their timing, the initial accounting for all four acquisitions has only been provisionally determined at the balance sheet date. All the above transactions contributed a total CHF 4 million in revenues and CHF 1 million in operating income. Had all acquisitions been effective 1 January 2017, the revenues for the period from these acquisitions would have been CHF 7 million and the operating income would have been CHF 2 million.
The following acquisitions were made after 30 June 2017:
• 100% of SGS Leicester Ltd., a UKAS-accredited textile testing laboratory performing physical, chemical and flammability testing services for garment industry, based in the United Kingdom.
• 100% of Central Illinois Grain Inspection, Inc., a USDA licensed agency inspecting grains and by-products for export and domestic quality settlements with growers, based in the USA.
7. GOODWILL
(CHF million) JUNE 2017 JUNE 2016
COST
At 1 January 1 195 1 088
Additions 9 44
Consideration on prior years’ acquisitions (1) 1
Exchange differences (21) 8
AT 30 JUNE 1 182 1 141
The goodwill arising on acquisitions relates to the value of the underlying business and expected synergies as well as the value of the qualified workforce that do not meet the criteria for recognition as separable intangible assets.
21
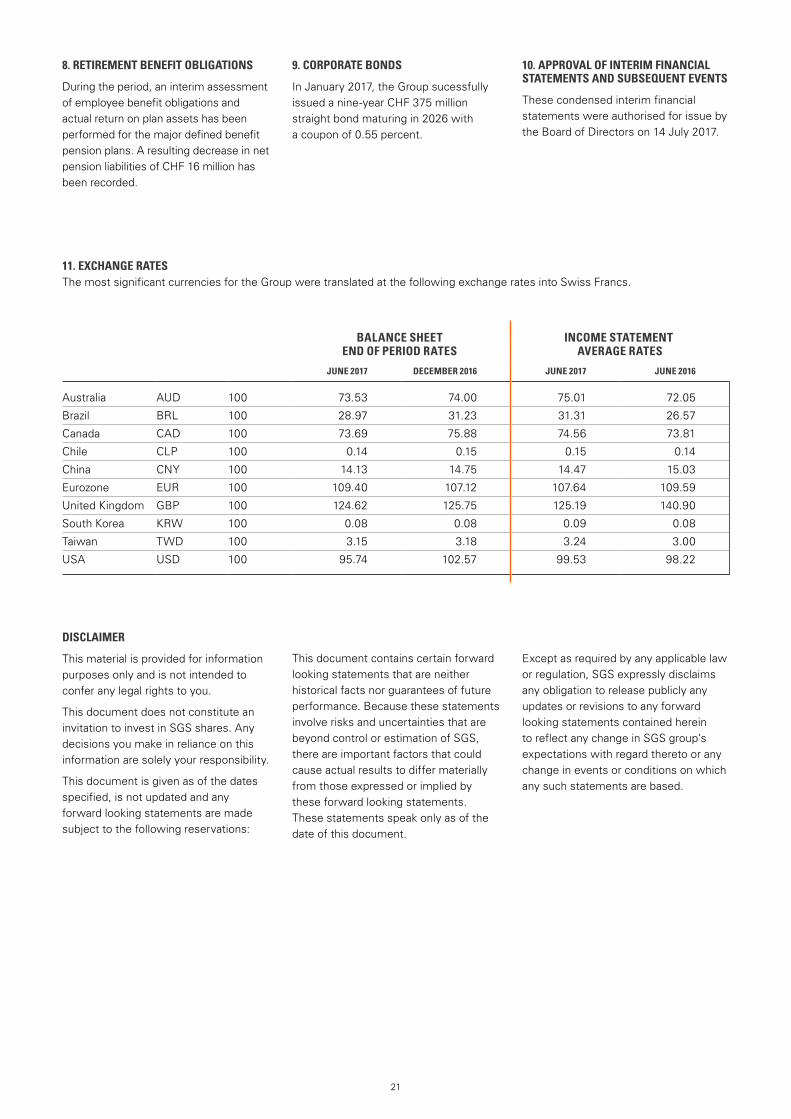
8. RETIREMENT BENEFIT OBLIGATIONS
During the period, an interim assessment of employee benefit obligations and actual return on plan assets has been performed for the major defined benefit pension plans. A resulting decrease in net pension liabilities of CHF 16 million has been recorded.
9. CORPORATE BONDS
In January 2017, the Group sucessfully issued a nine-year CHF 375 million straight bond maturing in 2026 with a coupon of 0.55 percent.
10. APPROVAL OF INTERIM FINANCIAL STATEMENTS AND SUBSEQUENT EVENTS
These condensed interim financial statements were authorised for issue by the Board of Directors on 14 July 2017.
11. EXCHANGE RATES The most significant currencies for the Group were translated at the following exchange rates into Swiss Francs.
BALANCE SHEET INCOME STATEMENTEND OF PERIOD RATES AVERAGE RATES
JUNE 2017 DECEMBER 2016 JUNE 2017 JUNE 2016
Australia AUD 100 73.53 74.00 75.01 72.05
Brazil BRL 100 28.97 31.23 31.31 26.57
Canada CAD 100 73.69 75.88 74.56 73.81
Chile CLP 100 0.14 0.15 0.15 0.14
China CNY 100 14.13 14.75 14.47 15.03
Eurozone EUR 100 109.40 107.12 107.64 109.59
United Kingdom GBP 100 124.62 125.75 125.19 140.90
South Korea KRW 100 0.08 0.08 0.09 0.08
Taiwan TWD 100 3.15 3.18 3.24 3.00
USA USD 100 95.74 102.57 99.53 98.22
DISCLAIMER
This material is provided for information purposes only and is not intended to confer any legal rights to you.
This document does not constitute an invitation to invest in SGS shares. Any decisions you make in reliance on this information are solely your responsibility.
This document is given as of the dates specified, is not updated and any forward looking statements are made subject to the following reservations:
This document contains certain forward looking statements that are neither historical facts nor guarantees of future performance. Because these statements involve risks and uncertainties that are beyond control or estimation of SGS, there are important factors that could cause actual results to differ materially from those expressed or implied by these forward looking statements. These statements speak only as of the date of this document.
Except as required by any applicable law or regulation, SGS expressly disclaims any obligation to release publicly any updates or revisions to any forward looking statements contained herein to reflect any change in SGS group’s expectations with regard thereto or any change in events or conditions on which any such statements are based.

22
23
SHAREHOLDER INFORMATIONSGS SA CORPORATE OFFICE
1 place des Alpes P.O. Box 2152 CH – 1211 Geneva 1 t +41 (0)22 739 91 11 f +41 (0)22 739 98 86 e [email protected] www.sgs.com
INVESTOR DAYS (IN VIETNAM)
Thursday and Friday, 26 and 27 October 2017
2017 FULL YEAR RESULTS
Tuesday, 23 January 2018
ANNUAL GENERAL MEETING OF SHAREHOLDERS
Monday, 19 March 2018 Geneva, Switzerland
STOCK EXCHANGE LISTING
SIX Swiss Exchange, SGSN
STOCK EXCHANGE TRADING
SIX Swiss Exchange
COMMON STOCK SYMBOLS
Bloomberg: Registered Share: SGSN.VX Reuters: Registered Share: SGSN.VX Telekurs: Registered Share: SGSN ISIN: Registered Share: CH0002497458 Swiss security number: 249745
CORPORATE DEVELOPMENT, COMMUNICATIONS & INVESTOR RELATIONS
Jean-Luc de Buman SGS SA 1 place des Alpes P.O. Box 2152 CH – 1211 Geneva 1 t +41 (0)22 739 93 31 f +41 (0)22 739 92 00 www.sgs.com

WWW.SGS.COM
© S
GS
Gro
up M
anag
emen
t S
A –
201
7 –
All
right
s re
serv
ed –
SG
S is
a r
egis
tere
d tr
adem
ark
of S
GS
Gro
up M
anag
emen
t S
A.