Embed Size (px)
Citation preview
2020 FULL YEAR RESULTS 1
PROFIT FOR THE PERIOD
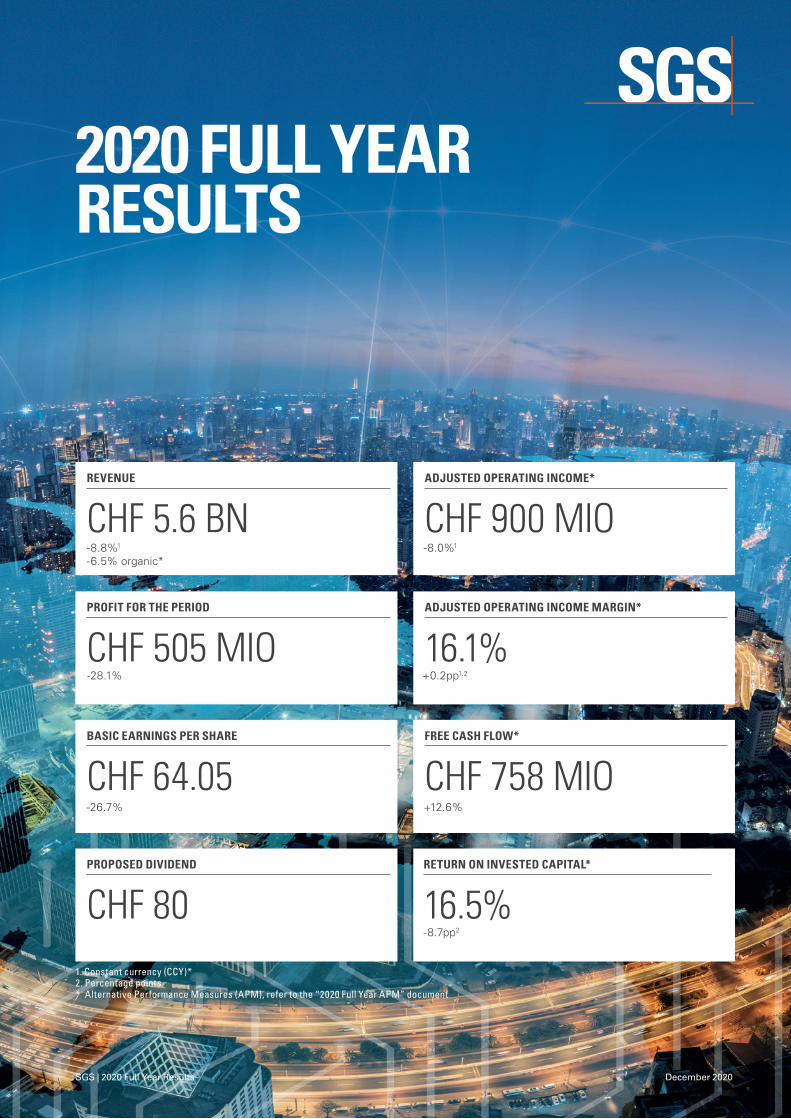
CHF 505 MIO-28.1%
BASIC EARNINGS PER SHARE
CHF 64.05+12.6%
FREE CASH FLOW*
CHF 758 MIO
PROPOSED DIVIDEND
CHF 80-8.7pp2
RETURN ON INVESTED CAPITAL*
16.5%
ADJUSTED OPERATING INCOME MARGIN*
16.1%+0.2pp1,2
REVENUE
CHF 5.6 BN-8.8%1
-6.5% organic*
ADJUSTED OPERATING INCOME*
CHF 900 MIO-8.0%1
-26.7%
1. Constant currency (CCY)*2. Percentage points* Alternative Performance Measures (APM), refer to the “2020 Full Year APM” document
2020 FULL YEAR RESULTS
SGS | 2020 Full Year Results December 2020

SGS | 2020 Full Year Results

2020 FULL YEAR RESULTS 1
Financial Highlights
(CHF million) 2020 2019Change
in %2019
CCY 1Change in
CCY1 %
REVENUE 5 604 6 600 (15.1) 6 148 (8.8)
OPERATING INCOME (EBIT) 795 1 082 (26.5) 994 (20.0)
OPERATING INCOME MARGIN 14.2% 16.4% 16.2%
ADJUSTED OPERATING INCOME* 900 1 063 (15.3) 978 (8.0)
ADJUSTED OPERATING INCOME MARGIN* 16.1% 16.1% 15.9%
EBITDA* 1 312 1 630 (19.5) 1 510 (13.1)
ADJUSTED EBITDA* 1 324 1 521 (13.0) 1 408 (6.0)
PROFIT FOR THE PERIOD 505 702 (28.1)
PROFIT ATTRIBUTABLE TO EQUITY HOLDERS OF SGS SA 480 660 (27.3)
ADJUSTED PROFIT ATTRIBUTABLE TO EQUITY HOLDERS OF SGS SA* 565 666 (15.2)
BASIC EPS (CHF) 64.05 87.45 (26.7)
DILUTED EPS (CHF) 63.82 87.18 (26.8)
ADJUSTED BASIC EPS (CHF)* 75.44 88.17 (14.4)
CASH FLOW FROM OPERATING ACTIVITIES 1 186 1 149 3.2
FREE CASH FLOW* 758 673 12.6
RETURN ON INVESTED CAPITAL* 16.5% 25.2%
NET DEBT* (1 478) (762)
WEIGHTED AVERAGE NUMBER OF SHARES (‘000) 7 489 7 552
AVERAGE FTE2 89 098 94 494 (5.7)
1. Constant currency (CCY)*
2. Full Time Equivalent (FTE) employees
* Alternative Performance Measures (APM), refer to the “2020 Full Year APM” document
SGS | 2020 Full Year Results

2020 FULL YEAR RESULTS2
A STRONG PERFORMANCE IN 2020 CONFIRMS THE GROUP’S STRATEGIC EVOLUTION “I am proud of the dynamism and responsiveness demonstrated by our employees in a challenging period. Their hard work, commitment and entrepreneurialism in supporting our customers have resulted in a strong operational performance for SGS in 2020, reinforcing our leadership position in the TIC industry.We have taken significant strategic steps forward in 2020, both through the acquisition of SYNLAB Analytics & Services (A&S) and by launching the next phase of our planning. The strong operational performance combined with this important move confirms our strategic evolution which further aligns SGS to the key TIC ‘megatrends’”, said Frankie Ng, Chief Executive Officer of SGS.
SIGNIFICANT STRATEGIC MILESTONES ACHIEVED IN 2020• We have implemented the next stage of our strategic evolution with the purpose of enabling a better, safer and more
interconnected world for employees, customers, shareholders and society. Our operational structure has been simplified into six new focus areas composed of four divisions: Connectivity & Products, Health & Nutrition, Industries & Environment and Natural Resources and two cross-divisional strategic units: Knowledge and Digital & Innovation, with Knowledge retaining its P&L responsibility. This will improve our market approach and increase cooperation and agility across our global network.
• The acquisition of SYNLAB Analytics & Services (A&S) further aligns SGS with the Health, Nutrition and Environment TIC megatrends and enhances our market position in Europe. It also adds a range of complex services and accelerates the adoption of our hub and spoke model, offering greater scope for automation and digitalization and generating strong operating synergies.
• We have defined our 2030 sustainability ambition which encompasses a holistic and global approach to sustainability both in terms of how we behave as a company and the value we provide to our customers through our services. We will launch our 2030 sustainability plan in Q2 2021.
DIGITAL DELIVERY AND SERVICE EVOLUTIONIn 2020, we successfully leveraged our market-leading technical capabilities, adapting our delivery models and offering ‘Next Normal’ solutions for Covid-19 to support our customers.
• Our customers are seeking better visibility into their supply chains supported by our digital solutions across the SGS global network. Remote inspection, audit, consulting and other technical service delivery solutions using our digital tools and sensor-based technology have all gained acceptance and traction across our customer base. For example, over 50% of eligible Government and Institution inspection services were conducted remotely in 2020.
• The pandemic has also stimulated additional innovation of our service portfolio including our global Life Sciences network delivering Covid-19 vaccine testing and new innovative therapeutics for several global clients. We continue to have the leading TIC market share in Personal Protective Equipment (PPE) testing and inspection. We have seen strong demand on contract signings across our testing, monitoring, auditing, training and certification of disinfection and business recovery services.
Examples of our differentiated services and new business wins can be found here: sgs.com/NextNormalNews
FINANCIAL DISCIPLINE AND CONTINUED INVESTMENT IN STRATEGIC PRIORITY AREASContinued investment in markets with high growth potential, pricing initiatives, cost control, working capital management and refinancing have all driven a very strong financial performance in a challenging year.
• Two CHF bonds with a total value of CHF 500 million were successfully issued.• Over CHF 90 million of structural cost savings were achieved which, coupled with strong cost management and EVA-driven performance
management, has resulted in a 20 basis points increase in the adjusted operating income margin* at constant currency*, despite the revenue decline in 2020.
• Free cash flow* increased to CHF 758 million, a 12.6% increase over prior year. This was supported by a significant focus on working capital management, with operating net working capital* as a percentage of revenue improving by 280 basis points over prior year.
• While some non-essential and maintenance capex has inevitably been delayed, we have continued to invest heavily in our strategic priority areas supported by our focused capital allocation strategy. These include wireless, 5G, semiconductors, food testing and investment into IT systems to continue to drive an increase in productivity.
A STRONG FINANCIAL PERFORMANCETotal Revenue reached CHF 5.6 billion, down by 15.1% (a decline of 8.8% at constant currency*), notably driven by the disposal of the Petroleum Service Corporation (PSC) in 2019, in addition to the Covid-19 pandemic impact.
Organic Revenue* declined by 6.5%, impacted by the pandemic. A gradual improvement throughout H2 2020 was experienced with a return to growth in December.
Operating Income decreased from CHF 1 082 million in prior year to CHF 795 million in 2020, mainly driven by the exceptional gain of CHF 268 million on the disposal of the PSC business in 2019 and the impact of the Covid-19 pandemic in 2020.
Adjusted Operating Income* decreased from CHF 1 063 million in prior year to CHF 900 million in 2020, a decline of 15.3%(a decline of 8.0% at constant currency*). The decrease occurred in H1 2020 while H2 2020 adjusted operating income remained stable on a reported basis and increased significantly at constant currency*.
Adjusted Operating Income Margin* of 16.1% remained stable in 2020 at historical rate but increased by 20 basis points at constant currency*. This improvement was driven by the structural cost optimization program implemented in H2 2019, strong cash collection (resulting in a lower allowance for expected credit losses) and additional measures taken in 2020 due to the pandemic.
* Alternative Performance Measures (APM), refer to the “2020 Full Year APM” document
SGS | 2020 Full Year Results

2020 FULL YEAR RESULTS 3
Net Financial Expenses decreased from CHF 61 million in prior year to CHF 54 million in 2020 driven by lower hedging costs.
Overall Effective Tax Rate (ETR) for the period increased from 31% in prior year to 32% in 2020. The 2020 ETR was impacted by an increase of non-deductible items, mainly goodwill impairment and a portion of the restructuring costs, while the prior year was affected by valuation allowances on deferred tax assets.
Profit Attributable to Equity Holders decreased from CHF 660 million in 2019 to CHF 480 million in 2020, a decrease of 27.3% over prior year.
Basic Earnings per Share decreased from CHF 87.45 in prior year to CHF 64.05, a decrease of 26.7%.
Adjusted Basic Earnings per Share* decreased from CHF 88.17 in prior year to CHF 75.44, a decrease of 14.4%.
Return On Invested Capital (ROIC)* decreased from 25.2% in prior year to 16.5% in 2020 primarily due to the acquisition of SYNLAB A&S closed on 31 December 2020. Adjusted for this acquisition, the 2020 ROIC would have been 20.9%.
Cash Flow from Operating Activities increased by 3.2% from CHF 1 149 million in prior year to CHF 1 186 million.
Free Cash Flow (FCF)* increased significantly by 12.6% from CHF 673 million in prior year to CHF 758 million in 2020 driven by strong working capital management. Operating net working capital* as a percentage of revenue improved from 0.3% in prior year to (2.5%) in 2020.
Investment Activities: Net capital investment was CHF 246 million versus CHF 279 million in prior year and the Group completed six acquisitions for a total cash consideration of CHF 490 million.
Financing Activities: In 2020, the Group paid a dividend of CHF 598 million. Out of the CHF 200 million share buyback program announced in February 2020, the Group acquired CHF 169 million of shares. Two CHF bonds amounting to CHF 500 million in total were successfully issued. A short-term credit facility was contracted for CHF 542 million in 2020 to support the acquisition of SYNLAB A&S.
As at 31 December 2020, the Group’s net debt* position amounted to CHF 1 478 million versus CHF 762 in prior year.
BUSINESS GROWTH AND ADJUSTED OPERATING INCOME MARGIN 2020
(CHF million) Revenue Growth at CCY1Organic* growth
at CCY1
Adjusted operating
income*
Adjusted operating income
margin*
AFL 996 (1.1%) 0.3% 175 17.6%
MIN 639 (6.9%) (6.9%) 111 17.4%
OGC 776 (22.9%) (7.7%) 76 9.8%
CRS 1 054 2.3% 1.0% 264 25.0%
CBE 429 (8.1%) (12.0%) 82 19.1%
IND 847 (15.2%) (13.4%) 72 8.5%
EHS 471 (7.6%) (9.0%) 42 8.9%
GIS 392 (11.5%) (12.4%) 78 19.9%
TOTAL 5 604 (8.8%) (6.5%) 900 16.1%
1. Constant currency (CCY)*
ACQUISITIONS Date Location Business line FTE
Thomas J. Stephens & Associates, Inc. 8 January 2020 USA CRS 102
CTA Gallet 2 June 2020 France GIS 24
Groupe Moreau 28 August 2020 France GIS 33
Engineering Control limited 4 November 2020 New Zealand IND 21
Ryobi Geotechnique International Pte Ltd. 31 December 2020 Singapore IND 478
SYNLAB Analytics & Services (A&S) 31 December 2020 Europe EHS, AFL & OGC 1 878
DISPOSALS Date Location Business line FTE
Pest management and fumigation operations
31 January 2020 The Netherlands and Belgium
AFL 95
* Alternative Performance Measures (APM), refer to the “2020 Full Year APM” document
SGS | 2020 Full Year Results

2020 FULL YEAR RESULTS4
SUBSEQUENT EVENTSThe following acquisition was completed after 31 December 2020:
Analytical & Development Services (ADS) in the UK, a fully accredited food testing laboratory offering pesticides, nutrition, microbiology, food molecular biology and allergen testing services.
We expect to complete the acquisition of the lab facilities of International Service Laboratory (ISL) from Novartis Ireland Limited in Ireland, providing regulated analytical laboratory and stability testing services for a broad variety of pharmaceutical products by the end of Q1 2021.
OUTLOOK• Solid organic growth normalizing for the impact of Covid-19 • Improving adjusted operating income• Strong cash conversion• Maintaining best-in-class organic return on invested capital• Accelerate investment into our strategic focus areas with M&A as a key enabler• At least maintaining or growing the dividend
The formal communication of the next stage of our strategic evolution will be made to the financial markets at our Investor Days in May 2021 and we will launch our 2030 sustainability ambitions in Q2 2021.
MANAGEMENT CHANGESSiddi Wouters joined the SGS Group as Senior Vice President of Digital & Innovation and has been appointed to the Operations Council. Stephen Nolan (formerly Managing Director of North America) has been appointed Chief Operating Officer of North America and to the Operations Council. Wim Van Loon (formerly Executive Vice President of Industrial) has been appointed Chief Operating Officer of North and Central Europe. Dominik de Daniel, Chief Financial Officer, has taken additional responsibility for Information Technology and Mergers and Acquisitions; Toby Reeks, Senior Vice President of Investor Relations, has also taken on the extended roles of Corporate Communications and Sustainability.
The new divisions will be led by:
• Alim Saidov, Executive Vice President of Industries & Environment• Charles Ly Wa Hoi, Executive Vice President of Connectivity & Products• Derick Govender, Executive Vice President of Natural Resources• Olivier Coppey, Executive Vice President of Health & Nutrition
The new cross-divisional units will be led by:
• Jeffrey McDonald, Executive Vice President of Knowledge• Siddi Wouters, Senior Vice President of Digital & Innovation
Fred Herren, Senior Vice President of Digital & Innovation and Dirk Hellemans, Chief Operating Officer of North and Central Europe have left the Group to take their well-deserved retirements. Peter Possemiers (formerly Executive Vice President of Environment, Health and Safety) stepped down from the Operations Council to lead the integration of SYNLAB A&S. Christoph Heidler and Roger Kamgaing have also stepped down from the Operations Council. The Management team would like to thank them all for their dedication and service.
BOARD CHANGESOn 24 March 2020, Calvin Grieder was elected as Chairman of the Board of Directors. Sami Atiya and Tobias Hartmann were elected as members of the Board of Directors. Peter Kalantzis, former Chairman of the Board, did not stand for re-election. Peter stepped in as Chairman of the Board at a critical time for SGS and ensured a smooth transition. His vast experience and dedication contributed immensely to the success of SGS over the past decade. Luitpold von Finck also did not stand for re-election. SGS would like to thank them both for their support and direction.
DISTRIBUTION SHAREHOLDERSThe SGS Board of Directors will recommend to the Annual General Meeting (to be held on 23 March 2021) the approval of a dividend of CHF 80 per share.
SIGNIFICANT SHAREHOLDERSOn 4 February 2020, the von Finck family placed a large portion of their holding with institutional investors, and subsequently placed the balance of their holding on 3rd August 2020.
As at 31 December 2020, Groupe Bruxelles Lambert (acting through Serena SARL and URDAC) held 18.91% (December 2019: 16.73%) of the share capital and voting rights of the company. At the same date, the Group held 1.28% of the share capital of the company (December 2019: 0.18%).
28 January 2021
Calvin Grieder
Chairman of the Board
Frankie Ng
Chief Executive Officer
SGS | 2020 Full Year Results

2020 FULL YEAR RESULTS 5
(CHF million) 2020 2019Change
in %2019 CCY1
Change in CCY %
REVENUE 996 1 074 (7.3) 1 007 (1.1)
ADJUSTED OPERATING INCOME* 175 172 1.7 161 8.7
MARGIN %* 17.6 16.0 16.0
1. Constant currency (CCY)*
Agriculture, Food and Life revenue declined by 1.1% at constant currency to CHF 996 million, with organic growth of 0.3% offset by the pest management disposal. Life laboratories and Trade activities grew, while Seed and Crop, Food and especially Clinical Research were more impacted by lockdown measures.
Food declined organically more than the divisional average. The lockdown measures put our field activities on hold impacting both audit and testing volumes.
Trade achieved good organic growth driven by strong performance in Eastern Europe, the Middle East and the Americas.
Life Laboratories posted strong organic growth. Biopharma grew at a double-digit rate, quality control was broadly stable and bioanalysis was impacted by low sample volumes in clinical research.
Clinical Research declined organically as studies were postponed in clinical pharmacology, partially offset by strong demand for biometrics.
Seed and Crop declined organically mainly due to precision farming and input testing. This decline was partially offset by strong growth in contract research.
The adjusted operating margin increased to 17.6% from 16.0% in prior year (at constant currency), with profitability improvements across most of the portfolio as a result of a disciplined cost focus and structural cost optimization despite the challenging year.
(CHF million) 2020 2019Change
in %2019 CCY1
Change in CCY %
REVENUE 639 753 (15.1) 686 (6.9)
ADJUSTED OPERATING INCOME* 111 128 (13.3) 114 (2.6)
MARGIN %* 17.4 17.0 16.6
1. Constant currency (CCY)*
Minerals’ revenue declined by 6.9% at constant currency to CHF 639 million. The impact of the extended lockdown measures and their prolonged effect, mainly in Europe and the Americas, was partially offset by growth in Asia and in Eastern Europe during H2.
Reduced coal volumes in Trade Inspection due to lower Liquefied Natural Gas (LNG) prices was offset by solid growth in Asia and the Pacific in H2.
Geochemistry exploration sample volumes in our commercial laboratories were impacted in Q2, but improved in H2. Outsourced laboratory operations remained stable throughout 2020 supported by new projects in Africa and in Eastern Europe.
Metallurgy declined more than the divisional organic average due to project deferrals.
The adjusted operating margin increased to 17.4% from 16.6% in prior year (at constant currency). Cost containment and structural cost optimization across the network mitigated the impact of the revenue decline.
Agriculture, Food and Life
Minerals
ACQUISITIONS• SYNLAB Analytics & Services
(A&S) in Europe
DISPOSALS • Pest management and fumigation
operations in Belgium and The Netherlands
* Alternative Performance Measures (APM), refer to the “2020 Full Year APM” document
SGS | 2020 Full Year Results

2020 FULL YEAR RESULTS6
(CHF million) 2020 2019Change
in %2019 CCY1
Change in CCY %
REVENUE 776 1 075 (27.8) 1 006 (22.9)
ADJUSTED OPERATING INCOME* 76 120 (36.7) 109 (30.3)
MARGIN %* 9.8 11.2 10.8
1. Constant currency (CCY)*
Oil, Gas and Chemicals revenue declined by 22.9% at constant currency (the organic decline was 7.7%) to CHF 776 million. The disposal of the plant and terminal operations in the USA (PSC) in June 2019 impacted the base effect, while the business was affected by lower demand and the material decline in the oil price in H1 2020.
Trade revenue declined less than the divisional organic average. Inspection and Testing were heavily impacted by the reduction in global oil demand. While Q3 saw an improvement in demand, Q4 activities were impacted by the second wave of restrictions. Volumes showed some resilience in Latin America.
Upstream declined more than the divisional organic average. A low oil price led to service postponement compounded by site access restrictions in some operations. This was partially compensated by contract wins in Africa and Western Europe.
Non-Inspection Related Testing declined more than the divisional organic average. Europe, North America and Asia were impacted by lower sample volumes, while several new contract wins in the Middle East and Latin America helped to partially offset the decline.
Oil Condition Monitoring’s decline was in line with the divisional organic average. Lower sample volumes were partly compensated for by contract wins in North America.
The adjusted operating margin decreased to 9.8% from 10.8% in prior year (at constant currency) driven by lower volumes partially mitigated by strong cost control and structural cost optimization measures implemented in H2 2019.
(CHF million) 2020 20192Change
in %2019 CCY1
Change in CCY %
REVENUE 1 054 1 091 (3.4) 1 030 2.3
ADJUSTED OPERATING INCOME* 264 270 (2.2) 253 4.3
MARGIN %* 25.0 24.7 24.6
1. Constant currency (CCY)* – 2. See Note 2 on segment information restatement
Consumer and Retail revenue grew by 2.3% at constant currency (of which 1.0% was organic) to CHF 1 054 million. There was a strong recovery in H2 across all strategic business units, supported by PPE testing and certification.
Electrical and Electronics was broadly stable organically due to double-digit growth in product safety testing and certification, high single-digit growth in Wireless, while Automotive-related activities were significantly impacted by the challenging end-market. The business continued to invest in expanding capacity and capability to serve the high growth connectivity markets including wireless, 5G, IoT, microelectronics and functional safety.
Softlines grew well above the divisional organic average driven by strong PPE testing and certification volumes in Asia, particularly in China. Changing supply chains supported growth in new sourcing countries such as Vietnam and Turkey.
Hardlines reported a slight decrease in organic revenue due to difficult market conditions in Europe. Penetration with eRetailers and ePlatforms increased during the year, however, Toys and Juvenile Products declined due to a reduction in new toy launches by major brands and retailers.
Cosmetics, Personal Care and Household experienced organic growth in line with the divisional average driven by strong volume from China offsetting a decline in the USA, due to temporary site closures and delayed studies in Europe.
The adjusted operating margin increased to 25.0% from 24.6% in prior year (at constant currency) mostly driven by strong performance in North East Asia and strict cost control.
Oil, Gas and Chemicals
Consumer and Retail
ACQUISITIONS• Thomas J. Stephens & Associates, Inc.
in the USA
* Alternative Performance Measures (APM), refer to the “2020 Full Year APM” document
ACQUISITIONS• SYNLAB Analytics & Services
(A&S) in Europe
SGS | 2020 Full Year Results

2020 FULL YEAR RESULTS 7
(CHF million) 2020 20192Change
in %2019 CCY1
Change in CCY %
REVENUE 429 497 (13.7) 467 (8.1)
ADJUSTED OPERATING INCOME* 82 99 (17.2) 92 (10.9)
MARGIN %* 19.1 19.9 19.7
1. Constant currency (CCY)* – 2. See Note 2 on segment information restatement
Certification and Business Enhancement revenue declined by 8.1% at constant currency (the organic decline was 12.0%) to CHF 429 million.
Management System Certification revenue declined less than the organic divisional level. Following a challenging H1, H2 demonstrated strong resilience with high single-digit growth as delayed audits were completed and remote auditing adoption increased. North East Asia delivered strong full year growth.
Technical Consultancy declined more than the divisional organic average mainly due to several large projects being postponed and customers deferring consulting spend. Remote consulting solutions were introduced with several projects fully executed off-site.
Responsible Business Solutions and Second Party Audits gradually improved following H1 but remained below the divisional organic average over the second half. Some challenges remained as many traditional retailers continued to face difficult business conditions.
Training declined more than the divisional organic level as classroom-based demand dropped. Virtual training and eLearning solutions were developed. This is transforming the business, accounting for up to 80% of the activity in some geographies.
The adjusted operating margin decreased to 19.1% from 19.7% in prior year (at constant currency). Following a challenging H1, profitability improved significantly in H2 due to the rapid reduction of the cost structure, high utilization of auditors as well as the implementation of remote solutions.
(CHF million) 2020 20192Change
in %2019 CCY1
Change in CCY %
REVENUE 847 1 091 (22.4) 999 (15.2)
ADJUSTED OPERATING INCOME* 72 116 (37.9) 105 (31.4)
MARGIN %* 8.5 10.6 10.5
1. Constant currency (CCY)* – 2. See Note 2 on segment information restatement
Industrial revenue declined by 15.2% at constant currency (the organic decline was 13.4%) to CHF 847 million. Transportation and Oil & Gas were the most heavily impacted, while Manufacturing returned to growth in H2. Most regions improved in H2, particularly North East Asia.
Oil and Gas declined more than the divisional organic average due to delays in opex-related work and price pressure in most geographies, except Asia. Large commissioning and maintenance contracts continued in Latin America.
Manufacturing performed above the divisional organic average. The laboratory network expanded in Asia and the statutory business showed resilience, particularly in North and Central Europe. In November, Engineering Control Limited, based in New Zealand, was acquired to strengthen our Industrial Safety activities, in line with our strategic focus.
Infrastructure declined less than the divisional organic average. Latin America and South Africa were slow to recover, despite a strong pipeline. The infrastructure laboratory in the USA delivered positive growth and revenue from large projects in Hong Kong grew in double digits. The acquisition in December 2020 of Ryobi Geotechnique International Pte Ltd., based in Singapore, will accelerate our regional growth strategy for critical infrastructure and construction.
Power & Utilities demonstrated resilience with a lower organic decline than the divisional average. Nuclear inspection recovered in H2 and growth continues in Europe and Asia.
Transportation was restructured in line with lower demand in Aeronautics and Automotive.
The adjusted operating margin decreased to 8.5% from 10.5% in prior year (at constant currency). Despite the weakness in Oil & Gas and Transportation, operational optimization resulted in profitability improvement with adjusted operating margin in H2 reaching similar levels to prior year.
Certification and Business Enhancement
Industrial
ACQUISITIONS• Engineering Control Limited
in New Zealand
• Ryobi Geotechnique International Pte Ltd. in Singapore
* Alternative Performance Measures (APM), refer to the “2020 Full Year APM” document
SGS | 2020 Full Year Results
2020 FULL YEAR RESULTS8
(CHF million) 2020 2019Change
in %2019 CCY1
Change in CCY %
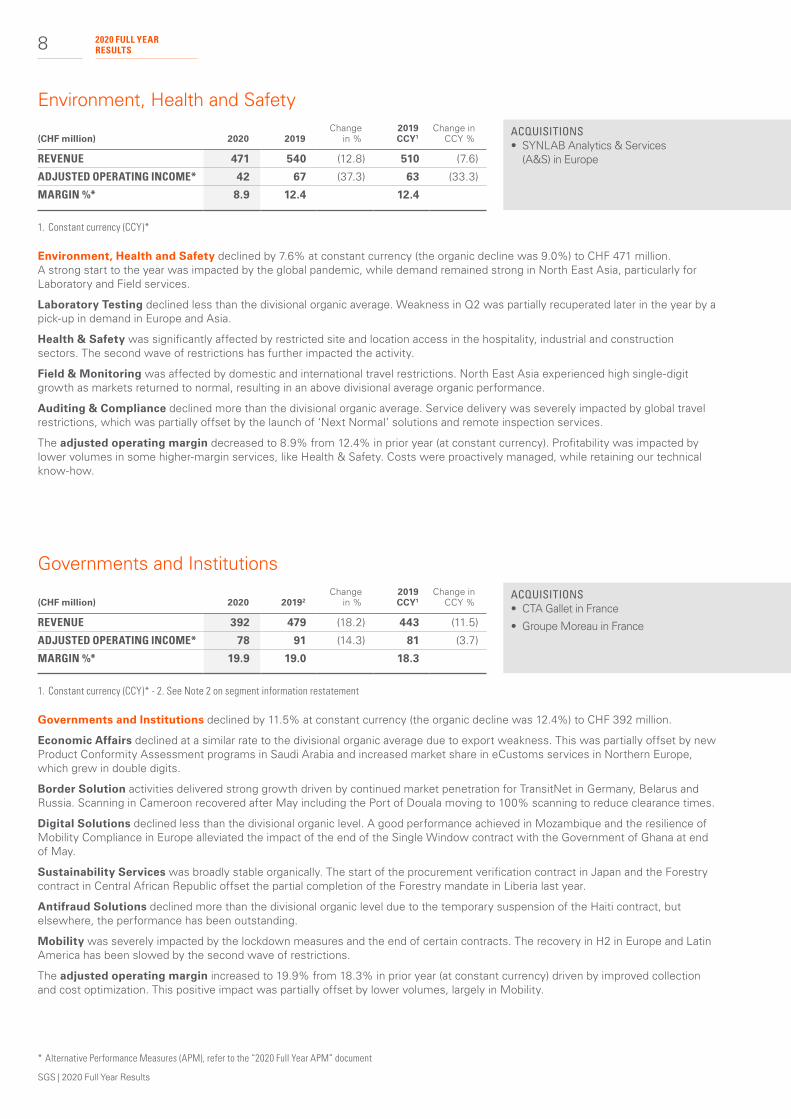
REVENUE 471 540 (12.8) 510 (7.6)
ADJUSTED OPERATING INCOME* 42 67 (37.3) 63 (33.3)
MARGIN %* 8.9 12.4 12.4
1. Constant currency (CCY)*
Environment, Health and Safety declined by 7.6% at constant currency (the organic decline was 9.0%) to CHF 471 million. A strong start to the year was impacted by the global pandemic, while demand remained strong in North East Asia, particularly for Laboratory and Field services.
Laboratory Testing declined less than the divisional organic average. Weakness in Q2 was partially recuperated later in the year by a pick-up in demand in Europe and Asia.
Health & Safety was significantly affected by restricted site and location access in the hospitality, industrial and construction sectors. The second wave of restrictions has further impacted the activity.
Field & Monitoring was affected by domestic and international travel restrictions. North East Asia experienced high single-digit growth as markets returned to normal, resulting in an above divisional average organic performance.
Auditing & Compliance declined more than the divisional organic average. Service delivery was severely impacted by global travel restrictions, which was partially offset by the launch of ‘Next Normal’ solutions and remote inspection services.
The adjusted operating margin decreased to 8.9% from 12.4% in prior year (at constant currency). Profitability was impacted by lower volumes in some higher-margin services, like Health & Safety. Costs were proactively managed, while retaining our technical know-how.
Environment, Health and Safety
ACQUISITIONS• SYNLAB Analytics & Services
(A&S) in Europe
(CHF million) 2020 20192Change
in %2019 CCY1
Change in CCY %
REVENUE 392 479 (18.2) 443 (11.5)
ADJUSTED OPERATING INCOME* 78 91 (14.3) 81 (3.7)
MARGIN %* 19.9 19.0 18.3
1. Constant currency (CCY)* - 2. See Note 2 on segment information restatement
Governments and Institutions declined by 11.5% at constant currency (the organic decline was 12.4%) to CHF 392 million.
Economic Affairs declined at a similar rate to the divisional organic average due to export weakness. This was partially offset by new Product Conformity Assessment programs in Saudi Arabia and increased market share in eCustoms services in Northern Europe, which grew in double digits.
Border Solution activities delivered strong growth driven by continued market penetration for TransitNet in Germany, Belarus and Russia. Scanning in Cameroon recovered after May including the Port of Douala moving to 100% scanning to reduce clearance times.
Digital Solutions declined less than the divisional organic level. A good performance achieved in Mozambique and the resilience of Mobility Compliance in Europe alleviated the impact of the end of the Single Window contract with the Government of Ghana at end of May.
Sustainability Services was broadly stable organically. The start of the procurement verification contract in Japan and the Forestry contract in Central African Republic offset the partial completion of the Forestry mandate in Liberia last year.
Antifraud Solutions declined more than the divisional organic level due to the temporary suspension of the Haiti contract, but elsewhere, the performance has been outstanding.
Mobility was severely impacted by the lockdown measures and the end of certain contracts. The recovery in H2 in Europe and Latin America has been slowed by the second wave of restrictions.
The adjusted operating margin increased to 19.9% from 18.3% in prior year (at constant currency) driven by improved collection and cost optimization. This positive impact was partially offset by lower volumes, largely in Mobility.
Governments and Institutions
ACQUISITIONS• CTA Gallet in France
• Groupe Moreau in France
* Alternative Performance Measures (APM), refer to the “2020 Full Year APM” document
SGS | 2020 Full Year Results

92020 FULL YEAR RESULTS
SGS | 2020 Full Year Results

2020 FULL YEAR RESULTS10
Condensed Consolidated Financial Statements For the period ended 31 December 2020
(CHF million) Notes 2020 2019
REVENUE 4 5 604 6 600
Salaries and wages (2 797) (3 357)
Subcontractors’ expenses (352) (386)
Depreciation, amortization and impairment (517) (548)
Gain on business disposals 63 268
Other operating expenses (1 206) (1 495)
OPERATING INCOME (EBIT) 4 795 1 082
Financial income 12 18
Financial expenses (66) (79)
Share of profit/(losses) of associates and joint ventures 1 (4)
PROFIT BEFORE TAXES 742 1 017
Taxes (237) (315)
PROFIT FOR THE PERIOD 505 702
Profit attributable to:
Equity holders of SGS SA 480 660
Non-controlling interests 25 42
BASIC EARNINGS PER SHARE (IN CHF) 5 64.05 87.45
DILUTED EARNINGS PER SHARE (IN CHF) 5 63.82 87.18
Condensed Consolidated Income Statement
Condensed Consolidated Statement of Comprehensive Income (CHF million) 2020 2019
Actuarial gains/(losses) on defined benefit plans 14 (18)
Income tax on actuarial (losses)/gains (4) 6
Items that will not be subsequently reclassified to income statement 10 (12)
Exchange differences (182) (68)
Items that may be subsequently reclassified to income statement (182) (68)
OTHER COMPREHENSIVE (LOSS) FOR THE PERIOD (172) (80)
Profit for the period 505 702
TOTAL COMPREHENSIVE INCOME FOR THE PERIOD 333 622
Attributable to:
Equity holders of SGS SA 311 584
Non-controlling interests 22 38
SGS | 2020 Full Year Results

2020 FULL YEAR RESULTS 11
Condensed Consolidated Balance Sheet (CHF million) 2020 2019
ASSETS
NON-CURRENT ASSETS
Property, plant and equipment 872 926
Right-of-use assets 590 611
Goodwill 1 651 1 281
Other intangible assets 333 187
Investments in joint ventures, associates and other companies 34 35
Deferred tax assets 161 174
Other non-current assets 154 149
TOTAL NON-CURRENT ASSETS 3 795 3 363
CURRENT ASSETS
Inventories 57 45
Unbilled revenues and work in progress 160 195
Trade receivables 856 953
Other receivables and prepayments 188 219
Current tax assets 77 77
Marketable securities 9 9
Cash and cash equivalents 1 766 1 466
TOTAL CURRENT ASSETS 3 113 2 964
TOTAL ASSETS 6 908 6 327
EQUITY AND LIABILITIES
CAPITAL AND RESERVES
Share capital 8 8
Reserves 1 282 1 536
Treasury shares (230) (30)
EQUITY ATTRIBUTABLE TO EQUITY HOLDERS OF SGS SA 1 060 1 514
Non-controlling interests 74 81
TOTAL EQUITY 1 134 1 595
NON-CURRENT LIABILITIES
Loans and other financial liabilities 2 390 2 199
Lease liabilities 470 490
Deferred tax liabilities 53 23
Defined benefit obligations 136 151
Provisions 88 91
TOTAL NON-CURRENT LIABILITIES 3 137 2 954
CURRENT LIABILITIES
Loans and other financial liabilities 863 38
Lease liabilities 151 154
Trade and other payables 658 638
Provisions 85 74
Current tax liabilities 140 145
Contract liabilities 189 155
Other creditors and accruals 551 574
TOTAL CURRENT LIABILITIES 2 637 1 778
TOTAL LIABILITIES 5 774 4 732
TOTAL EQUITY AND LIABILITIES 6 908 6 327
SGS | 2020 Full Year Results

2020 FULL YEAR RESULTS12
Attributable to:
(CHF million) Equity holders
of SGS SA Non-controlling
interests Total equity
BALANCE AT 1 JANUARY 2019 1 601 74 1 675
Total comprehensive income for the period 584 38 622
Dividends paid (589) (43) (632)
Share-based payments 17 – 17
Movement in non-controlling interests (102) 12 (90)
Movement on treasury shares 3 – 3
BALANCE AT 31 DECEMBER 2019 1 514 81 1 595
BALANCE AT 1 JANUARY 2020 1 514 81 1 595
Total comprehensive income for the period 311 22 333
Dividends paid (598) (37) (635)
Share-based payments 17 – 17
Movement in non-controlling interests 20 8 28
Movement on treasury shares (204) – (204)
BALANCE AT 31 DECEMBER 2020 1 060 74 1 134
Condensed Consolidated Statement of Changes in Equity
SGS | 2020 Full Year Results

2020 FULL YEAR RESULTS 13
Condensed Consolidated Cash Flow Statement
(CHF million) 2020 2019
Profit for the year 505 702
Non-cash and non-operating items 748 756
Decrease/(increase) in working capital 186 (3)
Taxes paid (253) (306)
CASH FLOW FROM OPERATING ACTIVITIES 1 186 1 149
Purchase of property, plant and equipment and other intangible assets (259) (290)
Disposal of property, plant and equipment and other intangible assets 13 11
Acquisition of businesses (492) (169)
Proceeds from disposal of businesses 71 333
Increase in other non-current assets (4) (2)
Decrease/(increase) in investments in joint ventures, associates and other companies 1 (4)
Interest received 15 21
CASH FLOW USED BY INVESTING ACTIVITIES (655) (100)
Dividends paid to equity holders of SGS SA (598) (589)
Dividends paid to non-controlling interests (37) (43)
Transaction with non-controlling interests (1) (12)
Cash paid on treasury shares (208) (23)
Proceeds/(payment) of corporate bonds 499 (375)
Interest paid (63) (87)
Payment of lease liabilities (161) (174)
Proceeds from borrowings 542 –
Payment of borrowings (154) –
CASH FLOW USED BY FINANCING ACTIVITIES (181) (1 303)
Currency translation (50) (23)
INCREASE/(DECREASE) IN CASH AND CASH EQUIVALENTS 300 (277)
CASH AND CASH EQUIVALENTS AT BEGINNING OF YEAR 1 466 1 743
Increase/(decrease) in cash and cash equivalents 300 (277)
CASH AND CASH EQUIVALENTS AT END OF THE PERIOD 1 766 1 466
SGS | 2020 Full Year Results

2020 FULL YEAR RESULTS14
1. ACTIVITIES OF THE GROUP SGS SA and its subsidiaries (the “Group”) operate around the world under the name SGS. The head office of the Group is located in Geneva, Switzerland. SGS is the global leader in inspection, verification, testing and certification services supporting international trade in agriculture, minerals, petroleum and consumer products. It also provides these services to governments, international institutions and customers engaged in the industrial, environmental and life science sectors.
2. BASIS OF PREPARATION, SIGNIFICANT TRANSACTION AND SEGMENT INFORMATION RESTATEMENTBASIS OF PREPARATIONThese condensed consolidated financial statements have been prepared in accordance with the measurement and recognition criteria of International Financial Reporting Standards (IFRS).
COVID-19 PANDEMICCovid-19 was declared a pandemic by the World Health Organization on 11 March 2020. Through this challenging period, SGS has focused on employee safety, customer service continuity and has been managing the business with strong financial discipline.
The Group has remained agile, adapting its operations to local guidelines and requirements, travel restrictions within and across countries, micro and macroeconomic changes, as well as specific client requests. These have resulted in local business disruptions, such as temporary site closures, supply chain interruptions, postponement or suspension of consultancy and supervision projects. Consequently, SGS has experienced a decline in activities in 2020 across most business lines as well as incurring additional costs to respond to the new way of operating during the pandemic while maintaining efficient workforce management.
Supported by its diversified service portfolio, know-how and geographical coverage, SGS has been able to further evolve core products and develop new services to serve new customer demand.
These 2020 condensed financial statements were prepared considering the impact of the pandemic, as well as the future uncertainties, with particular attention to (i) the impairment of non-current assets, (ii) the appropriateness of the allowance for trade receivables, unbilled revenue and work in progress, (iii) the level of provision for restructuring and risks as well as (iv) accounting for government grants.
BUSINESS SEGMENT FINANCIAL RESTATEMENTAs indicated early this year, the Group’s core skills and organizational structure are evolving to adapt to new market conditions and customer demands.
A strategic review of our Transportation business line (TRP) was completed in 2019. The integration of this business line into our other business segments, effective as of 1 January 2020, resulted in providing a more natural home to the Transportation activities. Other than creating more operational synergies, the Group expects to reinvigorate the growth profiles of these services. The previously reported 2019 segment disclosures have been restated to reflect this change and are disclosed in note 4.
3. CHANGES TO THE GROUP’S ACCOUNTING POLICIESThe accounting policies used in the preparation and presentation of the condensed financial statements are consistent with those used in the consolidated financial statements.
Several new amendments and interpretations were adopted effective 1 January 2020 but have no material impact on the Group’s consolidated interim financial statements.
GOVERNMENT GRANTSIAS 20 sets out the principle for the recognition, measurement, presentation and disclosure of government grants. Government grants that are not related to assets are credited to the income statement as a deduction of the related expenses. Government grants are recognized when there is a reasonable assurance that the grant will be received and all attached conditions will be met.
Notes to the Condensed Consolidated Financial Statements
SGS | 2020 Full Year Results

2020 FULL YEAR RESULTS 15
4. ANALYSIS OF OPERATING INCOME
(CHF million) 2020 2019
ADJUSTED OPERATING INCOME* 900 1 063
Amortization and impairment of acquired intangibles (31) (36)
Restructuring costs (84) (89)
Goodwill impairment (37) (21)
Gain on business disposals 63 268
Transaction and integration costs (16) (19)
Other non-recurring items1 – (84)
OPERATING INCOME 795 1 082
1. 2019 included mainly tax provisions of CHF 33 million, impairment of fixed and intangible assets of CHF 24 million and the remeasurement of the defined benefit obligation of the Swiss pension fund of CHF 10 million
DECEMBER 2020
(CHF million) Revenue
Adjusted operating
income*
Amortization of acquisition
intangibles
Restructuring costs
Goodwill impairment
Gain on business
disposals
Transaction and
integration costs
Operating income
by business
AFL 996 175 (4) (5) (16) 63 (4) 209
MIN 639 111 (1) (7) – – – 103
OGC 776 76 – (5) – – (2) 69
CRS 1 054 264 (2) (3) – – (1) 258
CBE 429 82 (10) (3) (8) – – 61
IND 847 72 (7) (13) (10) – (2) 40
EHS 471 42 (4) (3) – – (6) 29
GIS 392 78 (3) (45) (3) – (1) 26
TOTAL 5 604 900 (31) (84) (37) 63 (16) 795
DECEMBER 2019 RESTATED
(CHF million) Revenue
Adjusted operating
income*
Amortization of acquisition
intangibles
Restructuring costs
Goodwill impairment
Gain on business
disposals
Transaction and
integration costs
Other non-recurring
items
Operating income
by business
AFL 1 074 172 (3) (13) - - (2) (11) 143
MIN 753 128 (1) (14) - - - (8) 105
OGC 1 075 120 (4) (15) - 268 (10) (22) 337
CRS 1 091 270 (3) (8) - - - (11) 248
CBE 497 99 (6) (5) - - (4) (5) 79
IND 1 091 116 (13) (20) (21) - (1) (15) 46
EHS 540 67 (4) (5) - - (1) (5) 52
GIS 479 91 (2) (9) - - (1) (7) 72
TOTAL 6 600 1 063 (36) (89) (21) 268 (19) (84) 1 082
* Alternative Performance Measures (APM), refer to the “2020 Full Year APM” document
SGS | 2020 Full Year Results
2020 FULL YEAR RESULTS16
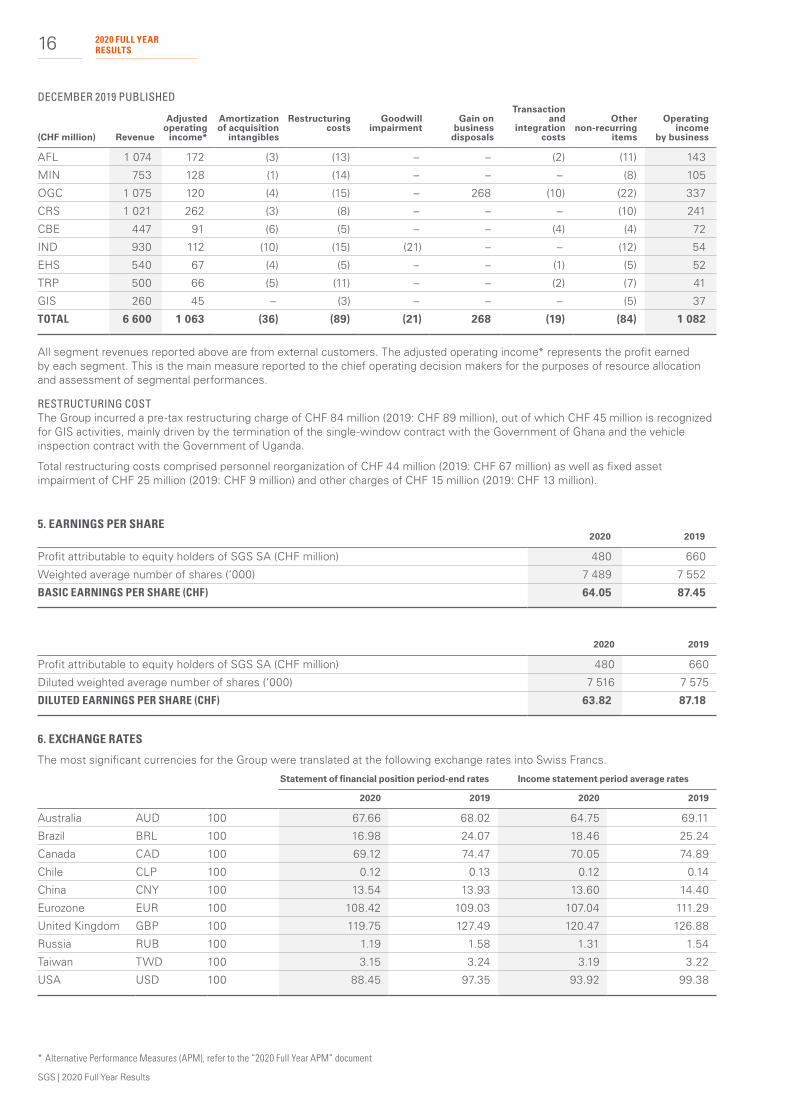
DECEMBER 2019 PUBLISHED
(CHF million) Revenue
Adjusted operating
income*
Amortization of acquisition
intangibles
Restructuring costs
Goodwill impairment
Gain on business
disposals
Transaction and
integration costs
Other non-recurring
items
Operating income
by business
AFL 1 074 172 (3) (13) – – (2) (11) 143
MIN 753 128 (1) (14) – – – (8) 105
OGC 1 075 120 (4) (15) – 268 (10) (22) 337
CRS 1 021 262 (3) (8) – – – (10) 241
CBE 447 91 (6) (5) – – (4) (4) 72
IND 930 112 (10) (15) (21) – – (12) 54
EHS 540 67 (4) (5) – – (1) (5) 52
TRP 500 66 (5) (11) – – (2) (7) 41
GIS 260 45 – (3) – – – (5) 37
TOTAL 6 600 1 063 (36) (89) (21) 268 (19) (84) 1 082
All segment revenues reported above are from external customers. The adjusted operating income* represents the profit earned by each segment. This is the main measure reported to the chief operating decision makers for the purposes of resource allocation and assessment of segmental performances.
RESTRUCTURING COSTThe Group incurred a pre-tax restructuring charge of CHF 84 million (2019: CHF 89 million), out of which CHF 45 million is recognized for GIS activities, mainly driven by the termination of the single-window contract with the Government of Ghana and the vehicle inspection contract with the Government of Uganda.
Total restructuring costs comprised personnel reorganization of CHF 44 million (2019: CHF 67 million) as well as fixed asset impairment of CHF 25 million (2019: CHF 9 million) and other charges of CHF 15 million (2019: CHF 13 million).
5. EARNINGS PER SHARE2020 2019
Profit attributable to equity holders of SGS SA (CHF million) 480 660
Weighted average number of shares (‘000) 7 489 7 552
BASIC EARNINGS PER SHARE (CHF) 64.05 87.45
2020 2019
Profit attributable to equity holders of SGS SA (CHF million) 480 660
Diluted weighted average number of shares (‘000) 7 516 7 575
DILUTED EARNINGS PER SHARE (CHF) 63.82 87.18
6. EXCHANGE RATES
The most significant currencies for the Group were translated at the following exchange rates into Swiss Francs.
Statement of financial position period-end rates Income statement period average rates
2020 2019 2020 2019
Australia AUD 100 67.66 68.02 64.75 69.11
Brazil BRL 100 16.98 24.07 18.46 25.24
Canada CAD 100 69.12 74.47 70.05 74.89
Chile CLP 100 0.12 0.13 0.12 0.14
China CNY 100 13.54 13.93 13.60 14.40
Eurozone EUR 100 108.42 109.03 107.04 111.29
United Kingdom GBP 100 119.75 127.49 120.47 126.88
Russia RUB 100 1.19 1.58 1.31 1.54
Taiwan TWD 100 3.15 3.24 3.19 3.22
USA USD 100 88.45 97.35 93.92 99.38
* Alternative Performance Measures (APM), refer to the “2020 Full Year APM” document
SGS | 2020 Full Year Results

2020 FULL YEAR RESULTS 17
Shareholder Information SGS SA CORPORATE OFFICE1 place des Alpes P.O. Box 2152 CH – 1211 Geneva 1 t +41 (0)22 739 91 11 f +41 (0)22 739 98 86 e [email protected] www.sgs.com
STOCK EXCHANGE LISTINGSIX Swiss Exchange, SGSN
STOCK EXCHANGE TRADINGSIX Swiss Exchange
COMMON STOCK SYMBOLSBloomberg: Registered Share: SGSN.SW Reuters: Registered Share: SGSN.S Telekurs: Registered Share: SGSN ISIN: Registered Share: CH0002497458 Swiss security number: 249745
INVESTOR RELATIONSToby Reeks SGS SA 1 place des Alpes P.O. Box 2152 CH – 1211 Geneva 1 t +41 (0)22 739 99 87 m +41 (0)79 641 83 02 www.sgs.com
INVESTOR DAYS Thursday and Friday 27-28 May 2021
2021 HALF YEAR RESULTSMonday, 19 July 2021
ANNUAL GENERAL MEETING OF SHAREHOLDERSTuesday, 23 March 2021 Geneva, Switzerland
MEDIA RELATIONSDaniel Rufenacht SGS SA 1 place des Alpes P.O. Box 2152 CH – 1211 Geneva 1 t +41 (0)22 739 94 01 m +41 (0)78 656 94 59 www.sgs.com
DISCLAIMER This material is provided for information purposes only and is not intended to confer any legal rights to you.
This document does not constitute an invitation to invest in SGS shares. Any decisions you make in reliance on this information are solely your responsibility.
This document is given as of the dates specified, is not updated and any forward-looking statements are made subject to the following reservations:
This document contains certain forward-looking statements that are neither historical facts nor guarantees of future performance. Because these statements involve risks and uncertainties that are beyond control or estimation of SGS, there are important factors that could cause actual results to differ materially from those expressed or implied by these forward-looking statements. These statements speak only as of the date of this document.
Except as required by any applicable law or regulation, SGS expressly disclaims any obligation to release publicly any updates or revisions to any forward-looking statements contained herein to reflect any change in SGS Group’s expectations with regard thereto or any change in events or conditions on which any such statements are based.
SGS | 2020 Full Year Results

www.sgs.com
LEARN MORE ABOUT HOW WE’RE ENABLING A BETTER, SAFE AND MORE INTERCONNECTED WORLD
SGS is a registered trademark of SGS Société Générale de Surveillance SA