Embed Size (px)
Citation preview
Molecular Microbial Ecology Primer
Session 611 Jan. 2005
Michael RappéHawaii Institute of Marine Biology

• Genetic information and phylogeneticmarkers (G5)
• Phylogenetic trees (G6)
• Ribosomal RNA gene cloning andsequencing (G7)
• Survey of methods for fingerprintingmicrobial communities (G8)
Microbial Ecology: What is it we really wantto know??
• Who is there?
• How many of each “type” are present at any giventime and location?
• What are they doing (and, what resources are theyusing to do it)?
• How fast are they doing it?
• Use molecular biology techniques to:-Identify microbial “species” & describe distributions-Predict metabolic capacities from genetic information-Link microbial “species” with system function; assign functional roles
Molecular Microbial EcologyEcology without cultivation
Genetic Information and PhylogeneticMarkers (G5)
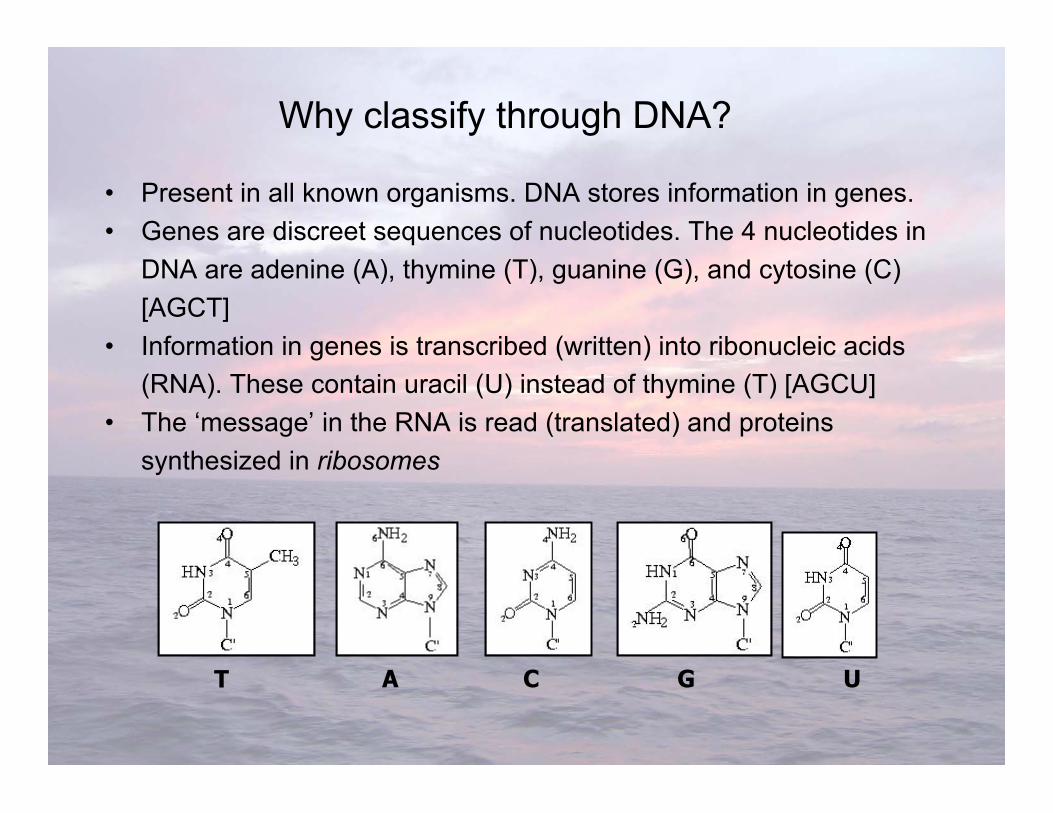
• Present in all known organisms. DNA stores information in genes.• Genes are discreet sequences of nucleotides. The 4 nucleotides in
DNA are adenine (A), thymine (T), guanine (G), and cytosine (C)[AGCT]
• Information in genes is transcribed (written) into ribonucleic acids(RNA). These contain uracil (U) instead of thymine (T) [AGCU]
• The ‘message’ in the RNA is read (translated) and proteinssynthesized in ribosomes
A C GT U
Why classify through DNA?
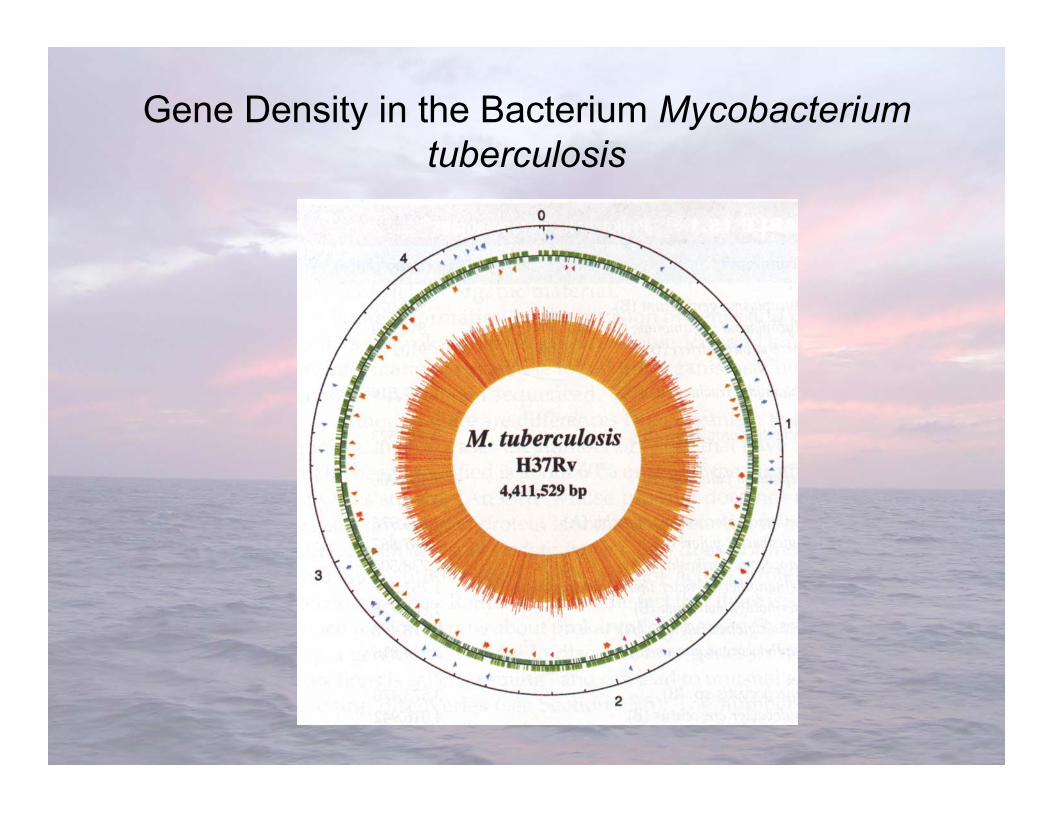
Gene Density in the Bacterium Mycobacteriumtuberculosis

• In a perfect world, we would manipulate and comparewhole genomes to determine relationships amongmicrobes
• Not yet feasible
• Must substitute a phylogenetic marker: a gene who’ssequence is used to infer phylogenetic relationshipsamong microbes
• MAJOR ASSUMPTION: gene phylogeny more or lessreflects the evolutionary history of the microbespossessing the gene of interest
Ribosomes• Sites of protein synthesis• Usually 10,000 to 20,000 ribosomes per cell• May occupy 25% of cell volume and use 90% of the
cell’s energy• Differentiated on the basis of size into large and small
subunits
Ribosomal RNA and taxonomy• Ribosomes are critical to cell function, so their
structural RNAs should not evolve rapidly - asequence change may disable the ribosome
• Ribosomal gene sequences are conserved, i.e., theydo not change much over time

Why the 16S Ribosomal RNA?
• Universally conserved: possessed by all cellularforms of life (Eukarya, Archaea, and Bacteria)
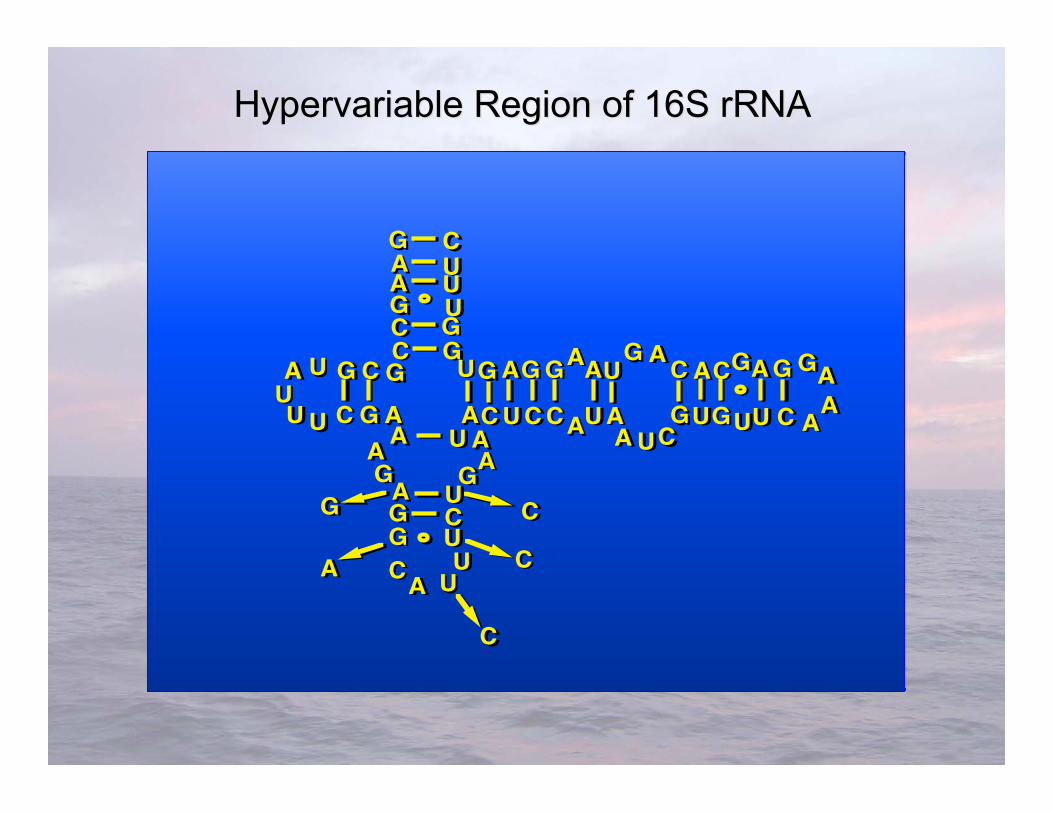
• With very few exceptions, is not laterally transferred• Mosaic of highly conserved and highly variable
regions – broad range of utility in phylogeneticanalyses
• Substitutions generally considered to be neutral (orclose to it)
• Conserved secondary structure useful for detectingPCR and sequencing artifacts/errors
• Estimated divergence rate: 1% per 50 million years(can vary by an order of magnitude…………..)
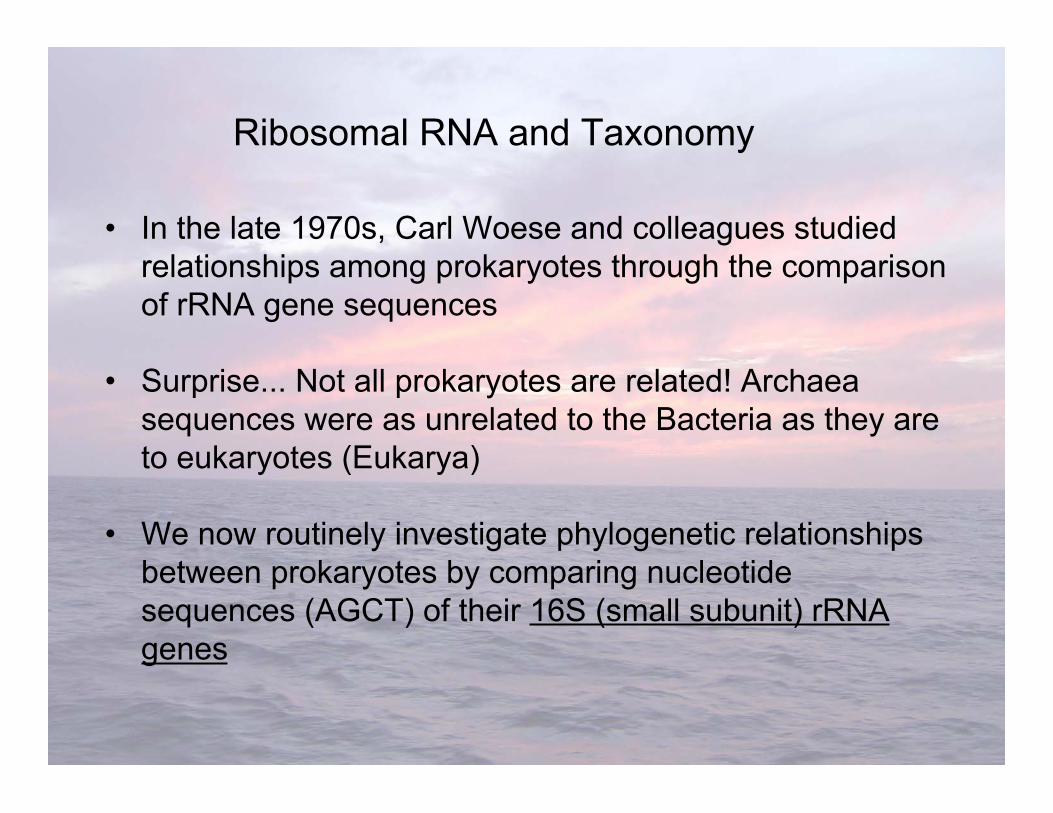
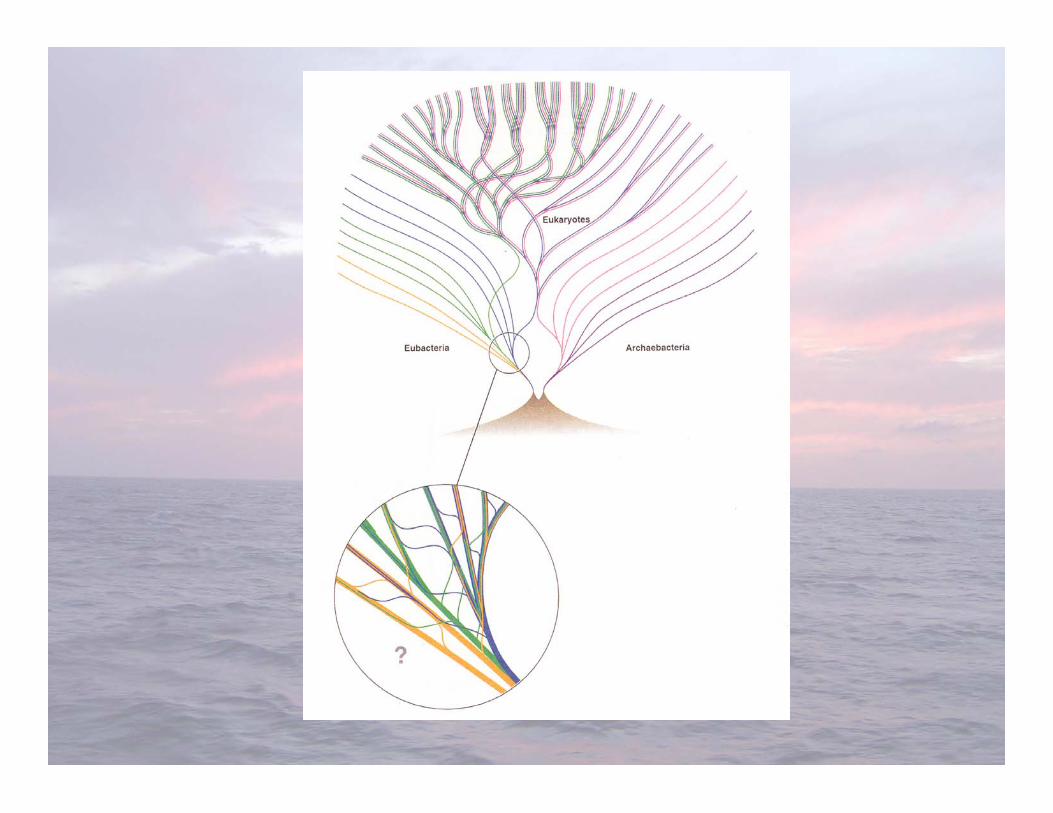
• In the late 1970s, Carl Woese and colleagues studiedrelationships among prokaryotes through the comparisonof rRNA gene sequences
• Surprise... Not all prokaryotes are related! Archaeasequences were as unrelated to the Bacteria as they areto eukaryotes (Eukarya)
• We now routinely investigate phylogenetic relationshipsbetween prokaryotes by comparing nucleotidesequences (AGCT) of their 16S (small subunit) rRNAgenes
Ribosomal RNA and Taxonomy

Organisms group together if their 16S rRNA sequencesare most similar
Differences suggest more phylogenetic distance, andthe further apart the organisms are in an evolutionarysense: more distant from their last common ancestor
RNA gene sequencing and taxonomic groups
Phylogenetic Trees (G6)

PCR is a way of finding a needle in a haystack andsubsequently producing a pile of needles from the hay.
Polymerase Chain Reaction (PCR)
For example, we are looking for a specific 300 bpstrand of DNA in a sequence of ~3,000,000,000 bp
If you want to manipulate or see DNA, you need LOTSof it!

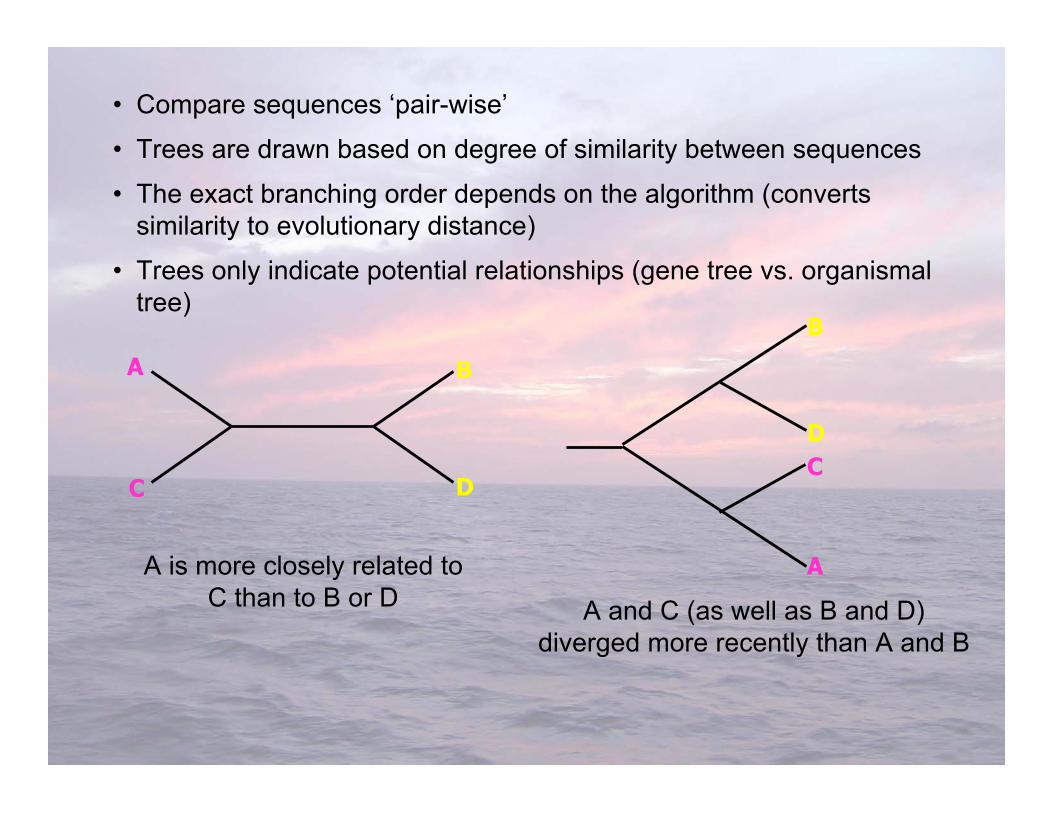
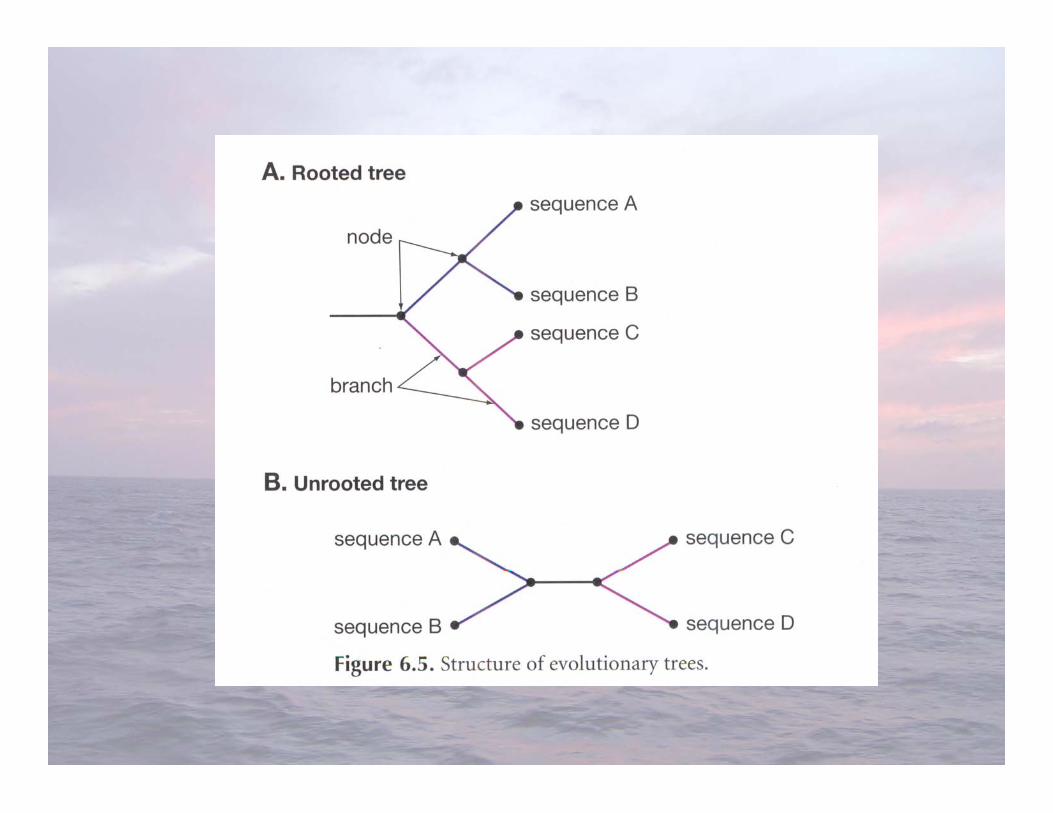
• Compare sequences ‘pair-wise’
• Trees are drawn based on degree of similarity between sequences
• The exact branching order depends on the algorithm (convertssimilarity to evolutionary distance)
• Trees only indicate potential relationships (gene tree vs. organismaltree)
C
A B
DC
A
B
D
A is more closely related toC than to B or D A and C (as well as B and D)
diverged more recently than A and B


Ribosomal RNA Gene Cloning and SequencingFrom Environmental Samples (G7)
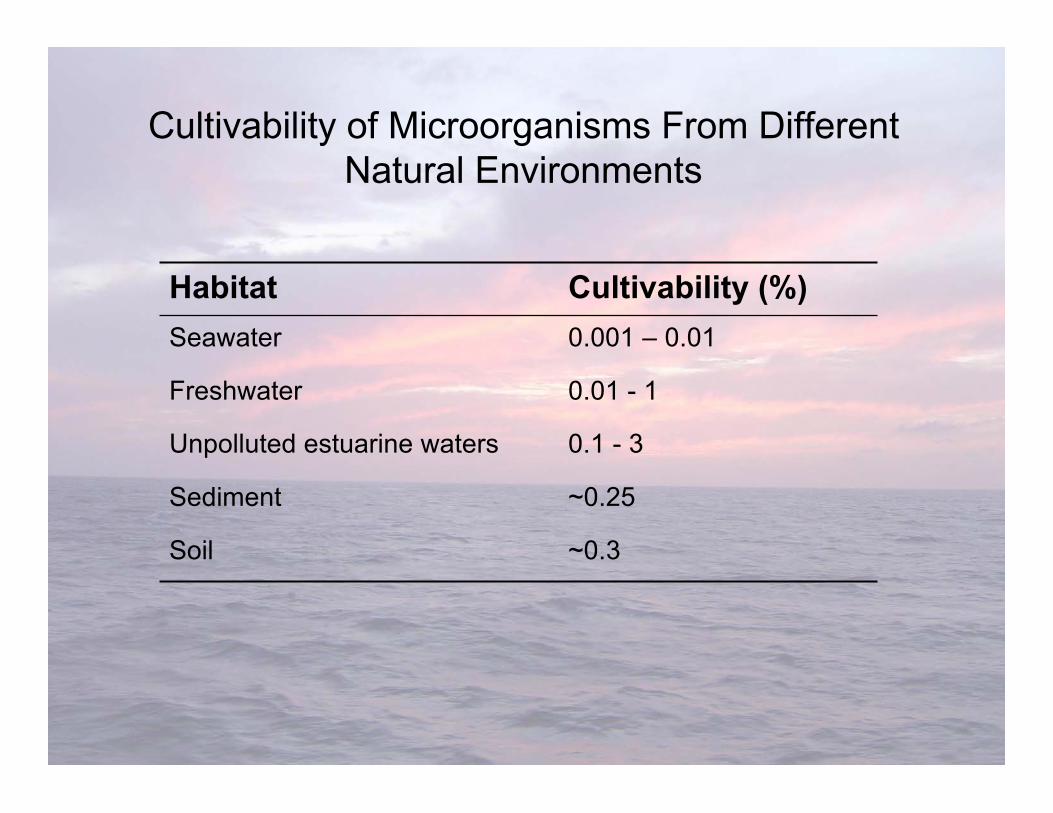
Cultivability of Microorganisms From DifferentNatural Environments
~0.3Soil
~0.25Sediment
0.1 - 3Unpolluted estuarine waters
0.01 - 1Freshwater
0.001 – 0.01Seawater
Cultivability (%)Habitat

Are the microorganisms that are easily cultured inthe laboratory using traditional techniques:
are a small subset of the the community and the cells notaccounted for (>99.9% of the total) are completely different
taxa/species?
OR
representative of the numerically dominant species in nativebacterioplankton communities, but possess low cultivation
efficiencies (e.g. a high incidence of inactive cells?),
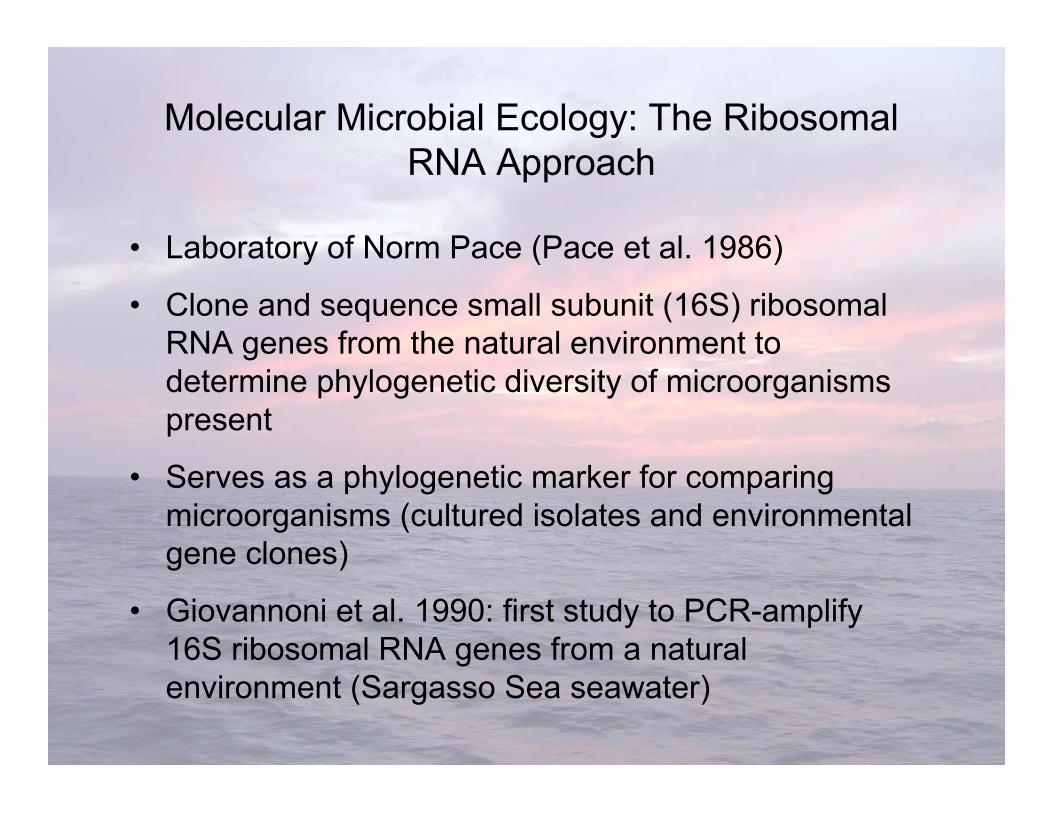
Molecular Microbial Ecology: The RibosomalRNA Approach
• Laboratory of Norm Pace (Pace et al. 1986)
• Clone and sequence small subunit (16S) ribosomalRNA genes from the natural environment todetermine phylogenetic diversity of microorganismspresent
• Serves as a phylogenetic marker for comparingmicroorganisms (cultured isolates and environmentalgene clones)
• Giovannoni et al. 1990: first study to PCR-amplify16S ribosomal RNA genes from a naturalenvironment (Sargasso Sea seawater)
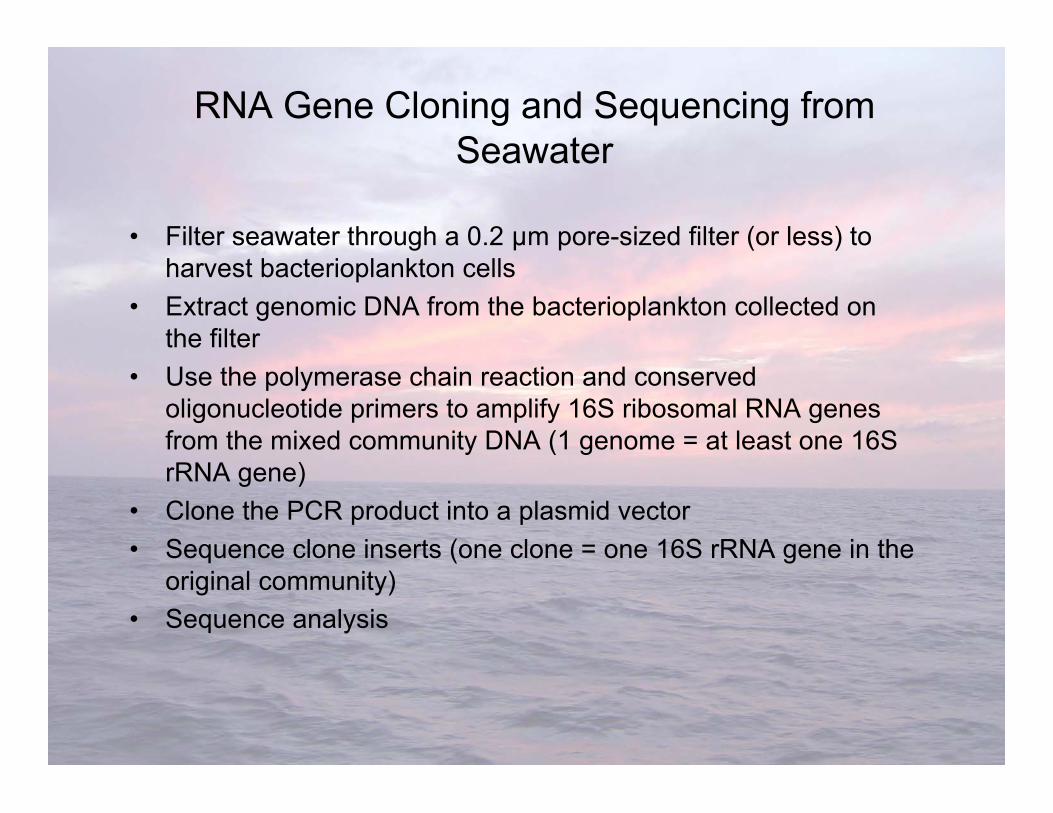
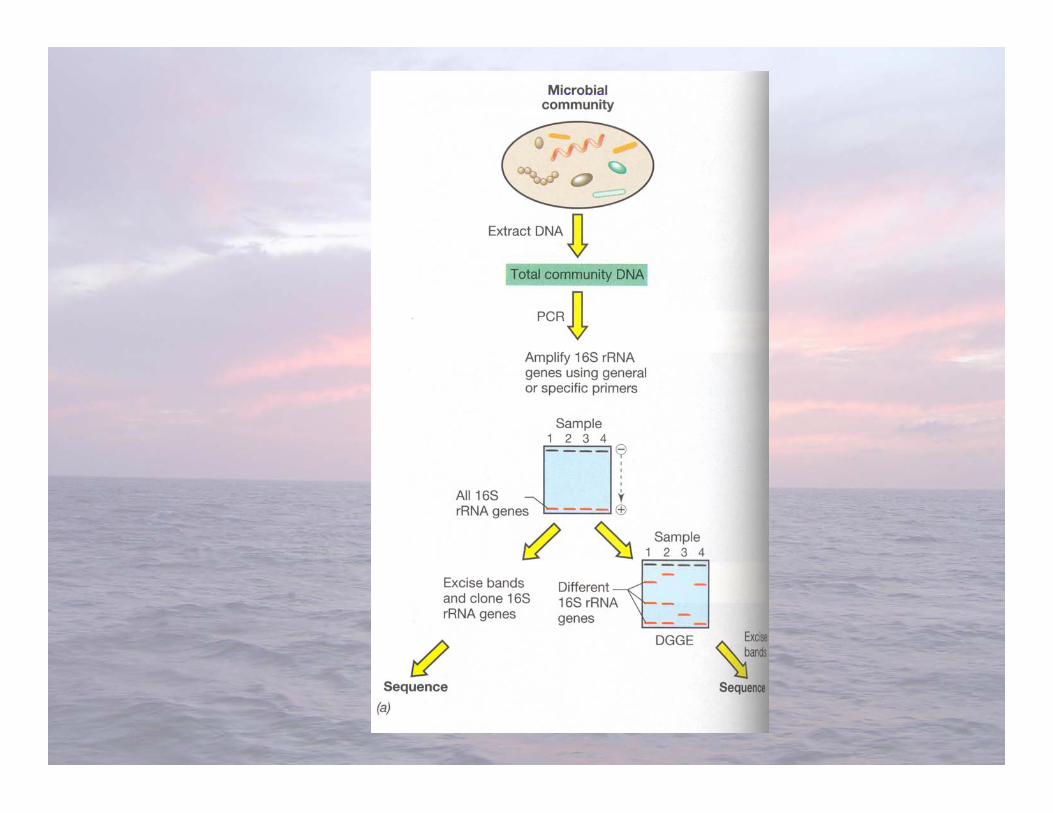
RNA Gene Cloning and Sequencing fromSeawater
• Filter seawater through a 0.2 µm pore-sized filter (or less) toharvest bacterioplankton cells
• Extract genomic DNA from the bacterioplankton collected onthe filter
• Use the polymerase chain reaction and conservedoligonucleotide primers to amplify 16S ribosomal RNA genesfrom the mixed community DNA (1 genome = at least one 16SrRNA gene)
• Clone the PCR product into a plasmid vector• Sequence clone inserts (one clone = one 16S rRNA gene in the
original community)• Sequence analysis


• Advantages-Can get full-length sequence data for phylogenetic characterization-Easy to do-Libraries can be screened in several ways
• Disadvantages-Expensive to sequence-Difficult to analyze many different samples
Environmental Clone Libraries

Link Environmental Gene Clones WithMicrobes of Known Characteristics

Graphs Depicting theNumber of 16S rRNAGene SequencesPublished inGenBank Since 1993
Rappé and Giovannoni 2003

Survey of methods for fingerprinting microbialcommunities (G8)

Liu et al. (1997) Appl Environ Microbiol 63:4516-4522
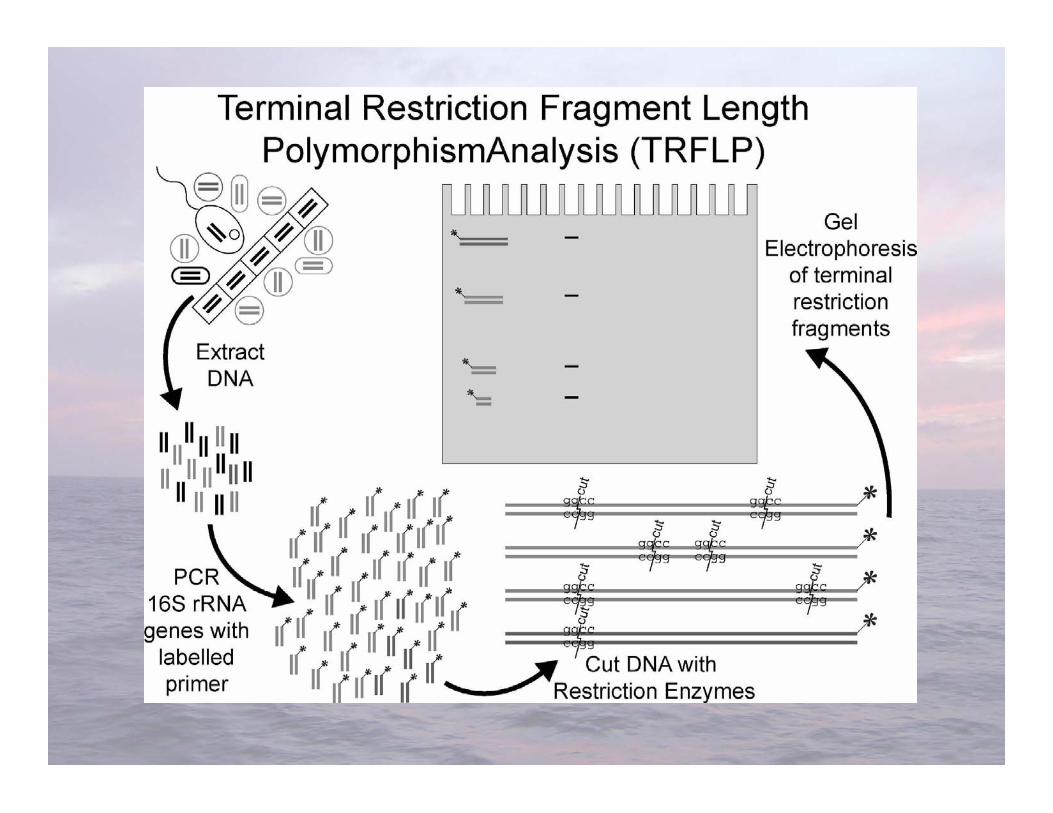
Distinguishes organisms using length variability of oneend of a gene after it is cut into several fragments withrestriction endonucleases
Terminal Restriction Fragment LengthPolymorphism analysis (T-RFLP)
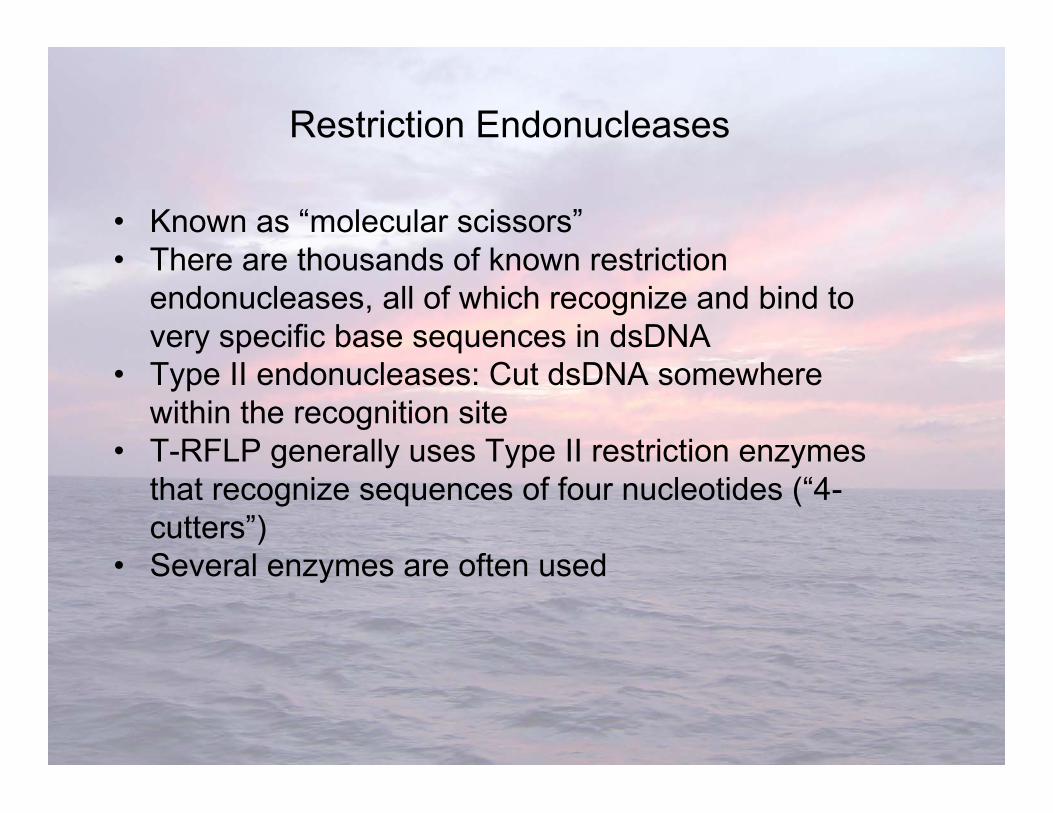
• Known as “molecular scissors”• There are thousands of known restriction
endonucleases, all of which recognize and bind tovery specific base sequences in dsDNA
• Type II endonucleases: Cut dsDNA somewherewithin the recognition site
• T-RFLP generally uses Type II restriction enzymesthat recognize sequences of four nucleotides (“4-cutters”)
• Several enzymes are often used
Restriction Endonucleases

Two Type II restriction endonucleases that recognizesequences of 4 nucleotides:
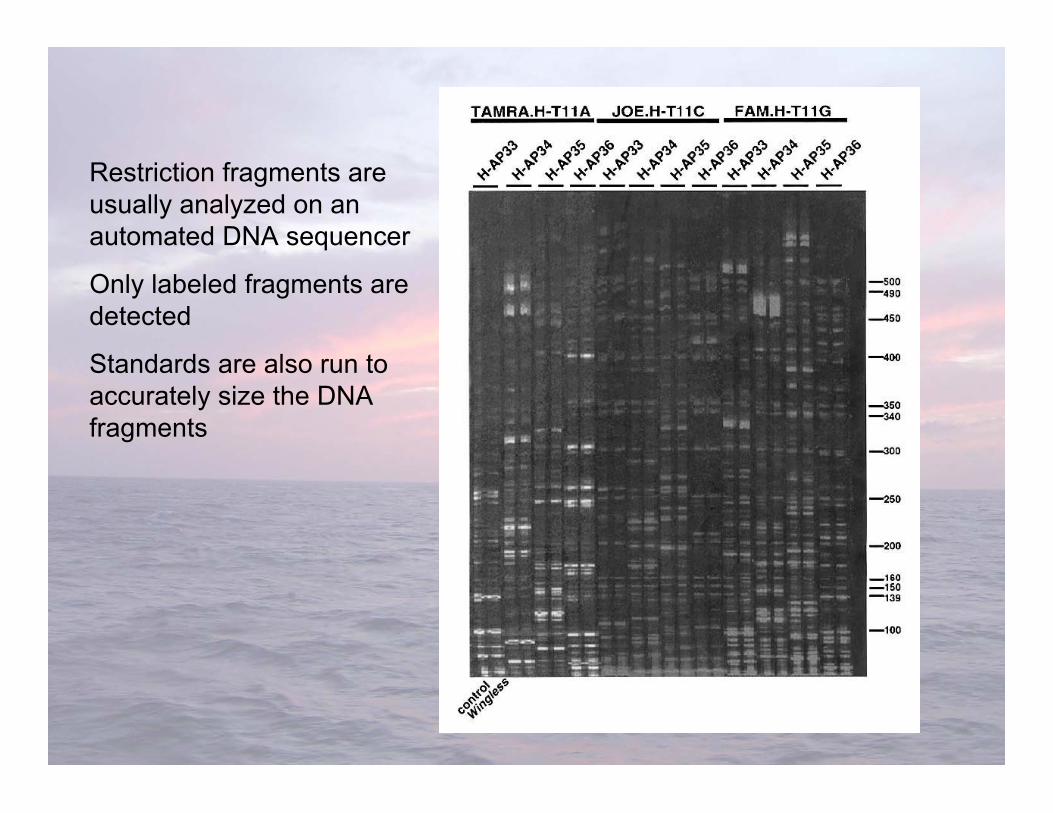
Restriction fragments areusually analyzed on anautomated DNA sequencer
Only labeled fragments aredetected
Standards are also run toaccurately size the DNAfragments
• Advantages-Relatively easy to do-Results can be banked for future comparisons
• Limitations-Less sensitive phylogenetic resolution than sequencing-Each fragment length can potentially represent a diversity of microorganisms-Cannot directly sequence restriction fragments, making identification indirect
T-RFLP

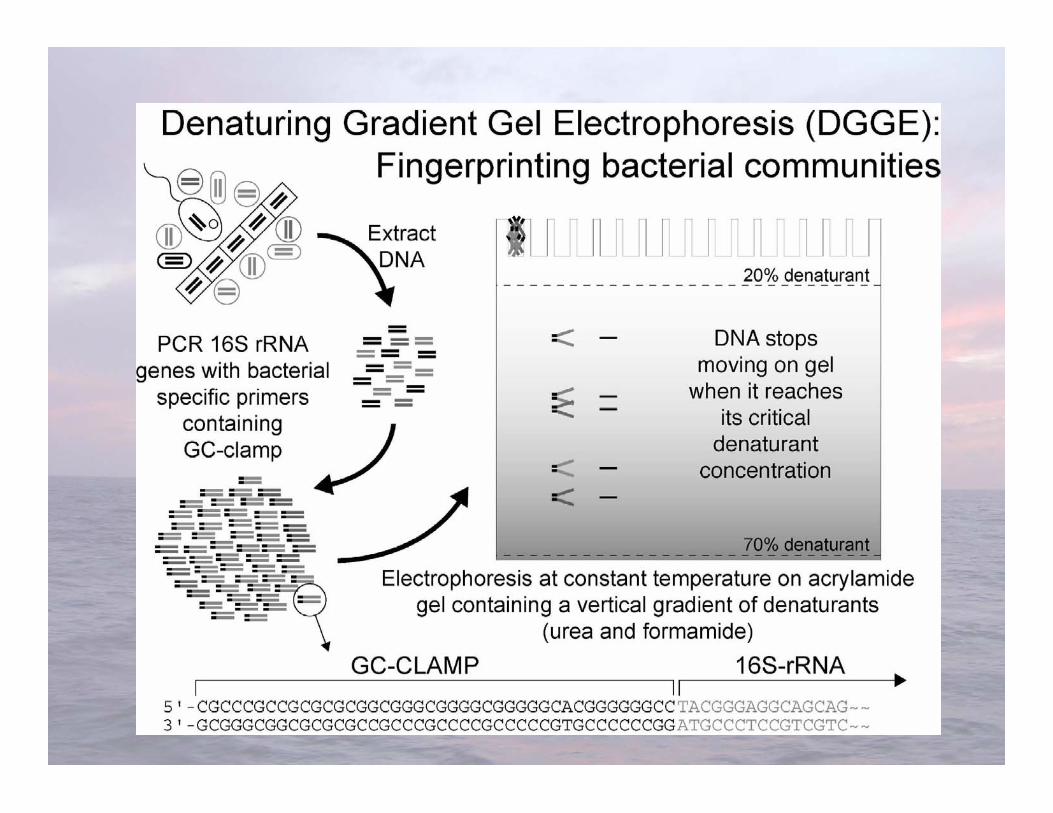
Muyzer et al. 1993. Appl Environ Microbiol 59:695-700
Distinguishes organisms using the variable meltingcharacteristics of dsDNA with different nucleotidesequences
Denaturing Gradient Gel Electrophoresis(DGGE)
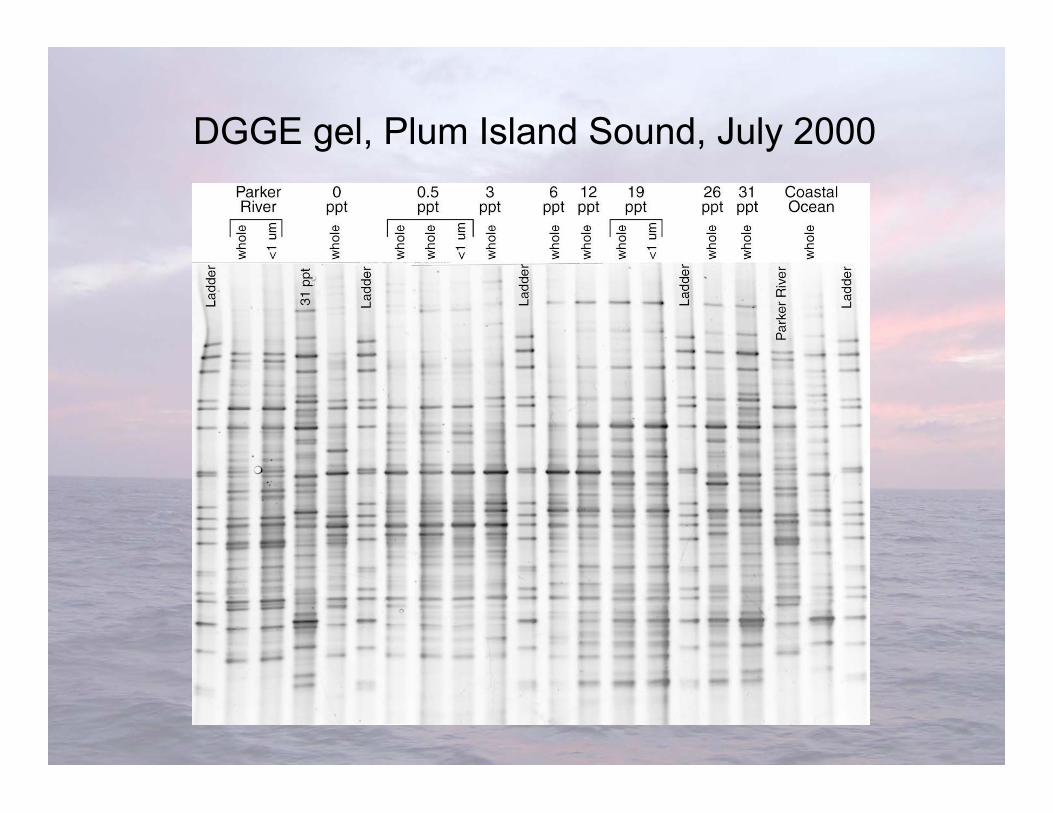
DGGE gel, Plum Island Sound, July 2000
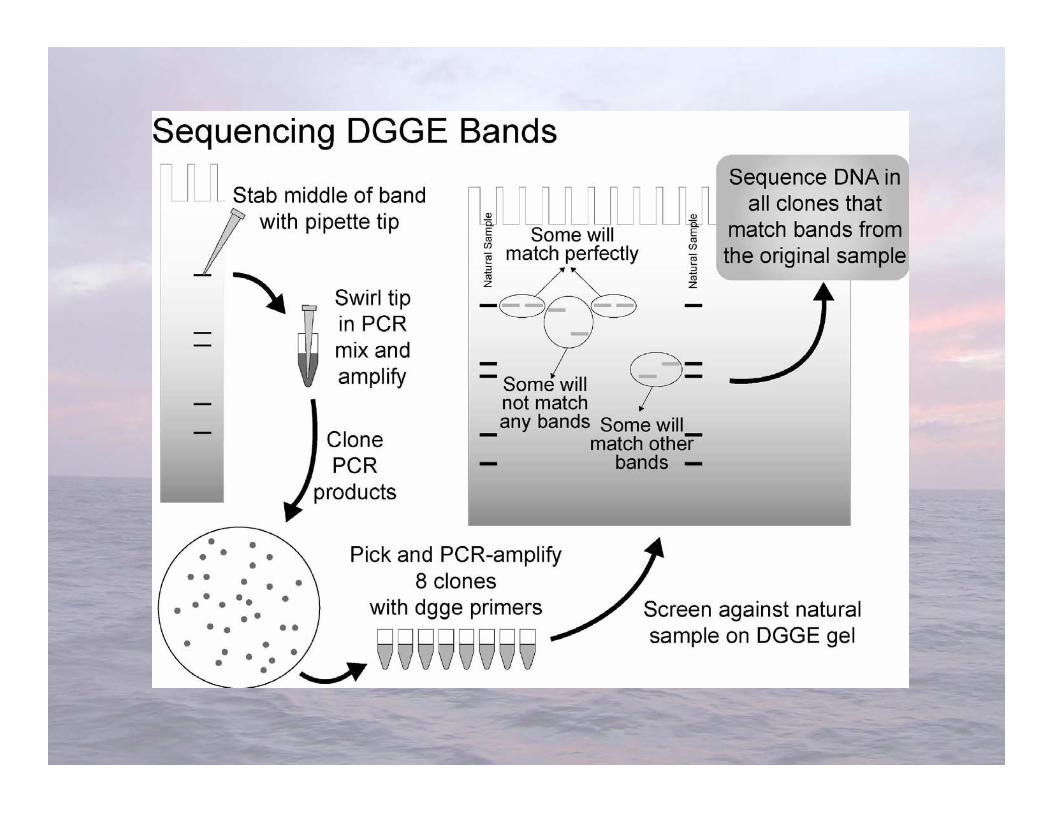

• Advantages-Very sensitive to variations in DNA sequence-Can excise and sequence DNA in bands
• Limitations-Somewhat difficult-”One band-one species” isn’t always true-Cannot compare bands between gels-Only works well with short fragments (<500 bp), thus limiting phylogenetic characterization
DGGE
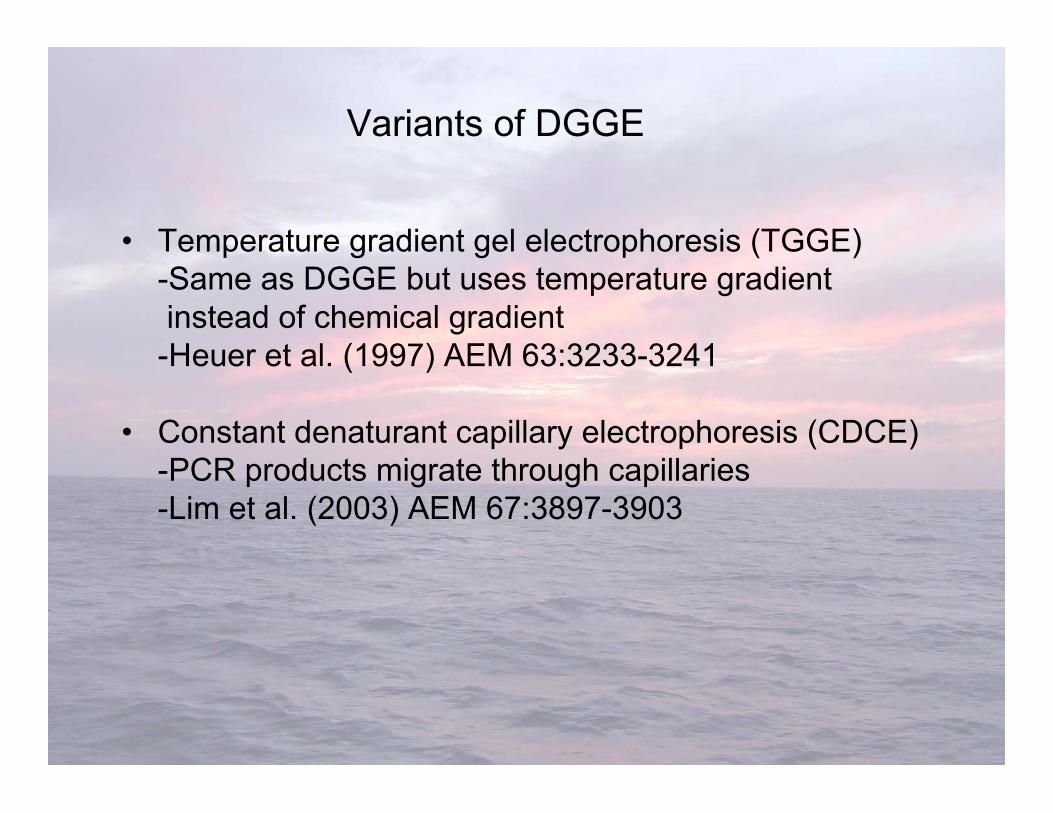
• Temperature gradient gel electrophoresis (TGGE)-Same as DGGE but uses temperature gradient instead of chemical gradient-Heuer et al. (1997) AEM 63:3233-3241
• Constant denaturant capillary electrophoresis (CDCE)-PCR products migrate through capillaries-Lim et al. (2003) AEM 67:3897-3903
Variants of DGGE
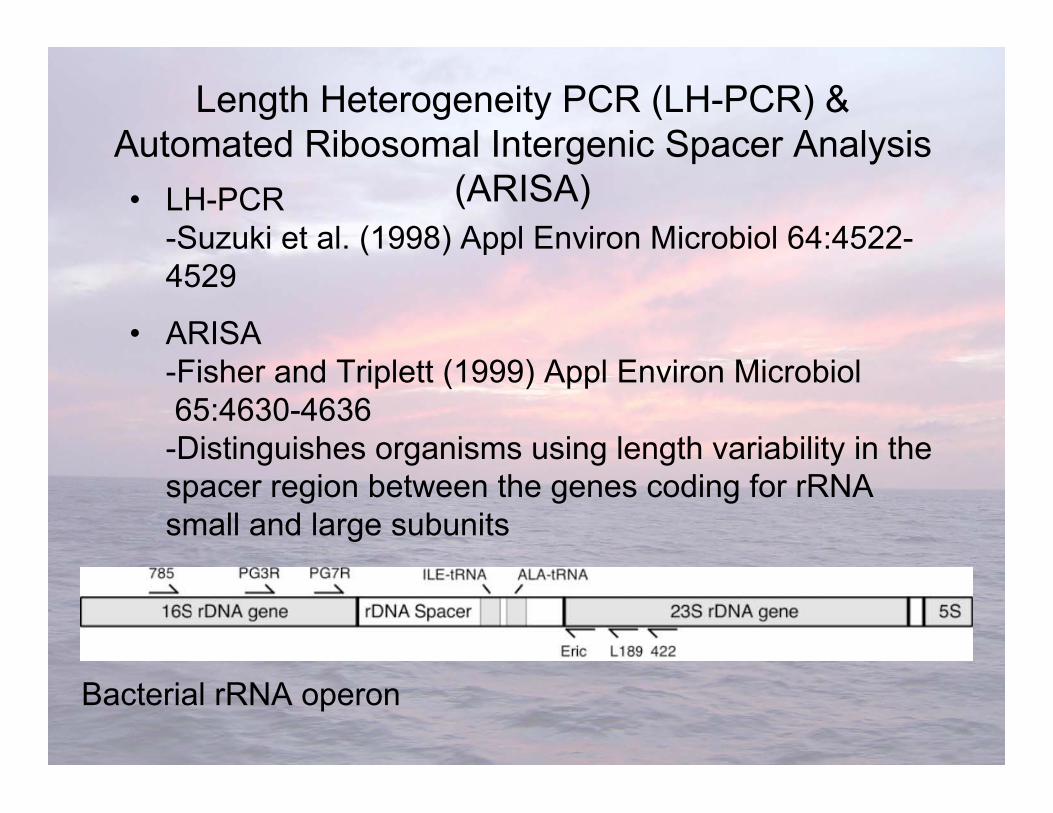
• LH-PCR-Suzuki et al. (1998) Appl Environ Microbiol 64:4522-4529
• ARISA-Fisher and Triplett (1999) Appl Environ Microbiol 65:4630-4636-Distinguishes organisms using length variability in thespacer region between the genes coding for rRNAsmall and large subunits
Bacterial rRNA operon
Length Heterogeneity PCR (LH-PCR) &Automated Ribosomal Intergenic Spacer Analysis
(ARISA)
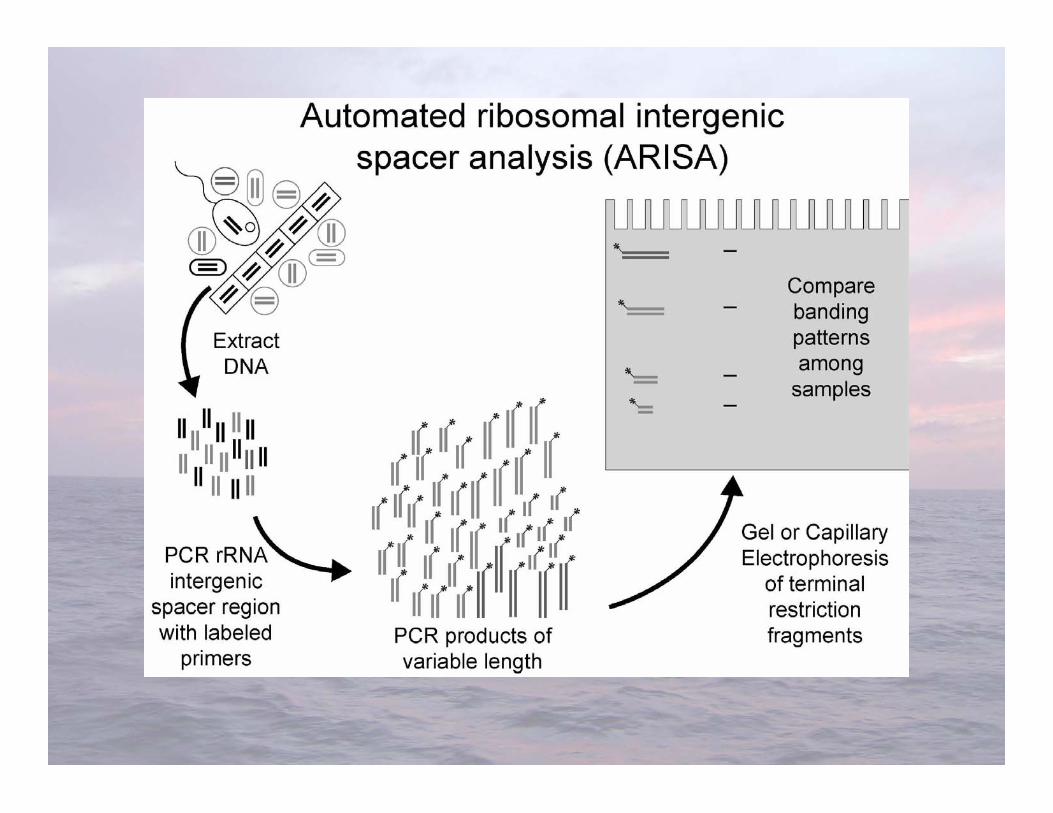


• Advantages-Relatively easy to do-Results can be stored for future comparisons
• Limitations-Less sensitive phylogenetic resolution-Each fragment length can represent a diversity of microorganisms-Cannot directly sequence fragments
ARISA & LH-PCR
• Can only amplify genes that match primers
• Amplification can be uneven-Under-amplification of abundant taxa-Overamplification of rare taxa
• Results are conservatively considered an ‘inventory’rather than a quantitative measure of the abundantPCR-amplifiable organisms
Caveats of PCR-based methods
• Can use rRNA instead of DNA
• Make complementary DNA (cDNA) with reversetranscriptase from extracted rRNA
• rRNA biases analyses towards highly activeorganisms that have a lot of ribosomes
Variations on PCR-Based Techniques


Oligonucleotide Primer Design
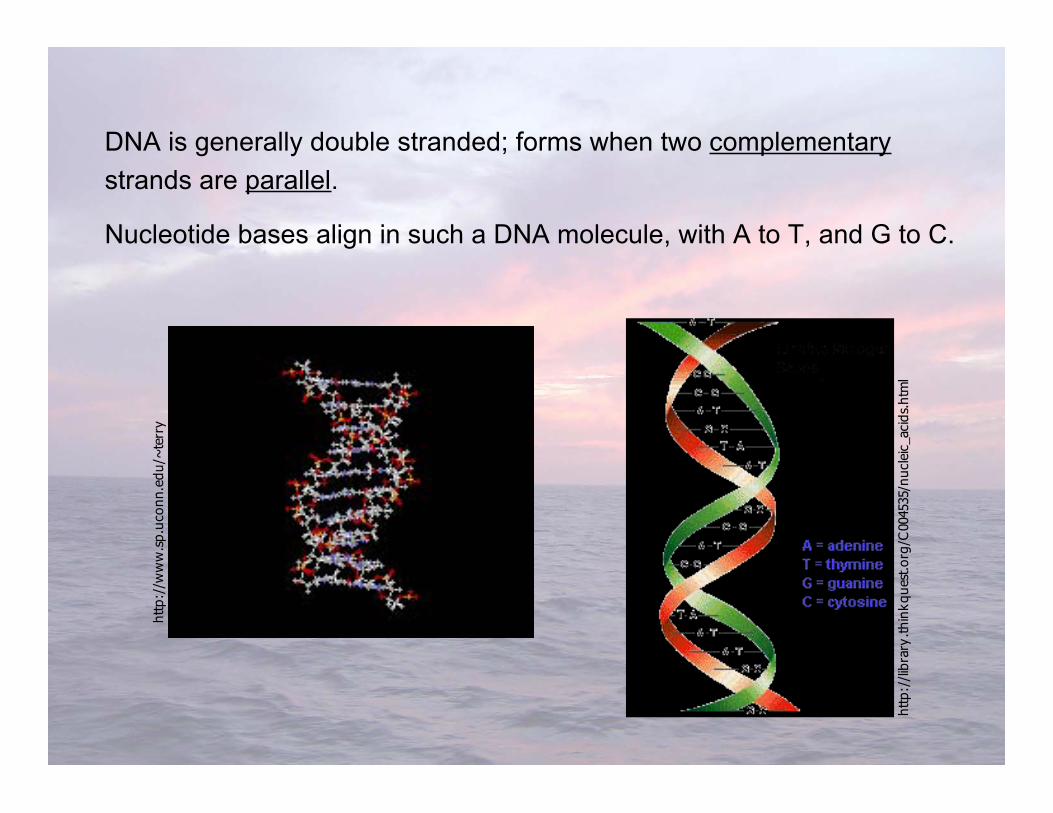
DNA is generally double stranded; forms when two complementarystrands are parallel.
Nucleotide bases align in such a DNA molecule, with A to T, and G to C.
http://library.thinkquest.org/C004535/nucleic_acids.html
http://www.sp.uconn.edu/~terry
G
G
C
GA
UG A
C CC UAU
A
CG
ACUGAGG C G G
GA U CA
A
A A
G
U UUA
UAA
GUA
AA
G
A
A
C
C
U GC
UU
A
U G
CG
CUA
U
U
G C
C
G
A
C
C
U
G
GU
AA
U
G
G
CG
AUG A
C CC UAU
A
CG
ACUGAGG C G G
GA U CA
A
A A
G
U UUA
UAA
GUA
AA
G
A
A
C
C
U G C
UU
A
U G
CG
CUA
U
U
G C
C
G
A
C
C
U
G
GU
AA
U
Hypervariable Hypervariable Region of 16S rRNA Region of 16S rRNA
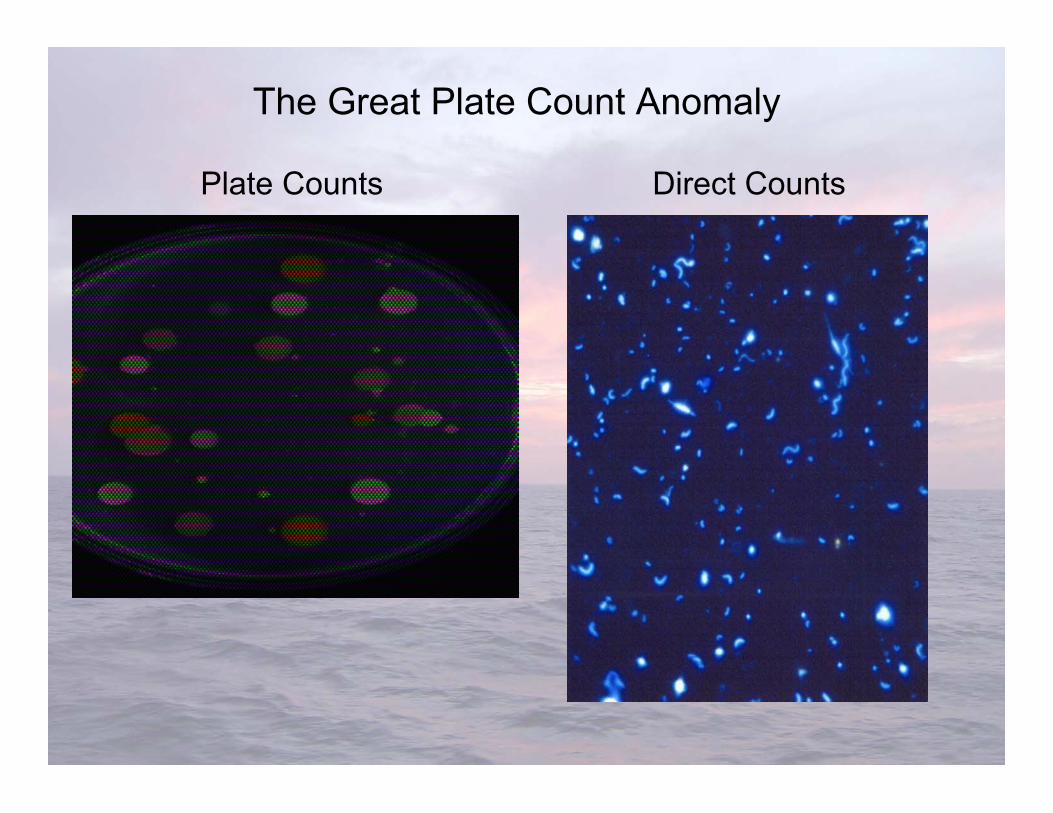
Plate Counts Direct Counts
The Great Plate Count Anomaly

“The Great PlateCount Anomaly”
Staley & Konopka, 1985
AcridineOrangeDirectcounts
(AODC)
Viableplate
counts
2x10⁶ cells/ml
1x10³ cells/ml
• There are a LOT of bacteria• Most bacteria will not growon a petri plate
• Who are all these bacteria?
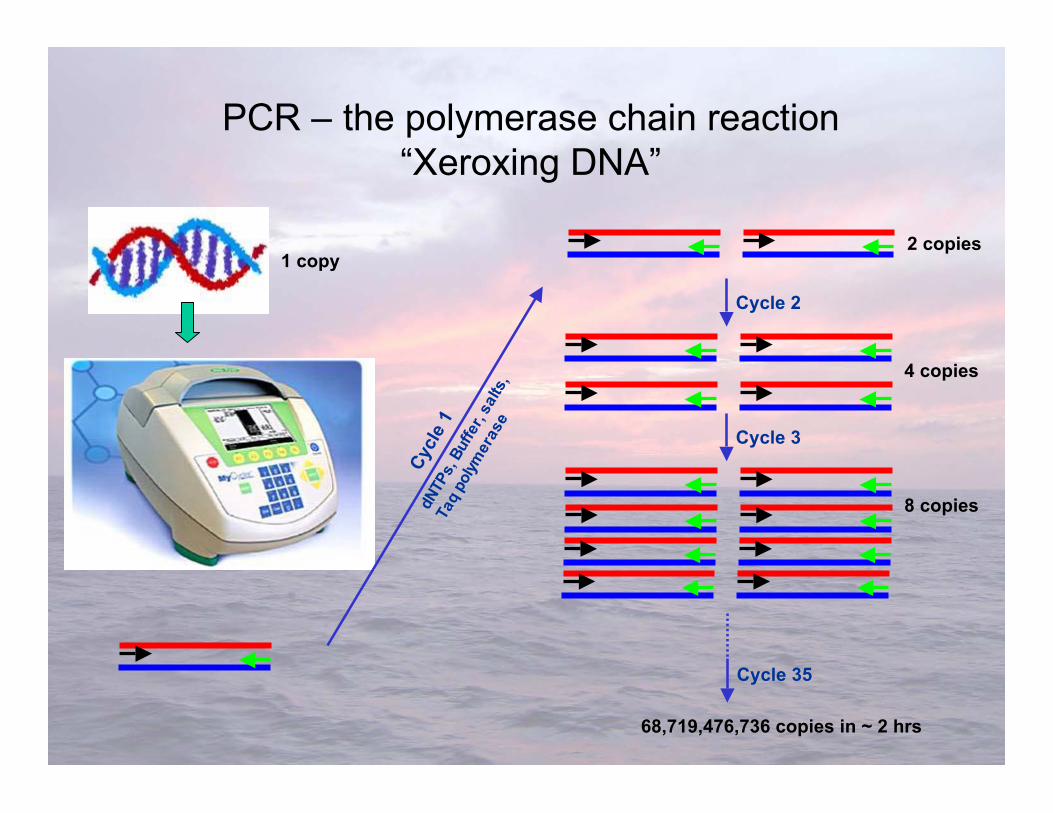
PCR – the polymerase chain reaction“Xeroxing DNA”
1 copy
Cycl
e 1
dNTP
s, B
uffe
r, sa
lts,
Taq
polym
eras
e
Cycle 35
68,719,476,736 copies in ~ 2 hrs
2 copies
Cycle 2
4 copies
Cycle 3
8 copies
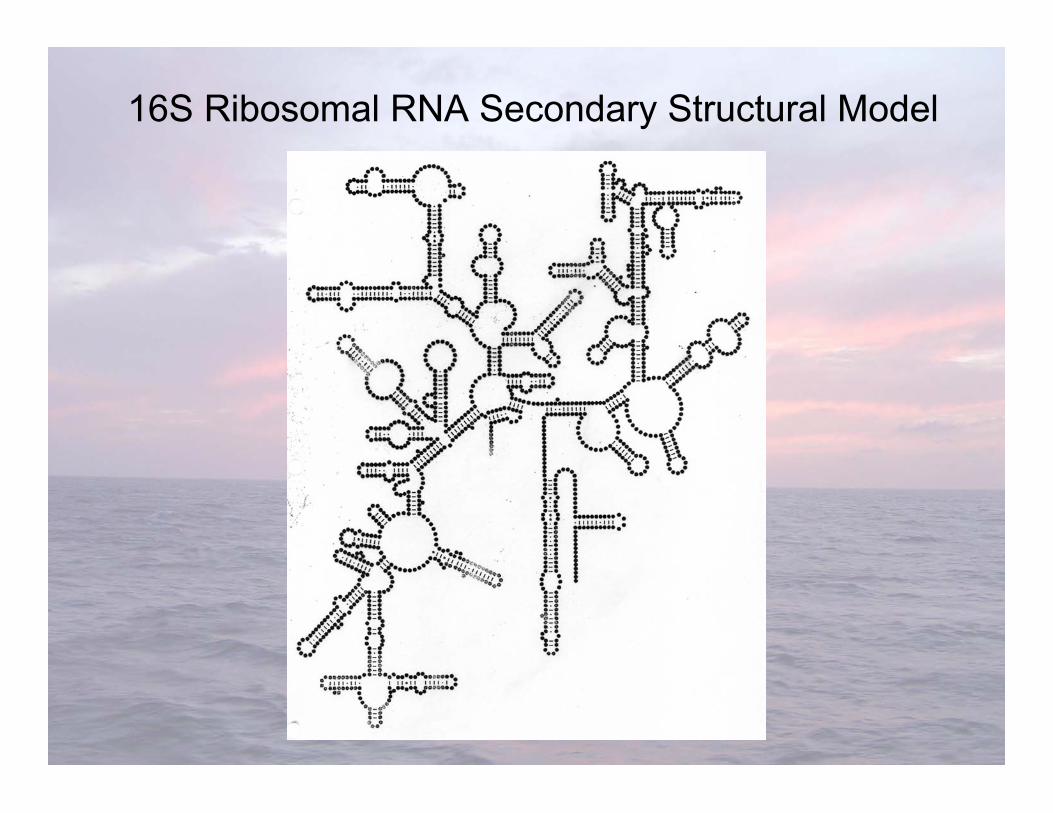
16S Ribosomal RNA Secondary Structural Model
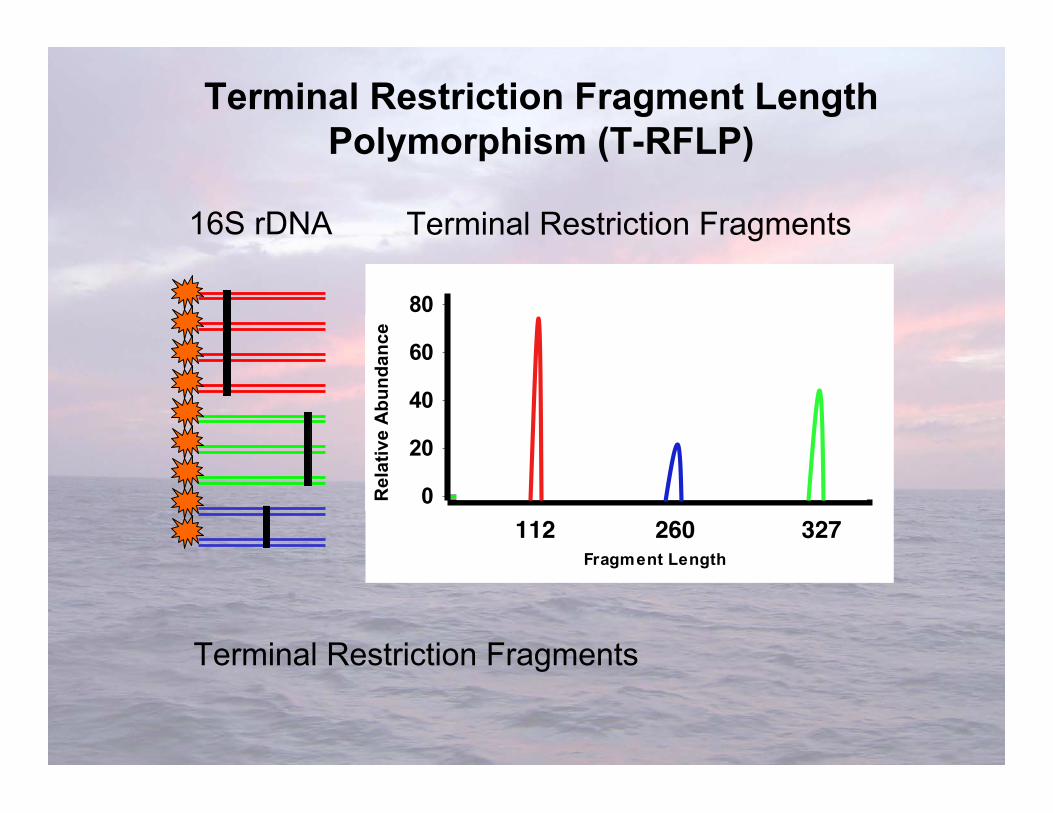
Terminal Restriction Fragment LengthPolymorphism (T-RFLP)
16S rDNA Terminal Restriction Fragments
0
20
40
60
80
10 20 30 40 50 60 70 80 90 100
Fragment Length
Re
lati
ve
Ab
un
da
nc
eR
elat
ive
Abu
ndan
ce
112 260 327
Terminal Restriction Fragments
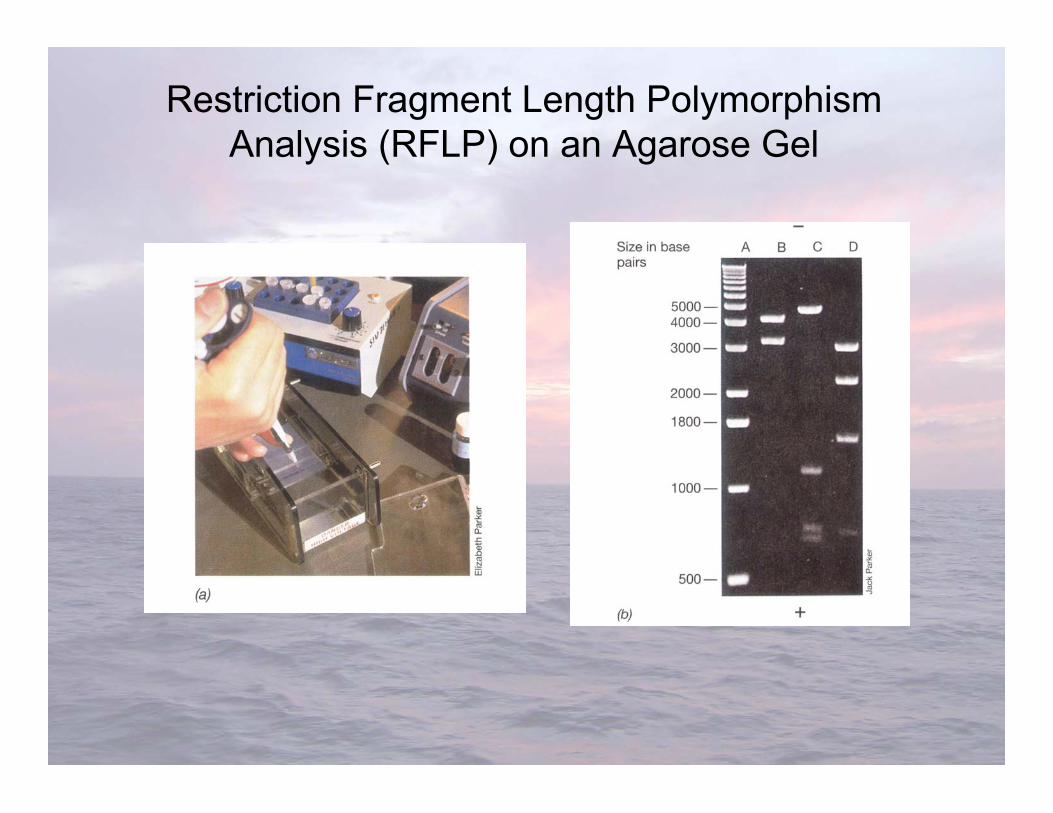
Restriction Fragment Length PolymorphismAnalysis (RFLP) on an Agarose Gel
• Original technique used to identify the uncultivated majority
• DNA-based studies using PCR & 16S rRNA
– Giovannoni et al. (1990) Nature 345:60-63
– Schmidt TM et al. (1991) J Bacteriol 173:4371-4378
– DeLong EF (1992) Proc Natl Acad Sci USA 89:5685-5689
– Fuhrman et al. (1992) Nature 356:148-149
Environmental Clone Libraries