Embed Size (px)
Citation preview

September 19, 1996
The International Transmission of Financial Shocks:The Case of Japan
Joe Peek* and Eric S. Rosengren**
AbstractOne of the more dramatic financial events of the late 1980s and
early 1990s was the surge in Japanese stock prices that was immediatelyfollowed by a very sharp decline of more than 50 percent. While theunprecedented fluctuations in Japanese stock prices were domesticfinancial shocks, the unique institutional characteristics of the Japaneseeconomy produce a framework that is particularly suited to thetransmission of such shocks to other countries through the behavior of theJapanese banking system.
The large size of Japanese bank lending operations in the UnitedStates enables us to use U.S. banking data to investigate the extent towhich this domestic Japanese financial shock was transmitted to theUnited States, as well as to identify a supply shock to U.S. bank lendingthat is independent of U.S. loan demand. We find that binding risk-basedcapital requirements associated with the decline in the Japanese stockmarket resulted in a decline in commercial lending by Japanese banks inthe United States that was both economically and statisticallysignificant. This finding has added importance given the severe realestate loan problems currently faced by Japanese banks. How Japanesebank regulators decide to resolve these problems will have significantimplications for credit availability in the United States as well as inother countries with a significant Japanese bank presence.
*Professor of Economics, Boston College, and Visiting Economist, FederalReserve Bank of Boston.**Vice President and Economist, Federal Reserve Bank of Boston.

The authors thank Masao Ohkawa for providing insights into the Japanesebanking system and Donald D. Hester, Robert N. McCauley, Geoffrey Tootell,and two anonymous referees for helpful comments. Valuable researchassistance was provided by Faith Kasirye-Nsereko. The views expressedare those of the authors, and do not necessarily reflect official positionsof the Federal Reserve Bank of Boston or the Federal Reserve System.

The International Transmission of Financial Shocks:
The Case of Japan The increasing globalization of banking and
financial markets provides important advantages in terms of gains in
efficiency and diversification, but it also offers potential pitfalls. One
such pitfall is associated with the risks that would emanate from any
group of globally active financial institutions collectively suffering
financial difficulties. Given the size and global penetration of Japanese
banking organizations, the significant problems at large Japanese banks
following the dramatic decline in the Japanese stock market at the
beginning of this decade may have created just such an event. Several
factors contribute to the potential for Japanese banks to be particularly
effective transmitters of domestic financial shocks overseas. First, large
cross-holdings of Japanese corporate stocks by Japanese banks make
these banks susceptible to downturns in the stock market. Second, bank
regulatory changes in Japan in the late 1980s both enhanced enforcement
of capital requirements and allowed changes in the value of bank stock
holdings to directly affect bank capital, setting the stage for the banking
sector to transmit an adverse stock price shock through reductions in
credit availability. Third, bank-firm lending relationships are
particularly strong and important in Japan, making banks reluctant to
1

reduce credit to their long-time domestic customers. Fourth, the large
international presence of Japanese banking organizations allowed them to
shift much of the asset and loan shrinkage overseas, insulating domestic
firms from much of the shock.
This paper confirms the hypothesis that Japanese banking problems
caused by the decline in Japanese stock values were transmitted
internationally to the United States. In particular, we find that U.S.
branches of Japanese banks reduced lending at the time of declines in
their parents' capital positions.1 This event enables us to identify and
isolate an external supply shock to U.S. bank lending. By focusing on the
transmission of the effects of Japanese stock market losses via the
actions of Japanese bank branches and subsidiaries in the United States,
we overcome a major problem of previous studies investigating the
linkage between bank capital ratios and bank loan growth in the United
States: the inability to completely isolate bank loan supply shocks from
demand effects.
While we do show that much of this decline in lending reduced credit
made available to U. S. firms and not just to affiliates of Japanese firms,
we do not quantify the potential costs of the lost credit availability to
the U. S. economy. Some of these costs likely were ameliorated because
2

many U. S. and non-Japanese foreign banks had already recapitalized and
were capable of extending credit, particularly to the larger borrowers.
However, a number of studies (for example, Slovin, Sushka, and Polonchek
1993 and James 1987) have found that banking relationships can be costly
to replace, even for large firms with access to national credit markets.
I. Background
One of the more dramatic financial events of the second half of the
1980s was the rise and subsequent decline in the Japanese stock market.
Because of the Basle Accord, an international agreement that set common
standards by which to evaluate capital adequacy, the dramatic
fluctuations in Japanese stock prices had a substantial impact on
Japanese bank capital. The Basle Accord contains a provision that allows
up to 45 percent of unrealized gains on equity security holdings (hidden
reserves) to be included in bank capital.2 The rapid growth of Japanese
banks was relatively unaffected initially by the adoption of the Basle
Accord because of the boost in their tier 2 capital that came from the
substantial accrued capital gains associated with the dramatic rise in
Japanese stock prices during the 1980s. Furthermore, higher stock prices
enabled Japanese banks to increase tier 1 capital by issuing new equity
shares and debt securities at favorable prices, as well as by selling some
3

of their stock holdings in other companies that had substantial unrealized
gains.3
With a booming stock market, low domestic interest rates, and a
strong yen, Japanese banks expanded aggressively during the late 1980s.
By 1988, all of the world's 10 largest banking organizations were
headquartered in Japan. The aggressive expansion included greater
penetration of foreign markets. By 1990, Japanese branches and
subsidiaries had dramatically increased their commercial and industrial
(C&I) loans in the United States, at their peak accounting for 18 percent of
all C&I loans to borrowers located in the United States.4
The subsequent decline in Japanese stock prices, with the Nikkei
index losing more than half its value between 1989 and early 1992, caused
a dramatic decline in tier 2 capital, given that Japanese banks hold
approximately 20 percent of Japanese common stock (French and Poterba
1991; Prowse 1990). In 1990, total risk-based capital ratios of many
major Japanese banks, including 5 of the 10 largest banks in the world,
temporarily fell below the 8 percent minimum required under the Basle
Accord. As a result of the widespread decline in Japanese bank capital,
total assets of Japanese banking organizations declined steadily after
4
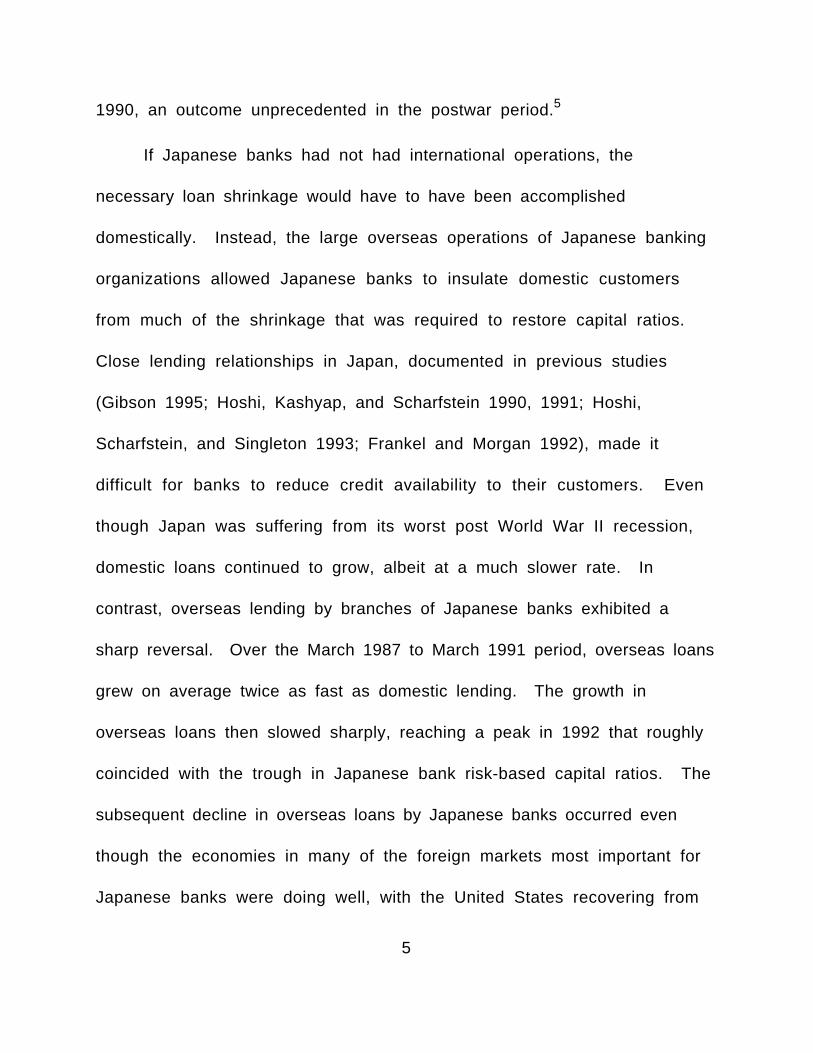
1990, an outcome unprecedented in the postwar period.5
If Japanese banks had not had international operations, the
necessary loan shrinkage would have to have been accomplished
domestically. Instead, the large overseas operations of Japanese banking
organizations allowed Japanese banks to insulate domestic customers
from much of the shrinkage that was required to restore capital ratios.
Close lending relationships in Japan, documented in previous studies
(Gibson 1995; Hoshi, Kashyap, and Scharfstein 1990, 1991; Hoshi,
Scharfstein, and Singleton 1993; Frankel and Morgan 1992), made it
difficult for banks to reduce credit availability to their customers. Even
though Japan was suffering from its worst post World War II recession,
domestic loans continued to grow, albeit at a much slower rate. In
contrast, overseas lending by branches of Japanese banks exhibited a
sharp reversal. Over the March 1987 to March 1991 period, overseas loans
grew on average twice as fast as domestic lending. The growth in
overseas loans then slowed sharply, reaching a peak in 1992 that roughly
coincided with the trough in Japanese bank risk-based capital ratios. The
subsequent decline in overseas loans by Japanese banks occurred even
though the economies in many of the foreign markets most important for
Japanese banks were doing well, with the United States recovering from
5

its recession and GDP growth quite strong in Asia.
The fact that the declines in lending were concentrated in their
overseas rather than their domestic operations is consistent with
Japanese banks valuing historical lending relationships at home. While
beneficial to Japanese borrowers, any country with a large Japanese
banking presence could be adversely affected by the shrinkage of external
lending by Japanese banks.
II. Data and Methodology
The panel data include semiannual observations from September
1988 (when risk-based capital measures were first reported for Japanese
parent banks) until September 1995 for the U.S. branch and subsidiary
activity of 11 city banks, 3 long-term credit banks, 5 trust banks, and the
10 largest regional banks.6 While the Japanese branch and subsidiary data
are available quarterly from U.S. call report data, we use only the March
and September reports to match the reporting dates available for the
Japanese parent banks, which report capital and assets only semiannually.
For our panel of data, we have consolidated the branches of each
parent company, for two reasons. First, all aggregated branches are
capitalized by the same parent. Second, branch openings and closings can
result in large changes in individual branch data associated with the
6
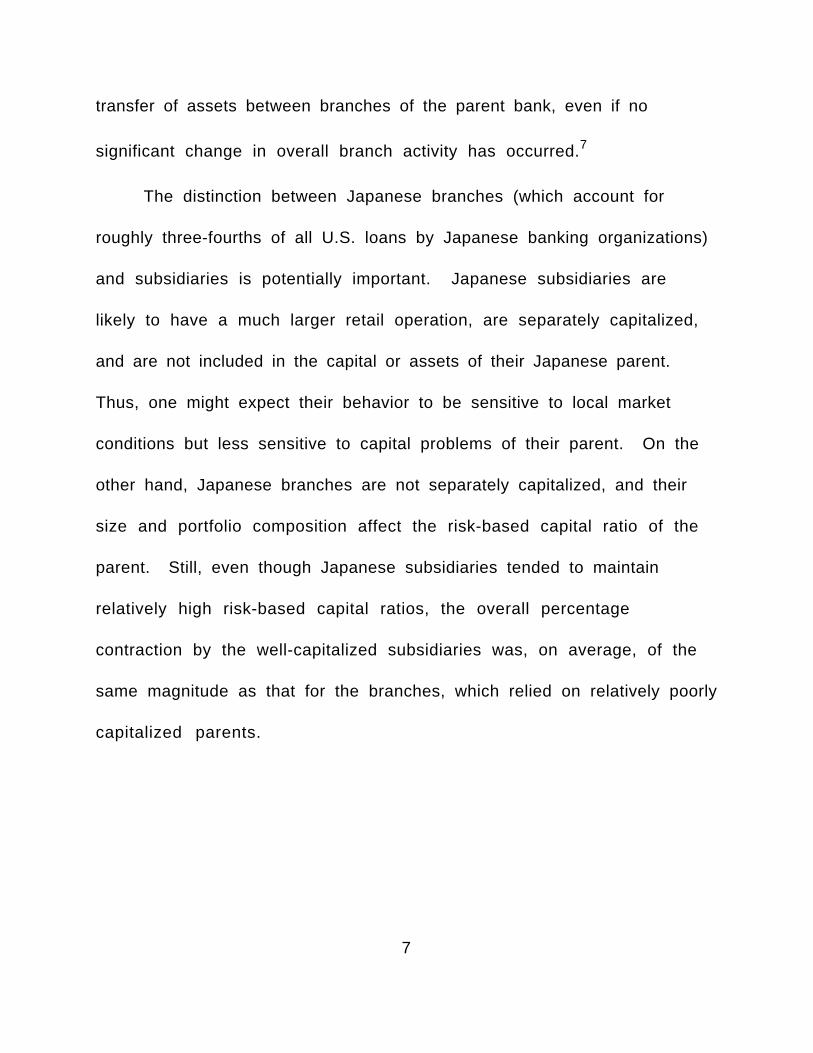
transfer of assets between branches of the parent bank, even if no
significant change in overall branch activity has occurred.7
The distinction between Japanese branches (which account for
roughly three-fourths of all U.S. loans by Japanese banking organizations)
and subsidiaries is potentially important. Japanese subsidiaries are
likely to have a much larger retail operation, are separately capitalized,
and are not included in the capital or assets of their Japanese parent.
Thus, one might expect their behavior to be sensitive to local market
conditions but less sensitive to capital problems of their parent. On the
other hand, Japanese branches are not separately capitalized, and their
size and portfolio composition affect the risk-based capital ratio of the
parent. Still, even though Japanese subsidiaries tended to maintain
relatively high risk-based capital ratios, the overall percentage
contraction by the well-capitalized subsidiaries was, on average, of the
same magnitude as that for the branches, which relied on relatively poorly
capitalized parents.
7

The estimated equation for Japanese bank branches is of the
following form:
∆ loansi , t
assetsi , t − 1
= α + β 1 PRBCi , t − 1
+ β 2 LANDi , t − 1
+ γ XTSt − 1 + θ XBSi , t − 1
+ ε i , t
We calculate the dependent variable in two ways. The unadjusted
dependent variable is the change in total loans of all U.S. branches of
parent bank i from period t-1 to period t (a six-month period), divided by
the beginning-of-period assets held by U.S. branches of parent bank i. We
also estimate an adjusted dependent variable to control for loan demand
by subtracting from the unadjusted dependent variable the change in total
loans at all non-Japanese banks in the same state and of the same size
class (with asset size classes defined as less than $300 million, $300
million to $1 billion, and greater than $1 billion) divided by beginning-of-
period assets. If the Japanese bank capital supply shock was unimportant,
Japanese branches would have a pattern of changes in loans similar to
that of similarly sized banks in their state, reflecting changes in local
loan demand associated with changes in general economic activity, and we
would expect an insignificant coefficient on the parent risk-based capital
rat io.
8

The primary focus is on the Japanese parent's risk-based capital
ratio, PRBC, since, unlike subsidiaries, branches have no separate capital
and are considered part of the parent company. Capital is measured as of
the beginning of the period. If the parent company has a low risk-based
capital ratio and is unable or unwilling to raise additional capital, it may
choose to satisfy its capital requirement by shrinking its assets and
liabilities, including those in its overseas branches.8 If Japanese banks do
respond by shrinking their overseas branches, then the coefficient on PRBC
should be positive.
Because Japanese banks have been slow to reserve for their serious
bad loan problems, their capital ratios do not accurately reflect their
financial health. To control for this overstatement of capital ratios, we
have included an additional variable, LAND, in an attempt to capture the
effect of the bad loan problem on bank behavior. Even though their
problems are not fully reflected in the official capital ratios, the banks
are aware of the extent of their problems and may be reacting to the
probable need to eventually reserve for and charge off those loans. LAND
is measured as the percentage reduction in the commercial land index for
all urban districts (constructed by The Japan Real Estate Institute)
relative to its peak in September 1991. The series has a value of zero
9

until the September 1991 observation and then takes on a negative value,
reflecting the cumulative decline since that time. The land price index is
chosen as our proxy because most business loans in Japan are
collateralized by the real estate holdings of the borrowers. Consequently,
much of the bank bad loan problem is related to loans collateralized by
commercial real estate. We anticipate a positive estimated coefficient,
with loan growth slowing as collateral values decline and the (unreserved
for) loan problems become more severe.
The independent time series variables (XTS) include the percentage
change in foreign direct investment by Japanese companies in the United
States (FDI) and state payroll employment growth, each measured over the
prior six-month period. Because Japanese companies frequently utilize
Japanese banks, increases in foreign direct investment should be
positively related to lending by Japanese branches.9 State payroll
employment growth is included to control for loan demand. To the extent
changes in branch loans reflect changes in loan demand, the coefficient
should be positive.
The final set of explanatory variables (XBS) controls for bank-
specific effects. This set includes the beginning-of-period logarithm of
assets of the U.S. branches of the parent Japanese bank to control for the
1 0

size of the U.S. presence of each bank. We also include nonperforming
loans (loans 90 or more days past due plus nonaccruing loans) divided by
total loans at the parent's U.S. branches in the total loans equation, and
use the same calculation, replacing total loans with C&I loans, as an
argument in the C&I loan equation. Branch holdings of commercial and
industrial loans and of real estate loans, each divided by the parent's total
U.S. branch assets, are also included. Each of these variables is measured
as of the beginning of the period. These measures control for perceived
lending risks, as well as for U.S. demand shocks that might
disproportionately affect a segment of the portfolio. Finally, we include a
set of dummy variables indicating whether the parent is a trust bank, a
long-term credit bank, or a regional bank.
A similar set of regressions is estimated for Japanese subsidiaries.
Because Japanese subsidiaries are independently capitalized, we must
include the subsidiary's risk-based capital ratio as well as the parent's
risk-based capital ratio. We would expect the subsidiary's capital to be
important, while the parent's capital ratio might play only a secondary
role, perhaps reflecting the extent to which the parent could inject
additional capital into the subsidiary if needed. Thus, we would expect
the parent's capital ratio to be less important for subsidiaries than for
1 1

branches. Because no regional bank owns a U.S. subsidiary, the regional
bank dummy variable is not included in the subsidiary equations. All other
independent variables are the same as in the branch equation.
All equations were estimated using ordinary least squares, fixed-
effects, and variance components specifications. Hausman specification
tests indicated that the variance components specification was the most
appropriate specification for the branch data, while the fixed-effects
specification was most appropriate for the subsidiary data.
Isolating Demand Shocks
Numerous previous studies have found an association between
capital ratios and bank lending, but they have been unable to isolate supply
shocks satisfactorily. This is because weak loan demand is likely to be
associated with periods when bank capital declines. As the economy
slows, firm balance sheets deteriorate, and banks are forced to charge off
past due loans that cannot be repaid, causing bank capital to fall.
However, the adverse shock to Japanese bank capital caused by the sharp
decline in the Japanese stock market, not being associated with demand
conditions in the United States, provides an opportunity to isolate a pure
supply shock at U.S. branches of Japanese banks.
When a supply shock occurs in Japan, loan demand at U.S. branches of
1 2

Japanese banks might be affected through two possible channels, so that
the decline in Japanese branch lending might not be a pure supply shock
phenomenon. First, to the extent that Japanese banks provide much of the
lending to Japanese nonbank affiliates in the U.S. and the decline in the
Nikkei caused a slowing of Japanese business activity worldwide, not just
in Japan, the decline in lending could reflect decreased loan demand from
Japanese affiliates here. However, Table 1 shows that Japanese nonbank
affiliates in the U.S. continued to grow, whether measured by assets,
gross product, total liabilities, or, in the two benchmark years available,
bank loans. To the extent that Japanese nonbank affiliates rely
disproportionately on U.S. branches and subsidiaries of Japanese banks for
their loans, much of the shrinkage in U. S. domestic lending by Japanese
banks would have been at the expense of non-Japanese borrowers.10
A second possible linkage to a weakening of Japanese demand might
occur through a reduction in lending by U.S. branches and subsidiaries of
Japanese banks to Japanese firms operating in Japan. To the extent that
Japanese banks have moved domestic loans to branches in the U.S. to avoid
Japanese regulation, a reduction in loan demand in Japan that was
coincident with the fall in Japanese stock prices (and the decline in
Japanese bank capital) could account for a portion of the observed decline
1 3

in Japanese bank lending in this country. However, as can be seen in Table
1, C&I loans to non-U.S. addresses held by U.S. branches and subsidiaries of
Japanese banks account for only a very small percentage of their total C&I
lending. Thus, this component is not substantial enough to account for the
decline in lending at U.S. branches and subsidiaries of Japanese banks, and,
in any case, we use only those C&I loans made to U.S. addresses in our
regressions to avoid this problem.
III. Empirical Results
Table 2 presents the results for the Japanese branch equations for
the change in both total loans (columns 1 to 3) and C&I loans (columns 4 to
6), each measured relative to beginning-of-period assets. Column 1 shows
the variance components specification of the total loans equation, using
the adjusted loan growth series measured relative to loan growth at non-
Japanese banks in the same state and of the same size class. The
estimated coefficients on both the parent risk-based capital ratio and the
decline in urban commercial land prices are positive (as predicted) and
significant at the 1 percent level. The estimated coefficient on the parent
risk-based capital ratio implies that a 1 percentage point reduction in the
risk-based capital ratio would result in loan growth relative to assets at
that bank's U.S. branches being reduced by nearly 2 percent per six-month
1 4

period. Because loans comprise roughly two-thirds of Japanese branch
assets, this number substantially understates the percentage reduction in
loans, roughly a 7 percent annual rate of decline (in current dollars). This
finding of a coefficient that is both economically and statistically
significant indicates a substantial loan supply effect transmitted from
Japanese parent banks through their U.S. branches.
Both of the time series variables have statistically significant
estimated effects of the predicted sign. FDI has a positive coefficient
significant at the 1 percent level. Employment growth has a positive
coefficient significant at the 5 percent level. Thus, both variables appear
to be controlling for loan demand influences at Japanese branches as
intended.
Among the bank-specific variables, none is statistically significant.
While the share of C&I loans has the predicted sign, the variables for
nonperforming loans and the share of real estate loans each have positive
rather than the predicted negative effects. The dummy variables for bank
type indicate no systematic differences among types of parent bank.
When the dependent variable is not adjusted to reflect the change in
loans at similarly sized banks in the same state (column 3), we obtain
very similar coefficient estimates. Thus, the results do not appear to be
1 5
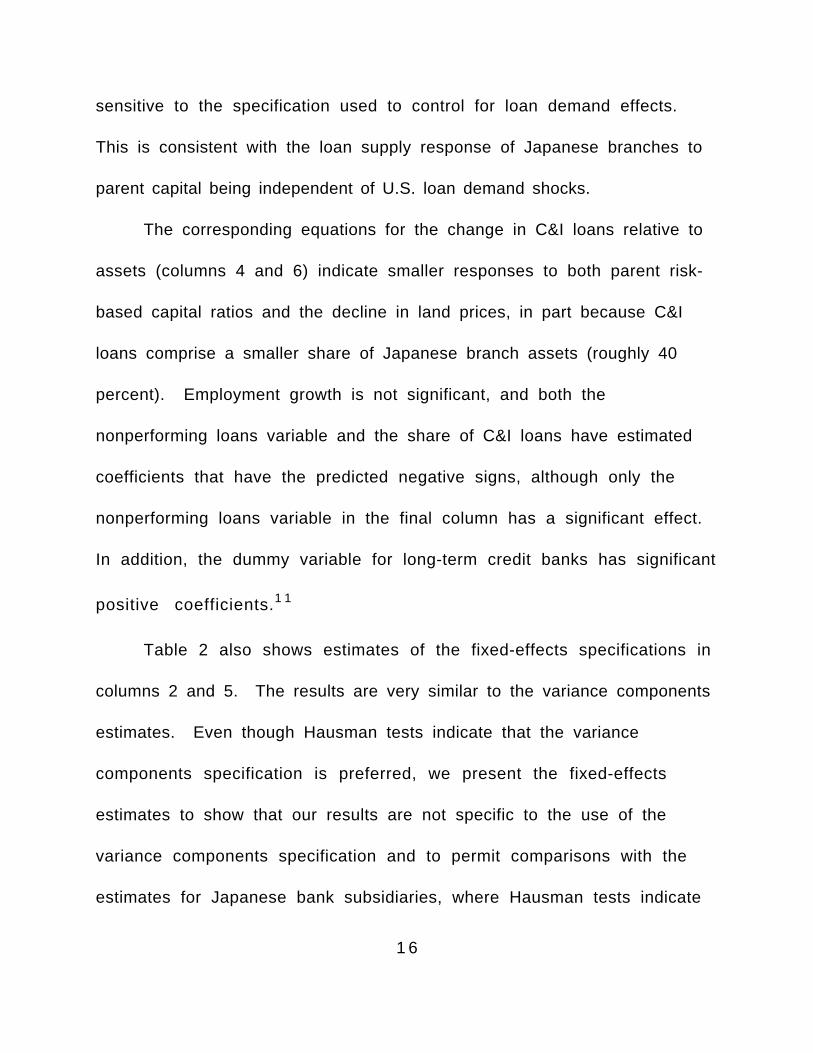
sensitive to the specification used to control for loan demand effects.
This is consistent with the loan supply response of Japanese branches to
parent capital being independent of U.S. loan demand shocks.
The corresponding equations for the change in C&I loans relative to
assets (columns 4 and 6) indicate smaller responses to both parent risk-
based capital ratios and the decline in land prices, in part because C&I
loans comprise a smaller share of Japanese branch assets (roughly 40
percent). Employment growth is not significant, and both the
nonperforming loans variable and the share of C&I loans have estimated
coefficients that have the predicted negative signs, although only the
nonperforming loans variable in the final column has a significant effect.
In addition, the dummy variable for long-term credit banks has significant
positive coefficients.1 1
Table 2 also shows estimates of the fixed-effects specifications in
columns 2 and 5. The results are very similar to the variance components
estimates. Even though Hausman tests indicate that the variance
components specification is preferred, we present the fixed-effects
estimates to show that our results are not specific to the use of the
variance components specification and to permit comparisons with the
estimates for Japanese bank subsidiaries, where Hausman tests indicate
1 6

that the fixed-effects specification is preferred.
Table 3 presents the results for Japanese subsidiaries. The fact
that the fixed-effects specification is the preferred specification
suggests that idiosyncratic factors are relatively more important at
subsidiaries. While the estimated coefficients on the subsidiary risk-
based capital ratio are positive, the effect is significant (at the 1 percent
level) only for the C&I loans equations. The parent's risk-based capital
ratio also has positive estimated coefficients, although they are never
significant. This finding could be a result of the diversity in subsidiary
activity. However, when we estimate the same set of regressions
excluding small subsidiaries (those with total assets less than $500
million), we obtained qualitatively similar results to those presented in
Table 3 (see the unpublished appendix). This is consistent with our
expectation that subsidiary capital ratios would be the more relevant,
with parent capital serving primarily as a backup for the subsidiary if a
capital infusion became necessary.
The decline in urban commercial land prices in Japan again has a
significant positive estimated coefficient in each equation, although one
might expect this variable to be less relevant to subsidiary activity given
the evidence on parent versus subsidiary capital ratios. For subsidiaries,
1 7

neither FDI nor employment growth is significant. Among the bank-
specific variables, only the logarithm of subsidiary assets and
nonperforming loans in the total loans equations have significant
estimated coefficients.
Because, on average, Japanese subsidiaries in the United States are
quite well capitalized, one might expect the t-statistics of the subsidiary
capital ratio coefficients to be relatively weak. Because they tend not to
be near the margin of the risk-based capital requirements, a decrease in
their capital ratio may have little effect on their behavior. In fact, that
is the case for the change in total loans equations. Alternatively, since
U.S. regulators enforce a leverage ratio requirement as well as the risk-
based requirement, it may be that it is the (unweighted) leverage ratio
rather than the risk-based capital ratio that is most relevant for U.S.
subsidiaries. However, when the subsidiary risk-based capital ratio is
replaced with the subsidiary leverage ratio, we obtain results with even
weaker subsidiary capital ratio effects (see appendix).
Because our evidence indicates that the shock to Japanese parent
bank capital resulted in substantial loan shrinkage at their U.S. branches,
but not at their subsidiaries, one might be concerned that part of the
reduction in branch loans reflected a shifting of assets by Japanese banks
1 8

from their branches to their much better capitalized subsidiaries. To
verify that the net effect of the parent bank capital shock was to reduce
total Japanese lending in the United States, we reestimated the equations
with the dependent variable calculated from the combined balance sheets
of all U.S. branches and subsidiaries of each Japanese parent bank.
Overall, the results are similar to those for branches and suggest that
loan shifting was not a factor (see appendix).
IV. Conclusion
One unanticipated effect of the Basle Accord may be that lending
outside Japan has become sensitive to Japan-specific shocks, given the
importance of Japanese banks worldwide. In particular, declines in the
Nikkei uncorrelated with movements in stock markets elsewhere may
nonetheless be transmitted to other countries via the lending responses of
Japanese banks. Because Japanese banks account for nearly one-fifth of
commercial and industrial loans to U.S. addresses by banks in the United
States, the international transmission of Japanese banking problems has
potentially large effects on U.S. bank lending. In fact, we find that the
Japanese parent's risk-based capital ratio has a statistically significant
impact on Japanese branch lending in the United States.
This study addresses only changes in bank loans, not the effects on
1 9

borrowers of disruptions to their lending relationships. However, several
previous studies have documented that even large customers at large
banks in the United States are adversely affected if their banking
relationship is disrupted. Future work needs to determine the extent to
which reductions in foreign bank lending impose real losses on U.S.
businesses, a topic beyond the scope of the current study.
The Japanese banking experience enables us to identify a shock to
bank capital not related to demand conditions in the United States, thus
overcoming the problem of finding a good proxy for supply shocks that is
uncorrelated with changes in U.S. loan demand. The substantial rise in
Japanese stock values significantly increased Japanese bank capital
ratios in the 1980s, and the substantial decline in Japanese stock values
beginning in 1990 substantially decreased them. Thus, the effects of the
"bubble economy" in Japan could be transmitted to U.S. credit markets
through the U.S. branches of Japanese banks in a way unrelated to the
demand for loans in the United States.
Shocks that in the past may have been localized and easily contained
within a single country now have the potential to be spread
internationally. This paper has focused on capital problems stemming
from the decline in Japanese stock prices The decline in Japanese real
2 0

estate values, yet to be fully addressed by Japanese banking regulators,
represents an even larger potential problem. However, this process is
ongoing, with nearly all the major Japanese banks in March of 1996
substantially increasing their specific loan loss reserves for their Jusen
real estate loans. While these losses were quite large, they occurred
after a substantial recovery in the Japanese stock market, so that no
Japanese bank fell below the Basle Accord's 8 percent risk-based capital
standard, unlike the earlier period of stock market declines. Nonetheless,
the four Japanese banks with the lowest risk-based capital ratios as of
March 1996 did shrink their U. S. operations, with total assets at their U.
S. affiliates declining by over 8 percent in the first half of 1996 at the
same time that U.S. bank assets were rising by 2 percent. Thus, losses
from real estate, as well as fluctuations in Japanese stock values, are
likely to have a continuing impact on the U.S. operations of Japanese
banks.
2 1

References
Frankel, Allen B., and Paul B. Morgan. 1992 . "Deregulation andCompetition in Japanese Banking." Federal Reserve Bulletin.August, pp. 579-93.
French, Kenneth R., and James M. Poterba. 1991. "Were Japanese StockPrices too High?" Journal of Financial Economics. October, pp. 337-63.
Gibson, Michael S. 1995. "Can Bank Health Affect Investment? Evidencefrom Japan." Journal of Business. vol. 68, no. 3, pp. 281-308.
Hoshi, Takeo, Anil Kashyap, and David Scharfstein. 1991. "CorporateStructure, Liquidity, and Investment: Evidence From JapaneseIndustrial Groups." Quarterly Journal of Economics. February, pp. 33-60.
Hoshi, Takeo, Anil Kashyap, and David Scharfstein. 1990. "The Role ofBanks in Reducing the Costs of Financial Distress in Japan." Journalof Financial Economics. September, pp. 67- 88.
Hoshi, Takeo, David Scharfstein, and Kenneth J. Singleton. 1993."Japanese Corporate Investment and Bank of Japan Guidance ofCommercial Bank Lending." In Kenneth j. Singleton, ed., Japanese
Monetary Policy, University of Chicago Press.
James, Christopher. 1987. "Some Evidence on the Uniqueness of BankLoans." Journal of Financial Economics. Vol. 19, pp. 217-35.
Nolle, Daniel E., and Rama Seth. 1996. "Do Banks Follow Their CustomersAbroad?" Manuscript, June.
Prowse, Stephen D. 1990. "Institutional Investment Patterns andCorporate Financial Behavior in the United States and Japan."
Journal of Financial Economics. September, pp. 43- 66.
Slovin, Myron B., Marie E. Sushka, and John A. Polonchek. 1993. "The Valueof Bank Durability: Borrowers as Bank Stakeholders." Journal of Finance.Vol. 48(1), pp. 247-67.
2 2

Stein, Jeremy C. 1995. "An Adverse Selection Model of Bank Asset andLiability Management with Implications for the Transmission ofMonetary Policy." NBER Working Paper No. 5217, August.
2 3

Table 1Activity by Nonbank U.S. Affiliates of Japanese Firms and U.S. Branches and Subsidiaries of JapaneseBanks (Millions of U.S. Dollars)
U.S. Nonbank Affiliates U.S. Branches and Subsidiaries
Economic Activity Current Liabilities and Long-TermDebt
C&I Loans
Year Total Assets Gross Product Total Liabilities Bank Loans US Addresses Non-US Addresses
1987 80,597 14,265 40,701 18,296 52,298 2,183
1988 117,126 19,363 58,946 71,742 2,229
1989 160,865 25,521 76,881 89,042 2,694
1990 228,390 33,176 114,902 103,255 2,092
1991 255,853 38,124 130,705 105,056 2,901
1992 269,158 41,183 137,636 49,871 96,534 3,372
1993 279,717 44,248 153,275 92,037 3,127
1994 297,423 50,798 161,827 94,692 3,370
Note: Economic activity and total liabilities data exclude finance affiliates. Bankloans exclude loans to finance and real estate affiliates to make the series morecomparable to the C&I loans to U.S. addresses series. All liabilities are for the“U.S. persons” category, equivalent to having a U.S. address.
Source: Bureau of Economic Analysis and Call Reports.
2 4

Table 3Determinants of Japanese Lending in the United States, U.S. SubsidiariesEstimation Method: Fixed Effects, 1989:1 to 1994:2
∆Loan -∆StLoanAsset StAsset
∆LoanAsset
∆CI - ∆StCI Asset StAsset
∆CI Asset
Subsidiary Risk-BasedCapital Ratio
0.204(1.36)
0.182(1.23)
0.503**(3.92)
0.510**(3.99)
Parent Risk-BasedCapital Ratio
0.081(0.17)
0.345(0.72)
0.574(1.39)
0.548(1.33)
Land Price 0.369**(4.36)
0.334**(4.01)
0.294**(4.07)
0.279**(3.87)
Foreign DirectInvestment
-0.011(0.35)
0.013(0.39)
0.019(0.68)
0.030(1.10)
Employment Growth 0.534(1.33)
0.439(1.11)
0.278(0.83)
0.160(0.48)
Log(Asset) -14.331**(4.12)
-14.618**(4.28)
-5.655(1.93)
-5.619(1.93)
Nonperforming Loans Loans
-0.561*(2.05)
-0.525*(1.96)
-0.261(1.02)
-0.271(1.07)
C&I Loans Assets
-0.026(0.35)
-0.024(0.32)
-0.023(0.36)
-0.026(0.41)
Real Estate Loans Assets
0.136(1.51)
0.135(1.52)
0.158(1.94)
0.154(1.91)
Hausman test P-value 0 0 0.003 0.003
Observations 242 242 242 242
R2 0.305 0.311 0.279 0.283
SSR 13986 13497 9907 9837
SER 8.084 7.942 6.804 6.78
Note: The data are semiannual observations for March and September. Independent variables are measured asof the beginning of the period. The land price series is the commercial land index for all urban districts and ismeasured relative to its peak in September 1991. Foreign direct investment and employment growth aremeasured over the prior six-month period. Nonperforming loans as a share of total loans are used inColumns 1 and 2, and nonperforming C&I loans as a share of total C&I loans are used in the last twocolumns. Absolute values of t-statistics are in parentheses.
* Significant at the 5 percent level.**Significant at the 1 percent level.
2 5

Appendix--The International Transmission of Financial Shocks: The Case of Japan
This appendix provides additional details on a variety of specification tests that validate the
robustness of the results. Table 1A provides robustness tests for the Japanese bank branch equations with the
adjusted dependent variables that measure loan growth relative to the average for non-Japanese banks in the
same states and in the same asset size classes as the branches. The first column contains a univariate
specification with the parent risk-based capital ratio as the only explanatory variable (other than the constant)
to determine whether the results are sensitive to the inclusion or exclusion of the other independent variables.
The estimated coefficient on parent risk-based capital in the total loans equation is 2.218, with a t-statistic of
8.14, compared to 1.928 with a t-statistic of 6.58 in the full specification in column 1 of Table 2. Because
the other explanatory variables have been omitted from the equation, the Hausman test now indicates that a
fixed-effects specification is preferred. However, the fixed-effects specification provides results similar to the
variance components specification, with the estimated coefficient having a value of 2.694 with a t-statistic of
8.13. Thus, the results are qualitatively the same as in the full specification, indicating that the results are
not an artifact of interactions with other explanatory variables.
As an additional robustness test, we consider three alternatives to the commercial land price series for
all urban districts used in the paper: the index for the average of commercial, residential, and industrial land
prices in all urban districts; the index for the average of commercial, residential, and industrial land prices for
the six largest cities; and the index for commercial land prices in the six largest cities. In each instance, the
results for the parent risk-based capital ratio are quite similar to those reported in column 1 of Table 2,
ranging from 1.785 to 1.911, each with a t-statistic greater than six.
The final column of Table 1A contains results from the same specification as in column 1 of Table
2, with the sample size reduced by excluding the largest and smallest values of the dependent variables, using
only those observations with changes in loans that were between -10 and 15 percent of assets. The results
show that while the estimated coefficient on the parent risk-based capital ratio is substantially smaller, it is
still significant at the 1 percent level when outliers are removed.
Our results are quite similar whether we use OLS, fixed-effects, or variance components estimation
procedures, although we report only the variance components specification because the Hausman test indicates
that it is the most appropriate specification. The results are also qualitatively the same if we adjust the
2 6

dependent variable to control for possible demand influences by subtracting the average loan growth at all
non-Japanese banks in the United States, instead of subtracting the average loan growth at non-Japanese
banks in the same state and in the same asset size class as the Japanese branches.
Table 2A presents results for alternative specifications for Japanese bank subsidiaries. The fact that
the fixed-effects specification is the preferred specification suggests that idiosyncratic factors are relatively
more important at subsidiaries and may reflect the much smaller number of Japanese banks that have U. S.
subsidiaries. Column 1 contains results from a reestimation of column 1 of Table 3, excluding small
subsidiaries (those with total assets less than $500 million). The results are qualitatively similar for the
estimated coefficient on the parent risk-based capital ratio, although the estimated coefficient for the
subsidiary risk-based capital ratio is now only about one-third of its original value (in neither case is it
significant).
Because, on average, Japanese subsidiaries in the United States are quite well capitalized, one might
expect the t-statistics on the estimated coefficients for the subsidiary capital ratio to be relatively weak, and
indeed, that is the case. Since U.S. regulators enforce a leverage ratio requirement as well as the risk-based
capital requirement, it may be that it is the (unweighted) leverage ratio rather than the risk-based capital ratio
that is most relevant for U.S. subsidiaries. However, when the subsidiary risk-based capital ratio is replaced
with the subsidiary leverage ratio (column 2, Table 2A), we obtain results with even weaker subsidiary
capital ratio effects.
Table 3A contains results from specifications that correspond to those in Tables 2 and 3, with the
dependent variable constructed from the combined balance sheets of all U.S. branches and subsidiaries of each
Japanese parent bank. By examining the results for the total U.S. operations of Japanese banks, we can
ensure that our results for bank branches were not due to Japanese banks shifting their lending from their
branches to their much better capitalized subsidiaries. The first two columns show the results for the full
sample. Because many Japanese banks have only a branch presence in the United States, and thus do not
have the opportunity to shift loans to their U.S. subsidiaries, we also examined a subsample of Japanese
banks that have both subsidiary and branch operations in the United States, with the results shown in the
final two columns.
In each of the four equations, the parent risk-based capital ratio has a positive estimated effect that is
2 7

significant at the 1 percent level. Overall, the results are similar to those for branches and suggest that loan
shifting was not a factor. This is not surprising, given the large size of branch operations relative to those of
subsidiaries that make it doubtful that the significant loan shrinkage found in the branches could be explained
by a shift between branches and subsidiaries.
Table 4A investigates whether the change in parent capital (scaled by assets), rather than the parent
risk-based capital ratio, better describes the decline in Japanese branch lending. Because the risk-based capital
ratio is the threshold that is the focus of the Basle Accord capital regulation, the change in a bank's capital
may not capture the nature of the regulatory constraint. In particular, changes in capital when a bank has a
high capital ratio may have little impact on bank lending behavior, while changes in a bank's capital when a
bank has a capital ratio near the BIS 8 percent minimum may cause a more significant change in lending
behavior.
Because we include the contemporaneous change in capital (provided by the Bank of Japan) as the
explanatory variable, we must use an instrumental variables estimation technique. The instruments include
its own lagged value and the set of other independent variables included in the equation, as well as
information on bond ratings changes of the parent bank (provided by IBCA, the largest European bank rating
agency), hidden reserves of the parent bank (the unrealized gains on securities after the 55 percent discount
that are available to be used as tier 2 capital, provided by The Bank of Japan), the exchange rate, the Nikkei
stock price index, and Japanese land prices. The debt rating variables are a set of four (0,1) dummy variables
indicating an upgrade in the short-term debt rating, an upgrade in the long-term debt rating, a downgrade in
the short-term debt rating, and a downgrade in the long-term debt rating. The hidden reserves measure is
constructed as the change in hidden reserves during the prior six-month period, scaled by the parent bank's
beginning-of-period assets. The exchange rate, the Nikkei index, and the land price index are each measured as
the percentage change during the prior six-month period.
The decline in parent bank capital due to the decline in share prices of the cross-shareholdings of
firms which do not operate in the United States would be the ideal measure of the change in capital, were it
available, because it would better control for indirect demand effects. However, the results in Table 1 in the
paper show that indirect demand effects likely go the opposite way--U. S. affiliates of Japanese firms grew
rather than shrank their operations, implying that any reduction in loans by U.S. branches and subsidiaries of
2 8

Japanese banks would fall disproportionately on non-Japanese firms that borrow from Japanese banking
organizations.
The first four columns of Table 4A present the results from adding the change in parent bank capital
scaled by assets (instrumented) to the original set of explanatory variables. The parent risk-based capital ratio
retains its significance, with qualitatively similar coefficients to those reported in Table 2. However, the
change in parent capital has the wrong sign (negative), but is not statistically significant in any of the four
equations. Furthermore, the OLS and fixed-effects regressions produce similar results.
The final four columns of the table contain specifications that replace the parent risk-based capital
ratio with the change in parent capital, instead of adding it as an additional explanatory variable.
Unfortunately, such a specification does not capture the threshold effect embodied in the BIS capital standards.
Now the negative estimated coefficients on the change in parent capital are statistically significant.
However, if we limit the sample to the subset of observations in which the parent risk-based capital
ratio is below 9 percent, that is, those institutions that are capital constrained or near the BIS constraint, the
estimated coefficient on the change in capital when the parent risk-based capital ratio is included is positive,
as predicted, although with a t-statistic of only 0.07. When the parent risk-based capital ratio is not included,
the estimated coefficient on the change in capital is still negative but no longer significant, having a t-
statistic of only -0.19.
In general, the empirical results are quite robust.
The estimated coefficients on the parent risk-based capital ratio are qualitatively similar across estimation
techniques, adjustments to the dependent variable for demand effects, and the elimination of extreme values of
the dependent variable. The coefficients are similar in univariate as well as multivariate regressions, so that
they are not sensitive to the inclusion of other independent variables.
2 9

Table 1A
Alternative Specifications of Determinants of Japanese Lending in the U.S. - Branches
Estimation Method: Variance Components; Dependent Variable: ∆Loan/Asset -∆StLoan/StAsset
Estimation Method
Dependent Variable
Include Risk-Based
Capital of Parent Only
Alternative Land Price Series Excluding
Outliers
Constant -19.634**
(7.43)
-34.649*
(2.21)
-32.558*
(2.11)
-33.102*
(2.13)
-8.497
(0.61)
Parent Risk-Based
Capital Ratio
2.218**
(8.14)
1.911**
(6.55)
1.785**
(6.15)
1.815**
(6.23)
1.113**
(4.03)
Land Price 0.367**
(8.77)
Land Price 1 0.563**
(7.79)
Land Price 2 0.176**
(8.37)
Land Price 3 0.143**
(8.14)
Foreign Direct
Investment
0.076**
(3.89)
0.052**
(2.65)
0.061**
(3.11)
0.071**
(4.25)
Employment Growth 0.610*
(2.24)
0.731**
(2.68)
0.694*
(2.54)
0.480*
(2.10)
Log(asset) 1.268
(1.43)
1.243
(1.42)
1.248
(1.42)
0.304
(0.39)
Nonperforming Loans
Loans
0.015
(0.14)
0.021
(0.204)
0.021
(0.20)
-0.165
(1.81)

C&I Loans
Assets
0.042
(1.28)
0.036
(1.11)
0.038
(1.17)
-0.013
(0.45)
Real Estate Loans
Assets
-0.049
(1.00)
-0.040
(0.84)
-0.044
(0.92)
-0.036
(0.84)
Trust Bank 0.381
(0.29)
0.581
(0.45)
0.543
(0.42)
-0.415
(0.36)
Long-term Credit Bank 1.601
(1.10)
1.753
(1.22)
1.703
(1.18)
1.353
(1.07)
Regional Bank 2.626
(1.01)
2.624
(1.02)
2.633
(1.02)
-1.627
(0.70)
Hausman test P-value 0.012 0.835 0.852 0.849 0.872
Observations 370 370 370 370 345
R2 0.169 0.392 0.404 0.399 0.377
SSR 11806 13757 13479 13591 8496
SER 7.437 6.457 6.391 6.418 5.278
Note: The data are semiannual observations for March and September. Independent variables are measured asof the beginning of the period. Foreign direct investment and employment growth are measured over theprior six-month period. The land price series is the commercial land index for all urban districts and ismeasured relative to its peak in September 1991. The alternative land price measures are: Land Price 1, Indexfor the average of commercial, residential and industrial land prices in all urban districts; Land Price 2, Indexfor the average of commercial, residential and industrial land prices in the six largest cities; Land Price 3,Index for commercial land prices in six largest cities. Absolute values of t-statistics are in parentheses.*Significant at 5 percent level.**Significant at 1 percent level.

Table 2AAlternative Specifications of Determinants of Japanese Lending in the U.S. -SubsidiariesEstimation Method: Fixed Effects; Dependent Variable: ∆Loan/Asset -∆StLoan/StAsset
Exclud-ingSmallSubsid-iaries
SubstituteLeverage Ratio forRBC ofSubsidiary
Subsidiary Risk-Based Capital Ratio 0.060(0.24)
Subsidiary Leverage Ratio -0.034(0.09)
Parent Risk-Based Capital Ratio 0.555(0.88)
0.142(0.29)
Land Price 0.283**(2.85)
0.314**(3.27)
Foreign Direct Investment -0.051(1.46)
-0.017(0.52)
Employment Growth 0.670(1.67)
0.490(1.22)
Log(asset) -17.217**(4.66)
-16.965**(4.29)
Nonperforming Loans Loans
-0.616*(2.08)
-0.579*(2.11)
C&I Loans Assets
-0.182*(2.19)
-0.067(0.93)
Real Estate Loans Assets
0.017(0.17)
0.092(1.04)
Hausman test P-value 0.001 0.001Observations 178 242
R2 0.309 0.299
SSR 7297 14106
SER 6.88 8.119
Note: The data are semiannual observations for March and September. Independent variables are measured asof the beginning of the period. The land price series is the commercial land index for all urban districts and ismeasured relative to its peak in September 1991. Foreign direct investment and employment growth aremeasured over the prior six-month period. Absolute values of t-statistics are in parentheses.
*Significant at 5 percent level.**Significant at 1 percent level.

Table 3ADeterminants of Japanese Lending in the United States, Total U.S. OperationsEstimation Method: Variance Components, 1989:1 to 1995:2
Full Sample Japanese Banks with Both U.S.Subsidiaries and Branches
∆Loan - StLoan Asset StAsset
∆CI - StCI Asset StAsset
∆Loan - StLoan Asset StAsset
∆CI - StCI Asset StAsset
Constant -32.543**(2.46)
7.986(0.87)
-73.954**(4.26)
-8.576(0.67)
Parent Risk-BasedCapital Ratio
1.882**(6.87)
0.778**(3.86)
2.188**(6.98)
0.909**(3.84)
Land Price 0.380**(8.08)
0.197**(5.75)
0.340**(6.10)
0.164**(4.09)
Foreign DirectInvestment
0.076**(3.96)
0.069**(4.64)
0.091**(3.88)
0.069**(3.66)
Employment Growth 0.558*(2.17)
0.156(0.81)
0.420(1.30)
0.150(0.60)
Log(asset) 1.082(1.50)
0.291(0.58)
2.892**(3.22)
0.168(0.25)
NonperformingLoans Loans
0.032(0.29)
-0.281*(1.97)
0.174(1.13)
-0.276(0.91)
C&I Loans Assets
0.053(1.59)
-0.036(1.49)
0.194**(3.62)
-0.015(0.39)
Real Estate Loans Assets
-0.037(0.80)
0.003(0.08)
0.083(1.26)
0.025(0.51)
Trust Bank 0.436(0.33)
-0.532(0.57)
1.492(1.17)
-0.917(0.91)
Long-term CreditBank
1.204(0.80)
2.29*(2.20)
1.231(1.03)
2.159*(2.47)
Regional Bank 2.506(1.02)
-0.719(0.42)
- -
Hausman test P-value 0.682 0.843 0.137 0.102
Observations 365 365 246 246
R2 0.398 0.299 0.448 0.305
SSR 12304 6791 7136 4099
SER 6.153 4.571 5.735 4.346
Note: The data are semiannual observations for March and September. Independent variables are measured asof the beginning of the period. The land price series is the commercial land index for all urban districts andis measured relative to its peak in September 1991. Foreign direct investment and employment growth aremeasured over the prior six-month period. Nonperforming loans as a share of total loans are used incolumns 1 and 3 and measured as nonperforming C&I loans as a share of C&I loans in columns 2 and 4. Absolute values of t-statistics are in parentheses.
* Significant at the 5 percent level.**Significant at the 1 percent level.

Footnotes
1. The term "branches" will be used to refer to both branches andagencies. The important distinction here is whether the entity is included inthe balance sheet of the parent bank (agencies and branches) or not(subsidiaries).
2. Unrealized capital gains can be included in tier 2 capital, as long as tier1 capital accounts for at least 50 percent of total capital. Thus, unrealizedgains on stock market holdings can be utilized to the extent the bank hassufficient tier 1 capital to maintain the required tier 1 share of total capital.
3. If a bank has substantial unrealized gains that have not been included inits tier 2 capital because of the binding tier 1 share constraint, an increase intier 1 capital will increase tier 2 capital in a ratio of two to one.
4. While Japanese banks initially may have expanded U.S. operations inorder to serve their Japanese customers opening or expanding operations inthe U.S., by the late 1980s they were actively expanding their business withU.S.-based customers, with Japanese banks committing fewer loans toJapanese-owned borrowers than to non-Japanese borrowers (Nolle and Seth1996). In fact, many U.S.-owned companies, including small and mid-sizedfirms, list Japanese banks as their primary lender.
5. Frankel and Morgan (1992) report that the first yearly asset decline (5percent) in Japanese city banks since World War II occurred in 1991.
6. City banks are by far the most important bank type, accounting for two-thirds of the assets and loans made by all Japanese branches and subsidiariesin the United States. Next in importance are the long-term credit banks,followed by trust banks, and finally, regional banks.
Our sample includes all Japanese banks with significant U.S.operations but excludes approximately 20 Japanese banks that have verysmall operations in the United States and for which we have no parentcapital data. The total C&I loans of these omitted banks together representless than 3 percent of Japanese C&I lending in the United States. The dataset includes all city banks and long-term credit banks. While seven trustbanks operate in Japan, we have not included the two smallest, which haveno significant presence in the United States. We also have included the 10largest regional banks, each of which has at least one branch (but none asubsidiary) in the United States.
7. Several adjustments were made to the data set. For the branch data, werequired that commercial and industrial loans account for at least 5 percentof assets. Some Japanese branch operations are primarily bond tradingunits with no implications for the availability of domestic U.S. bank loans. Because de novo entry usually results in a very rapid initial expansion ofloans unrelated to the capital position of the parent, we eliminated the firsttwo years that a Japanese parent had branch operations in the United States. In addition, we had to exclude a few branches that did not provide data onnonperforming loans.

Subsidiary observations were deleted for the same reasons. Inaddition, we deleted any observation in which a subsidiary acquired anotherbank, since this would result in a jump in the loan series reflecting theacquisition rather than ongoing operations. We also deleted twosubsidiaries with risk-based capital ratios exceeding 100 percent, each withfew loans and a portfolio dominated by government securities, which have azero weight in risk-based capital calculations.
Because the first observation was lost owing to the need to lag theparent's risk-based capital ratio, all regressions are estimated over the1989:1 to 1995:2 period, providing a maximum of 14 semiannualobservations per bank. However, the panels are unbalanced, since not allbanks operated branches over the entire period and some subsidiaries hadnot operated for a full two years prior to the beginning of our sample orwere closed before 1995:2. The branch panel has 29 banks and a total of370 observations. The subsidiary panel has 19 banks and a total of 242observations.
8. Stein (1995) provides a model based on information problems that makeit difficult for banks to raise funds with instruments other than insureddeposits. As a consequence, if they are unable to raise external funds at areasonable price, banks may choose to shrink assets to satisfy capitalrequirements.
9. Because the FDI data are available only as annual observations, wecalculate the March observation as the average of the current and previousyears' values. We use the current-year value for the Septemberobservation. We then calculate the percentage change over the prior (six-month) period.
10. Because Japanese nonfinancial firms substantially increased theirreliance on bank debt as a percent of all debt during this period (Nolle andSeth 1996), it is even more likely that much of the brunt of the decline inloans at Japanese branches and subsidiaries was at the expense of non-Japanese borrowers.
11. To ensure that the results for the significant negative response toparent capital ratios were robust, we considered a number of alternativespecifications that are described in detail in an unpublished appendixavailable from the authors. The results are not sensitive to using parentrisk-based capital ratio as the only explanatory variable, to alternative landprice series, or to excluding the largest and smallest values of the dependentvariable.

Table 2Determinants of Japanese Lending in the United States, U.S. Branches, 1989:1 to 1995:2
Estimation MethodDependent Variable
VarianceComponents
∆Loan -∆StLoanAsset StAsset
Fixed Effects
∆Loan -∆StLoanAsset StAsset
VarianceComponents
∆LoanAsset
VarianceComponents
∆CI - ∆StCI Asset StAsset
Fixed Effects
∆CI - ∆StCI Asset StAsset
VarianceComponents
∆CI Asset
Constant -34.473*(2.18)
- -35.768**(2.25)
-9.827(0.85)
- -8.823(0.76)
Parent Risk-BasedCapital Ratio
1.928**(6.58)
1.912**(5.02)
2.189**(7.53)
0.792**(3.68)
0.819**(2.89)
0.819**(3.79)
Land Price 0.380**(7.56)
0.341**(5.70)
0.320**(6.42)
0.197**(5.52)
0.208**(4.91)
0.167**(4.67)
Foreign DirectInvestment
0.081(4.08)
0.071**(3.11)
0.095**(4.88)
0.070**(4.63)
0.071**(4.04)
0.080**(5.22)
Employment Growth 0.553*(2.03)
0.526(1.77)
0.383(1.42)
0.171(0.85)
0.132(0.60)
0.016(0.08)
Log(Asset) 1.237(1.38)
-0.995(0.41)
1.178(1.31)
0.432(0.67)
-1.008(0.57)
0.362(0.55)
Nonperforming Loans Loans
0.020(0.19)
0.060(0.47)
0.018(0.17)
-0.286(1.91)
-0.223(1.32)
-0.299*(2.00)
C&I Loans Assets
0.045(1.37)
0.081(1.46)
0.047(1.43)
-0.044(1.86)
-0.103**(2.58)
-0.044(1.84)
Real Estate Loans Assets
-0.054(1.11)
-0.108(1.20)
-0.068(1.40)
0.004(0.11)
0.016(0.24)
-0.002(0.04)
Trust Bank 0.357(0.27)
- -0.223(0.17)
-0.677(0.70)
- -0.852(0.88)
Long-Term CreditBank
1.540(1.05)
- 1.296(0.87)
2.546*(2.41)
- 2.448*(2.30)
Regional Bank 2.553(0.97)
- 2.134(0.81)
-0.649(0.34)
- -0.884(0.46)
Hausman test P-value 0.812 - 0.729 0.812 - 0.775
Observations 370 370 370 370 370 370
R2 0.387 0.408 0.406 0.294 0.318 0.294
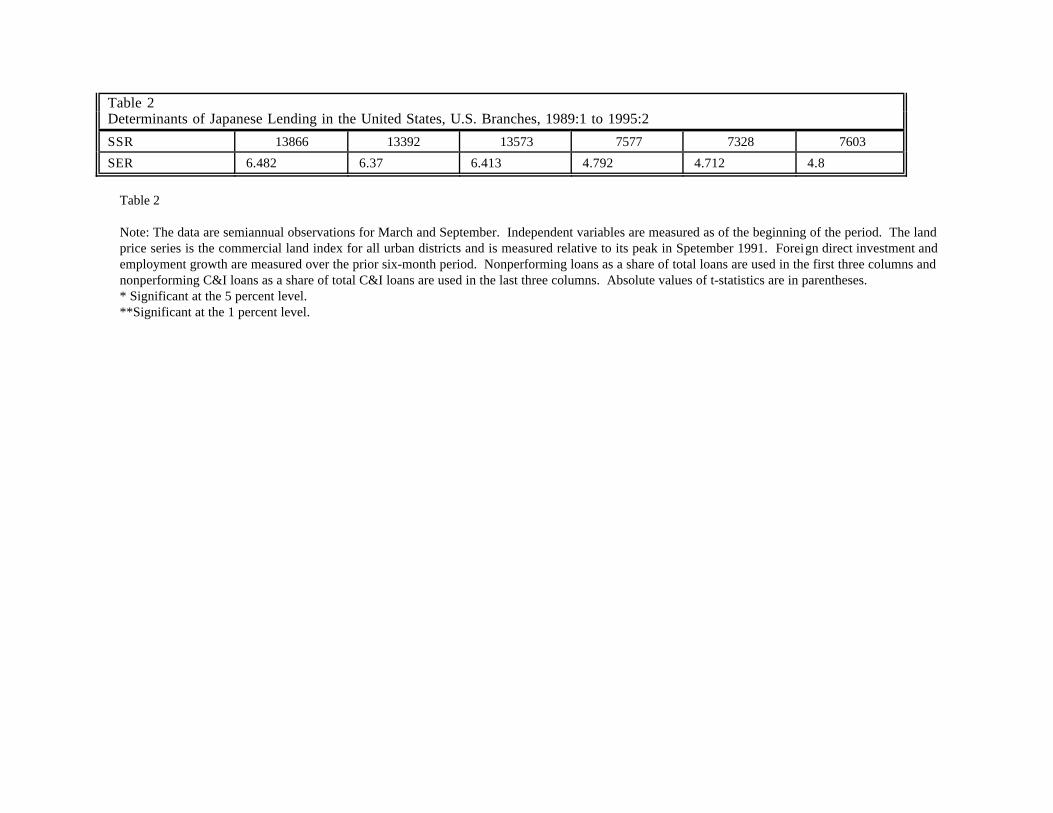
Table 2Determinants of Japanese Lending in the United States, U.S. Branches, 1989:1 to 1995:2
SSR 13866 13392 13573 7577 7328 7603
SER 6.482 6.37 6.413 4.792 4.712 4.8
Table 2
Note: The data are semiannual observations for March and September. Independent variables are measured as of the beginning of the period. The landprice series is the commercial land index for all urban districts and is measured relative to its peak in Spetember 1991. Foreign direct investment andemployment growth are measured over the prior six-month period. Nonperforming loans as a share of total loans are used in the first three columns andnonperforming C&I loans as a share of total C&I loans are used in the last three columns. Absolute values of t-statistics are in parentheses.* Significant at the 5 percent level.**Significant at the 1 percent level.

Table 4AAlternative Methods of Estimating Determinants of Japanese Lending in the United States - BranchesTwo-Stage Least Squares Estimation Instrumenting for Change in Parent CapitalEstimation Method
Dependent Variable
2SLS
∆Loan -∆StLoanAsset StAsset
2SLS,Fixed-Effects∆Loan -∆StLoanAsset StAsset
2SLS
∆CI -∆StCIAsset StAsset
2SLS,Fixed-Effects∆CI -∆StCIAsset StAsset
2SLS
∆Loan -∆StLoanAsset StAsset
2SLS,Fixed-Effects∆Loan -∆StLoanAsset StAsset
2SLS
∆CI -∆StCIAsset StAsset
2SLS,Fixed-Effects∆CI -∆StCIAsset StAsset
Constant -26.992*(2.06)
- -12.740(1.31)
- 10.185(0.84)
- 1.223(0.14)
-
Change in ParentCapital Assets
-0.710(1.58)
-0.876(1.88)
-0.473(1.42)
-0.536(1.54)
-1.336**(2.98)
-1.319**(3.05)
-0.732*(2.29)
-0.793*(2.50)
Parent Risk-BasedCapital Ratio
1.829**(6.06)
1.617**(3.82)
0.686**
(3.07)
0.773*(2.45)
- - - -
Land Price 0.426**(8.33)
0.373**(6.52)
0.207**
(5.46)
0.236**(5.52)
0.470**(8.81)
0.345**(5.92)
0.224**
(5.89)
0.222**(5.20)
Foreign DirectInvestment
0.104**(4.57)
0.101**(4.27)
0.077**
(4.55)
0.084**(4.78)
0.093**(3.90)
0.085**(3.53)
0.073**
(4.28)
0.077**(4.35)
EmploymentGrowth
0.482(1.78)
0.365(1.27)
0.245(1.21)
0.184(0.86)
0.960**(3.49)
0.490(1.67)
0.422*(2.15)
0.239(1.11)
Log(asset) 0.946(1.31)
-4.720(1.75)
0.703(1.31)
-0.976(0.49)
-0.196(0.27)
-10.
858**(4.94)
0.273(0.52)
-3.918*(2.43)
NonperformingLoans Loans
-0.035(0.33)
0.052(0.42)
-0.110(1.42)
-0.102(1.10)
-0.089(0.81)
0.047(0.37)
-0.131(1.66)
-0.104(1.11)
C&I Loans Assets
0.028(1.00)
0.068(1.26)
-0.040(1.91)
-0.114**(2.83)
0.014(0.46)
0.062(1.12)
-0.046*(2.15)
-0.117**(2.87)
Real Estate Loans Assets
-0.066(1.61)
-0.108(1.10)
-0.007(0.23)
0.058(0.80)
-0.131**(3.11)
-0.287**(3.26)
-0.032(1.05)
-0.028(0.43)
Trust Bank -0.020(0.02)
- -0.727(0.93)
- 2.593*(2.54)
- 0.248(0.34)
-
Long-term CreditBank
1.402(1.22)
- 1.868*(2.20)
- 1.394(1.15)
- 1.863*(2.16)
-
Regional Bank 1.516(0.72)
- 0.052(0.03)
- -0.491(0.22)
- -0.702(0.45)
-
Observations 348 348 348 348 348 348 348 348

R2 0.397 0.443 0.255 0.306 0.328 0.413 0.233 0.29
SSR 11740 10853 6463 6017 13098 11431 6653 6161
SER 5.92 5.917 4.392 4.406 6.244 6.063 4.45 4.451Note: The data are semiannual observations for March and September. Independent variables are measured as of the beginning of the period. The landprice series is the commercial land index for all urban districts and is measured relative to its peak in September 1991. Foreign direct investment andemployment growth are measured over the prior six-month period. Nonperforming loans as a share of total loans are used in columns 1, 2, 5, and 6, andnonperforming C&I loans as a share of total C&I loans are used in columns 3, 4, 7, and 8. The set of instruments for the change in parent capitalinclude its own lagged value, changes in hidden reserves, the percentage changes in the Nikkei stock price index, the exchange rate and land prices, anddummy variables for changes in the ratings of long-term and short-term debt, as well as each of the other explanatory variables. Absolute values of t-statistics are in parentheses.*Significant at 5 percent level.**Significant at 1 percent level.