Embed Size (px)
Citation preview
1
SENSORY COMPARISON OF FROZEN FOOD AND
FRESH FOOD
OCTOBER 2009
A BFFF PROJECT IN CONJUNCTION WITH THE MANCHESTER FOOD RESEARCH CENTRE
2
Index
1. EXECUTIVE SUMMARY 2. METHODOLOGY OF THE PROJECT
3. SENSORY DESCRIPTORS
4. RESULTS 5. CONCLUSION
APPENDIX 1 – STATISTICAL DATA APPENDIX 2 – CHEFS NAMES
3
1. EXECUTIVE SUMMARY
BFFF launched a foodservice campaign in March 2009 which aims to highlight a
business case for using frozen food. As part of this, the BFFF instructed the
Manchester Food Research Centre to conduct a ‘Sensory Comparison’ study to
compare the taste and texture of frozen versus ‘fresh’ foodstuffs.
The research results highlighted that there was no statistically significant differences
in overall ratings for the frozen or ‘fresh’ food sample in the case of seven of the
foodstuffs, the exception being the blueberries1.
Generally the quality of all products was acceptable; sometimes the frozen product
achieved a higher overall rating and sometimes the ‘fresh’ product. This indicates
that, although individual attributes may vary, there is little difference between the two
forms of the products.
The ‘Sensory Comparison’ study tested a range of foods to give them an overall
rating on a range of characteristics using sensory analysis. Using a panel of 32
chefs, eight foods were tested - each in frozen and fresh form. Foodstuffs commonly
used within UK pubs, restaurants and hotels, they comprised of a wholemeal
bloomer, puff pastry, blueberries, potato mash, spinach, duck breasts, pork and leek
sausage and tuna steaks.
1 Researchers considered the variant and grade of fresh and frozen fruit supplied was dissimilar
4
2. METHODOLOGY OF THE PROJECT
The study and following analysis was conducted within the specially designed test
facilities at the Manchester Food Research Centre, situated within The School of
Food, Consumer, Tourism and Hospitality Management of the Manchester
Metropolitan University.
Eight foodstuffs were tested within the study. They are ‘food components’ commonly
served within UK pubs, restaurants and hotels. They comprised of:
• A wholemeal bloomer;
• Puff pastry;
• Blueberries;
• Potato mash;
• Spinach;
• Duck breasts;
• Pork and leek sausage; and,
• Tuna steaks.
The BFFF, via a leading national wholesaler, supplied MFRC with each of the above
food components in its frozen format, plus select foods in a ‘fresh’ format. Where
‘fresh’ versions were not available, MFRC sourced the foodstuff from a local retailer.
All frozen and ‘fresh’ foodstuffs were supplied to the same specifications2, to exactly
the same weight and serving size. All foodstuffs were prepared and cooked in
accordance with the supplier’s recommendation.
2 Researchers considered the variant and grade of fresh and frozen fruit supplied was dissimilar
The samples were assessed by 32 chefs currently working in the North West of
England. The chefs were selected from a wide range of foodservice sectors including
city centre, suburban and country pubs, bars, restaurants and hotels.
5
Four sessions were held in turn with eight participating chefs. During each session
the chefs tasted each of the eight foodstuff samples in turn. Samples were presented
on disposable plates in individual tasting booths. Samples were randomised and
allocated individual random numbers. Water was served throughout the tasting
sessions, with participants encouraged to rinse their mouths between tastings.
Portion sizes were small and uniform. Participants were asked to mark their response
to sensory attributes on continuous lines on separate forms, with space also provided
for comments. Samples were presented in the following order: wholemeal bloomer,
puff pastry, blueberries, potato mash, spinach, duck breast, pork and leek sausage
and tuna steak.
The sensory tests were designed in accordance with best practice using the
guidance given in BS7183 (ISO8589). Data were collected using Fizz-software
(Biosystems, v2.00k, 2003). For data analysis, the software package Fizz
calculations (Biosystems, v2.10a, 2003) was used.
The differences between the samples were analysed statistically (using the Mann
Whitney Test). We can identify statistically significant differences using a scale
from 1 to 0. If the samples score identically then the significance will be 1. The
closer to 0, the greater the probability of a noticeable difference between the
samples. Statistically significance is generally accepted at levels below 0.05 (5%).
Significant differences are indicated in the report at 0.05 (5%, represented by one *),
0.01 (0.1%, represented by **) and at 0.001 confidence (0.01%, represented by ***).
Non-significant scores are represented by NS.
The samples were presented to the tasters in random order and coded sets.
Presentation was conducted using best practice techniques in accordance with
BS5929 (ISO 6658). Panellists were asked to give their opinion of the characteristics
by marking a 10cm scale. They were requested to cleanse their palate between
each sample. Results were collected and analysed. Summary scores are presented
in the Appendix.
6
3. SENSORY DESCRIPTORS
The sensory descriptors used within the study were designed specifically for each
foodstuff tested.
Bloomer Appearance Dense -------------------------------- Light Crust Colour Light -------------------------------- Dark Mouthfeel Hard ------------------------------- Soft Consistency Stale ------------------------------ Fresh Texture Dry ------------------------------ Moist Saltiness Low ------------------------------- High Nuttiness Low ------------------------------- High Overall Rating Dislike -------------------------------- Like Puff Pastry Appearance Dense -------------------------------- Light Colour Light -------------------------------- Dark Mouthfeel Hard ------------------------------- Soft Density Dense ------------------------------- Light Consistency Stale ------------------------------ Fresh Texture Dry ------------------------------ Moist Saltiness Low ------------------------------- High Overall Rating Dislike -------------------------------- Like Blueberries Appearance Withered ------------------------------ Plump Colour Light -------------------------------- Dark Berries Split ------------------------------- Entire Consistency Mushy ------------------------------ Firm Texture Dry ------------------------------ Juicy Acidity Low ------------------------------- High Sweetness Low ------------------------------- High Overall Rating Dislike -------------------------------- Like Potato Mash Appearance Watery ------------------------------- Firm Colour White ------------------------------- Yellow Mouthfeel Lumpy ------------------------------- Smooth Density Dense ------------------------------- Light Consistency Watery ------------------------------ Creamy
7
Taste Bland ------------------------------- Tasty Saltiness Low ------------------------------- High Overall Rating Dislike -------------------------------- Like Spinach Appearance Sloppy ------------------------------- Firm Colour Light -------------------------------- Dark Mouthfeel Soft ------------------------------- Firm Consistency Watery ------------------------------ Firm Flavour Weak ------------------------------- Strong Sweetness None ------------------------------- Sweet Overall Rating Dislike -------------------------------- Like Duck breast Appearance Fatty -------------------------------- Lean Colour Pink -------------------------------- Dark Mouthfeel Tough ------------------------------- Tender Consistency Soft ------------------------------ Chewy Texture Dry ------------------------------ Moist Meatiness Weak ------------------------------- Strong Greasiness Low ------------------------------- High Overall Rating Dislike -------------------------------- Like Pork & leek sausage Appearance Light -------------------------------- Dark Colour Dark -------------------------------- Golden Appeal Dry -------------------------------- Succulent Mouthfeel Tough ------------------------------- Tender Consistency Smooth ------------------------------ Lumpy Texture Dry ------------------------------ Moist Meatiness Weak ------------------------------- Strong Fattiness Low ------------------------------- High Herbiness Low ------------------------------ High Saltiness Low ------------------------------- High Leek Flavour Low ------------------------------- High Overall Rating Dislike -------------------------------- Like Tuna steak Appearance Flaky -------------------------------- Dense Colour Grey -------------------------------- Pink Texture Soft ------------------------------ Firm Chewiness Not ------------------------------ Very Mouthfeel Dry ------------------------------- Moist Flavour Weak ------------------------------- Strong Saltiness Low ------------------------------- High Overall Rating Dislike -------------------------------- Like
8
4. RESULTS
The following section highlights the sensory analysis results for each of the foodstuffs
tested. Scores above “5” indicate a ‘positive’ detection for a particular attribute.
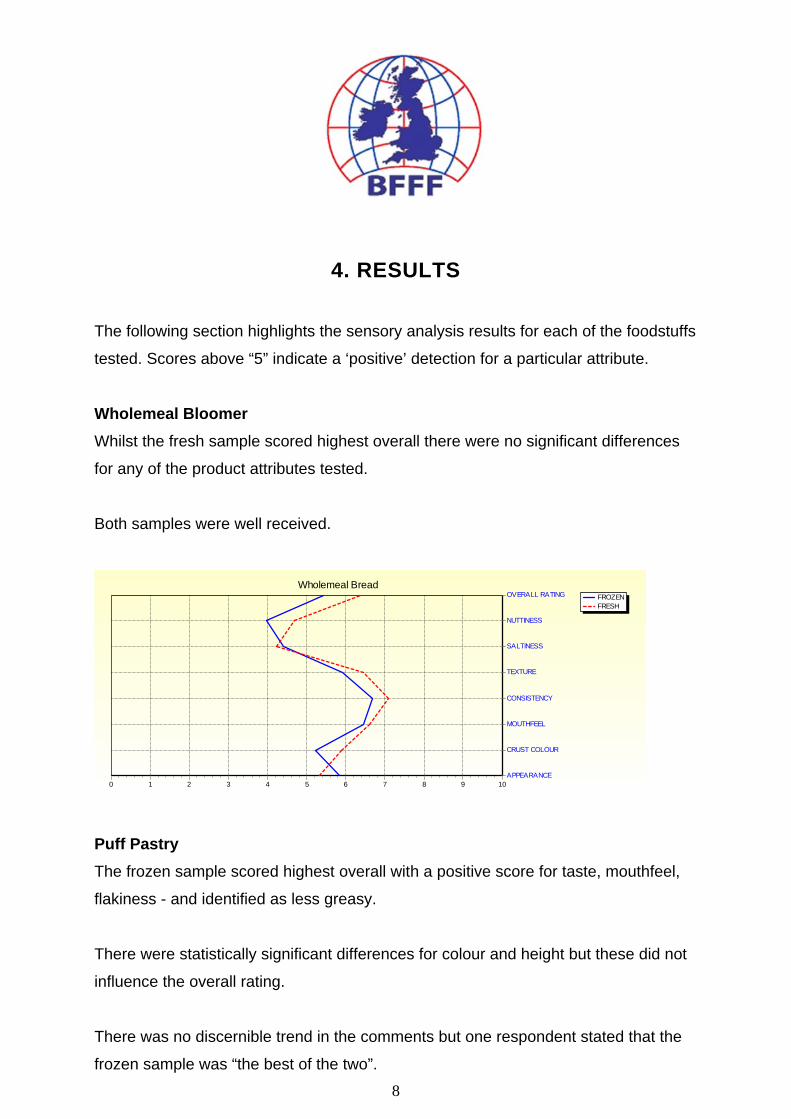
Wholemeal Bloomer Whilst the fresh sample scored highest overall there were no significant differences
for any of the product attributes tested.
Both samples were well received.
FROZENFRESH
Wholemeal Bread
109876543210APPEARANCE
CRUST COLOUR
MOUTHFEEL
CONSISTENCY
TEXTURE
SALTINESS
NUTTINESS
OVERALL RATING
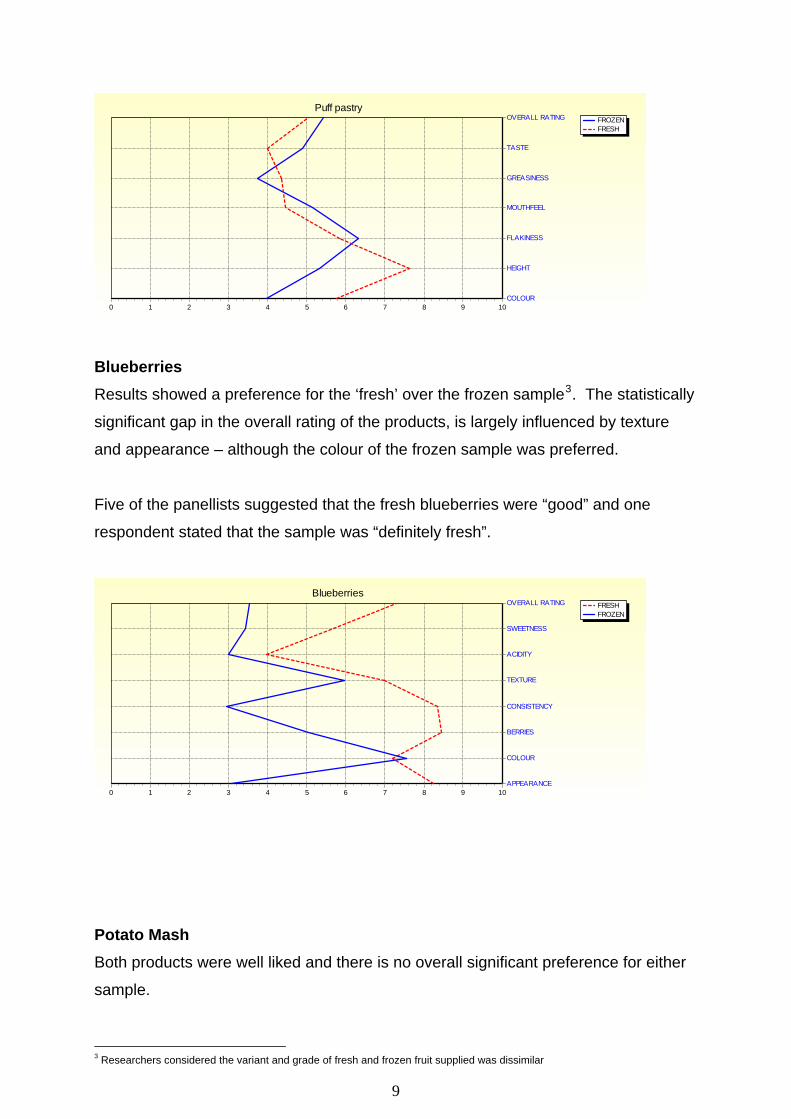
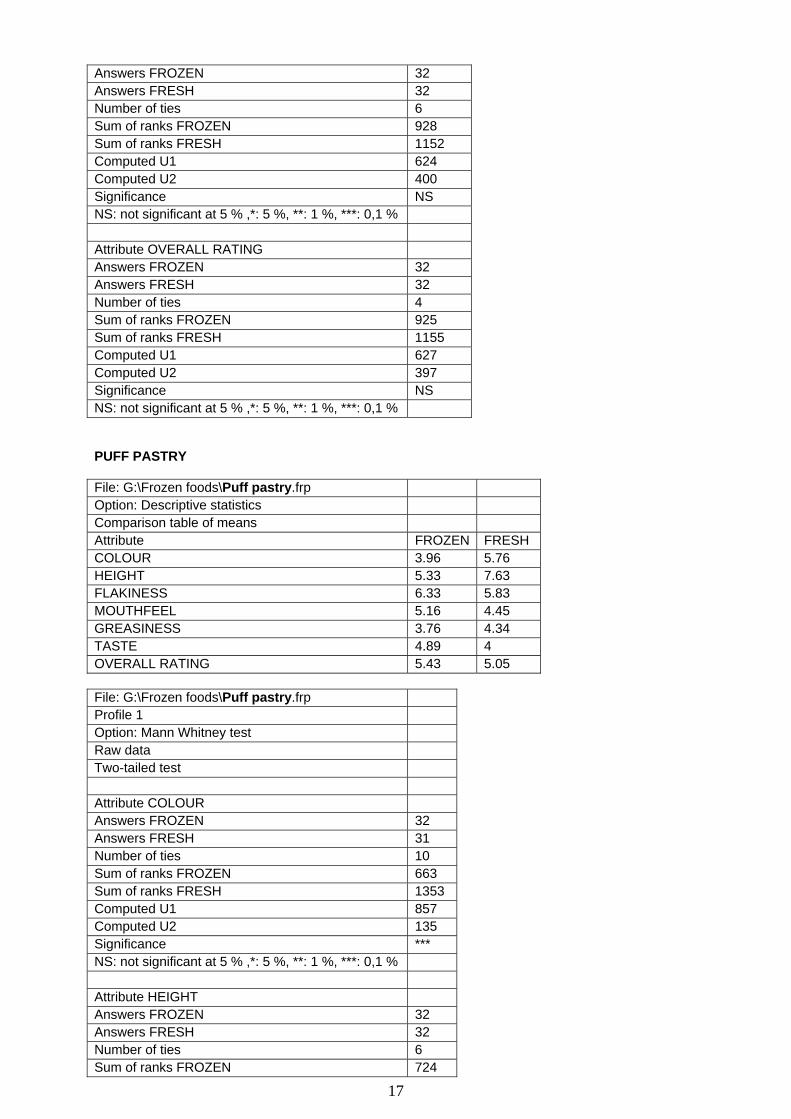
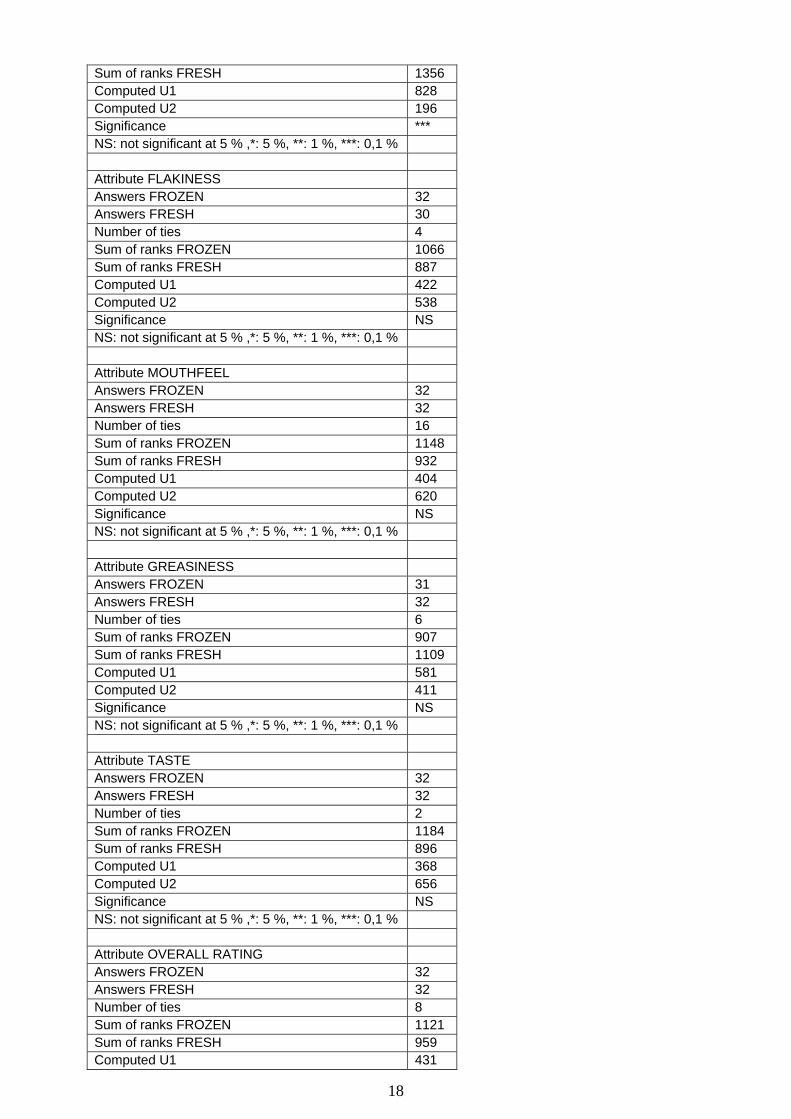
Puff Pastry The frozen sample scored highest overall with a positive score for taste, mouthfeel,
flakiness - and identified as less greasy.
There were statistically significant differences for colour and height but these did not
influence the overall rating.
There was no discernible trend in the comments but one respondent stated that the
frozen sample was “the best of the two”.
9
Puff pastry
COLOUR
HEIGHT
FLAKINESS
MOUTHFEEL
GREASINESS
TASTE
OVERALL RATING FROZENFRESH
109876543210
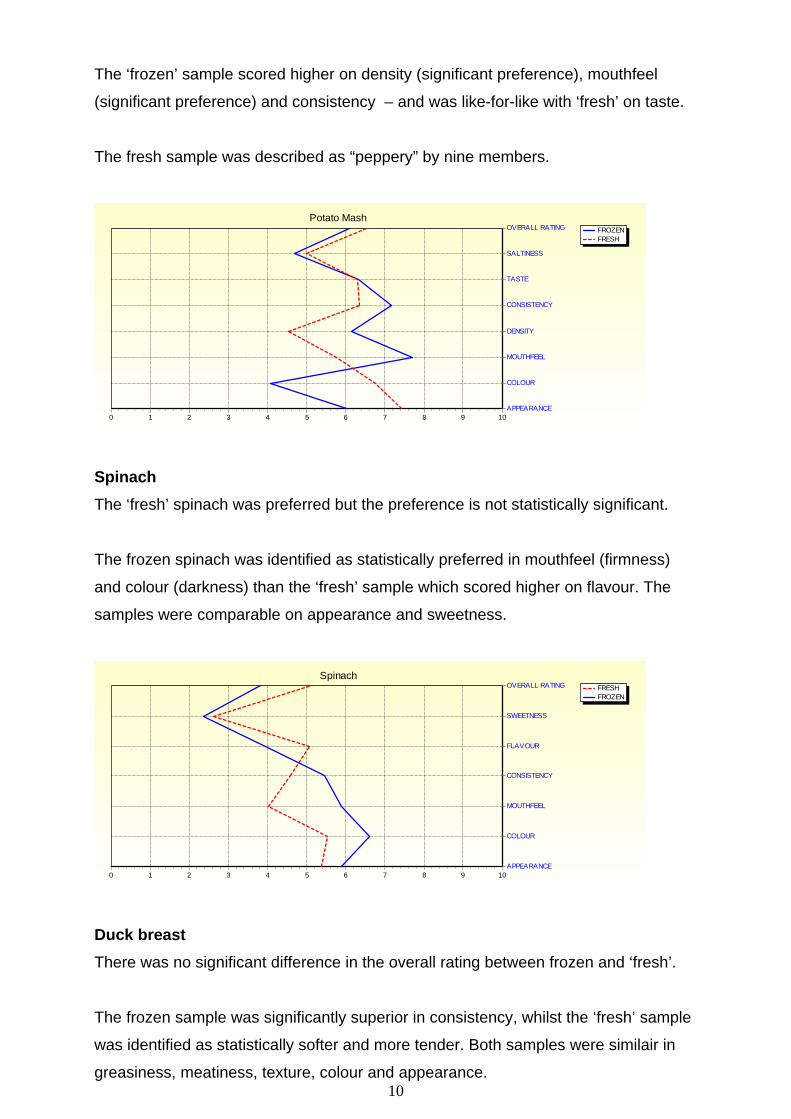
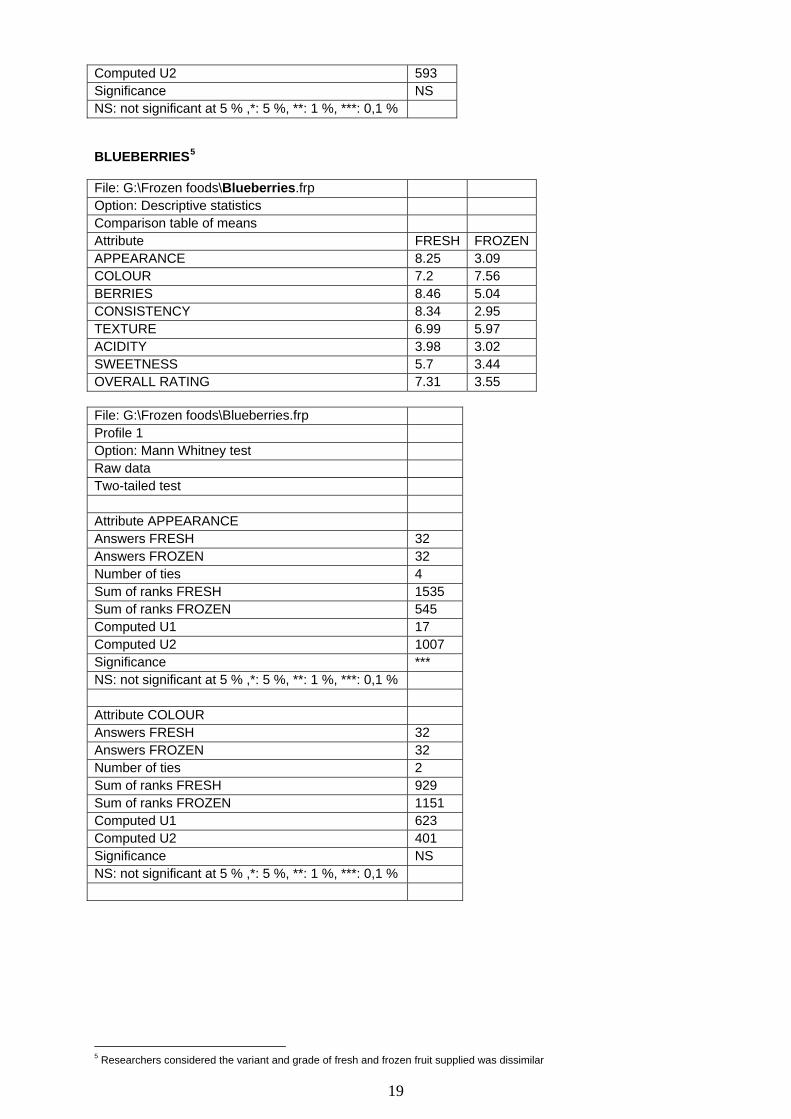
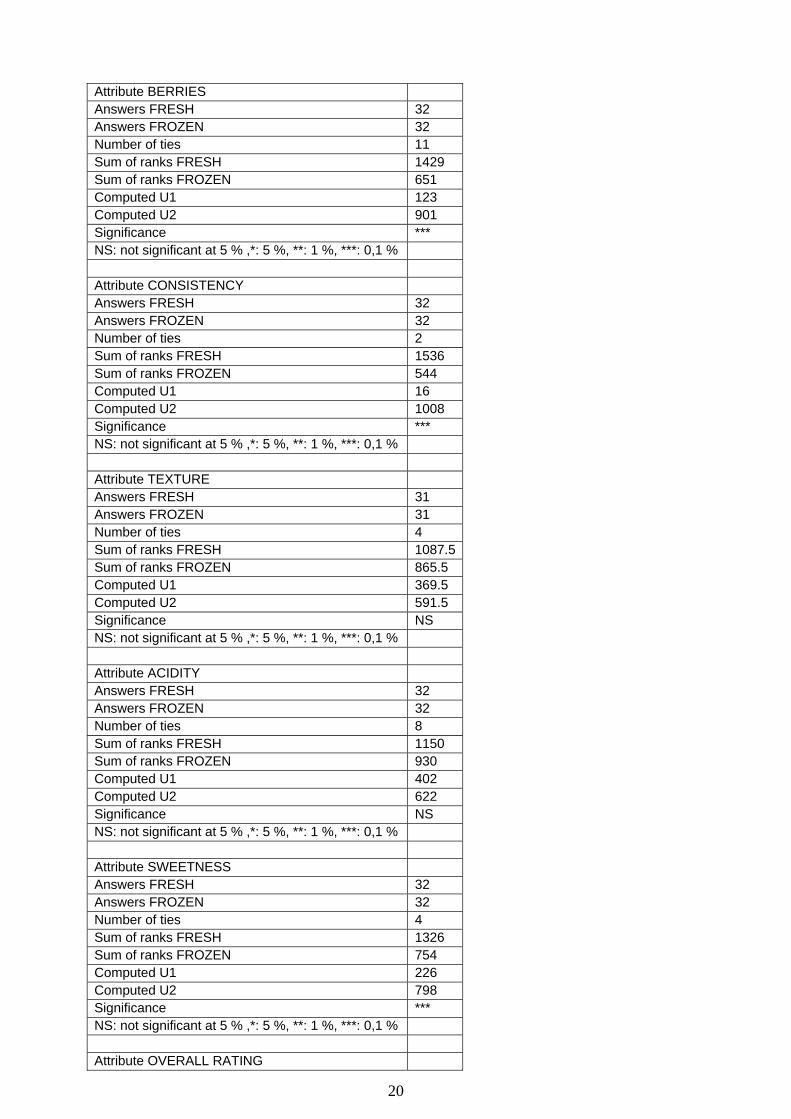
Blueberries Results showed a preference for the ‘fresh’ over the frozen sample3. The statistically
significant gap in the overall rating of the products, is largely influenced by texture
and appearance – although the colour of the frozen sample was preferred.
Five of the panellists suggested that the fresh blueberries were “good” and one
respondent stated that the sample was “definitely fresh”.
FRESHFROZEN
Blueberries
109876543210APPEARANCE
COLOUR
BERRIES
CONSISTENCY
TEXTURE
ACIDITY
SWEETNESS
OVERALL RATING
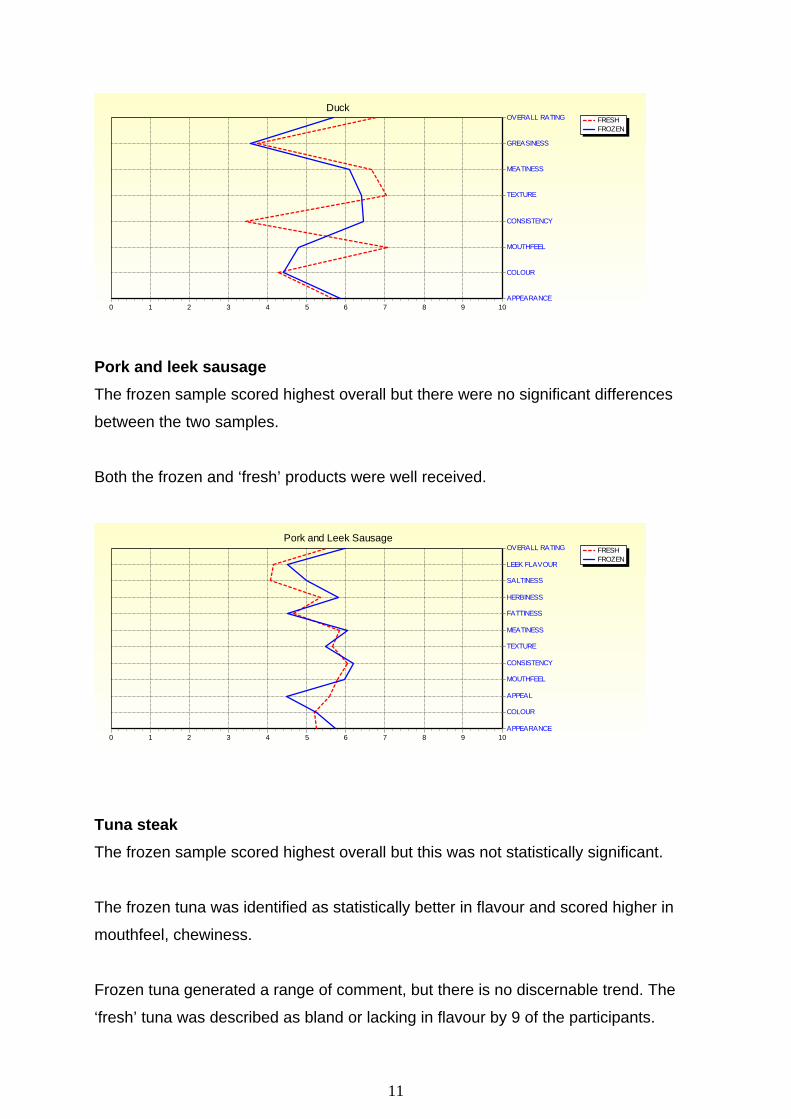
Potato Mash Both products were well liked and there is no overall significant preference for either
sample.
3 Researchers considered the variant and grade of fresh and frozen fruit supplied was dissimilar
10
The ‘frozen’ sample scored higher on density (significant preference), mouthfeel
(significant preference) and consistency – and was like-for-like with ‘fresh’ on taste.
The fresh sample was described as “peppery” by nine members.
FROZENFRESH
Potato Mash
109876543210APPEARANCE
COLOUR
MOUTHFEEL
DENSITY
CONSISTENCY
TASTE
SALTINESS
OVERALL RATING
Spinach The ‘fresh’ spinach was preferred but the preference is not statistically significant.
The frozen spinach was identified as statistically preferred in mouthfeel (firmness)
and colour (darkness) than the ‘fresh’ sample which scored higher on flavour. The
samples were comparable on appearance and sweetness.
FRESHFROZEN
Spinach
109876543210APPEARANCE
COLOUR
MOUTHFEEL
CONSISTENCY
FLAVOUR
SWEETNESS
OVERALL RATING
Duck breast There was no significant difference in the overall rating between frozen and ‘fresh’.
The frozen sample was significantly superior in consistency, whilst the ‘fresh’ sample
was identified as statistically softer and more tender. Both samples were similair in
greasiness, meatiness, texture, colour and appearance.
11
Duck
APPEARANCE
COLOUR
MOUTHFEEL
CONSISTENCY
TEXTURE
MEATINESS
GREASINESS
OVERALL RATING FRESHFROZEN
109876543210
Pork and leek sausage The frozen sample scored highest overall but there were no significant differences
between the two samples.
Both the frozen and ‘fresh’ products were well received.
FRESHFROZEN
Pork and Leek Sausage
109876543210APPEARANCE
COLOUR
APPEAL
MOUTHFEEL
CONSISTENCY
TEXTURE
MEATINESS
FATTINESS
HERBINESS
SALTINESS
LEEK FLAVOUR
OVERALL RATING
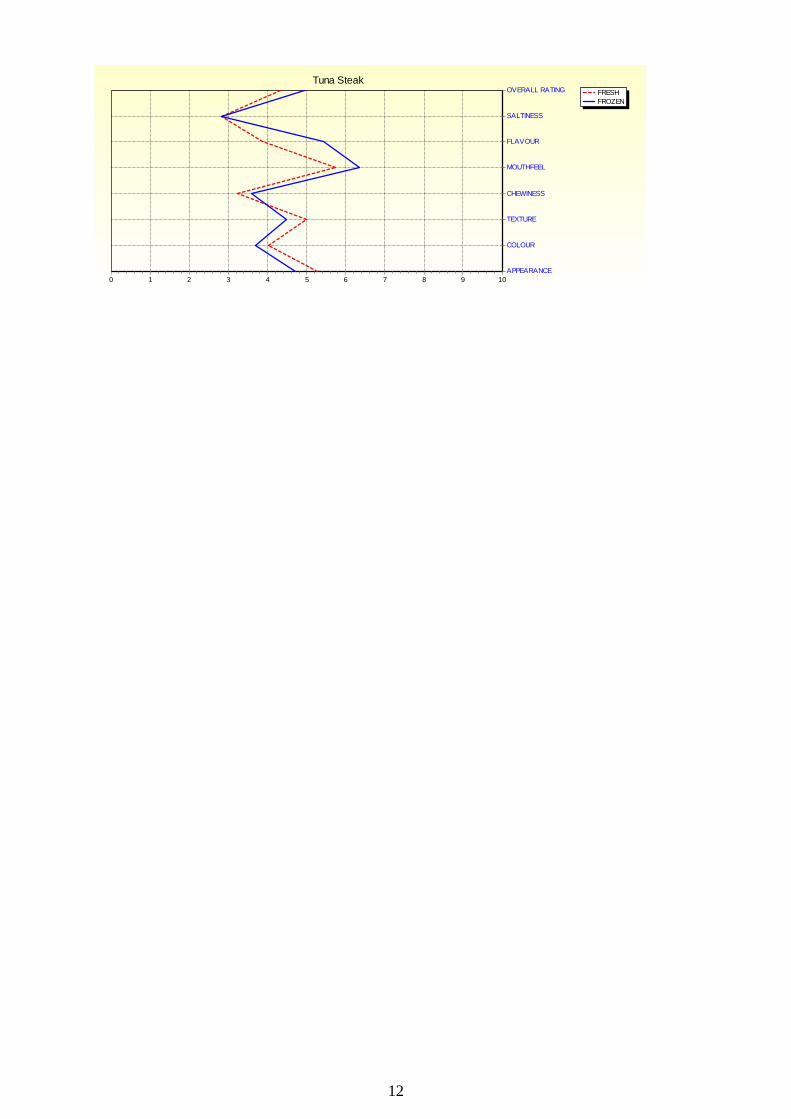
Tuna steak The frozen sample scored highest overall but this was not statistically significant.
The frozen tuna was identified as statistically better in flavour and scored higher in
mouthfeel, chewiness.
Frozen tuna generated a range of comment, but there is no discernable trend. The
‘fresh’ tuna was described as bland or lacking in flavour by 9 of the participants.
12
FRESHFROZEN
Tuna Steak
109876543210APPEARANCE
COLOUR
TEXTURE
CHEWINESS
MOUTHFEEL
FLAVOUR
SALTINESS
OVERALL RATING
13
5. CONCLUSIONS
Results highlighted that there was no statistically significant differences in overall
ratings for the frozen or ‘fresh’ food sample in the case of seven of the foodstuffs, the
exception being the blueberries. This indicates that, although individual attributes
may vary, there is little difference between the two forms of the products.
The study indicated the important attributes determining a high overall rating for each
foodstuff. Generally the quality of all products was acceptable; sometimes the frozen
product achieved a higher overall rating and sometimes the ‘fresh’ product.
Summary of results:
Wholemeal bloomer There was no significant difference for any of the product attributes
tested. Both samples were well received.
Puff pastry There was no significant preference for either sample. However, overall
the frozen sample scored higher than fresh.
Blueberries There was a significant difference. The ‘fresh’ sample was preferred
over the frozen.4
Potato mash Both products were well liked and there was no overall significant
preference for either sample.
Spinach There was no significant preference for either sample.
Duck breast There was no significant difference in the overall rating between frozen
and ‘fresh’.
4 Researchers considered the variant and grade of fresh and frozen fruit supplied was dissimilar
14
Pork & leek sausages The frozen sample scored highest overall but there were no significant
differences between the two samples.
Tuna steak The frozen sample scored highest overall but this was not statistically
significant.
15
APPENDIX 1 STATISTICAL DATA
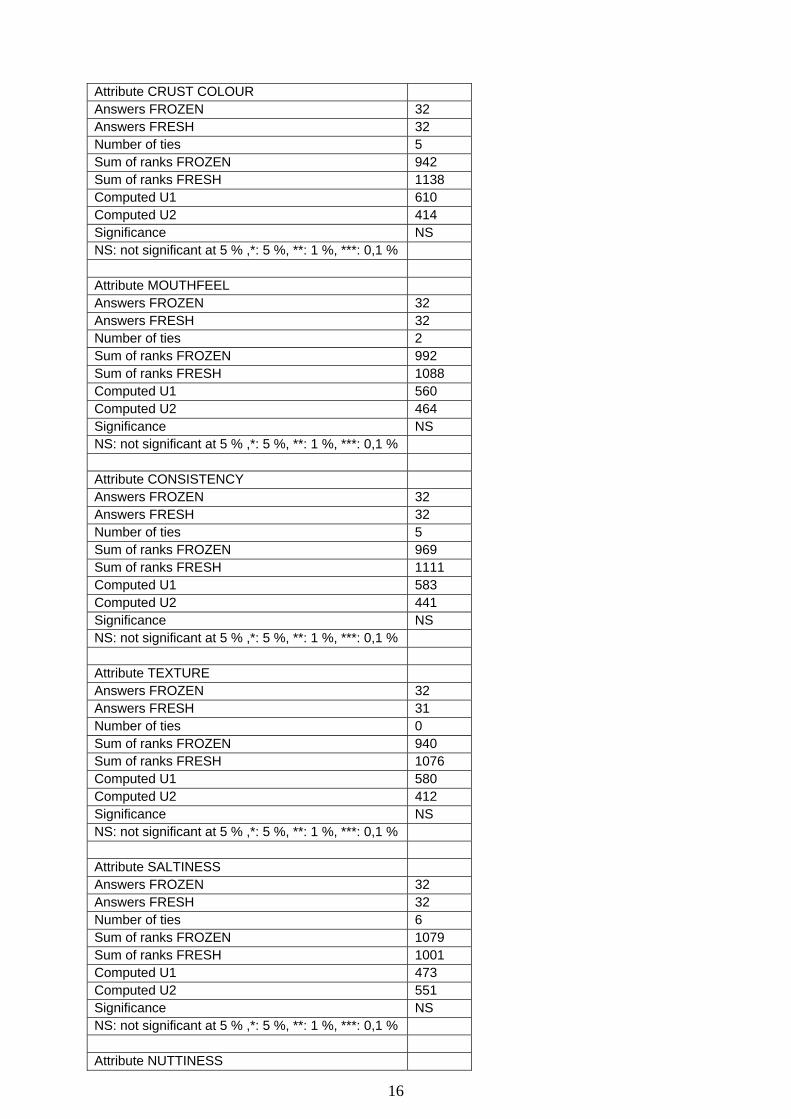
WHOLEMEAL BLOOMER File: G:\Frozen foods\Wholemeal bloomer.frp Option: Descriptive statistics Comparison table of means Attribute FROZEN FRESH APPEARANCE 5.85 5.33 CRUST COLOUR 5.25 5.89 MOUTHFEEL 6.46 6.6 CONSISTENCY 6.69 7.09 TEXTURE 5.91 6.44 SALTINESS 4.41 4.24 NUTTINESS 3.97 4.69 OVERALL RATING 5.41 6.38 File: G:\Frozen foods\Wholemeal Bloomer.frp Profile 1 Option: Mann Whitney test Raw data Two-tailed test Attribute APPEARANCE Answers FROZEN 32 Answers FRESH 32 Number of ties 8 Sum of ranks FROZEN 1123.5 Sum of ranks FRESH 956.5 Computed U1 428.5 Computed U2 595.5 Significance NS NS: not significant at 5 % ,*: 5 %, **: 1 %, ***: 0,1 %
16
Attribute CRUST COLOUR Answers FROZEN 32 Answers FRESH 32 Number of ties 5 Sum of ranks FROZEN 942 Sum of ranks FRESH 1138 Computed U1 610 Computed U2 414 Significance NS NS: not significant at 5 % ,*: 5 %, **: 1 %, ***: 0,1 % Attribute MOUTHFEEL Answers FROZEN 32 Answers FRESH 32 Number of ties 2 Sum of ranks FROZEN 992 Sum of ranks FRESH 1088 Computed U1 560 Computed U2 464 Significance NS NS: not significant at 5 % ,*: 5 %, **: 1 %, ***: 0,1 % Attribute CONSISTENCY Answers FROZEN 32 Answers FRESH 32 Number of ties 5 Sum of ranks FROZEN 969 Sum of ranks FRESH 1111 Computed U1 583 Computed U2 441 Significance NS NS: not significant at 5 % ,*: 5 %, **: 1 %, ***: 0,1 % Attribute TEXTURE Answers FROZEN 32 Answers FRESH 31 Number of ties 0 Sum of ranks FROZEN 940 Sum of ranks FRESH 1076 Computed U1 580 Computed U2 412 Significance NS NS: not significant at 5 % ,*: 5 %, **: 1 %, ***: 0,1 % Attribute SALTINESS Answers FROZEN 32 Answers FRESH 32 Number of ties 6 Sum of ranks FROZEN 1079 Sum of ranks FRESH 1001 Computed U1 473 Computed U2 551 Significance NS NS: not significant at 5 % ,*: 5 %, **: 1 %, ***: 0,1 % Attribute NUTTINESS
17
Answers FROZEN 32 Answers FRESH 32 Number of ties 6 Sum of ranks FROZEN 928 Sum of ranks FRESH 1152 Computed U1 624 Computed U2 400 Significance NS NS: not significant at 5 % ,*: 5 %, **: 1 %, ***: 0,1 % Attribute OVERALL RATING Answers FROZEN 32 Answers FRESH 32 Number of ties 4 Sum of ranks FROZEN 925 Sum of ranks FRESH 1155 Computed U1 627 Computed U2 397 Significance NS NS: not significant at 5 % ,*: 5 %, **: 1 %, ***: 0,1 % PUFF PASTRY File: G:\Frozen foods\Puff pastry.frp Option: Descriptive statistics Comparison table of means Attribute FROZEN FRESH COLOUR 3.96 5.76 HEIGHT 5.33 7.63 FLAKINESS 6.33 5.83 MOUTHFEEL 5.16 4.45 GREASINESS 3.76 4.34 TASTE 4.89 4 OVERALL RATING 5.43 5.05 File: G:\Frozen foods\Puff pastry.frp Profile 1 Option: Mann Whitney test Raw data Two-tailed test Attribute COLOUR Answers FROZEN 32 Answers FRESH 31 Number of ties 10 Sum of ranks FROZEN 663 Sum of ranks FRESH 1353 Computed U1 857 Computed U2 135 Significance *** NS: not significant at 5 % ,*: 5 %, **: 1 %, ***: 0,1 % Attribute HEIGHT Answers FROZEN 32 Answers FRESH 32 Number of ties 6 Sum of ranks FROZEN 724
18
Sum of ranks FRESH 1356 Computed U1 828 Computed U2 196 Significance *** NS: not significant at 5 % ,*: 5 %, **: 1 %, ***: 0,1 % Attribute FLAKINESS Answers FROZEN 32 Answers FRESH 30 Number of ties 4 Sum of ranks FROZEN 1066 Sum of ranks FRESH 887 Computed U1 422 Computed U2 538 Significance NS NS: not significant at 5 % ,*: 5 %, **: 1 %, ***: 0,1 % Attribute MOUTHFEEL Answers FROZEN 32 Answers FRESH 32 Number of ties 16 Sum of ranks FROZEN 1148 Sum of ranks FRESH 932 Computed U1 404 Computed U2 620 Significance NS NS: not significant at 5 % ,*: 5 %, **: 1 %, ***: 0,1 % Attribute GREASINESS Answers FROZEN 31 Answers FRESH 32 Number of ties 6 Sum of ranks FROZEN 907 Sum of ranks FRESH 1109 Computed U1 581 Computed U2 411 Significance NS NS: not significant at 5 % ,*: 5 %, **: 1 %, ***: 0,1 % Attribute TASTE Answers FROZEN 32 Answers FRESH 32 Number of ties 2 Sum of ranks FROZEN 1184 Sum of ranks FRESH 896 Computed U1 368 Computed U2 656 Significance NS NS: not significant at 5 % ,*: 5 %, **: 1 %, ***: 0,1 % Attribute OVERALL RATING Answers FROZEN 32 Answers FRESH 32 Number of ties 8 Sum of ranks FROZEN 1121 Sum of ranks FRESH 959 Computed U1 431
19
Computed U2 593 Significance NS NS: not significant at 5 % ,*: 5 %, **: 1 %, ***: 0,1 % BLUEBERRIES5
File: G:\Frozen foods\Blueberries.frp Option: Descriptive statistics Comparison table of means Attribute FRESH FROZENAPPEARANCE 8.25 3.09 COLOUR 7.2 7.56 BERRIES 8.46 5.04 CONSISTENCY 8.34 2.95 TEXTURE 6.99 5.97 ACIDITY 3.98 3.02 SWEETNESS 5.7 3.44 OVERALL RATING 7.31 3.55 File: G:\Frozen foods\Blueberries.frp Profile 1 Option: Mann Whitney test Raw data Two-tailed test Attribute APPEARANCE Answers FRESH 32 Answers FROZEN 32 Number of ties 4 Sum of ranks FRESH 1535 Sum of ranks FROZEN 545 Computed U1 17 Computed U2 1007 Significance *** NS: not significant at 5 % ,*: 5 %, **: 1 %, ***: 0,1 % Attribute COLOUR Answers FRESH 32 Answers FROZEN 32 Number of ties 2 Sum of ranks FRESH 929 Sum of ranks FROZEN 1151 Computed U1 623 Computed U2 401 Significance NS NS: not significant at 5 % ,*: 5 %, **: 1 %, ***: 0,1 %
5 Researchers considered the variant and grade of fresh and frozen fruit supplied was dissimilar
20
Attribute BERRIES Answers FRESH 32 Answers FROZEN 32 Number of ties 11 Sum of ranks FRESH 1429 Sum of ranks FROZEN 651 Computed U1 123 Computed U2 901 Significance *** NS: not significant at 5 % ,*: 5 %, **: 1 %, ***: 0,1 % Attribute CONSISTENCY Answers FRESH 32 Answers FROZEN 32 Number of ties 2 Sum of ranks FRESH 1536 Sum of ranks FROZEN 544 Computed U1 16 Computed U2 1008 Significance *** NS: not significant at 5 % ,*: 5 %, **: 1 %, ***: 0,1 % Attribute TEXTURE Answers FRESH 31 Answers FROZEN 31 Number of ties 4 Sum of ranks FRESH 1087.5Sum of ranks FROZEN 865.5 Computed U1 369.5 Computed U2 591.5 Significance NS NS: not significant at 5 % ,*: 5 %, **: 1 %, ***: 0,1 % Attribute ACIDITY Answers FRESH 32 Answers FROZEN 32 Number of ties 8 Sum of ranks FRESH 1150 Sum of ranks FROZEN 930 Computed U1 402 Computed U2 622 Significance NS NS: not significant at 5 % ,*: 5 %, **: 1 %, ***: 0,1 % Attribute SWEETNESS Answers FRESH 32 Answers FROZEN 32 Number of ties 4 Sum of ranks FRESH 1326 Sum of ranks FROZEN 754 Computed U1 226 Computed U2 798 Significance *** NS: not significant at 5 % ,*: 5 %, **: 1 %, ***: 0,1 % Attribute OVERALL RATING
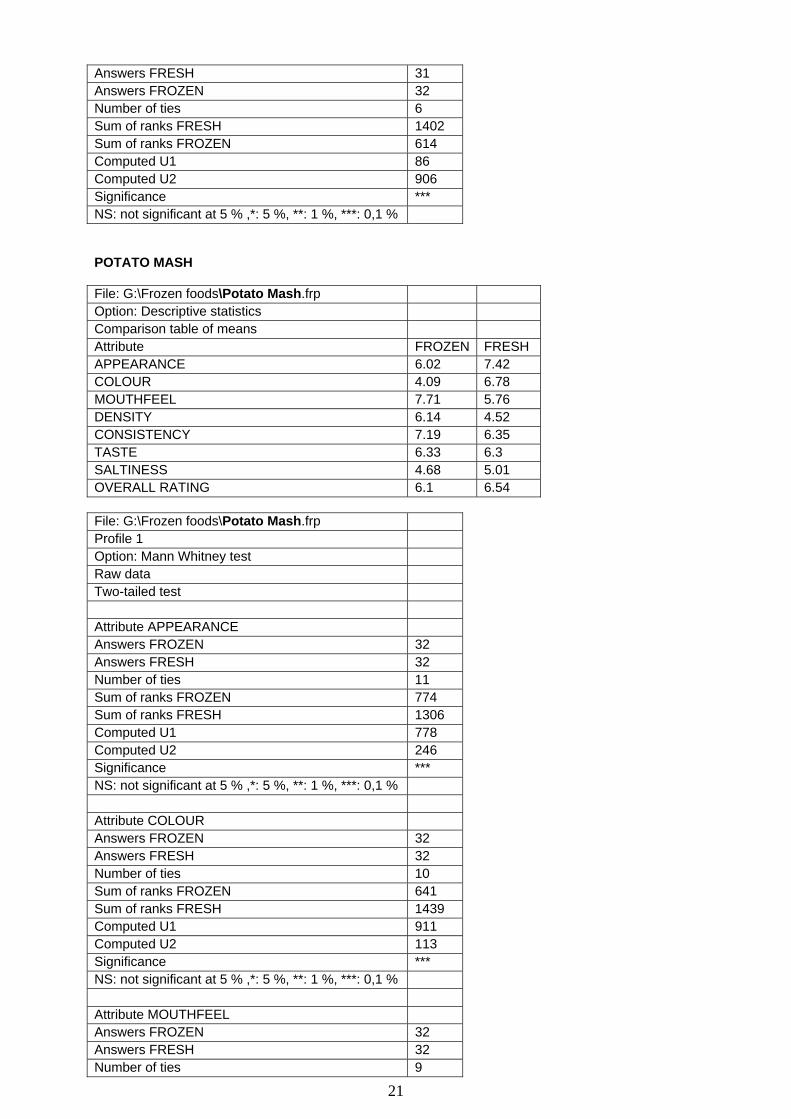
21
Answers FRESH 31 Answers FROZEN 32 Number of ties 6 Sum of ranks FRESH 1402 Sum of ranks FROZEN 614 Computed U1 86 Computed U2 906 Significance *** NS: not significant at 5 % ,*: 5 %, **: 1 %, ***: 0,1 % POTATO MASH File: G:\Frozen foods\Potato Mash.frp Option: Descriptive statistics Comparison table of means Attribute FROZEN FRESH APPEARANCE 6.02 7.42 COLOUR 4.09 6.78 MOUTHFEEL 7.71 5.76 DENSITY 6.14 4.52 CONSISTENCY 7.19 6.35 TASTE 6.33 6.3 SALTINESS 4.68 5.01 OVERALL RATING 6.1 6.54 File: G:\Frozen foods\Potato Mash.frp Profile 1 Option: Mann Whitney test Raw data Two-tailed test Attribute APPEARANCE Answers FROZEN 32 Answers FRESH 32 Number of ties 11 Sum of ranks FROZEN 774 Sum of ranks FRESH 1306 Computed U1 778 Computed U2 246 Significance *** NS: not significant at 5 % ,*: 5 %, **: 1 %, ***: 0,1 % Attribute COLOUR Answers FROZEN 32 Answers FRESH 32 Number of ties 10 Sum of ranks FROZEN 641 Sum of ranks FRESH 1439 Computed U1 911 Computed U2 113 Significance *** NS: not significant at 5 % ,*: 5 %, **: 1 %, ***: 0,1 % Attribute MOUTHFEEL Answers FROZEN 32 Answers FRESH 32 Number of ties 9
22
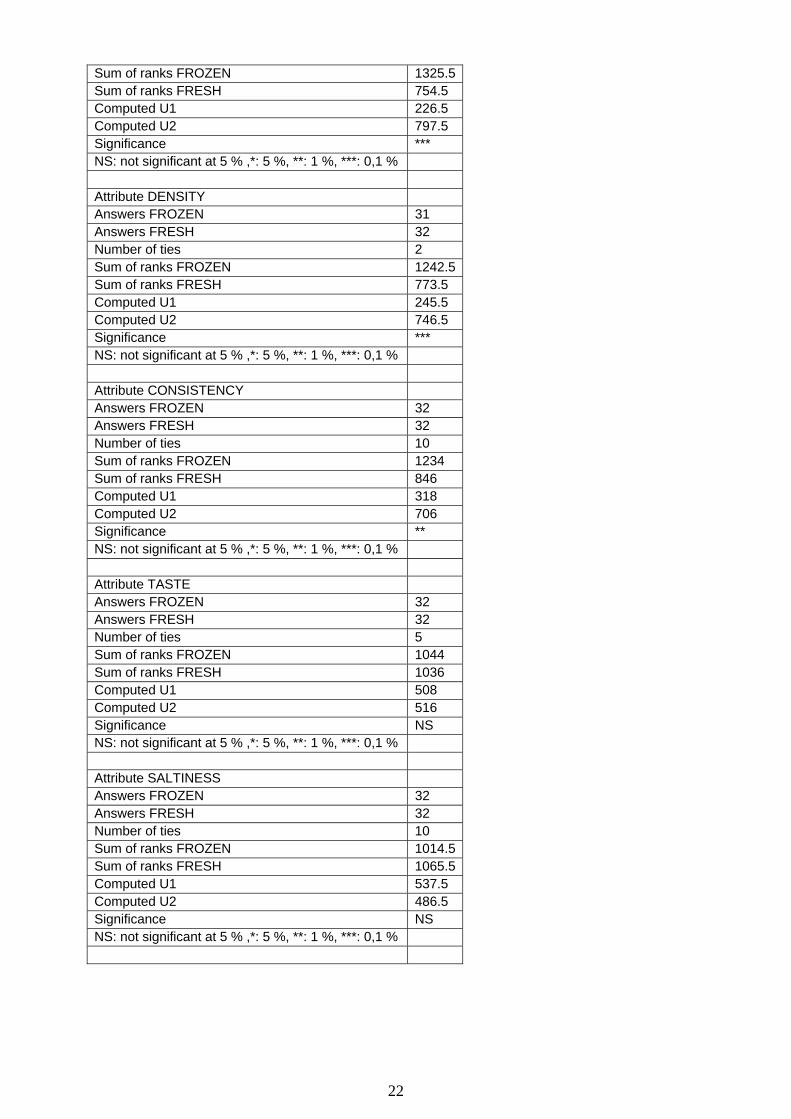
Sum of ranks FROZEN 1325.5Sum of ranks FRESH 754.5 Computed U1 226.5 Computed U2 797.5 Significance *** NS: not significant at 5 % ,*: 5 %, **: 1 %, ***: 0,1 % Attribute DENSITY Answers FROZEN 31 Answers FRESH 32 Number of ties 2 Sum of ranks FROZEN 1242.5Sum of ranks FRESH 773.5 Computed U1 245.5 Computed U2 746.5 Significance *** NS: not significant at 5 % ,*: 5 %, **: 1 %, ***: 0,1 % Attribute CONSISTENCY Answers FROZEN 32 Answers FRESH 32 Number of ties 10 Sum of ranks FROZEN 1234 Sum of ranks FRESH 846 Computed U1 318 Computed U2 706 Significance ** NS: not significant at 5 % ,*: 5 %, **: 1 %, ***: 0,1 % Attribute TASTE Answers FROZEN 32 Answers FRESH 32 Number of ties 5 Sum of ranks FROZEN 1044 Sum of ranks FRESH 1036 Computed U1 508 Computed U2 516 Significance NS NS: not significant at 5 % ,*: 5 %, **: 1 %, ***: 0,1 % Attribute SALTINESS Answers FROZEN 32 Answers FRESH 32 Number of ties 10 Sum of ranks FROZEN 1014.5Sum of ranks FRESH 1065.5Computed U1 537.5 Computed U2 486.5 Significance NS NS: not significant at 5 % ,*: 5 %, **: 1 %, ***: 0,1 %
23
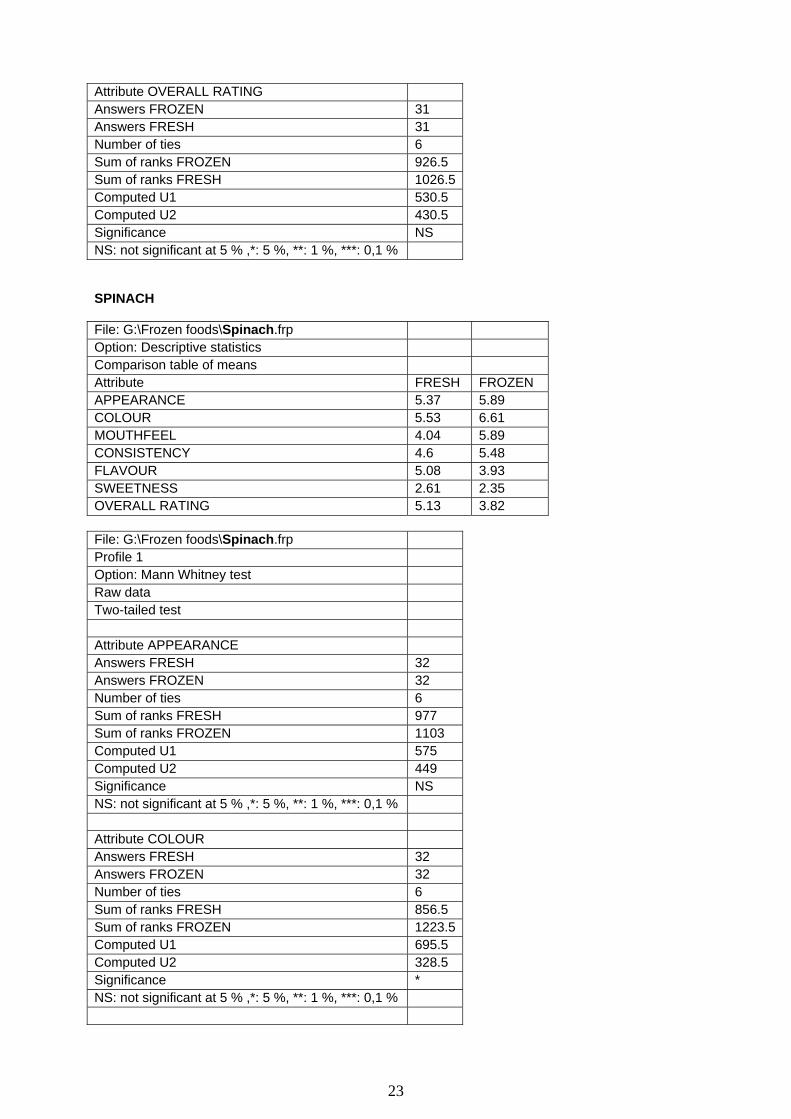
Attribute OVERALL RATING Answers FROZEN 31 Answers FRESH 31 Number of ties 6 Sum of ranks FROZEN 926.5 Sum of ranks FRESH 1026.5Computed U1 530.5 Computed U2 430.5 Significance NS NS: not significant at 5 % ,*: 5 %, **: 1 %, ***: 0,1 % SPINACH File: G:\Frozen foods\Spinach.frp Option: Descriptive statistics Comparison table of means Attribute FRESH FROZEN APPEARANCE 5.37 5.89 COLOUR 5.53 6.61 MOUTHFEEL 4.04 5.89 CONSISTENCY 4.6 5.48 FLAVOUR 5.08 3.93 SWEETNESS 2.61 2.35 OVERALL RATING 5.13 3.82 File: G:\Frozen foods\Spinach.frp Profile 1 Option: Mann Whitney test Raw data Two-tailed test Attribute APPEARANCE Answers FRESH 32 Answers FROZEN 32 Number of ties 6 Sum of ranks FRESH 977 Sum of ranks FROZEN 1103 Computed U1 575 Computed U2 449 Significance NS NS: not significant at 5 % ,*: 5 %, **: 1 %, ***: 0,1 % Attribute COLOUR Answers FRESH 32 Answers FROZEN 32 Number of ties 6 Sum of ranks FRESH 856.5 Sum of ranks FROZEN 1223.5Computed U1 695.5 Computed U2 328.5 Significance * NS: not significant at 5 % ,*: 5 %, **: 1 %, ***: 0,1 %
24
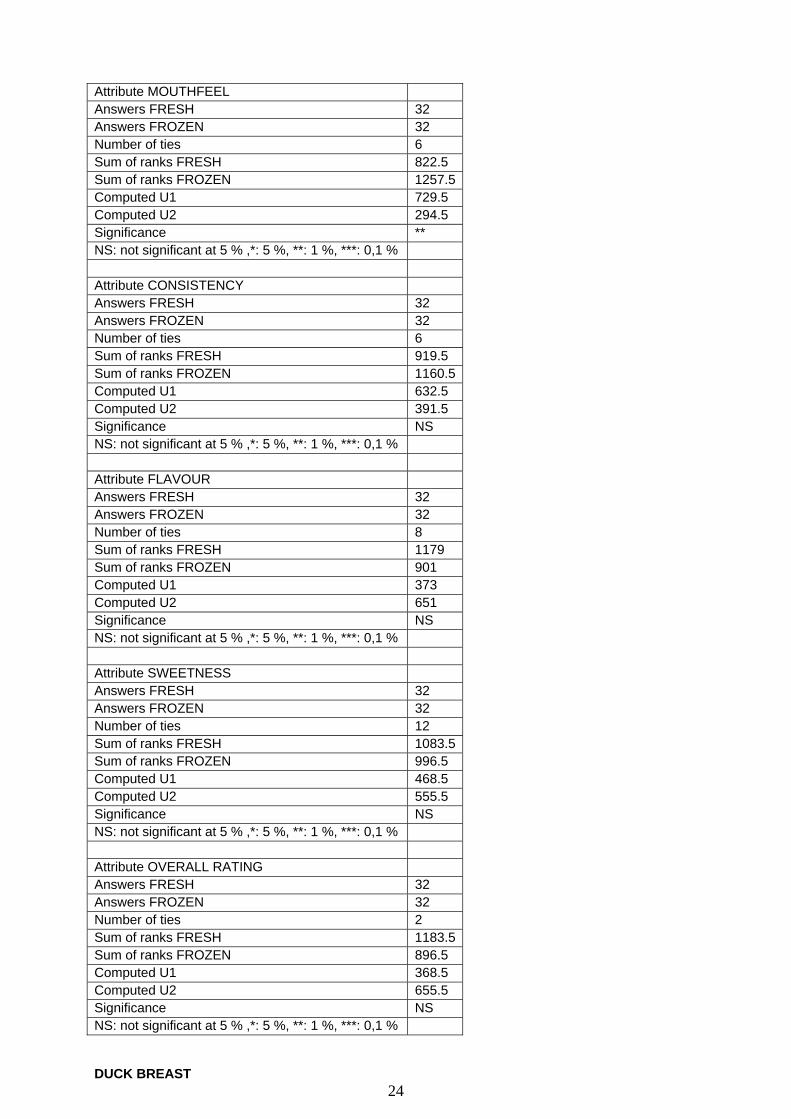
Attribute MOUTHFEEL Answers FRESH 32 Answers FROZEN 32 Number of ties 6 Sum of ranks FRESH 822.5 Sum of ranks FROZEN 1257.5Computed U1 729.5 Computed U2 294.5 Significance ** NS: not significant at 5 % ,*: 5 %, **: 1 %, ***: 0,1 % Attribute CONSISTENCY Answers FRESH 32 Answers FROZEN 32 Number of ties 6 Sum of ranks FRESH 919.5 Sum of ranks FROZEN 1160.5Computed U1 632.5 Computed U2 391.5 Significance NS NS: not significant at 5 % ,*: 5 %, **: 1 %, ***: 0,1 % Attribute FLAVOUR Answers FRESH 32 Answers FROZEN 32 Number of ties 8 Sum of ranks FRESH 1179 Sum of ranks FROZEN 901 Computed U1 373 Computed U2 651 Significance NS NS: not significant at 5 % ,*: 5 %, **: 1 %, ***: 0,1 % Attribute SWEETNESS Answers FRESH 32 Answers FROZEN 32 Number of ties 12 Sum of ranks FRESH 1083.5Sum of ranks FROZEN 996.5 Computed U1 468.5 Computed U2 555.5 Significance NS NS: not significant at 5 % ,*: 5 %, **: 1 %, ***: 0,1 % Attribute OVERALL RATING Answers FRESH 32 Answers FROZEN 32 Number of ties 2 Sum of ranks FRESH 1183.5Sum of ranks FROZEN 896.5 Computed U1 368.5 Computed U2 655.5 Significance NS NS: not significant at 5 % ,*: 5 %, **: 1 %, ***: 0,1 % DUCK BREAST
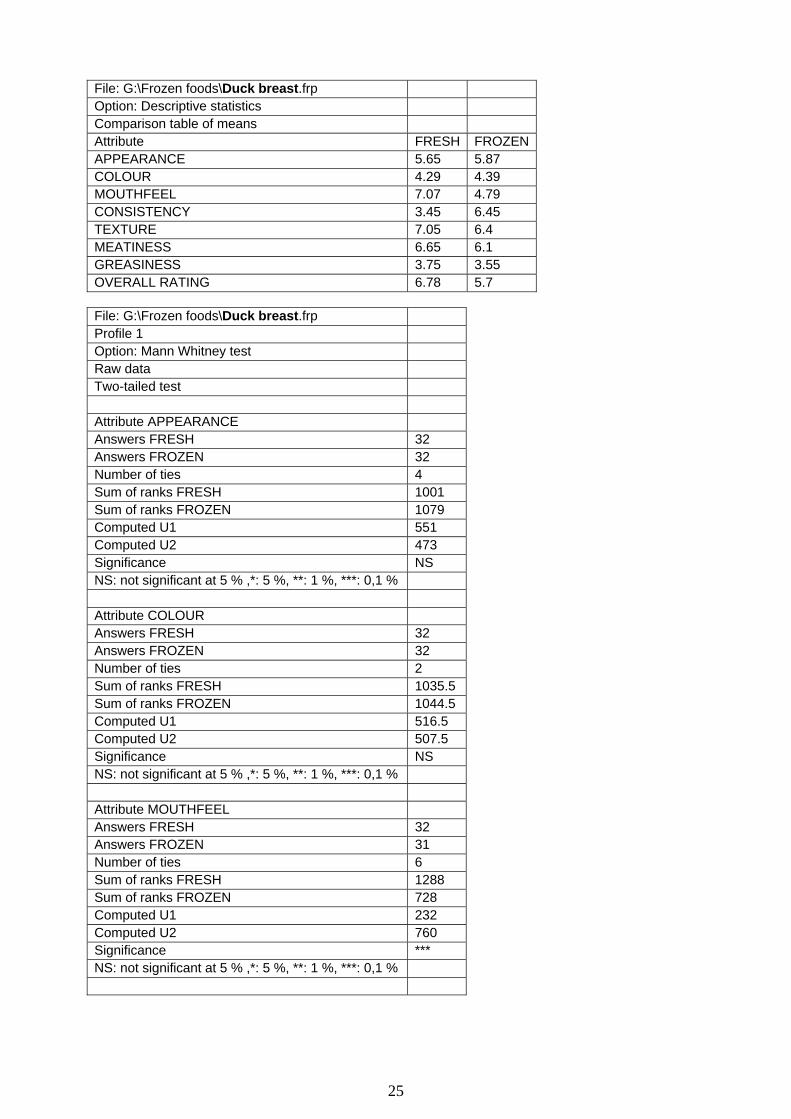
25
File: G:\Frozen foods\Duck breast.frp Option: Descriptive statistics Comparison table of means Attribute FRESH FROZENAPPEARANCE 5.65 5.87 COLOUR 4.29 4.39 MOUTHFEEL 7.07 4.79 CONSISTENCY 3.45 6.45 TEXTURE 7.05 6.4 MEATINESS 6.65 6.1 GREASINESS 3.75 3.55 OVERALL RATING 6.78 5.7 File: G:\Frozen foods\Duck breast.frp Profile 1 Option: Mann Whitney test Raw data Two-tailed test Attribute APPEARANCE Answers FRESH 32 Answers FROZEN 32 Number of ties 4 Sum of ranks FRESH 1001 Sum of ranks FROZEN 1079 Computed U1 551 Computed U2 473 Significance NS NS: not significant at 5 % ,*: 5 %, **: 1 %, ***: 0,1 % Attribute COLOUR Answers FRESH 32 Answers FROZEN 32 Number of ties 2 Sum of ranks FRESH 1035.5 Sum of ranks FROZEN 1044.5 Computed U1 516.5 Computed U2 507.5 Significance NS NS: not significant at 5 % ,*: 5 %, **: 1 %, ***: 0,1 % Attribute MOUTHFEEL Answers FRESH 32 Answers FROZEN 31 Number of ties 6 Sum of ranks FRESH 1288 Sum of ranks FROZEN 728 Computed U1 232 Computed U2 760 Significance *** NS: not significant at 5 % ,*: 5 %, **: 1 %, ***: 0,1 %
26
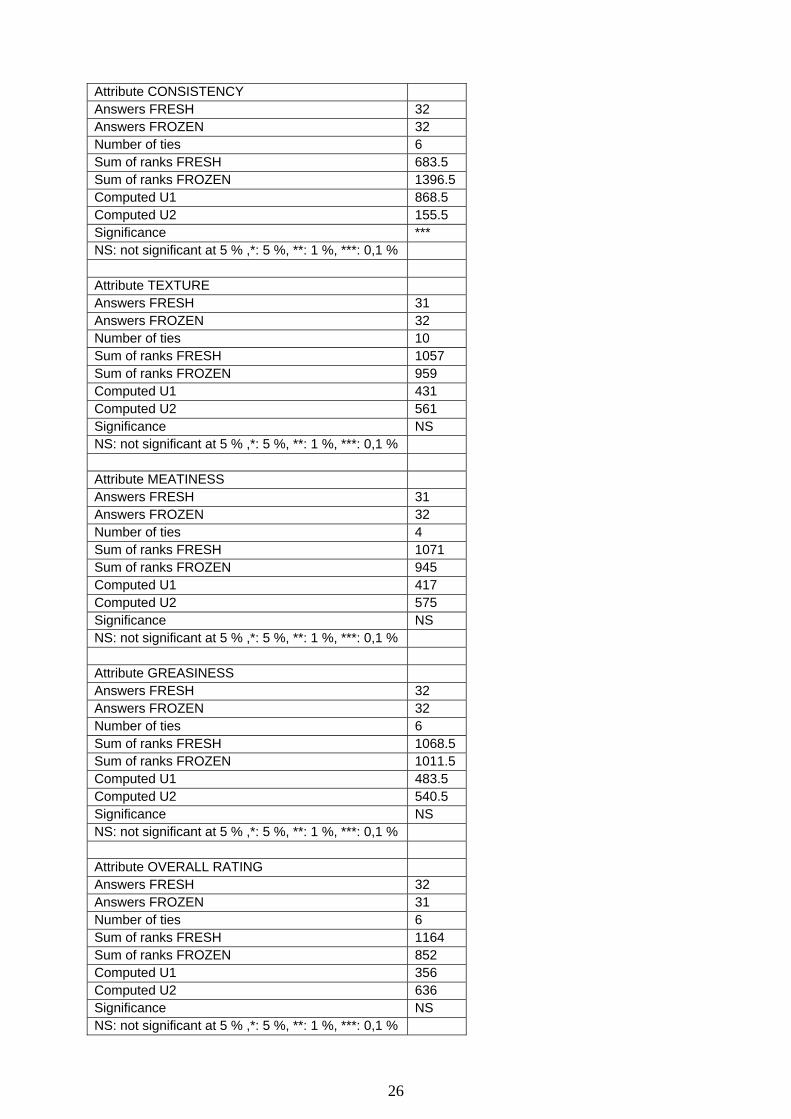
Attribute CONSISTENCY Answers FRESH 32 Answers FROZEN 32 Number of ties 6 Sum of ranks FRESH 683.5 Sum of ranks FROZEN 1396.5 Computed U1 868.5 Computed U2 155.5 Significance *** NS: not significant at 5 % ,*: 5 %, **: 1 %, ***: 0,1 % Attribute TEXTURE Answers FRESH 31 Answers FROZEN 32 Number of ties 10 Sum of ranks FRESH 1057 Sum of ranks FROZEN 959 Computed U1 431 Computed U2 561 Significance NS NS: not significant at 5 % ,*: 5 %, **: 1 %, ***: 0,1 % Attribute MEATINESS Answers FRESH 31 Answers FROZEN 32 Number of ties 4 Sum of ranks FRESH 1071 Sum of ranks FROZEN 945 Computed U1 417 Computed U2 575 Significance NS NS: not significant at 5 % ,*: 5 %, **: 1 %, ***: 0,1 % Attribute GREASINESS Answers FRESH 32 Answers FROZEN 32 Number of ties 6 Sum of ranks FRESH 1068.5 Sum of ranks FROZEN 1011.5 Computed U1 483.5 Computed U2 540.5 Significance NS NS: not significant at 5 % ,*: 5 %, **: 1 %, ***: 0,1 % Attribute OVERALL RATING Answers FRESH 32 Answers FROZEN 31 Number of ties 6 Sum of ranks FRESH 1164 Sum of ranks FROZEN 852 Computed U1 356 Computed U2 636 Significance NS NS: not significant at 5 % ,*: 5 %, **: 1 %, ***: 0,1 %
27
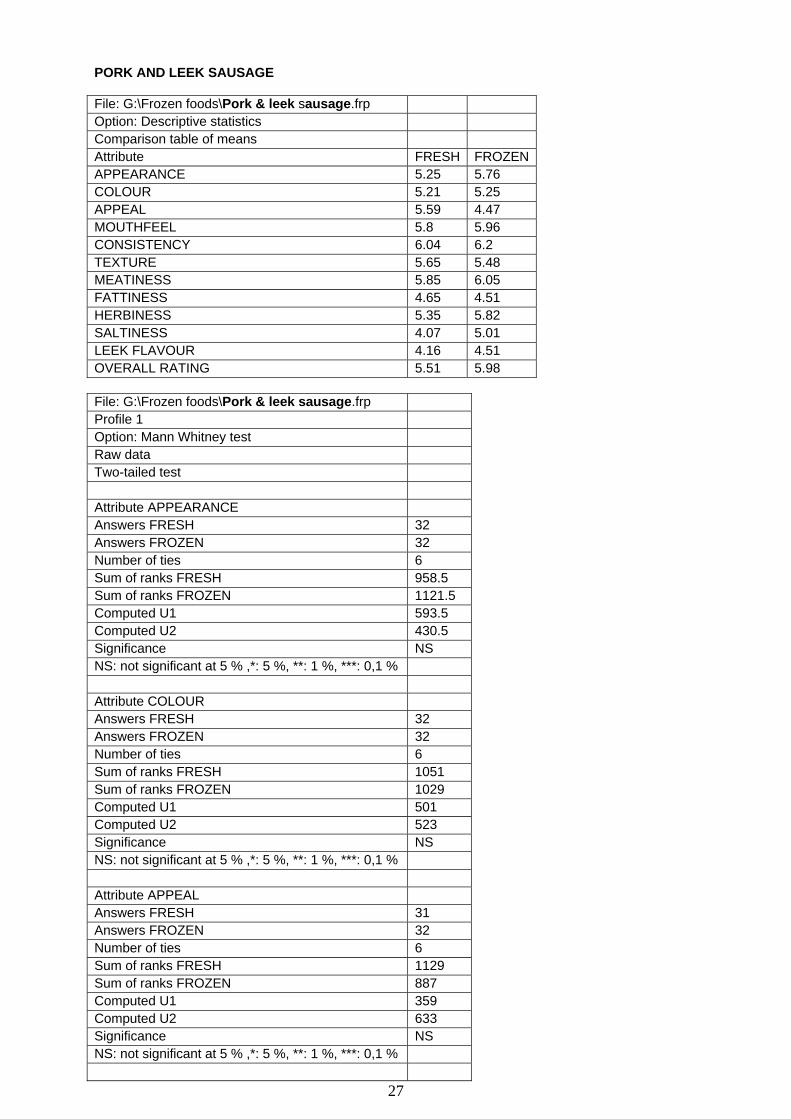
PORK AND LEEK SAUSAGE File: G:\Frozen foods\Pork & leek sausage.frp Option: Descriptive statistics Comparison table of means Attribute FRESH FROZENAPPEARANCE 5.25 5.76 COLOUR 5.21 5.25 APPEAL 5.59 4.47 MOUTHFEEL 5.8 5.96 CONSISTENCY 6.04 6.2 TEXTURE 5.65 5.48 MEATINESS 5.85 6.05 FATTINESS 4.65 4.51 HERBINESS 5.35 5.82 SALTINESS 4.07 5.01 LEEK FLAVOUR 4.16 4.51 OVERALL RATING 5.51 5.98 File: G:\Frozen foods\Pork & leek sausage.frp Profile 1 Option: Mann Whitney test Raw data Two-tailed test Attribute APPEARANCE Answers FRESH 32 Answers FROZEN 32 Number of ties 6 Sum of ranks FRESH 958.5 Sum of ranks FROZEN 1121.5 Computed U1 593.5 Computed U2 430.5 Significance NS NS: not significant at 5 % ,*: 5 %, **: 1 %, ***: 0,1 % Attribute COLOUR Answers FRESH 32 Answers FROZEN 32 Number of ties 6 Sum of ranks FRESH 1051 Sum of ranks FROZEN 1029 Computed U1 501 Computed U2 523 Significance NS NS: not significant at 5 % ,*: 5 %, **: 1 %, ***: 0,1 % Attribute APPEAL Answers FRESH 31 Answers FROZEN 32 Number of ties 6 Sum of ranks FRESH 1129 Sum of ranks FROZEN 887 Computed U1 359 Computed U2 633 Significance NS NS: not significant at 5 % ,*: 5 %, **: 1 %, ***: 0,1 %
28
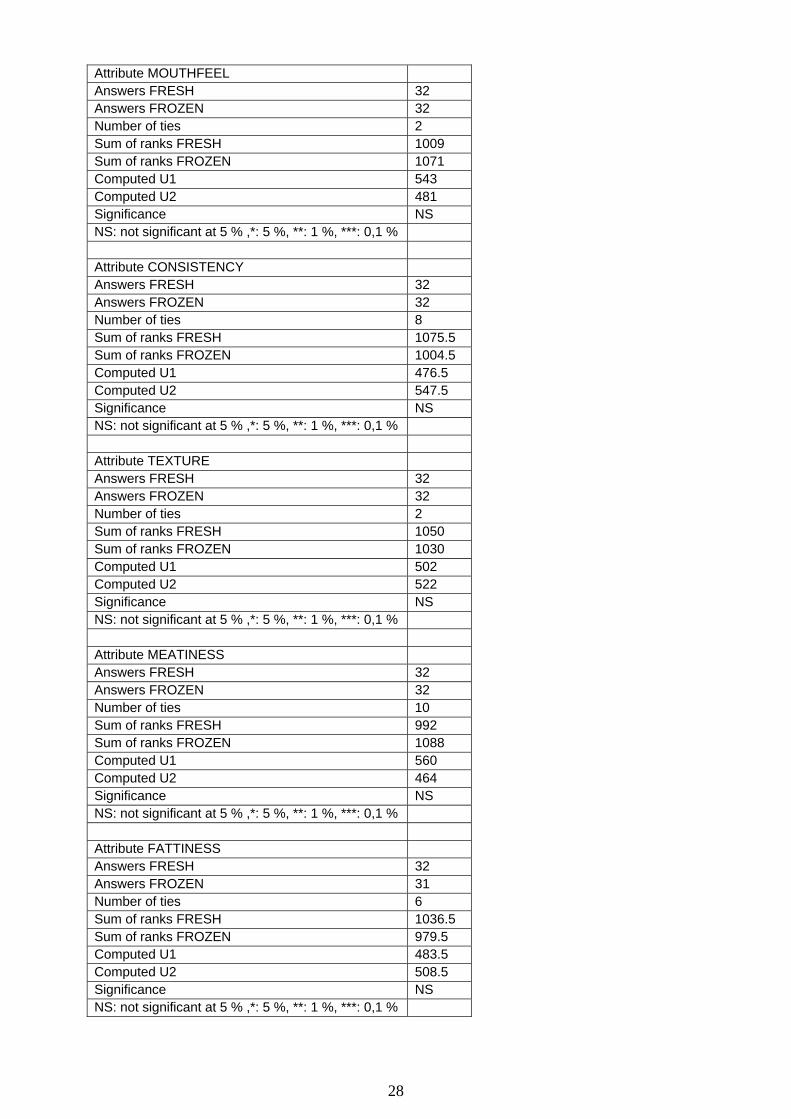
Attribute MOUTHFEEL Answers FRESH 32 Answers FROZEN 32 Number of ties 2 Sum of ranks FRESH 1009 Sum of ranks FROZEN 1071 Computed U1 543 Computed U2 481 Significance NS NS: not significant at 5 % ,*: 5 %, **: 1 %, ***: 0,1 % Attribute CONSISTENCY Answers FRESH 32 Answers FROZEN 32 Number of ties 8 Sum of ranks FRESH 1075.5 Sum of ranks FROZEN 1004.5 Computed U1 476.5 Computed U2 547.5 Significance NS NS: not significant at 5 % ,*: 5 %, **: 1 %, ***: 0,1 % Attribute TEXTURE Answers FRESH 32 Answers FROZEN 32 Number of ties 2 Sum of ranks FRESH 1050 Sum of ranks FROZEN 1030 Computed U1 502 Computed U2 522 Significance NS NS: not significant at 5 % ,*: 5 %, **: 1 %, ***: 0,1 % Attribute MEATINESS Answers FRESH 32 Answers FROZEN 32 Number of ties 10 Sum of ranks FRESH 992 Sum of ranks FROZEN 1088 Computed U1 560 Computed U2 464 Significance NS NS: not significant at 5 % ,*: 5 %, **: 1 %, ***: 0,1 % Attribute FATTINESS Answers FRESH 32 Answers FROZEN 31 Number of ties 6 Sum of ranks FRESH 1036.5 Sum of ranks FROZEN 979.5 Computed U1 483.5 Computed U2 508.5 Significance NS NS: not significant at 5 % ,*: 5 %, **: 1 %, ***: 0,1 %
29
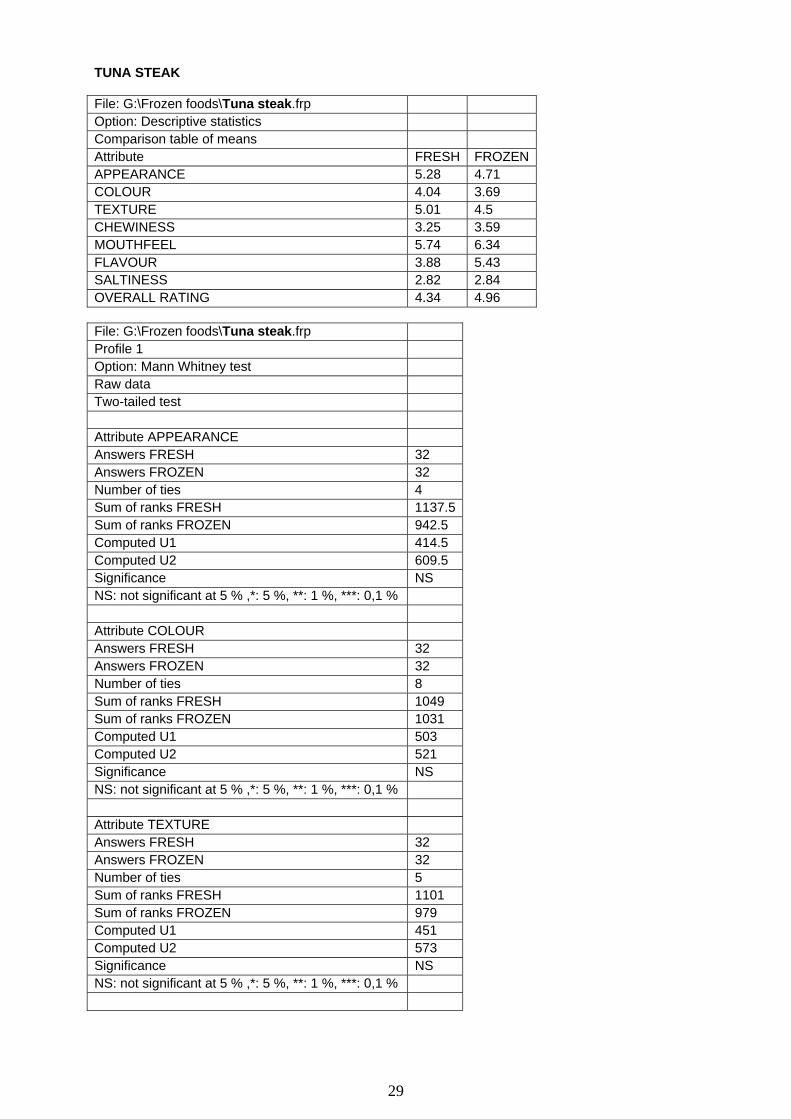
TUNA STEAK File: G:\Frozen foods\Tuna steak.frp Option: Descriptive statistics Comparison table of means Attribute FRESH FROZENAPPEARANCE 5.28 4.71 COLOUR 4.04 3.69 TEXTURE 5.01 4.5 CHEWINESS 3.25 3.59 MOUTHFEEL 5.74 6.34 FLAVOUR 3.88 5.43 SALTINESS 2.82 2.84 OVERALL RATING 4.34 4.96 File: G:\Frozen foods\Tuna steak.frp Profile 1 Option: Mann Whitney test Raw data Two-tailed test Attribute APPEARANCE Answers FRESH 32 Answers FROZEN 32 Number of ties 4 Sum of ranks FRESH 1137.5Sum of ranks FROZEN 942.5 Computed U1 414.5 Computed U2 609.5 Significance NS NS: not significant at 5 % ,*: 5 %, **: 1 %, ***: 0,1 % Attribute COLOUR Answers FRESH 32 Answers FROZEN 32 Number of ties 8 Sum of ranks FRESH 1049 Sum of ranks FROZEN 1031 Computed U1 503 Computed U2 521 Significance NS NS: not significant at 5 % ,*: 5 %, **: 1 %, ***: 0,1 % Attribute TEXTURE Answers FRESH 32 Answers FROZEN 32 Number of ties 5 Sum of ranks FRESH 1101 Sum of ranks FROZEN 979 Computed U1 451 Computed U2 573 Significance NS NS: not significant at 5 % ,*: 5 %, **: 1 %, ***: 0,1 %
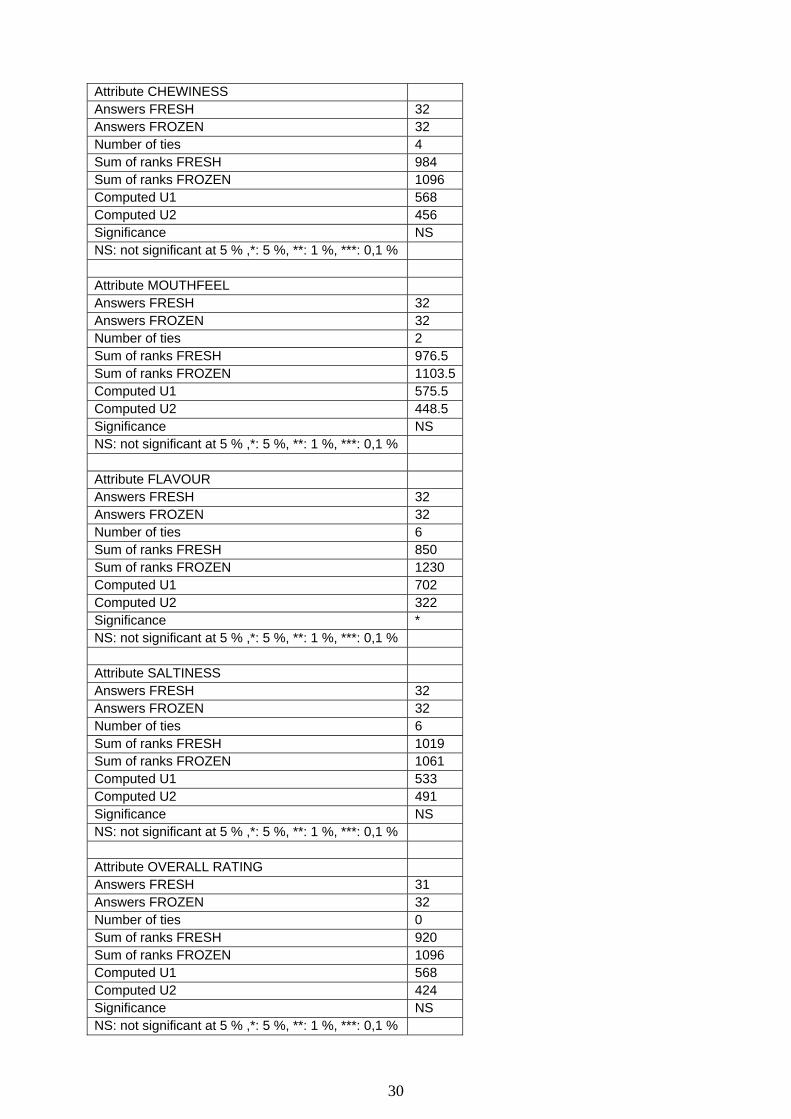
30
Attribute CHEWINESS Answers FRESH 32 Answers FROZEN 32 Number of ties 4 Sum of ranks FRESH 984 Sum of ranks FROZEN 1096 Computed U1 568 Computed U2 456 Significance NS NS: not significant at 5 % ,*: 5 %, **: 1 %, ***: 0,1 % Attribute MOUTHFEEL Answers FRESH 32 Answers FROZEN 32 Number of ties 2 Sum of ranks FRESH 976.5 Sum of ranks FROZEN 1103.5Computed U1 575.5 Computed U2 448.5 Significance NS NS: not significant at 5 % ,*: 5 %, **: 1 %, ***: 0,1 % Attribute FLAVOUR Answers FRESH 32 Answers FROZEN 32 Number of ties 6 Sum of ranks FRESH 850 Sum of ranks FROZEN 1230 Computed U1 702 Computed U2 322 Significance * NS: not significant at 5 % ,*: 5 %, **: 1 %, ***: 0,1 % Attribute SALTINESS Answers FRESH 32 Answers FROZEN 32 Number of ties 6 Sum of ranks FRESH 1019 Sum of ranks FROZEN 1061 Computed U1 533 Computed U2 491 Significance NS NS: not significant at 5 % ,*: 5 %, **: 1 %, ***: 0,1 % Attribute OVERALL RATING Answers FRESH 31 Answers FROZEN 32 Number of ties 0 Sum of ranks FRESH 920 Sum of ranks FROZEN 1096 Computed U1 568 Computed U2 424 Significance NS NS: not significant at 5 % ,*: 5 %, **: 1 %, ***: 0,1 %
31
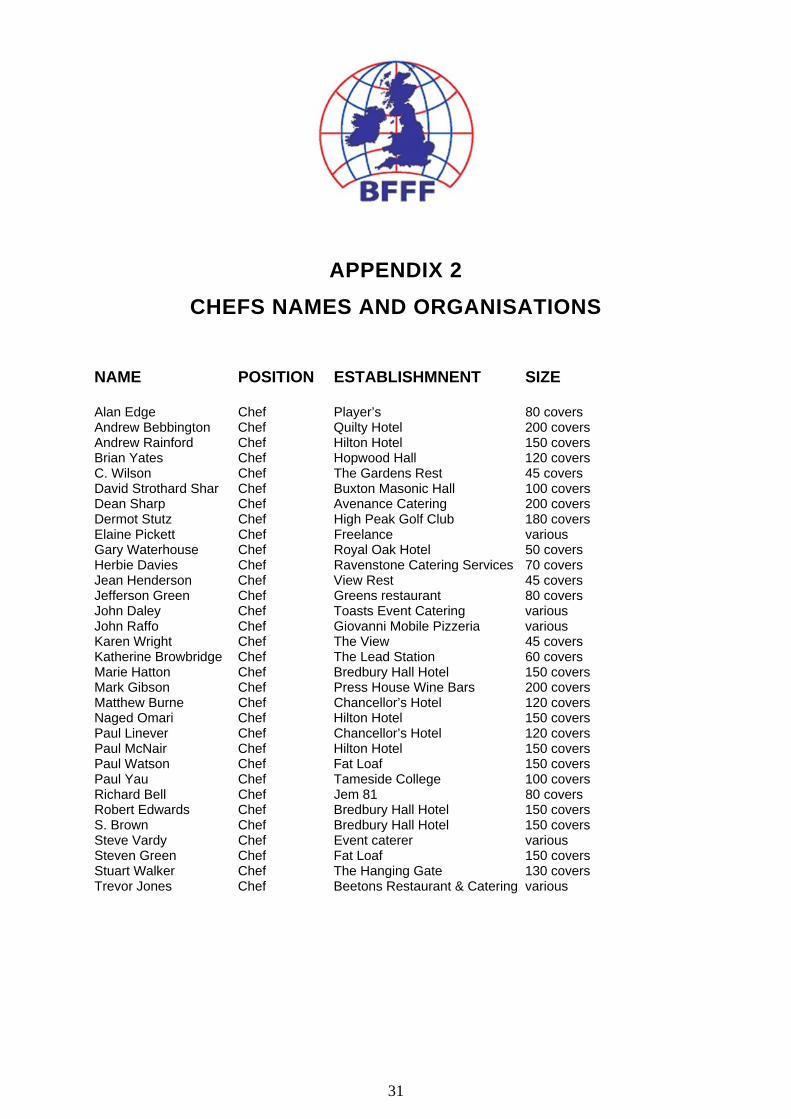
APPENDIX 2 CHEFS NAMES AND ORGANISATIONS
NAME POSITION ESTABLISHMNENT SIZE Alan Edge Chef Player’s 80 covers Andrew Bebbington Chef Quilty Hotel 200 covers Andrew Rainford Chef Hilton Hotel 150 covers Brian Yates Chef Hopwood Hall 120 covers C. Wilson Chef The Gardens Rest 45 covers David Strothard Shar Chef Buxton Masonic Hall 100 covers Dean Sharp Chef Avenance Catering 200 covers Dermot Stutz Chef High Peak Golf Club 180 covers Elaine Pickett Chef Freelance various Gary Waterhouse Chef Royal Oak Hotel 50 covers Herbie Davies Chef Ravenstone Catering Services 70 covers Jean Henderson Chef View Rest 45 covers Jefferson Green Chef Greens restaurant 80 covers John Daley Chef Toasts Event Catering various John Raffo Chef Giovanni Mobile Pizzeria various Karen Wright Chef The View 45 covers Katherine Browbridge Chef The Lead Station 60 covers Marie Hatton Chef Bredbury Hall Hotel 150 covers Mark Gibson Chef Press House Wine Bars 200 covers Matthew Burne Chef Chancellor’s Hotel 120 covers Naged Omari Chef Hilton Hotel 150 covers Paul Linever Chef Chancellor’s Hotel 120 covers Paul McNair Chef Hilton Hotel 150 covers Paul Watson Chef Fat Loaf 150 covers Paul Yau Chef Tameside College 100 covers Richard Bell Chef Jem 81 80 covers Robert Edwards Chef Bredbury Hall Hotel 150 covers S. Brown Chef Bredbury Hall Hotel 150 covers Steve Vardy Chef Event caterer various Steven Green Chef Fat Loaf 150 covers Stuart Walker Chef The Hanging Gate 130 covers Trevor Jones Chef Beetons Restaurant & Catering various