Embed Size (px)
Citation preview

SEMMELWEIS UNIVERSITY, PH.D. DOCTORAL SCHOOL
MOLECULAR MEDICINE
(MULTIDISCIPLINARY MEDICINE)
Leader: Prof. Dr. József Mandl
Ph.D. thesis
written by
Dr. Miklós Sárdy, M.D.
Programme title: Basics of Human Molecular Genetics and Genetic Diagnostics
Programme leader: Prof. Dr. András Falus, Ph.D., Dr. Sc.
Tutor: Prof. Dr. Sarolta Kárpáti, Ph.D., Dr. Sc.

Role of tissue (type 2) transglutaminase in the pathogenesis and diagnosis of coeliac
disease and dermatitis herpetiformis
Dr. Miklós Sárdy
Budapest, 2002.
Programme leader: Prof. Dr. András Falus, Ph.D., Dr. Sc.
Tutor: Prof. Dr. Sarolta Kárpáti, Ph.D., Dr. Sc.
Opponents: Prof. Dr. László Fésüs, Ph.D., Dr. Sc.
Dr. András Arató, Ph.D., Dr. Sc.
Chairman of review committee: Prof. Dr. Zsolt Tulassay, Ph.D., Dr. Sc.
Members of review committee: Dr. László Prónai, Ph.D.
Prof. Dr. Éva Török, Ph.D., Dr. Sc.

3
TABLE OF CONTENTS
Abbreviations.................................................................................................................... 5 1. Összefoglalás ............................................................................................................. 7 1. Summary.................................................................................................................... 8 2. Introduction................................................................................................................ 9
2.1. Definition and history of coeliac disease and dermatitis herpetiformis, the two forms of gluten-sensitive disease................................................................................... 9 2.2. Epidemiology .................................................................................................... 10
2.2.1. Epidemiology of CD................................................................................... 11 2.2.2. Epidemiology of DH................................................................................... 12
2.3. Pathophysiology ................................................................................................ 13 2.3.1. Genetics of GSD......................................................................................... 13
2.3.1.1. The HLA system in general ................................................................. 14 2.3.1.2. The role of HLA system in GSD......................................................... 14
2.3.2. Gluten, the harmful protein complex.......................................................... 15 2.3.3. Transglutaminases ...................................................................................... 15
2.3.3.1. History of transglutaminases................................................................ 15 2.3.3.2. Transglutaminases in general............................................................... 16 2.3.3.3. Features of TGc.................................................................................... 21
2.3.3.3.1. Enzymology, structure, and regulation of TGc ................................. 21 2.3.3.3.2. Distribution, substrates and functions of TGc ................................... 22 2.3.3.3.3. Pathogenic role of TGc in diseases different from GSD................... 24
2.3.4. Pathomechanism of GSD............................................................................ 24 2.4. Symptoms and signs .......................................................................................... 28
2.4.1. Symptoms and signs of CD ........................................................................ 29 2.4.2. Symptoms and signs of DH........................................................................ 29
2.5. Diagnosis ........................................................................................................... 31 2.5.1. Endoscopy................................................................................................... 31 2.5.2. Histological examinations .......................................................................... 31 2.5.3. Serological tests .......................................................................................... 33 2.5.4. Other tests ................................................................................................... 35
3. Aims ......................................................................................................................... 36 4. Methods.................................................................................................................... 37
4.1. The gpTGc study............................................................................................... 37 4.1.1. Sera and patients ......................................................................................... 37 4.1.2. Indirect immunofluorescence (EMA test) .................................................. 38 4.1.3. ELISA......................................................................................................... 39 4.1.4. Inhibition of EMA ...................................................................................... 39 4.1.5. Statistics ...................................................................................................... 39
4.2. The hTGc study................................................................................................. 39 4.2.1. Sera and patients ......................................................................................... 39 4.2.2. Sodium dodecyl sulphate polyacrylamide gel electrophoresis (SDS-PAGE) and immunoblotting ................................................................................................. 40 4.2.3. Recombinant expression of hTGc .............................................................. 40

4
4.2.3.1. Construction of the vector.................................................................... 40 4.2.3.2. Transfection, cell culture and protein purification............................... 41
4.2.4. TGc activity assay....................................................................................... 41 4.2.5. Mass spectrometry...................................................................................... 41 4.2.6. EMA test..................................................................................................... 42 4.2.7. ELISA......................................................................................................... 42 4.2.8. Statistics ...................................................................................................... 42
4.3. The AI study...................................................................................................... 42 4.3.1. Sera and patients ......................................................................................... 42 4.3.2. Total serum IgA measurement, gliadin ELISA and EMA test................... 44 4.3.3. TGc ELISAs ............................................................................................... 44 4.3.4. Statistics ...................................................................................................... 44
5. Results ...................................................................................................................... 45 5.1. The guinea pig TGc study ................................................................................. 45
5.1.1. Guinea pig TGc ELISA .............................................................................. 45 5.1.2. Comparison of the EMA test with the guinea pig TGc ELISA.................. 46 5.1.3. EMA inhibition........................................................................................... 47
5.2. The human TGc study....................................................................................... 47 5.2.1. Recombinant human TGc ........................................................................... 47 5.2.2. Performance of the human TGc ELISA ..................................................... 48 5.2.3. Performance of the guinea pig TGc ELISA............................................... 49 5.2.4. Effects of Ca2+-activation ........................................................................... 50 5.2.5. Comparison of EMA test with TGc ELISA............................................... 50 5.2.6. Comparison of human TGc ELISA with guinea pig TGc ELISA.............. 50
5.3. The autoimmune study...................................................................................... 51 5.3.1. TGc ELISA................................................................................................. 52 5.3.2. Total serum IgA, AGA ELISA and EMA test............................................ 53
6. Discussion................................................................................................................ 55 6.1. Diagnosis of patients and controls..................................................................... 55 6.2. TGc preparations ............................................................................................... 55
6.2.1. Expression of active, recombinant human TGc.......................................... 55 6.2.2. The guinea pig TGc. ................................................................................... 56 6.2.3. Effects of Ca2+-ions .................................................................................... 56
6.3. Sensitivity and specificity.................................................................................. 57 6.3.1. Setting the cutoff values ............................................................................. 57 6.3.2. Sensitivity and specificity........................................................................... 58
6.3.2.1. The guinea pig TGc ELISA study ....................................................... 58 6.3.2.2. The human TGc ELISA study ............................................................. 58 6.3.2.3. The autoimmune study......................................................................... 59
6.4. Relevance of ELISA results .............................................................................. 61 7. Conclusions .............................................................................................................. 63 8. Acknowledgements .................................................................................................. 64 References....................................................................................................................... 67 Own publications ............................................................................................................ 84

5
ABBREVIATIONS
aa......................................................................................................................... amino acid Ab, Abs ................................................................................................. antibody, antibodies AGA...................................................................................................... anti-gliadin antibody ARA.................................................................................................... anti-reticulin antibody AI .......................................................................................................................autoimmune AU.................................................................................................................arbitrary unit(s) AUC ........................................................................................... area under the ROC curves BCa........................................................................................bias-corrected and accelerated BSA..................................................................................................... bovine serum albumin CD................................................................................................................. coeliac disease CMV ........................................................................................................... cytomegalovirus cDNA........................................................................ complementary desoxyribonucleic acid CI .............................................................................................................confidence interval cM............................................................ centimorgan (1 cM=1% recombination frequency) DH.....................................................................................................dermatitis herpetiformis EATL ..................................................................... enteropathy-associated T-cell lymphoma EB4.2 ........................................................................................erythrocyte protein band 4.2 EMA ...................................................................................................endomysium antibody ESPGAN..............................European Society for Paediatric Gastroenterology and Nutrition FXIIIa ................................................................................................... factor XIII a subunit GCH............................................................................................................. gluten challenge GFD .............................................................................................................. gluten-free diet GI ...................................................................................................................gastrointestinal gpTGc ...........................................................................................................guinea pig TGc GSD .......................................................... gluten-sensitive disease (see page 9 for definition) GSE.....................................................gluten-sensitive enteropathy (see page 9 for definition) h ................................................................................................................................hour(s) HLA ..............................................................................................human leukocyte group A hTGc .................................................................................................................. human TGc kb ........................................................................................................................ kilobase(s) kD .....................................................................................................................kilodalton(s) MAb ..................................................................................................... monoclonal antibody min .........................................................................................................................minute(s) MHC ..................................................................................major histocompatibility complex OD.................................................................................................................. optical density PBS ...............................................................................................phosphate-buffered saline PMSF .....................................................................................phenylmethanesulfonyl fluoride RBC ................................................................................................................red blood cell ROC .....................................................................................receiver operating characteristic rS....................................................................................... Spearman’s correlation coefficient SDS-PAGE ................................sodium dodecyl sulphate polyacrylamide gel electrophoresis TBS .........................................................................................................Tris-buffered saline TET ..................................... 50 mM Tris/HCl containing 10 mM EDTA and 0.1% Tween 20

6
TG ............................................................................................................... transglutaminase TGc .......................................................................... tissue (cellular, type 2) transglutaminase TGc-/- ...............................................TGc knockout (homozygote for a disrupted TGc gene) TGe ................................................................................ epidermal (type 3) transglutaminase TGe-/- ...............................................TGe knockout (homozygote for a disrupted TGe gene) TGF-â ....................................................................................... transforming growth factor â TGk .............................................................................keratinocyte (type 1) transglutaminase TGp ...................................................................................prostate (type 4) transglutaminase TGx............................................................................................ transglutaminase X (type 5) TGy............................................................................................ transglutaminase Y (type 6) TGz .............................................................................................transglutaminase Z (type 7)

7
1. ÖSSZEFOGLALÁS
A szöveti (2-es típusú) transzglutamináz szerepe a coeliakia és a dermatitis herpetiformis pathogenesisében és diagnosztikájában
Dr. Sárdy Miklós
Programvezetõ: Dr. Falus András, egyetemi tanár, Ph.D., Dr. Sc.
az MTA levelezõ tagja Témavezetõ: Dr. Kárpáti Sarolta, egyetemi tanár, Ph.D., Dr. Sc.
Semmelweis Egyetem, Doktori Iskola A humán molekuláris genetika és géndiagnosztika alapjai
Budapest, 2002. Bevezetés. Néhány évvel ezelõtt a szöveti (2-es típusú) transzglutaminázt (TGc) coe-
liakiában (CD) és dermatitis herpetiformisban (DH) szenvedõ betegek keringõ IgA el-lenanyagainak, az ún. endomysium ellenanyagok fõ autoantigénjeként azonosították. Ezen ellenanyagok kimutatására egy tengerimalac TGc-n alapuló ELISA tesztet is kifej-lesztettek. Célunk az volt, hogy igazoljuk e vizsgálati módszer jelentõségét a CD és a DH diagnosztikájában, a szûrésben és a betegek követésében. Az eredeti ELISA-t to-vábbfejlesztettük humán rekombináns antigén használatával, és összehasonlítottuk már létezõ szerológiai tesztekkel (tengerimalac TGc ELISA és endomysium antitest teszt). Vizsgáltuk ezen kívül a módszer specificitását valamint az ellenanyagok esetleges elõ-fordulását más betegségekben is.
Módszerek. Az egészséges kontrolloktól valamint coeliakiában vagy dermatitis her-petiformisban szenvedõ betegektõl származó savók mellett olyan betegek szérumát is teszteltük, akik más (elsõsorban autoimmun vagy egyéb gastrointestinalis) rendel-lenességekben szenvedtek. A keringõ IgA autoantitestek kimutatására olyan ELISA-t készítettünk, melyhez májból kivont tengerimalac- és rekombinánsan elõállított humán TGc-t használtunk kálcium-aktivált formában. Az endomysium-ellenes IgA antitesteket majom nyelõcsövön végzett indirekt immunfluoreszcenciával detektáltuk.
Eredmények. A humán TGc-t tiszta és aktív enzimként állítottuk elõ. Egészséges személyekkel összehasonlítva mind a tengerimalac, mind a humán TGc alapú ELISA specificitása és szenzitivitása magas volt kezeletlen CD-s és DH-s betegekben. Jelentõs számú autoimmun beteg széruma is pozitív reakciót adott, noha glutén szenzitív entero-pathiára utaló tüneteket e betegeknél nem észleltünk, és az endomysium antitest vizs-gálat valamennyiüknél negatív eredménnyel zárult.
Következtetések. A TGc ELISA teszt alkalmas a glutén szenzitív enteropathia egys-zerû és noninvazív diagnózisára, szûrésére és a betegek kontroll vizsgálatára. A humán TGc ELISA valamivel jobb eredményeket mutatott, mint a tengerimalac TGc ELISA, és egészséges kontrollokkal összehasonlítva ugyanolyan specifikusnak és szenzitívnek bizonyult, mint az endomysium antitest teszt. Azonban TGc ELISA pozitivitás más betegségekben is elõfordulhat, így pl. egyes autoimmun betegségek fennállása esetén önmagában nem diagnosztikus értékû.

8
1. SUMMARY
Role of tissue (type 2) transglutaminase in the pathogenesis and diagnosis of coeliac disease and dermatitis herpetiformis
Dr. Miklós Sárdy, M.D.
Programme leader: Prof. Dr. András Falus, Ph.D., Dr. Sc. corresponding member of the Hungarian Academy of Sciences
Tutor: Prof. Dr. Sarolta Kárpáti, Ph.D., Dr. Sc.
Semmelweis University, Ph.D. Doctoral School Basics of Human Molecular Genetics and Genetic Diagnostics
Budapest, 2002. Introduction. Tissue (type 2) transglutaminase (TGc) has been identified as the tar-
get autoantigen of circulating, anti-endomysial IgA antibodies in coeliac disease (CD) and dermatitis herpetiformis (DH). An ELISA test based on the guinea pig TGc had been developed to detect these antibodies. To confirm the significance of this method in the diagnosis of CD and DH, we developed and validated an ELISA based on the hu-man recombinant antigen and compared it to existing serological tests for CD and DH (guinea pig TGc ELISA and endomysium antibody test). Furthermore, to test the speci-ficity of our ELISA and discover a possible wider autoantigenic role of TGc, also sera from patients with other disorders were also analysed.
Methods. Serum samples from healthy controls, patients with CD and DH, as well as sera from patients with other autoimmune or gastrointestinal disorders were investi-gated. ELISA assays for IgA antibodies against TGc using calcium-activated guinea pig liver and human recombinant TGc were performed. The sera were also tested for IgA endomysium antibodies using indirect immunofluorescence.
Results. The human TGc was expressed and purified as an active enzyme. When compared to healthy controls, the specificity and sensitivity were high for the diagnosis of untreated CD and DH in both the guinea pig and the human TGc ELISA systems. However, a considerable number of sera from patients with autoimmune disorders also showed positivity, though no association of these conditions with gluten sensitive en-teropathy was apparent.
Conclusions. The TGc ELISA is suitable for use as a simple, noninvasive method for diagnosis, screening and follow-up of GSD. The human TGc ELISA was found to be somewhat superior to the guinea pig TGc ELISA, and as specific and sensitive as the endomysium antibody test when compared to healthy individuals. However, TGc ELISA positivity also occurred in patients with other disorders. Thus the presence of such antibodies should not be taken alone as a basis for the diagnosis of gluten-sensitive enteropathy.

9
2. INTRODUCTION
2.1. Definition and history of coeliac disease and dermatitis herpeti-formis, the two forms of gluten-sensitive disease
Coeliac disease (CD; also known as nontropical sprue, gluten-sensitive enteropathy, or coeliac sprue) is a common chronic small bowel mucosal disorder associated with a persistent intolerance to gluten as well as concomitant immune and autoimmune (AI) phenomena (283, 182). Changes in CD are, however, not confined to the small intestine (2.4.1). Thus today a few scientists believe that it is primarily a systemic AI disease with frequent intestinal and infrequent (rarely diagnosed?) extraintestinal manifesta-tions. In a few individuals, CD is associated with dermatitis herpetiformis (DH; also known as Duhring’s disease or Duhring-Brocq’s disease), a bullous, AI skin disease. It is characterised by polymorphic eruptions preferentially located over the extensor sur-faces of the major joints with underlying granular IgA deposits occurring in the papil-lary dermis (96). As CD and DH share a very similar jejunal pathology, identical ge-netic background, similar pathomechanism, as well as common diagnostic analysis and dietary possibilities for therapy (96), the term ‘gluten-sensitive disease’ (GSD) for these conditions will be applied. For description of enteropathy in these two illnesses, the term ‘gluten-sensitive enteropathy’ (GSE) will be used.
The first report resembling CD originates from Aretaeus from Cappadochia in the II. century A.D. (266). Samuel Gee produced a classical description of CD over a century ago (102). However, he beleived it was a disease of the coecum and hence its name. The term ‘sprue’ derives from the Flemish word ‘sprouw’ meaning ‘aphthous lesion’ (140). An effective treatment for CD (with a diet containing exclusively meat and ba-nanas or milk, fruits and vegetables) based on the incorrect belief that it was an intoler-ance to starch was described in the 1920s (114). However, it was not until 1932 that the Dutch paediatrician, Dicke, discovered its association with the consumption of certain cereals, later identifying gluten as the causative factor (68). Later studies showed the subtotal villous atrophy characteristic of CD (237) resolved following withdrawal of gluten from the diet (12). The small intestinal pathology showed that CD is identical condition both in children and in adults (234). Today it is known that both CD and DH are evoked and maintained by an abnormal small intestinal mucosa associated with a persistent intolerance to gluten, the adhesive mass of water-insoluble proteins of wheat, and other related cereal proteins present in rye, barley and probably oats, but not in rice and maize (68, 289). Removal of these from the diet leads to a full clinical and histo-logical remission. Beside the immune response against cereal proteins, AI events play a significant role in the pathomechanism. Three types of tissue autoantibodies have been described in GSD. Seah et al., 1971, detected tissue autoantibodies (IgG, IgM, and in a few cases IgA) in both CD and DH by indirect immunofluoresence using rat tissues, as well as human thyroid gland and jejunum. These were called ‘reticulin’ antibodies (Abs) as their staining pattern resembled that seen by silver staining of reticular fibres (248, 249). In 1983, Chorzelski et al. reported the association between GSD and circu-lating IgA anti-endomysial Abs (EMA; 48). Kárpáti et al. described in 1986 the exis-tence of specific IgA anti-jejunal Abs by indirect immunofluorescence (152), and as-
10
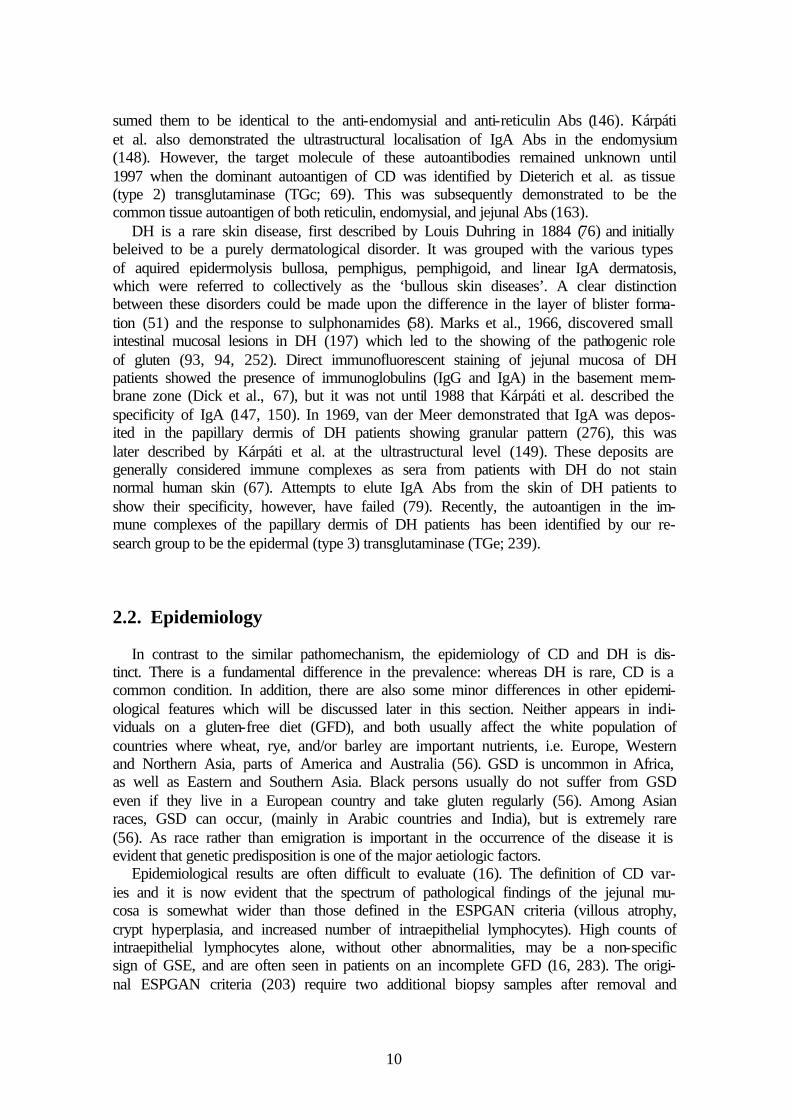
sumed them to be identical to the anti-endomysial and anti-reticulin Abs (146). Kárpáti et al. also demonstrated the ultrastructural localisation of IgA Abs in the endomysium (148). However, the target molecule of these autoantibodies remained unknown until 1997 when the dominant autoantigen of CD was identified by Dieterich et al. as tissue (type 2) transglutaminase (TGc; 69). This was subsequently demonstrated to be the common tissue autoantigen of both reticulin, endomysial, and jejunal Abs (163).
DH is a rare skin disease, first described by Louis Duhring in 1884 (76) and initially beleived to be a purely dermatological disorder. It was grouped with the various types of aquired epidermolysis bullosa, pemphigus, pemphigoid, and linear IgA dermatosis, which were referred to collectively as the ‘bullous skin diseases’. A clear distinction between these disorders could be made upon the difference in the layer of blister forma-tion (51) and the response to sulphonamides (58). Marks et al., 1966, discovered small intestinal mucosal lesions in DH (197) which led to the showing of the pathogenic role of gluten (93, 94, 252). Direct immunofluorescent staining of jejunal mucosa of DH patients showed the presence of immunoglobulins (IgG and IgA) in the basement mem-brane zone (Dick et al., 67), but it was not until 1988 that Kárpáti et al. described the specificity of IgA (147, 150). In 1969, van der Meer demonstrated that IgA was depos-ited in the papillary dermis of DH patients showing granular pattern (276), this was later described by Kárpáti et al. at the ultrastructural level (149). These deposits are generally considered immune complexes as sera from patients with DH do not stain normal human skin (67). Attempts to elute IgA Abs from the skin of DH patients to show their specificity, however, have failed (79). Recently, the autoantigen in the im-mune complexes of the papillary dermis of DH patients has been identified by our re-search group to be the epidermal (type 3) transglutaminase (TGe; 239).
2.2. Epidemiology
In contrast to the similar pathomechanism, the epidemiology of CD and DH is dis-tinct. There is a fundamental difference in the prevalence: whereas DH is rare, CD is a common condition. In addition, there are also some minor differences in other epidemi-ological features which will be discussed later in this section. Neither appears in indi-viduals on a gluten-free diet (GFD), and both usually affect the white population of countries where wheat, rye, and/or barley are important nutrients, i.e. Europe, Western and Northern Asia, parts of America and Australia (56). GSD is uncommon in Africa, as well as Eastern and Southern Asia. Black persons usually do not suffer from GSD even if they live in a European country and take gluten regularly (56). Among Asian races, GSD can occur, (mainly in Arabic countries and India), but is extremely rare (56). As race rather than emigration is important in the occurrence of the disease it is evident that genetic predisposition is one of the major aetiologic factors.
Epidemiological results are often difficult to evaluate (16). The definition of CD var-ies and it is now evident that the spectrum of pathological findings of the jejunal mu-cosa is somewhat wider than those defined in the ESPGAN criteria (villous atrophy, crypt hyperplasia, and increased number of intraepithelial lymphocytes). High counts of intraepithelial lymphocytes alone, without other abnormalities, may be a non-specific sign of GSE, and are often seen in patients on an incomplete GFD (16, 283). The origi-nal ESPGAN criteria (203) require two additional biopsy samples after removal and
11
reintroduction of gluten into the diet, the revised criteria require the third biopsy only where the diagnosis is uncertain (283). These criteria, although widely accepted as be-ing absolutely correct, are often not fulfilled in practice. A single biopsy showing typi-cal changes together with positive serological findings is often taken as sufficient for the diagnosis.
As well as the differences in criteria set for GSD diagnosis, the large variations be-tween study results in areas of the same country or neighbouring countries might be due to genetic, cultural, or alimentary diversity. In addition, there are also frequency varia-tions detectable in the same area for different periods of sampling.
2.2.1. Epidemiology of CD
Due to the difficulty in dating the onset of CD (see below), it is more informative to calculate the prevalence or the cumulative incidence of the disease than the incidence itself. The frequency data changed dramatically in the last decade. About 15-20 years ago, the reported cumulative incidence rate of coeliac disease in Europe was widely different ranging between 1:400-1:12800 births, (Sweden and Greece, respectively), a 32-fold difference between the highest and lowest rates with an average rate of 1:1000 (108). This difference might be due to the diverse genetic backgrounds, the differing amounts of gluten consumed, or the time point of first gluten exposure (24, 167, 284). In Hungary, the cumulative incidence rate between 1970 and 1985 of children with CD was 1:3941 (27). In 1987, 556 children with manifest CD (proven with three biopsies) were enregistered in Hungary (166). In a region of Hungary, the prevalence reached 1:650 (260).
With the development of sensitive screening tests for CD allowing detection of silent or atypical CD, the reported prevalence rates reached 1:100-1:300 in many European countries (108, 161). In Hungary, a recent study showed a prevalence rate of 1:85 among children between 3-6 years (161).
The largest, multicentre and nationwide study was performed during 1993-95 in Italy on 17201 students aged 6-15 years. Here, the anti-gliadin Ab (AGA) screening test was used as the first step, followed up by EMA testing (44). An unexpectedly high preva-lence (1:184) was found, and most significantly the ratio of known to undiagnosed CD cases was 1:7. Italian epidemiologists designated this situation as the ‘coeliac iceberg’ (Fig. 1).
CD can manifest at any age but the majority of patients having symptomatic disease are diagnosed in the early childhood (mainly during the first two years of life, usually before 6 years of age) (108, 182 and references therein). In the last decades, a trend of increased number of patients diagnosed with CD at the age of 10 or later could be ob-served (108). Either CD is delaying its appearance to later ages over Europe, or the screening tests allow the diagnosis of adults with atypical, silent or latent disease. In Hungary, also an elevation of age at diagnosis could be observed. In 1975-77, the mean age at diagnosis was approximately 1.5 years, whereas in 1987-89 it reached 5 years (27).
The sex frequency is nearly equal in early childhood while in adults the female:male ratio is 2:1 (182, 128). Speculatively, CD may be more frequently undiagnosed in males, possibly because of pregnancy precipitating clinical disease (258). In Hungary, between 1963-1987, the female:male ratio of registered paediatric CD patients was 1.46 (445 girls and 304 boys) (Kósnai I, personal communication). In and near the capital

12
(Budapest and Pest county), the ratio was somewhat higher, 1.57 (girls:boys=137:87) (Kósnai I, personal communication).
Fig. 1. The coeliac iceberg in Italy (44). Among the 17201 students examined in the study, 101 had CD but only 12 had been clinically diagnosed constituting the ‘emerging part of the ice-berg’. The other 89 cases were found by serological screening. Nine cases (‘misdiagnosis group’) had received a clinical diagnosis of gluten intolerance during infancy based on malab-sorption symptoms. They had been treated with a GFD for a period of time and then a normal diet had been reintroduced. Patients with atypical CD had symptoms and signs which were not attributed to CD, e.g. monosymptomatic cases, extraintestinal, or unspecific symptoms. The latter two groups build a considerable number of patients with CD where in spite of the pres-ence of clinical symptoms the disease is not diagnosed. Patients labelled with ‘silent’ CD are practically symptomfree, but a small intestinal histology (and serological tests) can show overt GSE. Patients having latent CD show apparently normal small intestinal architecture when ex-amined with traditional histological methods, but they show positivity with other specific tests (positive EMA test on monkey oesophagus, increased ã/ä+ intraepithelial T-lymphocyte counts, and/or jejunal IgA deposits).
2.2.2. Epidemiology of DH There have been only a few studies on the frequency of DH. Like CD, it is most
common in Northern Europe. Prevalences for DH per 100,000 habitants range between 19.6-39.2 in Sweden (204, 206, 49), and are 11.4 and 11.5 in Finland and Edinburgh, respectively (231, 101). The incidence rate of DH in Sweden and Finland has been de-scribed as 1.05-1.45 and 1.3 among 100,000 people, respectively (204, 206, 49, 231). The frequency of DH in Hungary has not been investigated.
12 diagnosed
9 misdiagnosed
40 atypical
33 silent
7 latent
13
In contrast to CD, DH most commonly manifests in late adolescence and early adult life (15-40 years) (204, 206, 49, 231, 101). However, it may also present in infants and very old people. In most reported cases, DH is rare in childhood except for two coun-tries, Italy and Hungary (96, 165, 230). In contrast to CD, the age at the manifestation of DH is not related to the amounts or the time point of first introduction of gluten (167, 230). Being a rare and very polymorphic disease of remitting-relapsing nature often presenting with symptoms other than blisters, DH might be underdiagnosed in certain areas, but the difference in age cannot be contributed to diagnostic unawareness of pe-diatric dermatologists in the Northern European countries.
Overall, the male:female ratio in DH is 3:2, but females predominate under 20 years of age (male:female=2:3; Ref. 96). In Hungary, the sex ratio of DH children is ap-proximately 1:2 (male:female; Refs. 145, 167).
2.3. Pathophysiology
The multifactorial causes of GSD are discussed below.
2.3.1. Genetics of GSD GSD is a condition in which the ingestion of gluten is not tolerated. However, the
disorder occurs only in a susceptible population showing genetic factors are important. McDonald et al. suggested that CD reflected an autosomal dominant inheritance with incomplete penetrance (201). However, later studies suggested a purely recessive in-heritance (111). It is now known that both HLA and non-HLA genes together with glu-ten and presumably additional environmental agents are involved in disease develop-ment. Diseases where particular HLA allels are overrepresented (e.g. type I diabetes mellitus and rheumatoid arthritis) are usually multifactorial and of a chronic nature (268). However, CD is unique in being strictly dependent on a well characterised envi-ronmental factor, the gluten ingestion.
Monozygotic twins with CD show a high concordance rate (70%) again suggesting strong genetic aetiology, further a high prevalence rate among first degree relatives of CD patients (10%) and among HLA-identical siblings (40%) also supports genetic in-fluence (for review see 255, 72, and references therein). However, even though the overall importance of non-HLA genes appears to be greater than that of HLA genes, attempts to map predisposing genes by linkage analysis have failed to find frequently and obviously involved candidates. Recently, certain chromosome regions were sug-gested to be involved in the genetic difference between CD and DH (124). The cyto-toxic T-lymphocyte associated gene 4 (CTLA-4, see Refs. 73 and 255) in the 2q33 chromosome region was suggested as an important non-HLA gene. However, investiga-tions in more than 1000 affected families showed that other genes within this region (CD28 and the inducible costimulator ICOS, both being involved in the regulation of T-cell response) might be better candidates (Clerget-Darpoux F et al., oral communica-tion). The strong linkage disequilibrium between these genes makes it difficult to find any primary susceptibility gene. However, there is evidence that at least one of the non-HLA risk factors is located in the 5q31-33 chromosome region, but the responsible gene(s) could not yet be identified. It is likely that each non-HLA gene has only minor

14
influence in altering the prediposition to GSD, which could explain the difficulty in delineating the genetic components.
2.3.1.1.The HLA system in general
The HLA system (reviewed in 36) consists of a complex gene series at several closely linked loci collectively called the ‘major histocompatibility complex’ (MHC). It is one of the most polymorphic genetic systems in mammals. HLA genes play impor-tant role in the immune system, including the immunopathology of certain diseases, and in allotransplantation rejection reactions. These genes are located on the short arm of chromosome 6 in a relatively short (3 cM, ~3400 kb) region together with some genes unrelated to known immunological functions, whereas not all genes involved in the regulation of immune response are located in this region (36). The glycoproteins they encode are expressed codominantly.
Three classes of gene products have been identified (36). Class I molecules, ex-pressed on virtually all nucleated cell surfaces, are the products of three major redupli-cated loci: HLA-A, -B, and -C. (Genes of minor significance are also present called HLA-E, -F, and -G). Class II molecules are restricted in expression to B-lymphocytes, some monocytes-macrophages, dendritic cells, skin Langerhans cells, and activated T-lymphocytes. They consist of two polypeptide chains (á and â) of unequal length and are the product of HLA-D genes which are subdivided into the subclasses termed DR, DQ, DP, and the less important DM, and DO. Class III molecules are the C4, C2 and Bf components of the complement system. Class I and II molecules form complexes with immunogenic peptides and are recognised by antigen-specific T-lymphocytes. Antigen-specificity of T-lymphocytes is achieved during development in the thymus. Most AI inflammatory diseases are thought associated with certain HLA combinations rather than caused by the HLA haplotype.
A WHO committee periodically assigned universally accepted designations to indi-vidual alleles of each HLA locus according to serological characterisation (e.g. HLA-A1, -B5, -Cw1, -Dw1 etc.). The numbers did not indicate the order of genes or their distance from each other as they had been identified before exact localisation occurred. Provisional alleles were labelled with ‘w’. Recently, based on DNA sequence of these genes, the nomenclature was changed to reflect the extreme polymorphism not clearly distinguishable by serological technique. For instance, HLA-DR1 is written as DRB1*0101. DRB1 indicates the â chain of the DR locus, *0101 shows that it is anti-gen 1, first variant (36).
2.3.1.2.The role of HLA system in GSD
Both CD and DH occur in the same genetic background. Serological studies showed that more than 90% of GSD patients carry either the DR3-DQ2 haplotype (and are ho-mozygous) or are DR5-DQ7/DR7-DQ2 heterozygous (255 and references therein). The products of these two genes interact with each other forming a class II heterodimeric molecule. Sequence studies showed that the HLA-DQA1*0501 and the HLA-DQB1*0201 alleles occur in the DR3-DQ2 haplotype. These two alleles can also be found, however, in the combined DR5-DQ7/DR7-DQ2 heterozygous haplotypes. The DR5-DQ7 haplotype carries the DQA1*0501 and DQB1*0301 alleles, the DR7-DQ2 haplotype carries the DQA1*0201 and DQB1*0202 alleles (DQB1 *0202 and *0201 being almost identical). However, about 2-10% of GSD patients do not carry the above

15
haplotypes. Here CD is most probably associated with the DR4-DQ8 haplotype carry-ing the DQA1*0301 and DQB1*0302 alleles (255).
In summary, susceptibility to GSD appears primarily associated with the alleles HLA-DQA1*0501, DQB1*02 (encoding the HLA class II heterodimer molecule HLA-DQ2), and to a lesser extent with the HLA-DQA1*03, DQB1*0302 genes (encoding the DQ8 molecule) (255).
2.3.2. Gluten, the harmful protein complex
Gluten is a protein complex forming the adhesive mass of cereals. Its adhesive fea-ture contributes to the stickiness of wet flour. Physiologically, gluten is a storage pro-tein providing nitrogen source for the seed embryo during germination. Gluten can be subdivided into two major components upon solubility: prolamines and glutenins (289). The former proteins are more soluble in 70% ethanol. The extraction of these compo-nents from the flour does not lead to uncontaminated fractions. Prolamins are the major toxic constituents, with glutenins beleived to be far less harmful (65, 289).
Prolamines of wheat (called gliadins), rye (secalins), and barley (hordeins) contain particularly high amounts of glutamine (> 32 mol%), proline (> 15 mol%), and hydro-phobic amino acids (approx. 19%, mainly phenylalanine) (57, 83, 289). Phylogeneti-cally, wheat is most closely related to rye and barley, and though the prolamines of oats (avenins) are also composed of high amounts of glutamine, they differ in their low proline content. Based on in vitro and in vivo observations together with the biochemi-cal structural differences, pure oats is believed to be non-toxic, or at least far less harm-ful than its highly toxic phylogenetic relatives (135, 136, 137, 223). Oats grown else-where than in Northern countries (e.g. Central Europe), is often contaminated with other toxic cereals, thus in these countries oats cannot be recommended as nutrient for GSD patients. Prolamines of rice (oryzas), maize (zeins), and millet (pennisetums) are proven to be innocuous.
Gliadins are subdivided into á, â, ã, and ù gliadins, displaying apparent molecular weights on electrophoresis between 20-75 kD (290). N-terminal structural studies have shown â gliadins to be part of á gliadins (23). Only the primary structure of gliadins is important in the pathogenesis of GSD, because heat- or proteinase-treated polypeptides (with the exception of treatment with papain or heat far above 100º C) do not loose their toxic effect (289). á gliadins are the most toxic components, but all forms can be patho-genic (127). All three types of gliadin consist of more than 100 different protein vari-ants with more than 90% of homology (289). They all contain high amounts of repeti-tive oligopeptide sequences. Two tetrapeptides (‘Pro-Ser-Gln-Gln’ and ‘Gln-Gln-Gln-Pro’) occur in all toxic proteins and appear absent from harmless forms (289). Gluten peptides (both gliadins and glutenins) become more toxic after deamidation of certain glutamine residues by a transglutaminase enzyme (see section 2.3.4).
2.3.3. Transglutaminases
Beside genetic predisposition and gluten ingestion, also TGc (and TGe) play a role in the pathogenesis of GSD.
2.3.3.1.History of transglutaminases
Cross-linking of fibrin polymers was first reported by Barkan and Gaspar in 1923 (18). At that time, it was not clear why the solubility of fibrin in urea varied. Only in 1948 could Laki and Lóránd attribute the insolubility of fibrin to a Ca2+-dependent pro-

16
tein termed ‘fibrin-stabilising serum factor’ (or ‘Laki-Lóránd factor’; 176, 190, 191). This ‘serum factor’ (an enzyme) was subsequently purified (186). The protein was later termed ‘blood coagulation factor XIII’ upon the demonstration a patient with hemo-philia due to its deficiency (74). In 1966, Lóránd et al. realised that the ‘blood coagula-tion factor XIII’ is an isoenzyme of the transglutaminase family (30).
Waelsch et al. (242) observed in 1957 the ability of a soluble liver protein fraction (containing TGc) to incorporate labelled amines (e.g. 14C-cadaverine) into proteins in the presence of Ca2+. The designation ‘transglutaminase’ was first used by Waelsch and co-workers, and later corrected by the Enzyme Commission (EC 2.3.2.13, transgluta-minase = R-glutaminyl-peptide, amine-ã-glutamyl transferase).
Achyuthan and Greenberg showed in 1987 that TGc binds GTP resulting in inhibi-tion of its activity (1), hinting at the reason why TGc later received a second name (Gáh) when it was discovered as a G protein with a role in signal transduction (216).
In the skin, ã-glutamyl-å-lysine cross-links were found in hair protein extracts by Harding and Rogers in 1971 (117). The realisation that this TG was not identical to fac-tor XIII or TGc (50), led to it being labelled ‘epidermal’ or ‘hair follicle’ TG (corre-sponding to TGe). Later the finding that both membrane-bound and soluble fractions contained TG activity (265, 181) suggested the presence of further epidermal TGs. The insoluble, ‘keratinocyte-specific’ (=TGk) TG was detected in cultured keratinocytes unlike the soluble ‘epidermal, hair follicle’ TGe. However, antibody studies suggested the expression of TGk, TGc, and TGe both in the hair follicle and epidermal keratino-cytes (220, 235). This confusing situation led to the numbering of TG isoenzymes and their genes (220, 156) where ‘TGM’ denotes the gene and ‘TG’ the protein product both followed by an arabic number. TGM1/TG1, TGM2/TG2, and TGM3/TG3 were assigned to TGk, TGc, and TGe, respectively. The numbering did not alter the nomen-clature of factor XIIIa and band 4.2, and enabled the classification of new members. As this nomenclature is still not generally accepted, traditional names will be used below.
Subsequently other TGs have been discoved either through protein isolation or by sequence homology. Hence TGp (TG4) was isolated from prostate adenocarcinoma cells (31), and more recently, Aeschlimann and co-workers (3, 113) have identified three new family members: TGx (TG5), TGy (TG6), and TGz (TG7). The erythrocyte membrane protein band 4.2 was also found to belong to the family. It has over 30% similarity to certain TG isoenzymes; however, a cysteine to alanine substitution within its active site renders it catalytically inactive (164). Thus nine distinct TG isoenzymes are known in man today.
2.3.3.2.Transglutaminases in general
TGs are universal enzymes present in both pro- and eukaryotic cells and tissues in-cluding fungi and plants. They play very different physiological roles. Every cell type seems to express at least one isoenzyme. In man they may be expressed as both extra- and intracellular enzymes (Table I on page 19). Their primary structure has already been determined leading to their recombinant expression (with exception of the ones very recently discovered). Moreover, the three-dimensional structure of a number of isoenzymes (e.g. factor XIIIa and TGc; see Refs. 292, 184) has been described allowing a greater understanding of their catalytic mechanism. The transglutaminase induced posttranslational modification reaction (EC 2.3.2.13; also referred to as the R-glutaminyl-peptide, amine-ã-glutamyl transferase reaction), leads physiologically to the Ca2+-dependent cross-linking of a specific glutamine residue in the substrate protein to

17
a primary amine which can be either a polyamine (e.g. histamine, serotonin; but also some drugs such as isoniazid) or a protein-bound lysine, the latter resulting in the for-mation of a ã-glutamyl-å-lysine isopeptide bond (88, 89, 189, 5, Fig. 2). This reaction usually creates a covalently connected polymer of proteins.
The TG reaction occurs in two steps (88, 89), the first step being the binding of a glutamine side-chain to the catalytic-site of the TG (Fig. 2). The second step is usually the reaction between the substrate and an available primary amine, but in the absence of amines, a reaction with H2O can also occur (at a significantly slower rate at pH 7.4, but predominating at lower pH values), which results in deamidation of the substrate (86, Fig. 2). TGs can also catalyse the hydrolysis of certain esters by reaction with H2O or
Fig. 2. Simplified scheme of enzymatic reactions catalysed by TGs. The TG reaction occurs in two steps (see references in the text). Initially, the substrate binds with the ã-amino group on a glutamine side-chain to the catalytic -site thyol (cysteine) of the TG enzyme. This step can only occur in the presence of Ca2+-ions, and results in the release of NH3 and formation of an acyl-TG intermediate. The second step is the reaction between the acyl group of the substrate and an available acyl acceptor primary amine (labelled with ‘R-NH2’ in the figure). The primary amine can be either a protein-bound lysine resulting in the formation of a ã-glutamyl-å-lysine isopep-tide bond (within the same or between different polypeptide chains), or a naturally occurring polyamine like putrescine or spermidine. However, in the absence of amines, a reaction with H2O can occur at a significantly slower rate, which will produce deamidation of the substrate creating a new glutamate residue. In case of excess amounts of enzyme but limited amounts of substrates, certain TG isoenzymes can serve as their own substrate, this phenomenon is called ‘autocatalytic cross-linking’.
C substrate
H
NH2 C
O
C
H H
H
HS TGC
H
H Ca2+ TG C
H
H
substrate C
O
C
H
H
C
H
H
S
R NH2
substrate C
O
C
H
H
C
H
H
N R
H
HS TGC
H
H
H2O C substrate
H
OH C
O
C
H H
H
FIRST STEP OF TG REACTION
CROSSLINKING
DEAMIDATION
NH3

18
alcohols (86, 89). This catalytic mechanism and the peptide sequence near the active-site cysteine resembles thiol proteases. Energetically, the TG reaction causes only very low change in the free energy, the driving force for the reaction is supplied by the re-lease of NH3 and its subsequent protonation.
Theoretically, the TG reaction is reversible, but the immediate protonation of NH3 prevents this. Further the cross-linking almost certainly reduces accessibility so it is unlikely that the isopeptide bond can be cleaved without prior degradation of the pro-tein. Hence under physiological circumstances, the TG reaction is practically irreversi-ble. After lysosomal proteolysis of cross-linked molecules, the isopeptide bond of the arising dipeptides can be splitted by the enzyme ã-glutamylamine cyclotransferase which produces lysine and pyroglutamic acid (84).
In general, TGs are highly specific for their glutamine containing substrates, but they have almost no specificity for the amine containing substrates. Only relatively few glu-tamine donor substrates are known. Which protein can be a physiological substrate strongly depends on the function of the relevant TG isoenzyme, as yet no general con-sensus sequence for substrate usage of distinct isoenzymes has been described. It is pos-tulated that this specificity depends rather on the conformation than the sequence of the substrates. Interestingly, FXIIIa, TGc, and TGx have been shown to act as their own substrates resulting in the autocatalytic cross-linking of the enzymes into multiples of high molecular weight (19, 34, Sárdy et al., unpublished observation). Further, TGc is also able to incorporate primary amines (e.g. histamine or putrescine) into itself (189).
TG production and activity is strictly regulated in mammals although little is known about the regulatory mechanisms. Most isoenzymes are controlled uniformly by Ca2+-ions (Table I), with a minimum Ca2+-level of 1-5×10⁻⁴ M (Ref. 189) required for activa-tion (normally intracellular Ca2+-concentration being 10-6-10-7 M). In addition, some TGs (FXIII, TGk, and TGe) are also regulated by limited proteolysis (Table I).
Some of the TGs also act as GTPases and ATPases (Table I). This function is inde-pendent of the TG activity, but binding of GTP or ATP to the relevant isoenzyme can influence substrate binding to the catalytic core (1).
The most important features of TGs are summarised in Table I. The genes encoding for individual TGs are highly conserved across mammalian species (5), and the family members share a strong sequence conservation especially in their active sites (113, 5). Despite this they have rather distinct biological functions. The specialisation can be of so high degree that the absence of a particular TG isoenzyme cannot be replaced by another one. For instance mutations in TGk which result in lamellar ichthyosis cannot be compensated for by TGe, which is also involved in the cornified envelope formation (20, 129). Similarly, knockout experiments have shown TGe cannot be replaced by other TG subtypes (Milstone L et al., personal communication). The isoenzymes also differ in their own modifications (proteolytic activation, phosphorylation, fatty acyla-tion), which regulate their enzymatic activity and subcellular localisation (6).
Not only the biological function but also the pathological roles of TG isoenzymes differ. TGc has been identified as the major autoantigen of disease-specific circulating IgA Abs in CD and DH (69, 70), and TGe has been implicated in the pathogenesis of DH (239). The importance of TGc is better understood and will be described below.
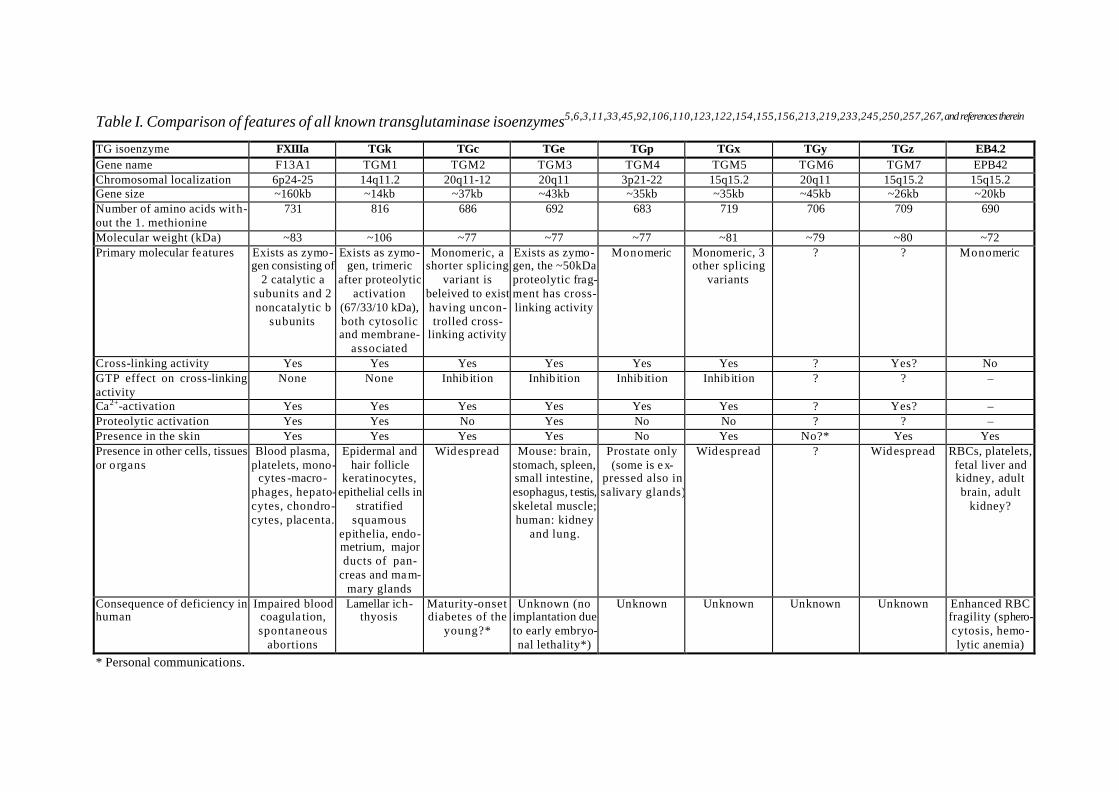
Table I. Comparison of features of all known transglutaminase isoenzymes5,6,3,11,33,45,92,106,110,123,122,154,155,156,213,219,233,245,250,257,267, and references therein
TG isoenzyme FXIIIa TGk TGc TGe TGp TGx TGy TGz EB4.2 Gene name F13A1 TGM1 TGM2 TGM3 TGM4 TGM5 TGM6 TGM7 EPB42 Chromosomal localization 6p24-25 14q11.2 20q11-12 20q11 3p21-22 15q15.2 20q11 15q15.2 15q15.2 Gene size ~160kb ~14kb ~37kb ~43kb ~35kb ~35kb ~45kb ~26kb ~20kb Number of amino acids with-out the 1. methionine
731 816 686 692 683 719 706 709 690
Molecular weight (kDa) ~83 ~106 ~77 ~77 ~77 ~81 ~79 ~80 ~72 Primary molecular features Exists as zymo-
gen consisting of 2 catalytic a
subunits and 2 noncatalytic b
subunits
Exists as zymo-gen, trimeric
after proteolytic activation
(67/33/10 kDa), both cytosolic and membrane-
associated
Monomeric, a shorter splicing
variant is beleived to exist having uncon-trolled cross-
linking activity
Exists as zymo-gen, the ~50kDa proteolytic frag-ment has cross-linking activity
Monomeric Monomeric, 3 other splicing
variants
? ? Monomeric
Cross-linking activity Yes Yes Yes Yes Yes Yes ? Yes? No GTP effect on cross-linking activity
None None Inhib ition Inhib ition Inhib ition Inhib ition ? ? –
Ca2+-activation Yes Yes Yes Yes Yes Yes ? Yes? – Proteolytic activation Yes Yes No Yes No No ? ? – Presence in the skin Yes Yes Yes Yes No Yes No?* Yes Yes Presence in other cells, tissues or o rgans
Blood plasma, platelets, mono-
cytes -macro-phages, hepato-cytes, chondro-cytes, placenta.
Epidermal and hair follicle
keratinocytes, epithelial cells in
stratified squamous
epithelia, endo-metrium, major ducts of pan-
creas and ma m-mary glands
Widespread Mouse: brain, stomach, spleen, small intestine, esophagus, testis, skeletal muscle; human: kidney
and lung.
Prostate only (some is ex-
pressed also in salivary glands)
Widespread ? Widespread RBCs, platelets, fetal liver and kidney, adult brain, adult
kidney?
Consequence of deficiency in human
Impaired blood coagula tion, spontaneous
abortions
Lamellar ich-thyosis
Maturity-onset diabetes of the
young?*
Unknown (no implantation due to early embryo-nal lethality*)
Unknown Unknown Unknown Unknown Enhanced RBC fragility (sphero-cytosis, hemo-lytic anemia)
* Personal communications.
20
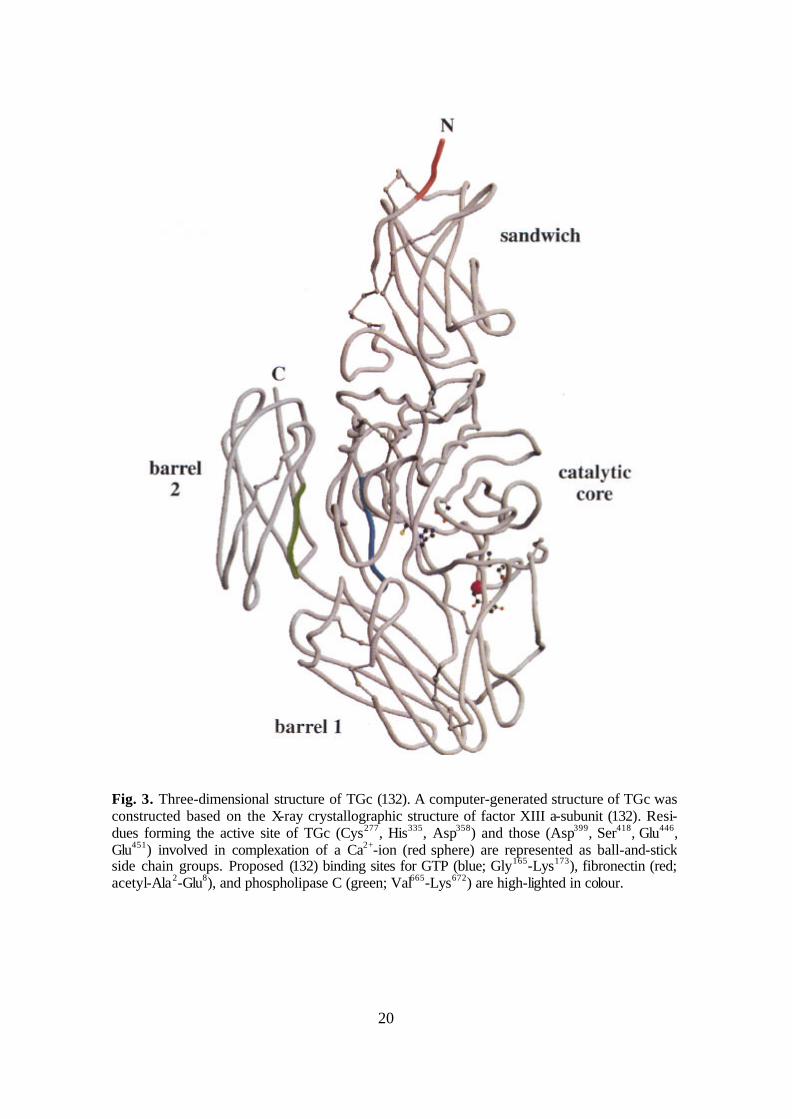
Fig. 3. Three-dimensional structure of TGc (132). A computer-generated structure of TGc was constructed based on the X-ray crystallographic structure of factor XIII a-subunit (132). Resi-dues forming the active site of TGc (Cys277, His335, Asp358) and those (Asp399, Ser418, Glu446, Glu451) involved in complexation of a Ca2+-ion (red sphere) are represented as ball-and-stick side chain groups. Proposed (132) binding sites for GTP (blue; Gly165-Lys173), fibronectin (red; acetyl-Ala2-Glu8), and phospholipase C (green; Val665-Lys672) are high-lighted in colour.

21
2.3.3.3.Features of TGc
TGc (also referred to as TG2, ‘cellular TG’, or ‘tissue TG’) is a multifunctional en-zyme having several functions both in the intra- and extracellular space.
2.3.3.3.1. Enzymology, structure, and regulation of TGc
The human TGM2 gene localises to chromosome 20q11-12 (103), and its 13 exons span ~37 kb. The protein of 687 amino acids (together with the first methionine) has a calculated molecular mass of 77.3 kDa (103, 91). The active site involves three main residues (Fig. 3 and Fig. 4): Cys277, His335, Asp358 (104). This catalytic triad together with the majority of adjacent amino acids is extremely conserved in enzymatically ac-tive TG isoenzymes. After transcription of TGc in the free cytoplasmic space, it is N-terminally modified by removal of the first methionine residue and N-acetylation of the penultimate alanine residue (134). TGc contains no disulfide bonds, and is not glycosy-lated (133). In spite lacking the characteristic hydrophobic leader-sequence of a typical secreted protein (134), a proportion of TGc is found active in the extracellular space (2, 6, 8, 179, 272, 279, 162, 163). Its mode of release is still unknown. FXIIIa and TGp have also been found to function in the extracellular space (these TGs also lack a signal peptide).
The three-dimensional structure of recombinant human TGc has recently been de-termined (Fig. 4; Ref. 184), former models derived from that of FXIIIa (Fig. 3; Refs. 292, 132). Similarly to FXIIIa, it consists of an N-terminal â-sandwich domain [be-tween amino acids (aa) 1-138], the catalytic core (aa 139-471), and two C-terminal bar-
Fig. 4. Three-dimensional structure of human TGc (modified from 184). Left, overall structure. The ribbons of the â-sandwich domain, catalytic core domain, the first and second â-barrel do-mains are shown in green, red, cyan, and yellow, respectively. The loops connecting the first â-barrel to the catalytic core and the second â-barrel are drawn in purple. Right, the active site showing the catalytic triad relative to the GTP-binding site. Cys277, His335, Asp358, Tyr516, and GDP are shown in ball-and stick.

22
rels (aa 472-584 and 585-687; see Fig. 3, Fig. 4, and Refs. 132, 184). Expression of just the catalytic domain results in a protein with no cross-linking activity, but a construct lacking the two barrels was shown to have (reduced) activity (132). The ATP/GTP binding site has been proposed to localise between aa 173-174, 476-483, and 580-583, the Ca2+-binding site between aa 400-455, the fibronectin binding site between aa 1-7, and the phospholipase C binding site between aa 665-672 (132, 184).
The expression of human TGc is regulated differently depending on the cell type. It can be regulated by various cytokines, hormones, and drugs (reviewed in 180, 6 and 45). Cultured cells overexpressing TGc show morphological changes and enhanced re-sistance to proteolytic detachment indicating an increased adhesion; however, neither increased cross-linked products (105, 221) nor TGc activity (279) could be detected showing that the activity of TGc is independently regulated from gene expression.
The cross-linking function of TGc is allosterically activated by Ca2+-ions and inhib-ited by GTP, GDP, and GMP, whereas it is not influenced by physiological concentra-tions of ATP or CTP (1, 21, 174, 175, 262). However, its GTPase and ATPase activity is independent of Ca2+-ions, but depends on Mg2+-ions, because Mg2+-GTP and Mg2+-ATP are the true substrates for the hydrolysis reaction (175). Further, the GTPase func-tion is inhibited by the binding of ATP, ADP, and AMP (175). Divalent cations other than Ca2+ (and Sr2+) usually do not activate TGc, whereas Fe2+, Cu2+, Zn2+, and Hg2+ are strong inhibitors of the cross-linking activity (85). The intracellular modulation of TGc activity is also influenced by the Ca2+-dependent protease calpain which effectively degrades TGc and is inhibited by GTP (294). Calreticulin inhibits both the TG and the GTPase activities (80). Certain molecules such as iodoacetamide and cystamine can irreversibly inhibit the cross-linking activity by alkylating the catalytic SH group (87). NO can regulate TGc by S-nitrosylation whose degree depends on the Ca2+-concentration (202, 174). The situation is even more complex as TGc can also be acti-vated allosterically by the membrane lipid sphingosylphosphocholine (173), and other unidentified factors might also participate in the regulation of enzyme activity.
2.3.3.3.2. Distribution, substrates and functions of TGc
TGc is expressed in virtually all cell types and tissues of the body suggesting essen-tial role in their existence (4, 7, 267). Intracellularly, it is located in the cytosol and the nucleus, as well as associating with the cytoskeleton and cell membrane (6, 179). Its distribution is independent of the TG activity (6).
In terms of GSD it is important that TGc is expressed in the small intestine both in the epithelium and in the stroma. Jejunal biopsies of CD patients show increased TGc activity (29).
Despite extensive research on TGc, little is known about its real physiological func-tions. A number of both intra- and extracellular proteins have been shown to be sub-strates of TGc. Some examples are shown in Table II. Further, the significance of its deamidation reaction, GTPase, ATPase, and G-protein activity is still not understood.
TGc is implicated in physiological processes as diverse as extracellular matrix stabi-lisation in development and wound healing, hormone receptor signal transduction as a G-protein, receptor-mediated endocytosis, cellular adhesion, cornified envelope forma-tion in the keratinocytes, and programmed cell death (for review see 6). However, its exact functions remain unclear. Indeed disruption of the TGM2 gene in the mouse does not lead to major phenotypic changes (64, 217) suggesting compensation by other fam-ily members. It is speculated that the insufficiency of TGc might lead to the rare disease

23
called maturity-onset diabetes of the young (MODY) (Melino G et al., oral communica-tion), because TGc-nul mice show elevated blood sugar values. In addition, they develop anti-nuclear Abs after the first year of life, which may result in an SLE-like disease (Fésüs L et al., oral communication).
TGc has been implicated in the develop-ment of most major organs (reviewed in 6). In particular, TGc has been described as having an important role in cell adhesion and spread-ing mediated by its high affinity binding of cell surface-associated fibronectin as well as â1 and â3 integrins so acting as a coreceptor for fibronectin (8, 279, 272, 100, 69, 163). This function is independent of any cross-linking activity, but the association of TGc with the pericellular matrix of cells depends upon the N-terminal fibronectin binding do-main of TGc (100). However, TG activity may be important in cross-linking (hemi-)des-mosomal components, such as desmoplakin, with elements of cornified envelope and der-moepidermal anchoring filaments (78). TGc is also beleived to be important in the stabilisa-tion of extracellular matrices such as the basement membrane and growth plate (2, 4, 6, 139). Furthermore, TGc has been associated with apoptosis (82), and it has been proposed that its intracellular activation by elevated intracellular Ca2+-levels could lead to the irre-versible assembly of a cross-linked protein scaffold in dead cells thus preventing the re-lease of harmful intracellular components into the extracellular space. However, results from the TGc-/- mice suggest that all these functins are not TGc-specific (64, 217).
In conjunction with FXIIIa, TGc is thought be significant in the stabilisation of the fibrin clot and the extracellular matrix after injury (109, 118). During healing, endothelial cells, macrophages, and skeletal muscle cells express increased amounts of TGc, and it has been shown active in the extracellular space within the wound (118).
A unique feature of TGc is its G-protein function. For historical reasons, it is also called the á-subunit of Gh (Gáh). Together with Gâh, which has recently been suggested to be identical to calreticulin (80), TGc has been demonstrated to transmit the á1-adrenergic receptor signal to phospholipase C-ä1 (216). However, transgenic mice overexpressing TGc in the heart showed no evidence for TGc acting as a G-protein-like
Table II. Substrates of TGc (selection from 6, 45, 157, 247, and 222). Acetylcholine receptor Actin â-amyloid Calreticulin CD38 antigen Collagens (e.g. type I, II, III, V, VII) Crystallins Dermatane sulfate proteoglycans Elafin Entactin Fibrin and fibrinogen Fibronectin Fibrillin GST P1-1 Heat shock proteins (e.g. Hsp23) Histones (e.g. H1, H2A, H2B, H3, H4) Huntingtin Immunoglobulins (e.g. IgG) Interleukin 2 Keratins Lactate dehydrogenase Lipocortin I Lipoprotein A Midkine Myelin basic protein Myosin Nidogen Osteonectin Osteopontin Phospholipase A2 Plasminogen Plasminogen activator inhibitor 2 Retinoblastoma protein (pRB) ô-protein TGF-â Troponin Tubulin Vitronectin Von Willebrand factor

24
transducer but rather cardiac remodeling resulting in mild hypertrophy and diffuse inter-stitial fibrosis presumably due to TG activity (254).
In conclusion, while a body of evidence suggests that TGc is a multifunctional en-zyme with roles in a number of metabolic processes, it appears that its functions are not specific and can be compensated for in its absence. Further studies are necessary to demonstrate unambigiously the functions of TGc.
2.3.3.3.3. Pathogenic role of TGc in diseases different from GSD
TGc has been implicated in the pathogenesis of several illnesses including immune or autoimmune (AI) disorders such as AI hepatitis, SLE, myasthenia gravis, haemolytic anaemia, bullous pemphigoid, Goodpasture syndrom, rheumatoid arthritis, amyotrophic lateralsclerosis, multiple sclerosis, and Crohn disease (242, 281, 222, 224, 157, 61), neurodegenerative diseases [Alzheimer’s disease (251, 75, 138), Huntington’s chorea (35), Parkinson’s disease (138, 90, 157), progressive supranuclear palsy (7), dentatoru-bral-pallidoluysian atrophy (142, 131), spinobulbar muscular atrophy (280), various forms of spinocerebellar ataxias (142, 280)], malignancies (62, 282), human immunode-ficiency virus infection (9), cataract formation (17, 188, 157), atherosclerosis (28, 288), and inclusion body myositis (46).
In the majority of these diseases, the action of TGc can be traced back to its cross-linking activity with cross-linked products beleived to behave as neoantigens in AI dis-orders. Proteins (amyloid peptides, ô protein or huntingtin) containing long polygluta-mine regions may be cross-linked by transglutaminases and produce the cytosolic pro-teinaceous aggregates in neurodegenerative diseases. Also, enhanced cross-linking seems to contribute to cataract formation, atherosclerosis, and inclusion body myositis. In contrast, the role of TGc in metastasis process is more complex. Possibly the down-regulation of TGc as often found in metastatic tumours results in both reduced apoptosis of neoplastic cells and reduced adhesion to the extracellular matrix facilitating uncon-trolled tumour growth and dissemination. The function of TGc in GSD appears to be different to that described in the diseases above and is detailed in the next section.
2.3.4. Pathomechanism of GSD The manifest GSD with typical symptoms and signs is the result of culmination of
four factors: genetic predisposition, gluten ingestion, small intestinal lesions, and even-tual unmasking factors.
Despite the strong association with specific HLA haplotypes, genetic factors alone do not decide the clinical outcome of GSD. Monozygotic twins may exhibit any combi-nation of manifest CD, DH or clinically silent GSD (96, 165) proving environmental factors are also significant. Although as stated above (2.3.1) several non-HLA genes are likely to be important in the pathogenesis of GSD, in practice all GSD patients share the same two HLA antigens: DQ2 (95% of patients) or DQ8 (almost 5%).
The main environmental factor in GSD is the ingestion of gluten in cereals. The amount of gluten consumed and the time point of first exposure may play a prominent role in CD manifestation (284). As detailed above (2.3.2), prolamines contain high amounts of glutamine, proline, and hydrophobic amino acids (57, 83, 289). These amino acids create several epitopes in the prolamin (e.g. gliadin) peptides, some are immu-nodominant. Indeed, T-cell clones carrying HLA-DQ2 or -DQ8 molecules and respon-sive to gliadin peptides can be isolated from the intestinal mucosa (192). Nevertheless,
25
there are only a few intestinal T-cells recognising native prolamin peptides as foreign antigens (192, 253). However, a special, peculiar feature of gluten is that the deamida-tion of certain glutamine residues in some polypeptides (both in prolamins and gluten-ins) can lead to major effects on their recognition as antigens with T-cells recognising certain deamidated polypeptides much more effectively than unmodified ones (192, 253, 207, 277; and reviewed in 255). In particularly, the majority of antigenic gliadin peptides are not recognised at all in their native form (14, 253, 207, 277). The explana-tion of this phenomenon is the characteristic property of DQ2 and DQ8 binding motifs that preferentially bind peptides with negative charges. Although gluten peptides are not rich in negatively charged residues, after deamidation creating glutamic acids from glutamines, gluten can become a rich source of DQ2 and DQ8 epitopes. Due to their high glutamine and proline content, prolamins are preferred substrates for TGc (29, 261). Recently, TGc substrate consensus sequences have been reported and shown pre-sent in gluten peptides (273). These confirm the important role of high proline content. While the deamidation reaction theoretically should not occur in the small intestinal mucosa where the pH is around 7.4 and high amounts of amine donors are present, T-cell lines isolated from small intestinal biopsy specimens and challenged with different gliadin preparations showed that coincubation of gliadin with the TGc inhibitor cysta-mine often reduced their responsiveness to deamidated gliadin. This suggests that the deamidation of gluten peptides may indeed be mediated in the mucosa in vivo by en-dogenous TGc (207, 208).
As TGc is localised directly under the jejunal villus epithelium (207, 163, 226) and its expression in biopsies of CD patients is elevated by 3.2-fold over that in healthy in-dividuals (29), deamidation of gluten peptides may be more efficient in these patients. It is also possible that deamidation occurs on the apical surface of enterocytes. The de-amidation reaction of TGc predominates at low pH which can occur in the duodenum and jejunum, which could explain why the ileum is often unaffected. [Non-enzymatic deamidation does not occur selectively, thus the gliadin polypeptides generated in the strongly acidic stomach do not serve as good epitopes (253)]. The TGc has been shown with immunogold electron microscopy to colocalise with toxic gliadin peptides on the apical surface of jejunal enterocytes, in the Golgi complexes, and on the basolateral cell membrane of enterocytes (Zimmer KP et al., oral communication). At the low pH of endosomes, the TGc might deamidate (and/or cross-link) gliadin.
Sollid et al. (256, 255) have attempted to explain how the recognition of foreign glu-ten peptides induces an enteropathy. Dietary gluten polypeptides (partially digested into smaller peptides) can reach the lamina propria even through healthy epithelial barrier; possibly in greater concentrations in infants with an immature barrier or during small intestinal infections. Indeed, gliadin may be directly toxic causing an increase in the permeability of epithelial barrier (125, Heyman et al., Fasano A., oral communication). Thus gluten peptides can reach substantial concentration in the mucosa and undergo deamidation. In genetically predisposed individuals, gluten peptides are presented by antigen presenting cells (B-cells, dendritic cells, macrophages and/or enterocytes) via the HLA-DQ2 or -DQ8 molecules. These cells efficiently activate both CD4+ Th1-cells which drive inflammation and tissue remodeling and Th2-cells which initiate antibody production against the gluten peptides. In the inflamed environment, TGc expression in lymphocytes and fibroblasts is increased enhancing extracellular deamidation as well as resulting in covalently cross-linked TGc-gluten peptide complexes (29, 261, 69, 207). Deamidation and cross-linking can also occur in the epithelial endosomes. If the ly-
26
sosomal degradation is incomplete, immunogenic, deamidated gliadin polypeptides cross-linked with certain TGc polypeptides might reach the basolateral surface of en-terocytes. This complex can serve as neoantigen being recognised by both gluten-specific and TGc-specific B-cells.
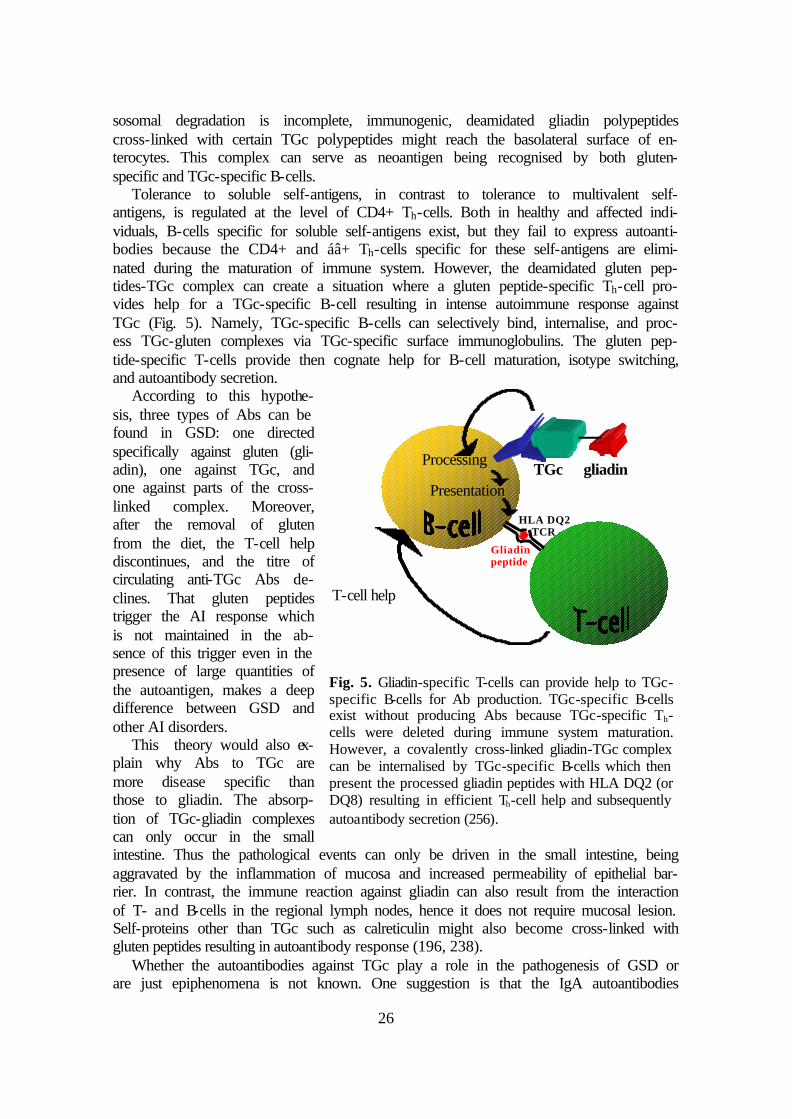
Tolerance to soluble self-antigens, in contrast to tolerance to multivalent self-antigens, is regulated at the level of CD4+ Th-cells. Both in healthy and affected indi-viduals, B-cells specific for soluble self-antigens exist, but they fail to express autoanti-bodies because the CD4+ and áâ+ Th-cells specific for these self-antigens are elimi-nated during the maturation of immune system. However, the deamidated gluten pep-tides-TGc complex can create a situation where a gluten peptide-specific Th-cell pro-vides help for a TGc-specific B-cell resulting in intense autoimmune response against TGc (Fig. 5). Namely, TGc-specific B-cells can selectively bind, internalise, and proc-ess TGc-gluten complexes via TGc-specific surface immunoglobulins. The gluten pep-tide-specific T-cells provide then cognate help for B-cell maturation, isotype switching, and autoantibody secretion.
According to this hypothe-sis, three types of Abs can be found in GSD: one directed specifically against gluten (gli-adin), one against TGc, and one against parts of the cross-linked complex. Moreover, after the removal of gluten from the diet, the T-cell help discontinues, and the titre of circulating anti-TGc Abs de-clines. That gluten peptides trigger the AI response which is not maintained in the ab-sence of this trigger even in the presence of large quantities of the autoantigen, makes a deep difference between GSD and other AI disorders.
This theory would also ex-plain why Abs to TGc are more disease specific than those to gliadin. The absorp-tion of TGc-gliadin complexes can only occur in the small intestine. Thus the pathological events can only be driven in the small intestine, being aggravated by the inflammation of mucosa and increased permeability of epithelial bar-rier. In contrast, the immune reaction against gliadin can also result from the interaction of T- and B-cells in the regional lymph nodes, hence it does not require mucosal lesion. Self-proteins other than TGc such as calreticulin might also become cross-linked with gluten peptides resulting in autoantibody response (196, 238).
Whether the autoantibodies against TGc play a role in the pathogenesis of GSD or are just epiphenomena is not known. One suggestion is that the IgA autoantibodies
Fig. 5. Gliadin-specific T-cells can provide help to TGc-specific B-cells for Ab production. TGc-specific B-cells exist without producing Abs because TGc-specific Th-cells were deleted during immune system maturation. However, a covalently cross-linked gliadin-TGc complex can be internalised by TGc-specific B-cells which then present the processed gliadin peptides with HLA DQ2 (or DQ8) resulting in efficient Th-cell help and subsequently autoantibody secretion (256).
TGc gliadin
Processing Presentation
HLA DQ2 TCR
Gliadin peptide
T-cell help

27
against TGc can inhibit its cross-linking activity (77, 115). A reduced deamidation abil-ity might control GSD as unmodified gluten peptides are less efficient in maintaining enteropathy. Further, TGc activity is necessary for activation of TGF-â (218), and indi-rect inhibition of TGF-â activation by anti-TGc Abs might have profound effects on the differentiation of the intestinal epithelium (116). TGc is also involved in the cell adhe-sion and matrix stabilisation (279), thus the autoantibodies might also disturb the cell-cell and/or cell-extracellular matrix contact. These effects on epithelial differentiation could be responsible for the typical small intestinal histopathology and induce malab-sorption. In addition, the anti-TGc Abs might be responsible for the extraintestinal manifestations of CD. Recently, also IgA autoantibodies directed against TGc have been described which activate the enzyme (Király R et al., personal communication). Thus the role of autoantibodies in GSD might be more complex than speculated above.
Small intestinal changes in both DH and CD are morphologically, functionally and clinically very similar, though DH patients show significantly less severe mucosal pa-thology and the clinical symptoms of enteropathy are usually absent or mild (96, see also 2.4.2 below). However, there is a profound difference in the Ab profiles: high affin-ity anti-TGe IgA maintained by gluten is present in DH patients but not in those suffer-ing from CD (239). In addition, TGe is present in the upper dermal IgA aggregates typi-cal of DH. A hypothesis for the etiology and pathogenesis of DH has recently been sug-gested by our research group (239).
Possibly TGc-gluten complexes initiate an IgA autoantibody response (256), but fail to produce high affinity anti-TGc immunoglobulins, so result initially in a silent CD. These Abs cross-react with TGe due to their high amino acid sequence similarity, but are of low avidity to it. After prolonged gliadin provocation (DH patients usually show symptoms later in life than CD patients), specific crossreacting Ab populations develop in patients who will go on to aquire DH. These Abs have a low affinity to TGc, but ex-tremely high affinity to TGe (239). Whether they arise against TGe as a primary antigen or are the result of epitope spreading is unknown. Why only a proportion of patients develop specific Abs against TGe and why these patients show only a very mild form of enteropathy also remains to be elucidated.
The skin pathology may be evoked by the dermal deposition of circulating immune complexes containing IgA and TGe (239). Possibly the TGe is active, resulting in cova-lent cross-linking of the complex to certain dermal structural elements. This could be the basis for the stability of these immune complexes, as it is known that the IgA depos-its in DH skin stay detectable up to a decade after the introduction of a completely glu-ten-free diet (96). It would also explain why it has not been possible to extract the IgA immune complexes from the skin of DH patients. Inflammation of the skin might elimi-nate the covalently bound immune complexes. Indeed, often the IgA granules are pre-sent perilesionally but not in areas of blister formation. This circulating immune com-plex hypothesis for DH is supported by a number of findings. Firstly that TGe is ex-pressed in several tissues in the body including the kidney (Table I on page 19), thus the antigen might originate from organs other than the skin. Also the skin histology in DH has features in common with other dermatoses induced by circulating immune com-plexes (149), and although the main site of immune complex deposition is the upper dermis, they are also present in vessel walls (Fig. 9 on page 33). Further in DH, asymp-tomatic IgA immune complex depositions can be detected in the kidney (229), a situa-tion often seen in systemic diseases caused by circulating immune complexes and in-deed DH associated IgA nephropathy has been reported (120). Finally that Abs in DH

28
sera do not bind to the normal human papillary dermis again suggests that the deposits derive from circulating immune complexes. The factors that induce the classical distri-bution pattern of skin lesions in DH patients remain unknown.
2.4. Symptoms and signs
The clinical presentations of GSD are wide. Both CD and DH can be subdivided by different severity, as they can also present with unspecific or even absent clinical signs or symptoms. Further, epidemiological studies showed that the majority of GSD pa-tients actually have very mild or atypical symptoms or often clinically silent disease (44, section 2.2.1). Patients with silent disease always have jejunal morphological evi-dence for CD. The term ‘latent CD’ is currently used for designation of patients fulfill-ing the following conditions: 1) no clinical symptoms of CD, 2) normal mucosa with traditional histology, 3) carrier status of HLA DQ2 or DQ8 molecules, 4) presence of EMA positivity and/or increased density of intraepithelial lymphocytes bearing ã/ä T-cell receptors and/or positive jejunal direct immunofluorescence for IgA (193, 285).
Table III. Symptoms, signs, and diagnosis of CD in alphabetic order (112, 56, 182).
GI symptoms and signs ExtraGI symptoms and signs Test results • Abdominal distension,
bloating, full abdominal con-tour (76%)
• Bulky, loose, pale, stink-ing, or frothy stools (78%)
• Chronic constipation (12%)
• Chronic diarrhoea (68%) • Failure to thrive (81%) • General malaise (39%) • Glossitis • Loss of weight, anorexia
(72%) • Nausea • Pancreatic insufficiency (if
associated with CD, disap-pears after introduction of a GFD)
• Recurrent abdominal pain (15-36%)
• Secondary cow’s milk intolerance (often associated with CD in early childhood, later usually disappears)
• Short stature • Vomiting (54%)
• Amenorrhoea, infertility, late menarche, early menopause, ha-bitual abortions
• Ataxia • Bleeding (mostly skin bleeding) • Caliber reduction (sometimes
loss) of hair • Cryptogenic hypertransamina-
saemia • Cramps, tetany • Delayed onset of puberty • Dental enamel hypoplasia • Epilepsy with focal calcification
in the brain • Fatigue, weakness • Finger clubbing • Hyposplenism • IgA nephropathy (mesangiopro-
liferative glomerulonephritis) • Impaired male gonadal function • Iron deficiency anaemia, pallor • Lung fibrosis, alveolitis • Mood disturbances, changes • Myositis, (cardio-)myopathy • Oedema • Osteopenia, osteoporosis, or
osteomalacia • Polyneuropathy • Recurrent aphthous ulceration
• � quantity of stool fat • � D-xylose absorption • ‘Malabsorption pattern’
with small intestinal x-ray • � serum Ca2+, Fe2+, Mg2+,
Zn2+ • � serum albumin, choles-
terol, carotenes, vitamin A, ferritin
• � prothrombin time • Abnormal liver function
tests • � vitamin B12 and folic
acid levels • � urinary 5-hydroxy indole-
acetic acid (5-HIAA) levels • Abnormal breath H2 tests
(sign for secondary lactase deficiency and/or bacterial overgrowth)
• Abnormal intestinal histol-ogy
• Positive serological tests (IgA or IgG EMA, AGA, and anti-TGc)
• Typical HLA haplotype

29
The symptoms and signs of GSD are sometimes mixed with those of an associated disease. Such GSD-related conditions include type I diabetes mellitus and some other AI disorders (see Table XII on page 59 for details), selective IgA deficiency (54), Down’s syndrome (41, 295, 236), and cystic fibrosis (183, 275).
2.4.1. Symptoms and signs of CD
CD commonly presents in infancy and early childhood with classical GI symptoms including chronic diarrhoea, vomiting, abdominal pain, distension and bloating, short stature, loss of weight, and failure to thrive (182). The disease may also present later in life with the symptoms of a typical malabsorption syndrom: loss of weight, abdominal distension and bloating, diarrhoea, steatorrhoea, together with abnormal tests of absorp-tive function (Table III, 56, 112).
CD is often monosymptomatic, thus one single manifestation like chronic diarrhoea, short stature or loss of weight of unknown origin may be the only presenting sign. In the majority of adult patients, the enteropathy presents with less typical symptoms like chronic iron deficiency anaemia, fatigue, constipation, habitual abortions, amenorrhoea, infertility, or ataxia. In these patients, the enteropathy is beleived to be localised only in the duodenum and the oral part of jejunum enabling the aboral part of jejunum and the ileum to adapt to the damage and loss of absorptive capacity of the oral parts of small intestine (144). As the damaged areas of small intestinal mucosa are distributed mosai-cally, the small bowel may perfectly compensate for the loss of resorption surface. Hence in certain individuals no symptom or sign indicating GSE with the exception of positive serology and small intestinal histology may occur (144). Moreover, pathologi-cal IgA deposits and increased number of intraepithelial T-cells bearing ã/ä receptor detectable only with immunohistochemical methods might be the only signs for intesti-nal affection (147, 243, 244).
The endoscopical picture of flat mucosa is suggestive of GSE, but it cannot replace the histological examination (Fig. 6 and 2.5.1).
2.4.2. Symptoms and signs of DH
The onset of skin symptoms is usually sudden but may also be gradual (76, 96). If untreated, the course of the disease is extremely chronic with spontaneous exacerbations and remissions (99). Long, asymptomatic periods are possible (96, 97, 205, 206). In the acute phase, the polymorphic skin symptoms resemble erythema multiforme or herpes
Fig. 6. Typical endoscopical picture of jejunal mucosa. A, normal jejunum. B, jejunum showing flat mucosa. (Reproduced from Ref. 40.)
A B

30
virus infections: grouped or clustered, erythematous, urticarial, exsudative, excoriated papules and plaques appear typically associated with small vesicles, but bullous lesions develop rarely (Fig. 7). In the chronic phase, excoriated papules based on postinflamma-tory, hypo- and/or hyperpigmented macules are common, it may be impossible to find an intact vesicle because of the excoriation. Occasionally, annular and gyrate patterns of lesions with characteristic central clearing and vesicles at the erythematous margins of large plaques may be seen. The eruptions most often affect the extensor surfaces of the major joints (elbows, knees), the scalp (occiput, facial hairline), shoulders and posterior axillary folds, sacrum, buttocks, and natal cleft. However, any other sites of the body may be involved including the oral mucosa. The commonest sites are the elbows (95%), the next commonest the buttocks, the third most frequent the knees. Interestingly, the disease rarly appears on the head, but it is often affected later on during exacerbations. The lesions tend to occur at sites of pressure from clothing, e.g. under tight belts. Pruri-tus is usually predominant, extremely severe, may even be disabling, but the general health is never affected. In addition, burning or stinging sensations may also accompany the condition (151). Due to the intensive scratching, secondary impetiginisation is common.
Beside the above alerting lesions, there are also discrete palmoplantar symptoms which are usually not noted by the patient: reddish-brown or dark lilac, mottled, irregu-lar shaped spots of 1-5 mm diameter together with pinpoint-like macules resembling purpuras; referred to as pseudopurpuras (210, 151, Fig. 8). The reddish-brown spots are remnants of small, flat, haemorrhagic vesicles. These are only present for a few weeks, do not accompany every relapse or correlate with the severity, but are important because
Fig. 7. Typical skin symptoms of DH: grouped, polymorphic, erythematous, excoriated papules distributed symmetrically over the knees. Blisters are not necessarily present, the distribution of the rash is usually more suggestive of the diagnosis than the finding of vesicles.

31
they can confirm the diagnosis or lead the physician’s attention to the possibil-ity of DH (210, 151). They are found mainly in regions exposed to various mechanical irritations and pressures, i.e. on the flexor surface of fingers, fingertips, and palms, rarely also on the plantar surface of toes, but never on the dorsal or extensor aspects (Fig. 8). The lesions affect the right hand, particu-larly the right index finger, more inten-sively than the left side (151).
Although CD and DH are closely re-lated diseases, less than 10% of patients with DH have gastroenterological symptoms suggestive of GSE (96, 232). The enteropathy in DH is morphologi-cally, functionally and clinically very similar to that in CD (96). GI symptoms are usu-ally absent or so mild that the DH patients are unaware of them, but inflammatory small bowel changes can often be found by histological examination (95, 96, 167, 230). In a number of DH patients, no intestinal lesions can be found by traditional histology; how-ever, pathological IgA deposits and increased number of ã/ä receptor positive intraepi-thelial T-cells are almost always present (2.5.2, 147, 244). In certain rare cases, the whole GI and/or extragastrointestinal symptom spectrum of CD may be detected, but the skin lesions always predominate.
2.5. Diagnosis
2.5.1. Endoscopy The endoscopic markers for CD are 1) the mosaic appearance of the duodenum, 2)
the reduction or loss of duodenal (Kerkring’s) folds, 3) scalloped duodenal folds in the descending duodenum, 4) nodular mucosal pattern, and 5) visible underlying submuco-sal vessels (200, Fig. 6). In contrast to their high specificity (>90%), the sensitivity of these markers is relatively low (15-76%) if only one of them can be observed, but the more markers are present, the higher is their sensitivity and thus positive predictive value (200). Nevertheless, histological diagnosis should always confirm the clinical suspicion.
2.5.2. Histological examinations
The diagnosis of GSE was based in the 1970-80s on the characteristic histological changes (villous atrophy, intraepithelial lymphocytosis, crypt hyperplasia) seen in small intestinal biopsies, followed by the regeneration of the mucosa after a GFD, and relapse during subsequent gluten challenge (203). However, during the last two decades it be-came clear that when the original biopsy shows severe enteropathy, and the clinical symptoms disappear after introduction of a GFD, the subsequent gluten challenge pro-duces positive results in 95-99% of the patients. Accordingly, the criteria have been
Fig. 8. Reddish-brown, irregular pseudopurpuras of 1-5 mm diameter together with scaling on the flexor surface of thumbs of a patient with DH. Note that the lesions are more extended on the right thumb.

32
revised, and gluten challenge is no longer considered mandatory if there is a clear-cut clinical response with relief of all symptoms within weeks (283). All children diagnosed in the first 2 years of life, those individuals in whom the diagnosis was doubtful or were asymptomatic and where there may have been other explanations for the histological abnormalities, a gluten challenge is still useful to confirm the diagnosis which has seri-ous, life-long consequences.
Today it is evident that not only severe villus atrophy but also other histological changes are consistent with the diagnosis of GSE. Being aware of this, Marsh has sub-divided the (unspecific) traditional histological changes seen in GSE (198) into five lesion groups (Table IV). Many disorders (also others than listed in Table IV) can cause flat and/or infiltrative mucosal lesions. This is why the demonstration of mucosal regen-eration after introduction of a GFD is essential for differential diagnosis, and sometimes a gluten challenge is also needed. In addition, the symptoms of GSE can be induced by several factors including coexisting nutritional deficiencies (e.g iron deficiency), GI diseases (e.g. pancreatic insufficiency), metabolic stress (e.g. surgery), malignancies (e.g. intestinal lymphomas), and GI infections [e.g. adenovirus 12 infection (141, 13)].
Table IV. The main five lesions associated with GSE together with some disorders of differential diagnostic importance (198). The type 0 lesion designates normal mucosa (latent GSE). Type 1 lesion means that the ratio of (CD3+ and ã/ä+) mucosal intraepi-thelial lymphocytes to enterocytes is elevated. Type 2 lesions show, in addition to an infiltration with intraepithelial lymphocytes, hyperplastic changes of villi. Type 3 desig-nates the typical (but still unspecific) ‘flat mucosa’, and type 4 labels the ‘villus atro-phy’ being specific for GSE, but frequently associated with refractory sprue or intesti-nal lymphoma.
Lesion Preinfiltra-tive
(type 0)
Infiltrative
(type 1)
Infiltrative hyperplastic
(type 2)
Flat destruc-tive
(type 3)
Atrophic hypoplastic
(type 4)
GSE + + + + +
Infective en-teropathy
+ + + +
Tropical sprue + + + +
Graft-versus host disease
+ + +
Transient food sensitivities
+ + +
The symptoms and their severity are not related to the degree of mucosal pathology,
but depend on the extent of small intestinal lesions which are often patchy (198, 244, 147). Hence it is useful to take biopsy from asymptomatic individuals being positive with serological tests, and the finding of ‘normal mucosa’ by traditional histology does not exclude the possibility of GSE. Immunohistochemical methods can reveal latent GSE within ‘normal mucosa’: pathological IgA deposits, high number of immunoglobu-lin-containing cells, and increased density of ã/ä receptor positive intraepithelial T-cells detectable only with these methods might be the only signs of alteration in CD or DH (198, 147, 243, 244, 260). The elevated absolute number of ã/ä receptor bearing intra-

33
epithelial T-lymphocytes is relatively constant, does not depend on the gluten consumption (243), and is a specific sign for GSE.
The diagnosis of DH is based on the immunohistochemical detection of the typical IgA deposits in the papillary dermis found upon perilesional biopsy (96, 276, 239, Fig. 9). Traditional skin histology can only suggest but not prove the disease: microabscesses oc-cur in the dermal papillae containing mainly neutrophils but often also eosi-nophils. In addition, leukocytoclastic vasculitis with lymphohistiocytic cell infiltrates may be present in the upper dermis together with immunoglobulin and complement depositions (96, 225). IgA deposits can also be found in the uninvolved skin during spontaneous or dapsone-induced remission (96), and only disappear in one fifth of patients after a decade (on average 13 years) of a strict GFD (99). A small intestinal biopsy is useful but not crucial for the diagnosis of DH, because the skin and GI symptoms do not correlate, and intestinal lesions can be distributed in a segmental pattern, thus the detection of normal mucosa by traditional histology does not exclude the possibility of DH (96, 167).
2.5.3. Serological tests
Although the intestinal histology is still essential, the less invasive and cheaper sero-logical tests may be helpful in the diagnosis of GSD. In addition, they are more suitable for follow-up of patients and for screening of asymptomatic individuals.
The two major types of Abs produced by the immune system in GSD are directed against gliadin and TGc. However, also other Abs have been reported including those against TGe (239), calreticulin (168), desmin (264), ovalbumin (196), â-lactoglobulin (196), actin (52), and other yet unidentified nuclear, cytosolic, and extracellular proteins (194, 196). In the early 1980s, the anti-gliadin ELISAs became widespread for diagno-sis of GSE, and an association between GSD and circulating IgA EMA was demon-strated (48). Since 1997, anti-TGc Abs have also been assayed. The currently used sero-logical tests are isotype-specific, and detect mainly the disease-specific IgA Abs di-rected either against gliadin (anti-gliadin antibody test = AGA test) or tissue antigens. The tissue antigens currently used for diagnostic purposes include the monkey endo-mysial antigen (EMA test), the reticulin (ARA test performed on monkey liver, kidney, and stomach), and cytoskeletal proteins from the human umbilical cord (umbilical cord test).
IgG Ab based tests are generally either not sensitive or specific enough for GSD di-agnosis in patients with normal serum IgA levels (54). However, IgG based tests are
Fig. 9. Direct immunofluorescence on a skin specimen from a patient with DH at high magni-fication (× 200; bar=25 ì m). Bound IgA was detected by á-chain-specific, fluorescein isothio-cyanate-conjugated rabbit anti-human IgA Abs. The IgA immune complexes resemble the falling snow in the papillary dermis. The IgA deposits are most intensive at and just below the base-ment membrane (arrow heads). IgA can also be detected in the blood vessels (arrows). E, epi-dermis.

34
useful for the diagnosis in patients with selective IgA deficiency, which is known to be associated with GSD (54, 42).
Table V. Sensitivity and specificity of serological tests used for diagnosis of GSE in un-treated CD patients with normal serum IgA levels. Serological tests based on TGc are not included.
IgA class IgG class Test Sensitivity Specificity Sensitivity Specificity
AGA (ELISA) 30-100% (~78%, children: ~95%)
30-100% (~94%) 46-100% (~90%, children: ~95%)
67-100 (~80%, children: ~85%)
EMA (monkey) 80-100 (~95%, children: ~100%)
95-100 (~100%) ~66% ~50%
ARA (rat) 29-100 (~72)% 95-100 (~99%) ~66% ~50%
Umbil. cord tissue or cells (human)
70-100 (~90%, children: ~95%)
95-100 (~100%) data not available data not available
The IgA and IgG AGA tests are currently based on a commercially available ELISA
technique. Their sensitivity and specificity vary from 30% to 100% (Table V, 195, 196, 212). The titre of AGAs is age dependent, thus the AGA ELISA has different cutoff values for children below and above two years of age. While in children, the result of AGA correlates satisfactorily with the mucosal pathology; in adults, AGA can be found in healthy individuals or absent in untreated GSE. With current techniques and stan-dardisation efforts, a sensitivity and a specificity of >90% (in children under two years of age even >95%) can be achieved with IgG and IgA AGA tests (43), but both IgG and IgA AGA are should be tested at the same time.
The IgA-class endomysial Ab (EMA) test (Fig. 10) is considered to be the serologi-cal method of choice with a higher sensitivity and specificity when compared to the IgA-class ARA (on rat tissues) or AGA tests (119, 170, 146). ARA on other monkey tissues than the oesophagus gives similar specificity and sensitivity, but the oesophagus is easier to interprete and more suitable for differential diagnosis of bullous AI skin dis-eases (119, 170). EMA is a less sensitive indicator in children under the age of 2 years (182). EMA is found in approximately 70% of untreated patients with DH (22, 47) and in almost all untreated patients with CD (47). IgG-class EMA test can be performed in patients with IgA deficiency, but results are more difficult to interprete because of the high IgG background usually present in the oesophagus.
As the EMA test is usually performed on expensive oesophagus sections from endan-gered primates, is laborious and time con-suming, and is subjective in borderline cases, a demand for alternative test methods exists. The use of rabbit, rat or guinea pig
Fig. 10. Positive EMA test. IgA antibodies from a CD patient show typical honey-comb-like, endomysial staining with indi-rect immunofluorescence on a monkey oesophagus section (×80 magnification).

35
oesophagus, jejunum or other tissues results in considerable loss of sensitivity (119). However, human umbilical cord sections (171) or immortalised human umbilical vein endothelial cells (287) are alternative substrate tissues offering similar results.
Ultrastructurally, the EMAs (and the jejunal Abs) from CD and DH bind to a non-fibrillar, amorphous component next to collagenous-reticulin fibrils of the connective tissue connecting adjacent smooth muscle cells, smooth muscle bands, and perimysial elastic tissue (148, 150). TGc has now been shown to be the common target of EMA, ARA, and the jejunal Abs in both CD and DH supporting ultrastructural observations (162, 163). Using double-staining investigations, anti-TGc MAb binding patterns were found to be identical with those seen with CD patients’ sera, and CD patients’ sera blocked the binding of anti-TGc MAbs (163). Extraction of TGc from the tissues abol-ished the staining patterns, but they were elicited again after readdition of TGc (163). No GSD patient sera reacting with wild-type mouse tissues elicited any endomysial, reticulin or jejunal bindings in TGc-/- mice, but they showed typical endomysial, re-ticulin or jejunal patterns with the TGc-/- mouse tissues after coating with human TGc (162 and Korponay-Szabó IR et al., personal communication). An ELISA test for GSE based upon the commercially available guinea pig TGc (gpTGc) gave, after optimisa-tion using calcium-activation (71, 259) high sensitivity and specificity (above 90%). However, as the amino acid sequence identity between guinea pig and human TGcs is 82.8% (133, 104), there may be patient Abs directed against epitopes of human TGc (hTGc) not conserved in the gpTGc.
2.5.4. Other tests
In addition to the histology, the presence of malabsorption can also be examined with cheap, simple, and noninvasive methods. The D-xylose test is highly sensitive for CD, and although it is not specific, it correlates excellently with the histological grade of GSE (26, 125). It is also useful in the follow-up. The H2 breath test is not sensitive and specific enough for diagnosis of GSE, but it is important because the results show very good correlation with the severity of the mucosal damage and extent of affected intes-tine (25). Thus it is useful for follow-up or decision on supportive therapy. The leuko-cyte migration test is a suitable tool for detection of dietary failures (125, 126), but be-ing laborious, it is not widely used.
DH symptoms can be induced by a iodine-rich diet or a skin test using iodine if nec-essary.
Laboratory tests listed in Table III, osteodensitometry etc. should be performed partly for additional information to the diagnosis (concomittant disorders may have therapeutic consequences), partly for exclusion of other GI diseases. Determination of the HLA haplotype can also be helpful.
The therapy, complications, and prognosis of CD and DH should be described in a
work about GSD. However, being not related to the experimental part, these topics were omitted from this thesis.

36
3. AIMS
In 1997, Dieterich et al. suggested TGc was the main endomysial autoantigen of CD (69, 72). After optimisation using calcium-activation, an ELISA test based upon the commercially available gpTGc gave high sensitivity and specificity for CD (above 90%) (71, 259). Thus the aim of these studies was to confirm the significance of this finding for diagnostic (screening) and follow-up purposes, and further studies were planned to optimise the assay and especially to detect potential disadvantages. The pro-ject was divided into three parts.
1. The guinea pig TGc (gpTGc) was used to investigate the nature of autoantibodies
directed against TGc (effect of a GFD, association with the EMA signal). This pro-ject will be designated as ‘gpTGc ELISA study’. The sensitivity and specificity of the gpTGc ELISA was determined and compared to the EMA test for diagnosis of GSD. In addition, follow-up sera were studied to detect titre changes during a GFD, and inhibition of endomysial staining were performed with EMA-positive sera with low Ab titres against TGc to see whether autoantigens other than TGc may be re-sponsible for EMA positivity.
2. It was tested whether the performance of the TGc ELISA could be improved by us-ing human TGc (hTGc) as antigen, as patient sera not recognised by the gpTGc ELISA may have Abs directed against epitopes of hTGc not conserved in the guinea pig enzyme (‘hTGc ELISA study’). For this study, hTGc was expressed recombi-nantly, and an ELISA based on the purified protein was established for IgA anti-hTGc Abs. The results of this assay were compared to those from the gpTGc ELISA and the EMA test on monkey oesophagus.
3. Finally, the specificity of the TGc ELISAs was further determined using serum samples from patients having a wide spectrum of different diseases, because in ini-tial studies, certain AI patients without GSD were observed to give positive results in the TGc ELISAs suggesting a general role for TGc in AI processes (‘AI study’). Also patients with non-AI diseases involving enhanced apoptosis and cell lysis and/or putative secondary AI processes e.g. hepatitis or malignancies, where release of TGc could theoretically lead to anti-TGc Ab formation, were included.
The studies have been in part published (240, 241), and I received permission for re-
publication of figures, tables and parts of text in this thesis from the copyright owners (Karl Demeter Verlag and American Association for Clinical Chemistry).
The major part of the study was performed in the Institute for Biochemistry II., Medical Faculty, University of Cologne.
37
4. METHODS
4.1. The gpTGc study
4.1.1. Sera and patients The patients had been examined at the Gastroenterological Departments of Clinic of
Internal Medicine II or Clinic of Pediatrics II and the Department of Dermato-Venereology of the Semmelweis University. The CD diagnosis was confirmed by je-junal biopsy, whereas DH was confirmed by skin biopsy. Sera were obtained from 47 patients with DH, 120 with CD, 96 with non-CD gastrointestinal (GI) diseases, and 117 with other diagnoses (Table VI). Thus altogether 380 serum samples were used. The DH sera consisted of 30 samples from patients with untreated DH, 16 from patients on a complete or incomplete gluten-free diet (GFD), and 1 from a patient on a gluten chal-lenge (GCH). The CD sera consisted of 37 samples from patients with untreated CD, 72 from patients on a complete or incomplete GFD, and 11 on a GCH (Table VI). The CD and DH sera also included 2-3 follow-up samples from 13 patients which were taken before and in different time points (5-49 months) after the introduction of a GFD. All untreated GSD patients were positive for EMA with the exception of two untreated DH patients (Table VI). To compare the sensitivity of the EMA test with that of the gpTGc ELISA, we tested several sera from patients on a complete or incomplete GFD or during a GCH which may contain significantly reduced amounts of Abs against TGc. In this study, GCH was given only to patients with uncertain, ambiguous or contradictory je-junal histology and/or EMA tests before reexamination. Mean ages and sex ratios of the patients are detailed in Table VII. Control patients with non-CD GI diseases had the following diagnoses (number of patients in parentheses): chronic pancreatitis (1), diar-rhea after administration of broad spectrum antibiotics (1), undiagnosed, chronic diar-rhea (4), psychosomatic diarrhea (1), toddler's diarrhea (8), infectious diarrhea (3), diar-rhea due to immunodeficiency (1), irritable bowel syndrome (2), post-enteritis diarrhea (4), post-enteritis lactose intolerance (2), primary adult lactose intolerance (11), fructose intolerance (2), isomaltase deficiency (1), multiple food protein intolerance (3), soy pro-tein intolerance (1), cow’s milk protein intolerance (22), cow’s milk and egg protein intolerance (2), gastroesophageal reflux (5), giardiasis (6), helminthiasis (3), habitual constipation (1), retarded growth (<3 percentile) due to impaired intestinal absorption of various origin (12). Other diagnoses were: anorexia nervosa (1), atopic dermatitis (1), bullous phototoxic contact dermatitis (1), retarded growth due to chronic adenoiditis (1), retarded growth due to feeding failure (2), retarded growth of other than GI origin (19), familiar retarded growth (3), somatomental retardation (1), cystic fibrosis (1), Silver-Russel syndrome (1), systemic lupus erythematosus (1), insulin dependent diabetes mel-litus (1), primary liver carcinoma (1), prolonged microcyter anemia (5), cholelithiasis (1), neuroblastoma (1), herpes gestationis (1), ichthyosis (31), IgA-pemphigus (3), lin-ear IgA bullous dermatosis (3), pemphigus foliaceus (1), pemphigus seborrhoicus (1), urticaria (1), cryofibrinogenemic skin vasculitis (1), CD patients’ healthy relatives (21), healthy individuals (13). No patient or healthy individual in this study had IgA-deficiency. All serum samples were stored at -78°C until assayed.

38
Table VI. Number and percentage of total, EMA positive (EMA⊕) and TGc ELISA positive (TGc⊕) serum samples and serum Ab titres against TGc
Diagnosis
TN of
SS
% of SS
EMA⊕ SS TGc⊕ SS
No. % of TN No. % of TN
TIT (AU)
CD 120 31.6 73 60.8 65 54.2 18.7 CD, on a GFD 72 19 34 47.2 27 37.5 10.3 CD, untreated 37 9.7 37 100 35 94.5 70.6 CD, on a GCH 11 2.9 2 18.2 3 27.3 8.2 DH 47 12.4 36 76.6 35 74.5 26.3 DH, on a GFD 16 4.2 7 43.8 7 43.8 13.2 DH, untreated 30 7.9 28 93.3 27 90 37.3 DH, on a GCH 1 0.3 1 100 1 100 84.8 Non-CD GI diseases 96 25.2 0 0 0 0 8.2 Others 117 30.8 0 0 3 2.6 8.5 All samples 380 100 109 28.7 103 27.1 9.3
Abbreviations: SS: serum samples; EMA⊕: EMA positive; TGc⊕: TGc ELISA positive; No.: number; TN: total number; TIT, median serum Ab titres against TGc in AU.
Table VII. Age at the time of blood sampling (years) and sex of patients
Diagnosis
Male/female
Mean age
Minimum age
Maximum age
CD 50/70 11.6 0.8 66 CD, on a GFD 31/41 9.4 0.8 26 CD, untreated 13/24 16.7 1.3 66 CD, on a GCH 6/5 9.6 4.2 16 DH 24/23 30.2 8.8 71 DH, on a GFD 8/8 25.7 10.3 45 DH, untreated 15/15 32.9 8.8 71 DH, on a GCH 1/0 19 19 19 Non-CD GI diseases 50/46 5.7 0.4 31 Others 52/65 16.2 0.7 78 All samples 176/204 13.8 0.4 78
Abbreviations: GCH, gluten challenge; GFD, gluten-free diet; GI, gastrointestinal.
4.1.2. Indirect immunofluorescence (EMA test) Serum IgA Abs were measured by an indirect immunofluorescence method (54). All
serum samples were diluted 1:5 (or up to 1:40 where necessary) in phosphate-buffered saline (PBS, pH 7.4). Cryostat tissue slides (6 ìm) of the aboral part of the monkey
39
(Cercopithecidae family) oesophagus were used as antigen. Bound IgA was detected by á-chain-specific, fluorescein isothiocyanate-conjugated rabbit anti-human IgA Abs (1:40 in PBS; Dako). All sera used in these studies were indisputably negative or posi-tive for IgA EMA.
4.1.3. ELISA
The ELISA method will be described under 4.2.7.
4.1.4. Inhibition of EMA Nine sera from CD or DH patients with EMA positivity and low serum IgA Ab titres
against the gpTGc were diluted to various concentrations (between 1:5-1:40, to the highest still positive concentration) in PBS, pH 7.4 and 50 mM Tris/HCl, pH 7.5, and incubated 2 hours and/or overnight in a shaking incubator with 20 ìg gpTGc (SIGMA) dissolved in 50 mM Tris/HCl, pH 7.5 at room temperature. The treated serum dilutions were then examined for EMA on monkey oesophagus sections as described above.
4.1.5. Statistics
The statistical methods will be described below (4.2.8).
4.2. The hTGc study
4.2.1. Sera and patients The patients overlapped in part with those described above (4.1.1). Serum samples
were taken from 71 patients with untreated GSD (33 with DH and 38 with CD), 26 with non-CD GI diseases (such as Crohn disease, food hypersensitivity, food intolerance, intestinal infection, reflux oesophagitis, non-CD diarrhoea, and alimentary dystrophy), and 27 with other diagnoses, such as AI diseases (systemic lupus erythematosus and diabetes mellitus type I), different skin disorders (pemphigus foliaceus, ichthyosis, and urticaria), cholelithiasis, hepatosplenomegaly, retarded growth of other than GI origin, as well as healthy controls. The mean ages and sexes of patient groups are presented in Table VIII. To obtain data on the sensitivity of the TGc ELISA, we included in the cur-rent study sera from 16 treated patients (patients on a GFD). All serum samples were stored at -78 °C until assayed.
Table VIII. Age at the time of blood sampling (years) and sex of patients
Diagnosis
Male/female
Mean age
Minimum age
Maximum age
CD 20/18 18.5 3 51 DH 13/20 30.2 6 74 Non-CD GI diseases 14/12 17.4 1 78 Others 14/13 17.0 12 53 All samples 61/63 20.8 1 78

40
4.2.2. Sodium dodecyl sulphate polyacrylamide gel electrophoresis (SDS-PAGE) and immunoblotting
SDS-PAGE was performed according to the method of Laemmli (172) using a 12% polyacrylamide separating gel with a 5% polyacrylamide stacking gel. Samples were reduced by addition of 2% (v/v) 2-mercaptoethanol. Proteins were detected either by staining with Coomassie Brilliant Blue R (Serva) or by immunoblotting after electro-phoretic transfer to a nitro-cellulose membrane (Protran®, Schleicher & Schuell) (269). After protein transfer, the membranes were stained with Ponceau S (Serva), then blocked with 50 mM Tris, 150 mM NaCl, pH 7.4 (TBS) containing 5% non-fat milk powder for 75 min. at room temperature. The blocked membrane was incubated with a mixture of two mouse monoclonal Abs (MAbs) against TGc (specific for TGc, but cross-reacting both with human and gpTGc, Neomarkers, designated as clones CUB7402 and TG100) diluted 1:2000 in TBS containing 5% non-fat milk powder and 0.05% Tween 20 (Sigma) for 1.5 hours at room temperature. For detection of bound mouse Abs, membranes were incubated with horse radish peroxidase labelled rabbit Abs directed against mouse immunoglobulins (Dako), diluted 1:2000 in TBS/Tween containing 5% non-fat milk powder for 1 hour at room temperature. Bound secondary Abs were detected using the enhanced chemiluminescence system (ECL Kit, Amer-sham). GpTGc (Sigma) was used each time as a positive control.
4.2.3. Recombinant expression of hTGc
4.2.3.1.Construction of the vector
The episomal eukaryotic expres-sion vector pCEP-Pu/BM40SP, pro-duced from pCEP4 (Invitrogen) (158), was modified to introduce a sequence encoding the Strep II tag (Institut für Bioanalytik, Germany) and a stop codon into the multiple cloning site. The primers 5’-GGCCGCATGGAGCCATCCACAATTCGAAAAGTA and 5’-GGCCTACTTTTCGAATGCTGGATGGCTCCATGC were an-nealed together and introduced into the Not I site thus constructing a vector (pCEP-Pu/BM40SP/C-Strep) producing a carboxyterminal Strep II fusion protein suitable for strepta-vidin affinity purification by a StrepTactin® (Institut für Bioana-lytik, Germany) affinity column as described before (246). We received the full-length human TGc cDNA (accession number M55153, cloned in pSP73) from Dr. Daniel Aeschli-mann, Division of Orthopaedic Sur-
Fig. 11. The pCEP-Pu/TGc/C-Strep episomal eu-karyotic expression vector which enabled to express recombinant human TGc in human embryonic kid-ney cells where its production was under the control of the intermediate early CMV promoter. The TGc protein was fused in frame to a C-terminal Strep II tag so that it could be readily purified from cell lys-ates by affinity chromatography.
TGc
NNoo ttII
NNoo ttIISV 40 pA tag
HHiinn dd IIIIII
UTR
33'' 55''
ppCCEEPP--PPuu 99..5511 kkbb
SS ttoopp

41
gery, University of Wisconsin. This cDNA was amplified by polymerase chain reaction (PCR) using the 5’-primer 5’-ATTAAGCTGCCCGCCACCATGGCCGAGAGCT GGTC, and the 3’-primer 5’-TAAGCGGCCGCGGGGCCAATGATGACATTC. The 5’-primer introduced a new Hind III restriction site and a Kozak’s translation initiation sequence, the 3’-primer inserted a new Not I restriction site and removed the stop codon. The Hind III/Not I restriction enzyme digested PCR product was purified and inserted at the same restriction sites of the pCEP-Pu/BM40SP/C-Strep, in order to ob-tain the final expression vector pCEP-Pu/TGc/C-Strep. The correct insertion and se-quence of the full construct was verified by cycle sequencing using the ABI Prism Big Dye Terminator Cycle Sequencing Ready Reaction Kit and the products were resolved on an ABI Prism 377 Automated Sequencer (Perkin-Elmer/Applied Biosystems).
4.2.3.2.Transfection, cell culture and protein purification
Human embryonic kidney cells (293-EBNA; Invitrogen) were transfected episomally with pCEP-Pu/TGc/C-Strep. The cells were cultured in Dulbecco’s MEM NUT MIX F-12 (Life Technologies) medium containing 10% foetal bovine serum (Life Technolo-gies), 1% L-glutamine (Life Technologies), 200 IU/ml penicillin (Life Technologies), and 200 mg/l streptomycin (Life Technologies). Cells were selected with 0.5 mg/l pu-romycin (Sigma).
After the removal of the media, the cells were washed with cold (4 °C) 0.25 M su-crose and lysed mechanically in the same solution. The lysate was cleared of particulate material by centrifugation at 27,200g for 30 min at 4 °C, followed by ultracentrifugation of the supernatant at 210,000g for 60 min at 4 °C. The supernatant was filtered with cheesecloth and 1 mM phenylmethylsulfonyl fluoride (PMSF, Fluka) was added as pro-teinase inhibitor; 12 ml of the supernatant was then passed over a StrepTactin affinity coloumn of 3 cm3 volume equilibrated with sterile filtered 50 mM Tris-HCl, pH 7.5, containing 1 mM ethylenediamine tetraacetate (EDTA) at 4 °C and at a flow rate of 0.4 ml/cm2/min. After extensive washing with equilibration buffer containing 1 mM PMSF at a flow rate of 0.9 ml/cm2/min, the protein was eluted with equilibration buffer con-taining 1 mM PMSF and 2.5 mM desthiobiotin (Sigma) at a flow rate of 0.4 ml/cm2/min. Fractions (2 ml) were collected. The purification was controlled by Coomassie-stained SDS-PAGE and immunoblotting with MAbs against TGc as de-scribed above. The protein concentration was estimated by SDS-PAGE and measured using the bicinchoninic acid protein assay reagent (Pierce) according to the supplier’s protocol.
4.2.4. TGc activity assay
TGc activity was measured by incorporation of [1,4-3H]putrescine (Amersham) for 30 min at 37 °C as described previously (4), the buffer used contained 22.5 mM dithio-threitol to reduce any oxidised sulfhydryl groups important for catalytic activity.
4.2.5. Mass spectrometry
Mass spectrometry was performed by matrix-assisted laser desorption using a Bruker Reflex III instrument equipped with a high mass detector for linear detection. Sinapinic acid was used as the matrix, and external calibration was carried out using singly, dou-bly, and triply charged molecular ions of protein A.

42
4.2.6. EMA test The EMA test was performed as described above (4.1.2).
4.2.7. ELISA The ELISA method was similar to the calcium-activated test described previously
(71, 259). Ninety-six-well microtitre plates (Nunc MaxiSorp) were coated with 1 ìg gpTGc (Sigma) or hTGc in 100 ìl of 50 mM Tris-HCl, pH 7.5, containing 5 mM CaCl2 per well at 4 °C overnight (at least 9 h). No blocking was used. After each step, the wells were washed with 50 mM Tris-HCl containing 10 mM Na2-EDTA and 0.1% Tween 20 (TET). Sera were diluted to various concentrations with TET, and incubated on the plates for 1.5 h at room temperature. Bound IgA was detected by peroxidase-conjugated Ab against human IgA (Dako), diluted 1:4000 in TET and incubated for 1 h at room temperature. The colour was developed by the addition of 100 ìl of 60 ìg/ml 3,3’,5,5’-tetramethylbenzidine substrate in 100 mM sodium acetate, pH 6.0, containing 0.015% H2O2 for 5 min at room temperature. The reaction was stopped by adding 100 ìl of 20% H2SO4. The absorbance was read in an ELISA reader at 450 nm.
The amount of protein and the serum concentrations used in the test were optimised. All serum samples were examined in triplicates, and triplicates of a negative and a posi-tive reference serum as well as a buffer blank were included in each assay. The Ab con-centrations were expressed in arbitrary units (AU), i.e., as percentages of the positive reference serum.
To obtain data on the effects of calcium activation, an experiment in which wells were coated with human TGc without CaCl2 in the coating buffer was also performed.
4.2.8. Statistics
Absorbances (and thus titres given in AU values) did not show gaussian distribution; thus for statistical description of titres from the different patient groups, medians with their 95% confidence intervals (95% CIs) (98) are presented, and for comparison, the Mann-Whitney nonparametric, unpaired, two-tailed test was used (286). For describing correlation of titres, the Spearman correlation coefficient with its 95% CI and correla-tion analysis for unpaired data of nongaussian distribution were used calculating two-tailed P values (98, 286). For comparison of titres in the calcium-activated and unacti-vated hTGc ELISA, the Wilcoxon two-tailed signed-rank test was performed (286). For description and comparison of the two ELISA systems, the receiver operating character-istic (ROC) curves and the areas under the ROC curves (AUCs) with their 95% CIs are presented (66, 209, 121). For calculating confidence intervals of AUCs, a bootstrap technique, the bias-corrected and accelerated (BCa) confidence interval method (209, 121), was applied in addition to the most frequently used method (66) because it is more appropriate for describing confidence intervals of AUCs that are very close to the maximum (1.0).
4.3. The AI study
4.3.1. Sera and patients The sera were obtained from the Gastroenterological Departments of Clinic of Inter-
nal Medicine II or Clinic of Pediatrics II, the Department of Dermato-Venereology of

43
the Semmelweis University, the Departments of Internal Medicine I-IV of the Medical Faculty of the University of Cologne, and from the Laboratory for Autoimmune Dis-eases of the Wieslab Company, Sweden. Serum samples were taken from 304 AI pa-tients, and 95 patients with GSD including untreated CD and DH patients (for numbers and diagnoses see Table IX). Sera from patients with psoriatic arthritis, hepatitis C, and different malignancies were also studied (Table IX). The term ‘malignancies’ includes two patients with primary liver carcinoma, three patients with thyroid gland carcinoma, and single cases with neuroblastoma, gastric carcinoma, hypernephroma, rectal adeno-carcinoma, plasmocytoma, and a tumor of unknown origin giving metastases in liver, mediastinal lymphnodes, and bones. Twenty six of the 84 controls were healthy indi-viduals while 58 had various non-AI diseases (Table X). Thus altogether 605 serum samples were analysed. The mean age and sex of the patient groups are presented in Table IX. All serum samples were stored at -78 °C until assayed.
Table IX. Age, sex, and median±95% CI of serum IgA Ab concentrations against the
hTGc in controls and patients subdivided into diagnostic categories.
Diagnosis CD DH CTR PV BP CU GP CR
n 39 56 84 48 32 20 20 31
Mean age 17.5 33.9 19.4 51.9 67.0 48.3 72.8 41.4 Min.-max. age 1-66 6-74 6-56 9-85 39-92 28-76 49-97 15-99
Males/females 14/25 32/24 38/46 21/27 17/15 9/11 11/9 18/13
Median (AU) 89.5 63.5 12.1 13.2 14.1 20.9 23.8 20.9 95% CI (AU) 74.2-98.3 51.3-76.1 11.2-13.0 11.3-15.7 12.0-16.4 17.8-24.4 17.2-28.2 15.2-26.4
Diagnosis WG RA SLE PSS APS PA HC TU
n 20 41 49 30 13 11 100 11
Mean age 71.9 59.8 39.5 59.8 41.4 50.5 42.6 54.0 Min.-max. age 30-89 33-77 18-61 39-79 26-60 29-67 20-71 19-74
Males/females 12/8 2/15 1/24 13/17 4/8 5/6 58/42 6/5
Median (AU) 25.0 19.2 20.0 20.5 15.3 14.7 14.3 17.4 95% CI (AU) 19.9-32.7 16.1-22.6 15.0-25.2 17.5-23.6 13.3-19.0 12.1-20.6 13.5-15.3 12.2-36.6
Non-standard abbreviations see Fig. 19 on page 52.
The diagnoses of the AI diseases were confirmed by the following guidelines: CD: jejunal biopsy pathology and EMA-positivity (203, 283). DH, pemphigus vulgaris and bullous pemphigoid: conventional skin histology, direct and indirect immunofluores-cence. Ulcerative colitis and Crohn disease: a combination of clinical, radiological, en-doscopical, and histological signs. Goodpasture’s syndrome: clinical symptoms together with immunofluorescence showing autoantibodies against glomerular basement mem-brane. Wegener’s granulomatosis: 1990 American College of Rheumatology criteria; in addition, positivity for PR3-ANCA Abs (178). Rheumatoid arthritis, SLE and systemic sclerosis: American College of Rheumatology (former American Rheumatism Associa-tion) criteria (15, 263, 199). Primary antiphospholipid syndrome: clinical symptoms; at least one of the typical laboratory changes (positivity for lupus anticoagulant or anti-
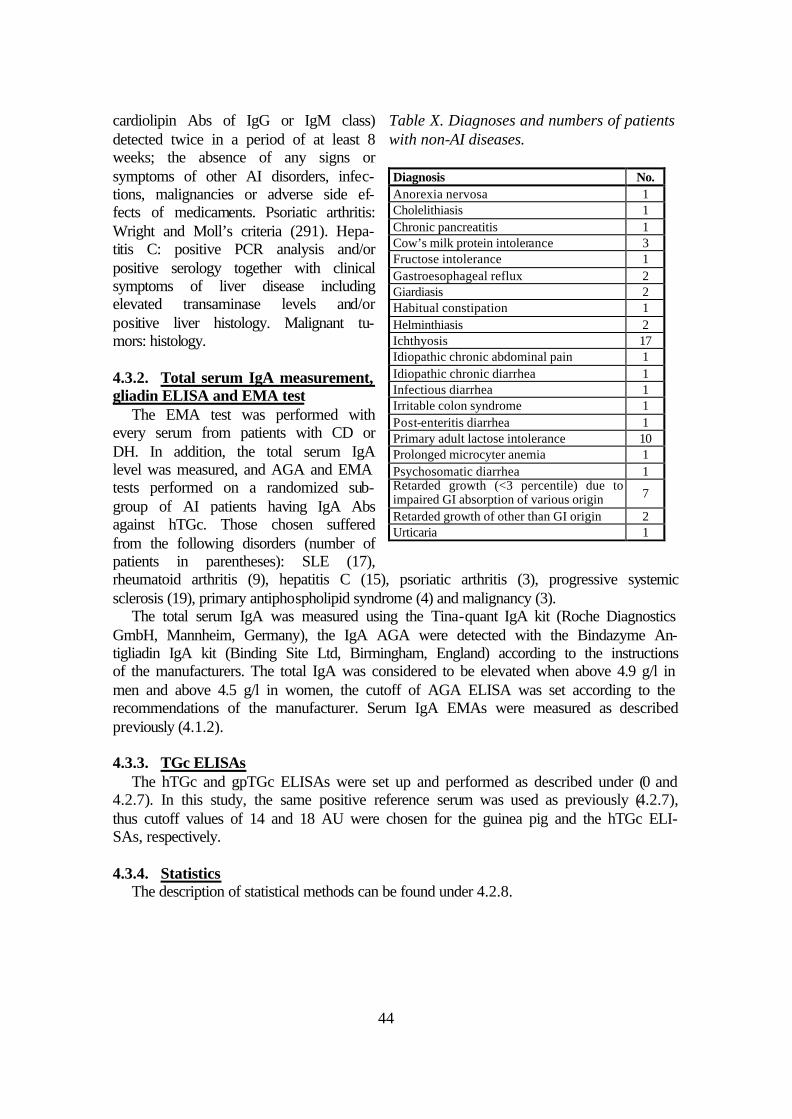
44
cardiolipin Abs of IgG or IgM class) detected twice in a period of at least 8 weeks; the absence of any signs or symptoms of other AI disorders, infec-tions, malignancies or adverse side ef-fects of medicaments. Psoriatic arthritis: Wright and Moll’s criteria (291). Hepa-titis C: positive PCR analysis and/or positive serology together with clinical symptoms of liver disease including elevated transaminase levels and/or positive liver histology. Malignant tu-mors: histology.
4.3.2. Total serum IgA measurement, gliadin ELISA and EMA test
The EMA test was performed with every serum from patients with CD or DH. In addition, the total serum IgA level was measured, and AGA and EMA tests performed on a randomized sub-group of AI patients having IgA Abs against hTGc. Those chosen suffered from the following disorders (number of patients in parentheses): SLE (17), rheumatoid arthritis (9), hepatitis C (15), psoriatic arthritis (3), progressive systemic sclerosis (19), primary antiphospholipid syndrome (4) and malignancy (3).
The total serum IgA was measured using the Tina-quant IgA kit (Roche Diagnostics GmbH, Mannheim, Germany), the IgA AGA were detected with the Bindazyme An-tigliadin IgA kit (Binding Site Ltd, Birmingham, England) according to the instructions of the manufacturers. The total IgA was considered to be elevated when above 4.9 g/l in men and above 4.5 g/l in women, the cutoff of AGA ELISA was set according to the recommendations of the manufacturer. Serum IgA EMAs were measured as described previously (4.1.2).
4.3.3. TGc ELISAs
The hTGc and gpTGc ELISAs were set up and performed as described under (0 and 4.2.7). In this study, the same positive reference serum was used as previously (4.2.7), thus cutoff values of 14 and 18 AU were chosen for the guinea pig and the hTGc ELI-SAs, respectively.
4.3.4. Statistics
The description of statistical methods can be found under 4.2.8.
Table X. Diagnoses and numbers of patients with non-AI diseases. Diagnosis No. Anorexia nervosa 1 Cholelithiasis 1 Chronic pancreatitis 1 Cow’s milk protein intolerance 3 Fructose intolerance 1 Gastroesophageal reflux 2 Giardiasis 2 Habitual constipation 1 Helminthiasis 2 Ichthyosis 17 Idiopathic chronic abdominal pain 1 Idiopathic chronic diarrhea 1 Infectious diarrhea 1 Irritable colon syndrome 1 Post-enteritis diarrhea 1 Primary adult lactose intolerance 10 Prolonged microcyter anemia 1 Psychosomatic diarrhea 1 Retarded growth (<3 percentile) due to impaired GI absorption of various origin 7
Retarded growth of other than GI origin 2 Urticaria 1

45
5. RESULTS
5.1. The guinea pig TGc study
ELISAs based upon the commercial gpTGc were derived and compared to the EMA test for diagnosis of GSD. Follow-up sera were studied to detect titre changes during a GFD, and inhibition of endomysial staining were performed with EMA-positive sera to study whether autoantigens other than TGc may be responsible for EMA positivity. 5.1.1. Guinea pig TGc ELISA
The mean intra- and interassay coefficients of variation of the positive standard serum were 2.5% and 9.1%, respectively. The mean intra- and interassay coefficients of variation (using serum titres given in arbitrary units) for the other sera were 4% (n = 379) and 14% (n = 30), respectively. The median Ab concentration was 55.0 AU (95% CI, 37.8-69.8 AU; n = 67) for the patients with untreated GSD (CD or DH), and 8.4 AU (95% CI, 8.1-8.7 AU; n = 213) for controls; the difference was significant (P <0.0001). The median Ab concen-tration was 70.6 AU (95% CI, 57.0-85.6 AU; n = 37) for the pa-tients with untreated CD, and 37.3 AU (95% CI, 26.3-53.3 AU; n = 30) for the patients with untreated DH; the difference was significant (P = 0.0011). The median Ab concentration was 10.5 AU (95% CI, 9.3-14.7 AU; n = 88) for GSD patients on GFD, 8.2 AU (95% CI, 6.8-75.3 AU; n = 12) for patients on GCH, 8.2 AU (95% CI, 7.8-8.7 AU; n = 96) for controls with GI diseases, and 8.5 AU (95% CI, 8.2-8.9 AU; n = 117) for healthy individuals and controls with other diagnoses. No signifi-cant difference was found between the Ab concentrations of these latter patient groups. The AUC was 0.979 (Fig. 12).
Based upon the ROC analysis, a cutoff value of 15.5 AU was chosen, and sera with Ab concentrations �15.5 AU were labeled as gpTGc ELISA positive. This cutoff value gave (excluding patients on a GFD or a GCH) a specificity and a sensitivity of 98.6% (95% CI, 97.2-100%) and 92.5% (95% CI, 89.5-95.6%), respectively. The coincidence of the results gpTGc assay with the clinical diagnoses (excluding treated patients) was 272 of 280 (97.1%), giving 3 false-positive and 5 false-negative results (Fig. 13).
One of the patients with false-positive sera had primary liver carcinoma, the other two patients had IgA-pemphigus; all the 3 patients were females. Three sera from pa-
0.0
0.2
0.4
0.6
0.8
1.0
0.0 0.2 0.4 0.6 0.8 1.01-Specificity
Sens
itivi
ty
Fig. 12. The ROC curve for the gpTGc ELISA. The circle shows the point of greatest efficiency of the test upon which the cutoff level was chosen.

46
tients with CD and two samples from patients with DH were false-negative, the latter two false-negative samples were also negative for EMAs.
All of the 13 follow-up sera were EMA-positive and had elevated serum IgA Ab ti-tres against the gpTGc before the introduction of a GFD. Changes during the GFD are presented in Fig. 14. With the exception of two cases, a reduction of the titres could be seen on the GFD, even if in the vast majority of the cases the result of the EMA test did not change. In one case, an 11-year-old girl with CD showed elevation of titres after 5 months which was correlated with gliadin consumption, and following a strict dietary regimen, the titres fell to normal after a year (data not shown). In a male with DH, after the EMA test had become negative, EMA positivity was detected again in parallel with elevation of IgA Ab titres against TGc indicating dietary failure.
5.1.2. Comparison of the EMA test with the guinea pig TGc ELISA
The results of the EMA and gpTGc ELISA tests coincided in 364 of 380 cases (95.8%). The EMA test gave a false-negative result for 2 sera from untreated DH pa-tients, these sera were also negative in the TGc ELISA.
Eleven of 109 EMA-positive samples (10.1%) were false-negative in the TGc ELISA including also sera from patients on a GFD or a GCH. One of the false-negative sam-ples was from an untreated DH patient, two from untreated CD patients, and the rest from CD patients on a GFD.
TGc ELISA positivity with EMA negativity was detected in two sera from patients with GSD, one on a GFD (21.5 AU), the other on a GCH (19.5 AU). The three false-positive sera with TGc ELISA from control patients were diagnosed as negative with the EMA test. Compared to the EMA results, including only untreated GSD patients and using the same cutoff level, the specificity and sensitivity of the gpTGc ELISA method was 98.6% (95% CI, 97.2-100%) and 95.4% (95% CI, 93.0-97.9%), respectively. In-
0102030405060708090
100110120
AU
I II III IV
198
Fig. 13. Serum concentrations of IgA Abs against TGc in the gpTGc ELISA. The following patient groups are presented: I, controls (�, with GI diseases; �, with others); II, untreated pa-
tients; III, patients on a GFD; IV, patients on a GCH having CD (�) or DH (�). The box in the control group represents 198 individuals with a serum concentration of IgA Abs against TGc less than 12.4 AU. The chosen arbitrary cutoff level for positivity (dashed line) is drawn at the AU of 15.5.

47
cluding also patients on a GFD or a GCH, the sensitivity of the gpTGc ELISA was lower (89.9%; 95% CI, 86.9-92.9%).
5.1.3. EMA inhibition
Nine sera with EMA positiv-ity and serum IgA Ab activity against TGc lower than 11.5 AU were used. One of the sam-ples was from an untreated CD patient, another one from an untreated DH patient, and the rest (7 sera) from CD patients on a GFD. The evaluation was difficult because TGc alone gave non-specific fluorescence on the esophagus sections re-sulting in higher background. In four samples, the endomysial immunofluorescence could be abolished. In four cases, a sig-nificant reduction of the signal could be detected, but the high background did not allow the differentiation between com-plete absence of the signal or its reduction with some residual immunofluorescence. One sam-ple from a CD patient on a GFD with a very low Ab titre (6.7 AU) remained positive.
5.2. The human TGc study
To test whether the performance of the TGc ELISA could be improved, recombinant human TGc was produced and used as the basis of an ELISA. This was compared to results from a gpTGc based assay and EMA tests on monkey oesophagus. 5.2.1. Recombinant human TGc
The hTGc was expressed in the 293-EBNA human embryonic kidney cell line as a fusion protein with the Strep II tag. The protein could be purified in a single step by affinity binding to a StrepTactin coloumn; on washing with desthiobiotin, the protein eluted as a single band with an estimated molecular mass of 87 kDa (Fig. 15A) when visualised by Coomassie-stained SDS-PAGE. Immunoblot analysis showed that the band reacted with MAbs against TGc (Fig. 15B). The coloumn bound almost all the tagged protein with no immunoreactivity appearing in the flow through (Fig. 15B). The yield from the lysate of a confluent cell monolayer in a cell culture dish of 13 cm diameter was ~200 ìg. The molecular mass calculated from the sequence of the hTGc is
Fig. 14. Changes of serum IgA antibody titres against TGc in 13 patients after introduction of a GFD (GCD, gluten containing diet). The lines connect points representing titre values from the same patient. EMA-negative samples are shown by empty circles, EMA-positives by full points. Serum samples were taken at different time points after introduction of the GFD. Serum titres drop even if the EMA results are still positive, which can be useful in clinical practice by showing patient compliance.
0
1020
30
40
5060
70
80
90100
110
120
GCD GFD GFD
AU

48
ameter was ~200 ìg. The molecular mass calculated from the sequence of the hTGc is 77.3 kDa, and the calculated molecular mass of the fusion protein (TGc having a C-terminal tag of 10 amino acids) is 78.4 kDa. Mass spectrometry of the fusion protein gave a molecular mass of 78.3 kDa. In cell lysates, the activity of the expressed human TGc was 4.7-fold higher than the background activity of TGs present in untransfected 293-EBNA cells. The freshly purified hTGc showed similar or higher activity than the gpTGc from Sigma, but it lost activity on storage. It is not known whether the hTGc has the same catalytic activity as the guinea pig enzyme.
5.2.2. Performance of the human TGc ELISA The optimal coating concentration of hTGc was 1 ìg per well. Using highly positive
sera from four patients for calibration, we obtained a log-linear curve between dilutions of 1:250 and 1:32,000. Four negative sera showed some signal at lower dilutions (>1:500). Some positive sera showed a signal plateau at dilutions of 1:250 or less. The ratio between the mean absorbance values of positive and negative results at the dilution of 1:125 was 1:6, whereas at higher dilutions, it was >1:10. Hence, in the assay a serum dilution of 1:250 was used. One positive and one negative reference serum sample was included in each assay to control the test performance. The positive serum was used as the ‘standard’, and the absorbance results were given as AU, calculated as a percentage of the standard serum. The mean intra- and interassay coefficients of variation for the positive standard serum were 1.3% and 13.7%, respectively. The mean intra- and inter-
43
30
67
94
I II III IV
94
67
43
30
I II III IV
A B
Fig. 15. SDS-PAGE (A) and immunoblot (B) analysis of TGc. The immunoblot was performed using monoclonal antibodes against TGc. Positions of molecular mass standards (kDa) are indi-cated on the left. Lane I, guinea pig TGc; lane II, lysate of cells producing recombinant human TGc before purification; lane III, flow through; lane IV, eluted TGc from the column.

49
assay coefficients of variation (using serum titres given in AUs) for the other sera tested in the hTGc ELISA were 3.2% (n = 124) and 9.2% (n = 15), respectively.
The median Ab concentration was 61.4 AU (95% CI, 45.1-78.5 AU; n = 55), for pa-tients with untreated GSD (CD or DH) and 12 AU (95% CI, 10.8-13 AU; n = 53) for controls; the difference was significant (P < 0.0001). The median Ab concentrations were 74.2 AU (95% CI, 47.7-86.7 AU; n=25) and 49.4 AU (95% CI, 39.7-63.0 AU; n=30) for untreated patients with CD and DH, respectively; the difference was not sig-nificant (P=0.1142). The median Ab concentration was 48.1 AU (95% CI, 20.8-85.6 AU; n = 16) for treated patients, 12.1 AU (95% CI, 9.8-14.7 AU; n = 26) for controls with gastrointestinal diseases, and 12 AU (95% CI, 10.7-13.0 AU; n = 27) for healthy individuals and controls with other diagnoses. The AUC was 0.999 (95% CI, 0.996-1.001; 95% CI with BCa method, 0.990-1.0; Fig. 16A).
A cutoff value of 18 AU was chosen, and sera with Ab concentrations �18 AU were labelled as hTGc ELISA positive. This cutoff value gave a specificity and a sensitivity of 98.1% (95% CI, 95.7-100%) and 98.2% (95% CI, 95.9-100%), respectively (treated patients were excluded). The coincidence of the hTGc assay with the clinical diagnosis (excluding treated patients) was 106 of 108 (98.1%), giving one false-positive and one false-negative result (Fig. 16A).
5.2.3. Performance of the guinea pig TGc ELISA
The optimal coating concentration of gpTGc was 1 ìg per well, and the optimal se-rum dilution 1:250, as with the hTGc ELISA. Each assay was performed parallel to the hTGc assay at the same time, and the same serum samples and serum dilutions were used. The mean intra- and interassay coefficients of variation of the positive standard serum were 2.2% and 9.0%, respectively. The intra- and interassay coefficients of varia-tion (using serum titres given in AUs) for the other sera tested in the gpTGc ELISA were 2.8% (n = 124) and 12.8% (n = 15), respectively.
0
10
20
30
40
50
60
70
80
90
100
110
120A
U
I II
0
10
20
30
40
50
60
70
80
90
100
110
120
AU
I II
Fig. 16. Serum concentrations of IgA antibodies against TGc in controls (I) and in patients hav-ing CD or DH (II; �, untreated; �, treated CD or DH patients). A, the hTGc ELISA. B, the guinea pig TGc ELISA. The chosen arbitrary cut-off level for positivity (broken line) is drawn at the AU of 18 or 14, respectively. The ROC curves are shown as insets.

50
The median Ab concentration was 51.8 AU (95% CI, 34.2-63 AU; n = 55) for the pa-tients with untreated GSD (CD or DH), and 8 AU (95% CI, 7.3-8.9 AU; n = 53) for con-trols; the difference was significant (P < 0.0001). The median Ab concentration was 18 AU (95% CI, 9.2-69.9 AU; n = 16) for treated patients, 7.5 AU (95% CI, 6.6-9 AU; n = 26) for controls with GI diseases, and 8.5 AU (95% CI, 7.2-10.3 AU; n = 27) for healthy individuals and controls with other diagnoses. The AUC was 0.980 (95% CI, 0.958-1.002; 95% CI with BCa method, 0.943-0.993; Fig. 16B).
A cutoff value of 14 AU was chosen, and sera with Ab concentrations �14 AU were labelled as gpTGc ELISA positive. This cutoff value gave (excluding treated patients) a specificity and a sensitivity of 96.2% (95% CI, 92.8-99.6%) and 92.7% (95% CI, 88.1-97.3%), respectively. The coincidence of the gpTGc assay with the clinical diagnosis (excluding treated patients) was 102 of 108 (94.4%), giving 2 false-positive and 4 false-negative results (Fig. 16B).
5.2.4. Effects of Ca2+-activation
Thirty-two serum samples were tested in the ELISA for IgA Abs against hTGc with and without calcium-activation. The overall Ab titres did not show a significant differ-ence (P = 0.27). However, sera with anti-TGc titres <30 AU in the calcium-activated assay were significantly lower in the assay without calcium activation (n = 18; P = 0.009), whereas higher titres were not significantly different (n = 14; P = 0.35).
5.2.5. Comparison of EMA test with TGc ELISA
Excluding treated patients, with the exception of one false-positive result, all of the patients with EMA-positive sera had GSD (55 of 56, 98.2%). Twelve of 16 (75%) treated patients with GSD were positive for EMAs. Comparing only the untreated EMA-positive cases, the results of human and gpTGc ELISAs coincided with the EMA test in 54 of 56 (96.4%) and 51 of 56 (91.1%) cases, respectively. The serum that gave a false-positive result in the EMA test was negative in both the human and the gpTGc ELISAs. The one serum that gave a false-negative result in the hTGc ELISA was also negative in the gpTGc ELISA. The 12 patients on incomplete GFDs with EMA positiv-ity had also positive anti-TGc IgA titres with both ELISA systems.
All patients negative for EMAs were either treated patients having GSD or patients not having GSD. Comparing only the untreated EMA-negative cases, the results of the human and gpTGc ELISA coincided with the EMA test in 51 of 52 (98.1%) and 50 of 52 (96.2%) cases, respectively. The one serum that gave a false-positive result in the hTGc ELISA was also positive in the gpTGc ELISA; in addition, another serum that gave a false-positive result was detected by the guinea pig assay. Both false-positive sera were from patients with Crohn disease. The four EMA-negative patients with treated GSD were also negative by gpTGc ELISA, but one of them was positive by hTGc ELISA.
The overall coincidence of the EMA test with human and gpTGc ELISA was 120 of 124 (96.8%) and 117 of 124 (94.4%), respectively.
5.2.6. Comparison of human TGc ELISA with guinea pig TGc ELISA
The results of the two ELISAs coincided in 119 of 124 (96%) of all tested sera. In four discordant cases, the human assay was more sensitive than the guinea pig assay, giving positivity in the human assay. One of the sera was from an EMA-negative CD patient on a gluten-free diet. In the fifth discordant case, the gpTGc ELISA gave a false-
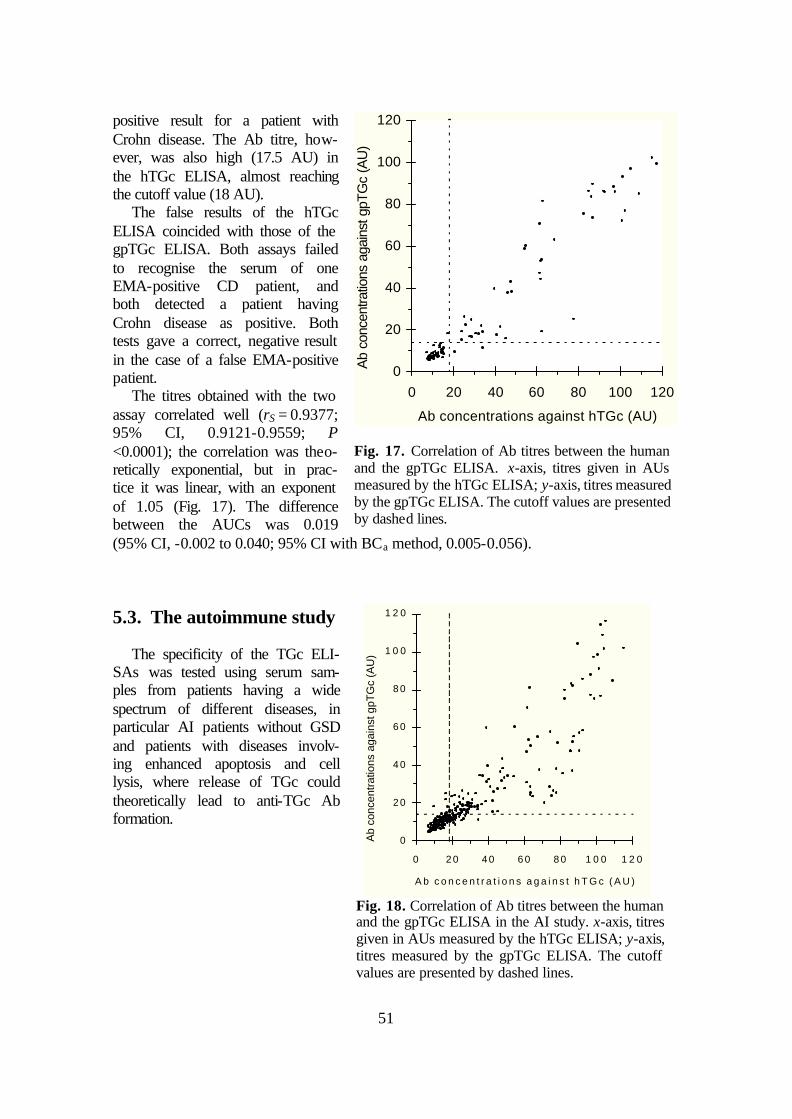
51
positive result for a patient with Crohn disease. The Ab titre, how-ever, was also high (17.5 AU) in the hTGc ELISA, almost reaching the cutoff value (18 AU).
The false results of the hTGc ELISA coincided with those of the gpTGc ELISA. Both assays failed to recognise the serum of one EMA-positive CD patient, and both detected a patient having Crohn disease as positive. Both tests gave a correct, negative result in the case of a false EMA-positive patient.
The titres obtained with the two assay correlated well (rS = 0.9377; 95% CI, 0.9121-0.9559; P <0.0001); the correlation was theo-retically exponential, but in prac-tice it was linear, with an exponent of 1.05 (Fig. 17). The difference between the AUCs was 0.019 (95% CI, -0.002 to 0.040; 95% CI with BCa method, 0.005-0.056).
5.3. The autoimmune study
The specificity of the TGc ELI-SAs was tested using serum sam-ples from patients having a wide spectrum of different diseases, in particular AI patients without GSD and patients with diseases involv-ing enhanced apoptosis and cell lysis, where release of TGc could theoretically lead to anti-TGc Ab formation.
0
20
40
60
80
100
120
0 20 40 60 80 100 120
Ab concentrations against hTGc (AU)
Ab
conc
entra
tions
aga
inst
gpT
Gc
(AU
)
Fig. 17. Correlation of Ab titres between the human and the gpTGc ELISA. x-axis, titres given in AUs measured by the hTGc ELISA; y-axis, titres measured by the gpTGc ELISA. The cutoff values are presented by dashed lines.
0
2 0
4 0
6 0
8 0
1 0 0
1 2 0
0 2 0 4 0 6 0 8 0 1 0 0 1 2 0
A b c o n c e n t r a t i o n s a g a i n s t h T G c ( A U )
Ab
conc
entra
tions
aga
inst
gpT
Gc
(AU
)
Fig. 18. Correlation of Ab titres between the human and the gpTGc ELISA in the AI study. x-axis, titres given in AUs measured by the hTGc ELISA; y-axis, titres measured by the gpTGc ELISA. The cutoff values are presented by dashed lines.

52
5.3.1. TGc ELISA The results from the human and gpTGc ELISAs correlated strongly (n = 379;
rS = 0.91703; 95% CI, 0.8994-0.9317; P <0.0001) (Fig. 18). Thus, as the hTGc ELISA was shown previously to be the superior (5.2.6), only the results from this test are pre-sented here.
The median serum Ab concentrations against the hTGc are shown in Fig. 19 and Table IX on page 43. The difference between the two forms of GSD was significant (P = 0.0004), the 95% CIs, however, overlapped. One (EMA-positive) patient with CD and two (EMA-negative) patients with DH fell below the cutoff of 18 AU in the hTGc ELISA. No healthy individual had TGc Ab levels greater than the cutoff; however, five control patients had Ab concentrations just greater, in the range of 18.5-22.1 AU. These had been diagnosed as having (number of patients in parentheses) ichthyosis (3), re-tarded growth of non-gastrointestinal origin (1), primary adult lactose intolerance (1).
Fig. 19. Box and whisker diagram showing the serum IgA Ab concentrations against the hTGc in controls and patients subdivided into diagnostic categories. The lower and upper edges of the boxes represent the 25% and 75% percentiles, respectively. The median is indicated by a hori-zontal line through the box. Exact values and 95% CIs see in Table IX on page 43. The lower and upper whiskers represent the 5% and 95% percentiles, respectively. The arbitrary cutoff level for positivity is drawn by dashed line at the AU of 18. Non-standard abbreviations:CTR, controls; PV, pemphigus vulgaris; BP, bullous pemphigoid; CU, ulcerative colitis; GP, Goodpasture’s syndrome; CR, Crohn disease; WG, Wegener’s granulomatosis; RA, rheumatoid arthritis; PSS, progressive systemic sclerosis; APS, antiphospholipid syndrome; PA, psoriatic arthritis; HC, hepatitis C; TU, malignant tumor.
CD DH CTR PV BP CU GP CR WG RA SLE PSS APS PA HC TU0
10
20
30
40
50
60
70
80
90
100
110
120 AU

53
Comparing CD and DH patients with the controls, the sensitivity and specificity of the hTGc ELISA was 96.8% and 94.0%, respectively.
Overall 49% of all non-GSD AI sera were positive in the hTGc ELISA (somewhat fewer, 39.4% were positive in the gpTGc ELISA). In some individual diagnostic groups there were low median levels with elevated titres only in a few patients (e.g. bullous pemphigoid and pemphigus vulgaris), whereas other groups had high median Ab levels (e.g. Wegener’s granulomatosis and Goodpasture’s syndrome) (Fig. 19 and Table IX on page 43). The difference between the median titres of the AI and the control sera was significant in every case except for the pemphigus vulgaris sera (bullous pemphigoid, P = 0.012; pemphigus vulgaris, P = 0.152; SLE, P = 0.0005; antiphospholipid syndrome, P = 0.0002; for each of the other groups P <0.0001).
Significant differences were also found in serum titres between controls and patients with hepatitis C (P <0.0001), psoriatic arthritis (P = 0.0065), and malignancies (P = 0.0005) when compared by the Mann-Whitney test. Altogether 25% of these pa-tient groups were positive in the hTGc ELISA. While in most of the disease groups the 95% CIs confirmed the difference to the controls as being significant, the 95% CIs over-lapped in three (bullous pemphigoid, psoriatic arthritis, and malignancies), indicating that further studies are needed with patients suffering from these diseases.
5.3.2. Total serum IgA, AGA ELISA and EMA test
Of the non-GSD patients with TGc serum Ab levels above the cutoff, 70 were chosen at random for the measurement of total serum IgA levels, these sera were also tested for AGA and EMA reactivity. Fifteen (21.4%) had elevated total IgA levels, although one was borderline (Table XI). Increased total IgA levels occurred in most diagnostic groups, but it is of note that it was not seen in any patient with primary antiphospholipid syndrome; on the other hand it was most common in patients with rheumatoid arthritis (4/9) and malignancies (2/3) (Table XI). No patient had IgA-deficiency.
AGA-positivity was found in 8 of the 70 patients (11.4%), one or two AGA-positive sera being found in each diagnostic group, again with the exception of patients with primary antiphospholipid syndrome. Five of these 8 sera also had an elevated total IgA. The correlation of total IgA levels with the AGA concentrations was significant; how-ever, there was a large degree of scatter (P <0.0001; rS = 0.6451; 95% CI, 0.4832-0.7641; Fig. 20A).
None of the sera was posi-tive for EMA. However, some sera from patients with SLE and hepatitis C showed signals on the monkey esophagus sec-tions arising from nuclei, epithelial pericellular and/or reticular structures different from the endomysium. Twelve of the 15 sera with elevated total IgA had markedly elevated IgA Ab concentrations against the hTGc (above 25 AU), and 58.8% of the sera giving over 30 AU in the hTGc ELISA had elevated total IgA. The hTGc ELISA results corre-lated significantly with the total IgA level (P = 0.0026), but the scatter of the data was high (rS = 0.3544; 95% CI, 0.1303-0.5441; Fig. 20B). The same was true for the correla-
Table XI. Frequency of elevated total IgA level as well as AGA and EMA positivity of AI sera positive for hTGc ELISA. RA SLE PSS APS PA HC TU No. tested 9 17 19 4 3 15 3 Elevated total IgA 4 2 2 0 1 4 2 AGA 1 1 2 0 1 2 1 EMA 0 0 0 0 0 0 0 Abbreviations: see Fig. 19.
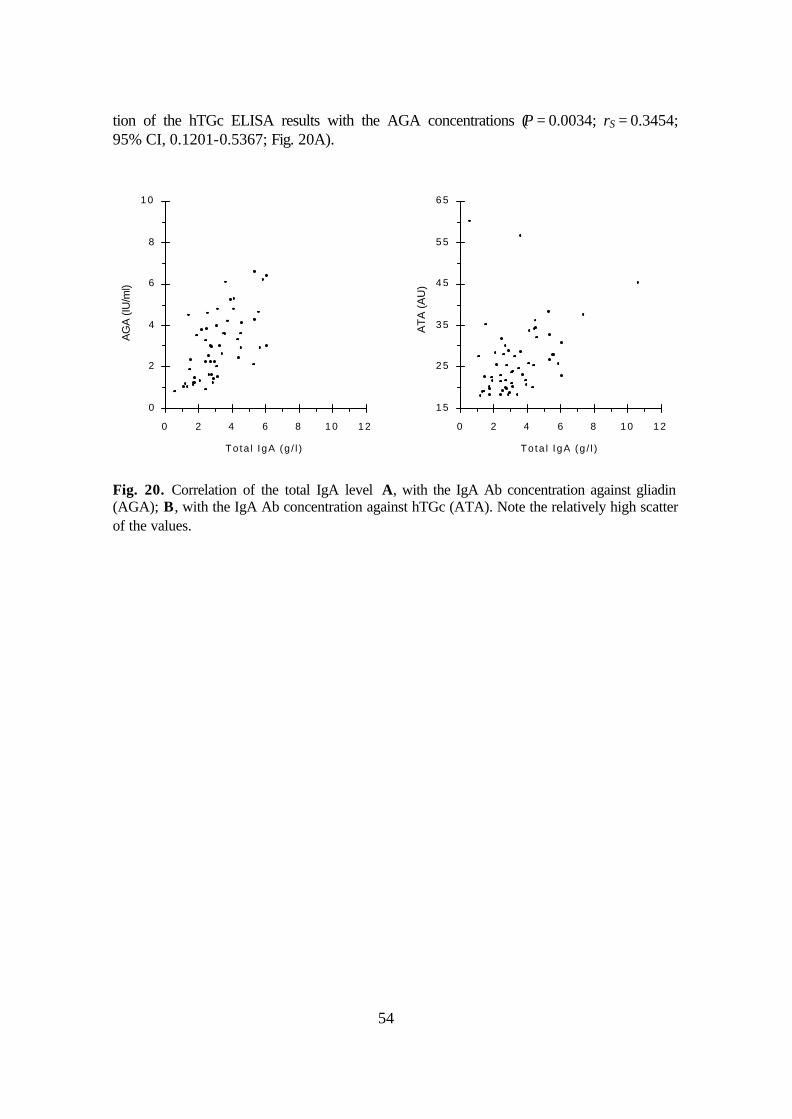
54
tion of the hTGc ELISA results with the AGA concentrations (P = 0.0034; rS = 0.3454; 95% CI, 0.1201-0.5367; Fig. 20A).
0
2
4
6
8
1 0
0 2 4 6 8 1 0 1 2
To ta l IgA (g / l )
AGA
(IU/m
l)
1 5
2 5
3 5
4 5
5 5
6 5
0 2 4 6 8 1 0 1 2
To ta l IgA (g / l )
ATA
(AU
)
Fig. 20. Correlation of the total IgA level A, with the IgA Ab concentration against gliadin (AGA); B, with the IgA Ab concentration against hTGc (ATA). Note the relatively high scatter of the values.

55
6. DISCUSSION
6.1. Diagnosis of patients and controls
GSD patients were diagnosed in all the three studies according to current criteria (283, 276); however, GSD was not excluded histologically in all controls. In particular, this may be a problem in the interpretation of the results of the AI study. GSD is ex-pected to be very uncommon without GI symptoms typical of GSE, with the symptoms of another disease, and negative EMA test. In these patients, it is very rare to find histo-logical changes showing evidence for the presence of GSE; the probability of an indis-putably positive histological result is approximately 0.5% (32). As the risk, particularly in children, of an invasive biopsy procedure outweighs that of a misdiagnosed silent CD, such biopsies were not carried out. Further, as there is little evidence that symptom-less and EMA-negative CD has to be treated, we beleive a positive TGc ELISA result alone does not provide ethical grounds for performing an intestinal and/or a cutaneous biopsy.
In conclusion, though some of the ‘false-positive’ controls could have silent CD, the expected frequency of EMA-negative GSD (estimated to be lower than 1-2%) is far below the limit above which it could cause significant changes in the interpretation of results and thus in the message of the studies.
6.2. TGc preparations
6.2.1. Expression of active, recombinant human TGc. To our knowledge, recombinant hTGc had not been expressed before in mammalian
cells. We preferred using human cells instead of bacteria for two reasons. First, although there is no evidence for posttranslational modifications of TGc, we cannot completely exclude this possibility. Such modifications would in all probability not occur in bacte-ria. Second, if chaperons are needed to obtain a correct folding, these are more likely to be present in human cells.
We decided to use a tag polypeptide to enable quick and efficient purification of hTGc. For this purpose, we used the Strep II tag for the following reasons:
1. The Strep-tag II consists of only 8 amino acids and so is unlikely to influence the features and functions of proteins.
2. It can be used both N- and C-terminally. Theoretically, even combination with a signal peptide is possible (TGc is known not to have a signal peptide).
3. It can, if required, be cleaved after purification, the cleaved products can be easily separated from the authentic recombinant protein using biotinylated thrombin (factor Xa). (However, we did not cleave it in our studies.)
4. Simple, one step purification is possible. Preliminary studies showed that the StrepTactin coloumn works extremely efficiently. In addition, the purification of rea-sonable amounts of TGc from cell lysate can be carried out within 6 hours. During af-finity chromatography, physiological conditions can be used (no need for high salt con-
56
centrations, extreme pH, reducing or chelating agents), but the use of such conditions is theoretically feasible. Thus mild elution without loss of function and/or folding can al-most always be done. In the case of TG purification, EDTA should be added during purification for inhibition of enzyme activity. This would not have been possible if the His-tag had been used, because addition of EDTA during affinity purification of His-tagged proteins destroys the coloumn matrix. The eluting agent (desthiobiotin) is a vi-tamin derivate which can be easily removed by dialysis or gel chromatography if neces-sary (it was not removed in our studies).
5. There is a very sensitive and specific polyclonal Ab against the tag which makes detection of expression easy.
6. The affinity coloumn can be reused several times making the system economic. The costs for the whole hTGc purification and detection system were below $300.
EBNA cells were used as the expression system as they usually produce high yields of the recombinant protein after episomal transfection with CMV promotored vectors, are easily transfected and do not show contact inhibition.
The molecular mass of the gpTGc differs only slightly (0.1 kDa) from that of the hTGc when measured by mass spectrometry, but the gpTGc migrates appreciably faster on SDS-PAGE than the hTGc. Although the molecular mass difference is 1.2 kDa, the TGc from human fibroblasts migrates with the same speed as our fusion protein imply-ing that the difference between the structures of the human and the gpTGc is more pro-found than suggested by their high amino acid identity.
6.2.2. The guinea pig TGc. The guinea pig liver TGc preparation from Sigma contains other protein contami-
nants which are not immunoreactive with MAbs against TGc (Fig. 15). However, as it had been used successfully in other studies (69, 71, 259), we did not purify it further. It cannot be excluded that immunopositivity seen might in some cases be due to reactivity against contaminants.
6.2.3. Effects of Ca2+-ions ‘Ca2+-activation’ of TGc should cause conformational changes and has been used to
optimise the TG assay systems (71, 259). The avidity of CD autoantibodies to TGc is known to be very low to the denatured form (69), thus its conformation is of great im-portance. In our assays, the sensitivity of the Ca2+-activated hTGc ELISA was also higher than that without Ca2+-activation; however, the role of Ca2+ in the binding of Abs in GSD sera has generated some controversy (e.g. 259 and 71 versus 270 and 215).
It has been shown that IgA autoantibodies bind significantly less to TGc conforma-tions other than the Ca2+-activated form even if the Ab-TGc reaction itself occurs in a Ca2+-deficient buffer (162). Possibly these conformational changes in the structure of TGc reveal epitopes characteristic of the extracellular form. It is also possible that acti-vated TGc may deamidate itself producing neoepitopes against which higher affinity Abs might be directed. Finally, while Ca2+-activated TGc could theoretically autocross-link itself, recent work suggests that this does not result in significant increase of the amounts of TGc bound to the ELISA well surface (162).
57
The effect of Ca2+ could also be seen using the anti-TGc MAb TG100 (Neomarkers, presumably having a binding site in barrel 1 near the Ca2+-binding region of TGc be-tween aa 447-538), whereas no difference could be observed using another anti-TGc MAb (CUB 7402, Neomarkers, presumably having a binding site in barrel 1 near the Ca2+-binding region of TGc between aa 447-478, spatially near the GTP-binding re-gion). Although these MAbs always perfectly stain extracellular TGc (163), do not con-stantly recognise intracellular TGc (163, 239, Sárdy et al., unpublished observations) suggesting the epitopes of intracellular TGc are hidden in certain cases due to the absent Ca2+-activation and/or to allosteric inhibiton by a bound intracellular component not present in the extracellular space. Indeed, an intracellular binding partner of TGc (cal-reticulin, the Gâh subunit, see 2.3.3.3.2) is known to inhibit the binding of GSD sera or the Neomarkers’ MAbs to TGc (162). Autoantibodies from GSD sera are beleived to have cystein molecule(s) in their epitopes, because irreversible inhibitors of TGc (e.g. cystamine) targeting the -SH groups of cysteins (including the Cys277 in the catalytic centre) inhibit their binding to TGc (162). Ca2+-ions can profoundly alter the accessibil-ity of Cys residues as indicated in S-nitrosylation experiments (174), and preliminary plasmon surface resonance results indicate that the binding of GSD Abs to TGc has dif-ferent kinetics in the presence or absence of Ca2+ (162).
Together these results indicate a role of Ca2+ ions in causing an irreversible confor-mational change altering the reactivity of IgA Abs in GSD to TGc, and support the no-tion that intracellular TGc has a conformation and/or binding partners making it unreac-tive to GSD sera.
6.3. Sensitivity and specificity
6.3.1. Setting the cutoff values Setting of the cutoff values for the ELISAs was based on the ROC-analysis of the
tests. A cutoff value providing perfect separation of individuals with or without GSD could not be found, though the coincidence with the diagnosis by biopsy was very high in both tests. The cutoff of the gpTGc ELISA was different in the two studies (14 and 15.5 AU in the gpTGc and hTGc ELISA study, respectively). This difference may be due to the different sets of sera used in the two studies, and it is within an expected range of measurement error. As both the false-negative and the false-positive values usually lie near the cutoffs, it would be feasible to determine ‘gray zones’ in both assays (14-20 AU for the gpTGc and 16-22 AU for the hTGc ELISA) in which values should be regarded questionable. EMA-negative patients having anti-TGc Ab concentrations in these zones should be retested after a few months gluten challenge, but an invasive ex-amination is not necessary if there are no other symptoms or signs suggesting GSD. On the other hand, EMA-positive patients in these zones should be submitted to intestinal biopsy.
In the AI study, it was very difficult to judge whether the cutoff values were appro-priate. Consequently, the current gpTGc and hTGc ELISA methods are not the methods of choice for serological diagnosis of GSD in patients having AI diseases other than GSD.
58
6.3.2. Sensitivity and specificity
6.3.2.1.The guinea pig TGc ELISA study The gpTGc ELISA proved to be a suitable method for the diagnosis of untreated
GSE, even though both some false-negative and false-positive results were observed. False positivity of the gpTGc ELISA could be observed in three serum samples. Re-peated tests gave the same results. These patients suffered from IgA-pemphigus and primary liver carcinoma. None had clinical signs or symptoms of CD. Upon this result, one of the adult patients with IgA-pemphigus agreed to have a jejunal biopsy per-formed, but the histology was negative for GSE. The patient with liver carcinoma died before the beginning of this study, and jejunal histology was not performed. Biopsy of the third patient with IgA-pemphigus, an 80-year-old woman, was not considered be-cause the possible diagnosis of silent CD would not have had therapeutic consequences. We could not find any obvious connection between these patients. It is conceivable that in the cases of IgA-pemphigus the result was caused by unspecifically bound IgA due to high IgA Ab concentrations against autoantigens other than TGc. The patient with liver carcinoma might have had silent CD, but it is also possible that she had autoantibodies against liver proteins being present in the gpTGc preparation.
The gpTGc ELISA was not as sensitive as the EMA. The lower sensitivity possibly was due to the use of the heterologous protein [the aa sequence identity between gpTGc and hTGc being only 82.8% (104, 133)], as four of the five false-negative sera were recognised as weakly positive in the hTGc ELISA. However, the endomysial binding of two of these four sera could be abolished by addition of excess gpTGc, suggesting the IgA Abs of low titre in these sera are most likely directed against epitopes of hTGc which are only partially conserved in the gpTGc, and so give weaker binding to the guinea pig antigen.
Although a few authors suggested TGc being a major but not the only antigen in monkey esophagus sections (185, 271), there is strong evidence for TGc being the only endomysial, reticulin, and jejunal autoantigen (162). This is why the lower sensitivity of gpTGc ELISA compared to the EMA test can be explained by the conformational dif-ferences between the guinea pig and the monkey TGc rather than by the presence of additional autoantigens in the oesophagus tissues.
Interestingly, among the 12 EMA-negative controls with serum IgA Ab titres below the cutoff but higher than 12.4 AU (see group I in Fig. 13) there were four direct rela-tives of CD patients. Repeated tests from serum samples taken at a later time point also showed EMA negativity and similar titres. In the absence of clinical signs of CD, intes-tinal biopsies were not performed (see 6.1), but this group of individuals will be further studied.
6.3.2.2.The human TGc ELISA study
The hTGc ELISA was found to be slightly superior to the gpTGc ELISA. The 95% CIs of sensitivities of the two ELISAs overlap; therefore, the sensitivity difference must be confirmed by further studies, but the results affirm the assumption that in a few cases Abs are directed against epitopes of hTGc not (or only partially) conserved in gpTGc.
The EMA test gave a false-positive result in an 8-year-old girl who had a transient diarrhoea in February 1998. Repeated EMA tests showed IgA binding in the intercellu-lar spaces of smooth muscle cells. Jejunal histology was negative for GSE, and the diar-rhoea has not recurred. The serum was not immunoreactive in either ELISA, and the
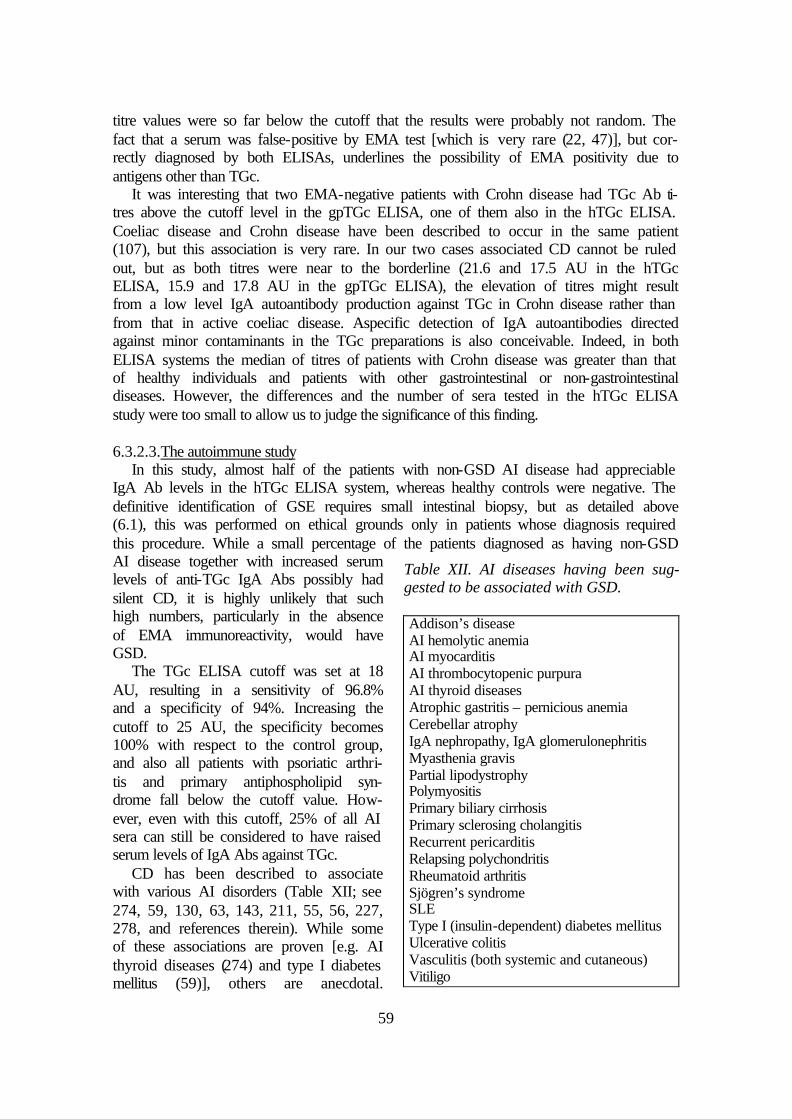
59
titre values were so far below the cutoff that the results were probably not random. The fact that a serum was false-positive by EMA test [which is very rare (22, 47)], but cor-rectly diagnosed by both ELISAs, underlines the possibility of EMA positivity due to antigens other than TGc.
It was interesting that two EMA-negative patients with Crohn disease had TGc Ab ti-tres above the cutoff level in the gpTGc ELISA, one of them also in the hTGc ELISA. Coeliac disease and Crohn disease have been described to occur in the same patient (107), but this association is very rare. In our two cases associated CD cannot be ruled out, but as both titres were near to the borderline (21.6 and 17.5 AU in the hTGc ELISA, 15.9 and 17.8 AU in the gpTGc ELISA), the elevation of titres might result from a low level IgA autoantibody production against TGc in Crohn disease rather than from that in active coeliac disease. Aspecific detection of IgA autoantibodies directed against minor contaminants in the TGc preparations is also conceivable. Indeed, in both ELISA systems the median of titres of patients with Crohn disease was greater than that of healthy individuals and patients with other gastrointestinal or non-gastrointestinal diseases. However, the differences and the number of sera tested in the hTGc ELISA study were too small to allow us to judge the significance of this finding.
6.3.2.3.The autoimmune study
In this study, almost half of the patients with non-GSD AI disease had appreciable IgA Ab levels in the hTGc ELISA system, whereas healthy controls were negative. The definitive identification of GSE requires small intestinal biopsy, but as detailed above (6.1), this was performed on ethical grounds only in patients whose diagnosis required this procedure. While a small percentage of the patients diagnosed as having non-GSD AI disease together with increased serum levels of anti-TGc IgA Abs possibly had silent CD, it is highly unlikely that such high numbers, particularly in the absence of EMA immunoreactivity, would have GSD.
The TGc ELISA cutoff was set at 18 AU, resulting in a sensitivity of 96.8% and a specificity of 94%. Increasing the cutoff to 25 AU, the specificity becomes 100% with respect to the control group, and also all patients with psoriatic arthri-tis and primary antiphospholipid syn-drome fall below the cutoff value. How-ever, even with this cutoff, 25% of all AI sera can still be considered to have raised serum levels of IgA Abs against TGc.
CD has been described to associate with various AI disorders (Table XII; see 274, 59, 130, 63, 143, 211, 55, 56, 227, 278, and references therein). While some of these associations are proven [e.g. AI thyroid diseases (274) and type I diabetes mellitus (59)], others are anecdotal.
Table XII. AI diseases having been sug-gested to be associated with GSD. Addison’s disease AI hemolytic anemia AI myocarditis AI thrombocytopenic purpura AI thyroid diseases Atrophic gastritis – pernicious anemia Cerebellar atrophy IgA nephropathy, IgA glomerulonephritis Myasthenia gravis Partial lipodystrophy Polymyositis Primary biliary cirrhosis Primary sclerosing cholangitis Recurrent pericarditis Relapsing polychondritis Rheumatoid arthritis Sjögren’s syndrome SLE Type I (insulin-dependent) diabetes mellitus Ulcerative colitis Vasculitis (both systemic and cutaneous) Vitiligo
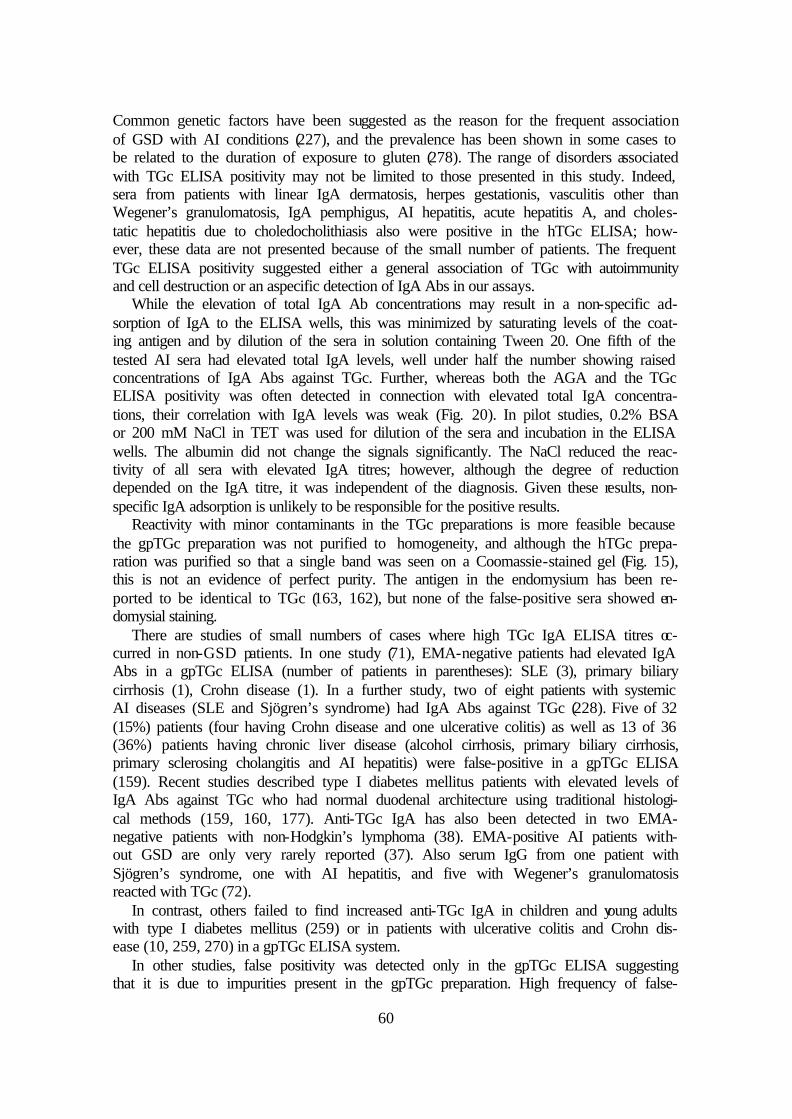
60
Common genetic factors have been suggested as the reason for the frequent association of GSD with AI conditions (227), and the prevalence has been shown in some cases to be related to the duration of exposure to gluten (278). The range of disorders associated with TGc ELISA positivity may not be limited to those presented in this study. Indeed, sera from patients with linear IgA dermatosis, herpes gestationis, vasculitis other than Wegener’s granulomatosis, IgA pemphigus, AI hepatitis, acute hepatitis A, and choles-tatic hepatitis due to choledocholithiasis also were positive in the hTGc ELISA; how-ever, these data are not presented because of the small number of patients. The frequent TGc ELISA positivity suggested either a general association of TGc with autoimmunity and cell destruction or an aspecific detection of IgA Abs in our assays.
While the elevation of total IgA Ab concentrations may result in a non-specific ad-sorption of IgA to the ELISA wells, this was minimized by saturating levels of the coat-ing antigen and by dilution of the sera in solution containing Tween 20. One fifth of the tested AI sera had elevated total IgA levels, well under half the number showing raised concentrations of IgA Abs against TGc. Further, whereas both the AGA and the TGc ELISA positivity was often detected in connection with elevated total IgA concentra-tions, their correlation with IgA levels was weak (Fig. 20). In pilot studies, 0.2% BSA or 200 mM NaCl in TET was used for dilution of the sera and incubation in the ELISA wells. The albumin did not change the signals significantly. The NaCl reduced the reac-tivity of all sera with elevated IgA titres; however, although the degree of reduction depended on the IgA titre, it was independent of the diagnosis. Given these results, non-specific IgA adsorption is unlikely to be responsible for the positive results.
Reactivity with minor contaminants in the TGc preparations is more feasible because the gpTGc preparation was not purified to homogeneity, and although the hTGc prepa-ration was purified so that a single band was seen on a Coomassie-stained gel (Fig. 15), this is not an evidence of perfect purity. The antigen in the endomysium has been re-ported to be identical to TGc (163, 162), but none of the false-positive sera showed en-domysial staining.
There are studies of small numbers of cases where high TGc IgA ELISA titres oc-curred in non-GSD patients. In one study (71), EMA-negative patients had elevated IgA Abs in a gpTGc ELISA (number of patients in parentheses): SLE (3), primary biliary cirrhosis (1), Crohn disease (1). In a further study, two of eight patients with systemic AI diseases (SLE and Sjögren’s syndrome) had IgA Abs against TGc (228). Five of 32 (15%) patients (four having Crohn disease and one ulcerative colitis) as well as 13 of 36 (36%) patients having chronic liver disease (alcohol cirrhosis, primary biliary cirrhosis, primary sclerosing cholangitis and AI hepatitis) were false-positive in a gpTGc ELISA (159). Recent studies described type I diabetes mellitus patients with elevated levels of IgA Abs against TGc who had normal duodenal architecture using traditional histologi-cal methods (159, 160, 177). Anti-TGc IgA has also been detected in two EMA-negative patients with non-Hodgkin’s lymphoma (38). EMA-positive AI patients with-out GSD are only very rarely reported (37). Also serum IgG from one patient with Sjögren’s syndrome, one with AI hepatitis, and five with Wegener’s granulomatosis reacted with TGc (72).
In contrast, others failed to find increased anti-TGc IgA in children and young adults with type I diabetes mellitus (259) or in patients with ulcerative colitis and Crohn dis-ease (10, 259, 270) in a gpTGc ELISA system.
In other studies, false positivity was detected only in the gpTGc ELISA suggesting that it is due to impurities present in the gpTGc preparation. High frequency of false-

61
positive results using a gpTGc ELISA was found in patients with elevated transami-nases and chronic liver disease, and the presence of anti-gpTGc did not correlate with the presence of EMA positivity or histological evidence for CD (39). The false positiv-ity disappeared, however, when hTGc was used. In a more recent study, 50% of EMA-negative patients with AI hepatitis or primary biliary cirrhosis and 6.5% with type I dia-betes mellitus were found to be false-positive in a gpTGc ELISA whereas only 6% and none by a hTGc ELISA, respectively (53). In this study, no false-positive sera reacted with a protein band having the same migration speed on an immunoblot as TGc, but were immunoreactive with other bands. Some CD sera have previously been shown not to react with TGc in immunoblots, thus this method might not be appropriate for detec-tion of anti-TGc reactivity (69, 72).
Given the high occurrence of TGc ELISA reactivity in AI diseases and that the EMA negativity cannot exclude the presence of low titre anti-TGc Abs together with addi-tional Abs directed against minor contaminants, it is also possible that TGc might be a cofactor as well as a secondary autoantigen in a number of AI disorders. Wajda et al. suggested already in 1965 that TGc could play a role in AI diseases due to modification of proteins (281). Isoniazid and hydralazine, two drugs being relatively frequent induc-ers of SLE, can serve as amine substrates for TGc (187). MRLIpr/Ipr mice, which have a defective CD95 receptor, suffer from an age-dependent, severe, SLE-like AI disease, and produce large amounts of autoantibodies against TGc (224). While these mice do not have any known defect in the TGc gene (60), TGc with no or very low activity accumulates abnormally in maturing lymphoid organs (224). The impairment of TGc-catalyzed polymerisation of proteins in apoptotic or necrotic cells leads to an increased liberation of both TGc and other cellular constituents (224), and this may induce an AI response. An AI response against TGc may aggravate insufficient TGc leading to a pathological cycle, thus Abs against TGc may facilitate or promote an AI disease, or their appearance during the course of an AI process may result in increased disease ac-tivity. Finally, TGc-/- mice develop anti-nuclear Abs after the first year of life, which might be the basis of an SLE-like disease of the mice (Fésüs L et al., personal commu-nication).
In conclusion, the broad spectrum of diseases linked with TGc ELISA positivity sug-gests either a general association of TGc with autoimmunity and cell destruction or an aspecific detection of IgA Abs in our ELISAs. In order to clarify this situation, further experiments are planned in the near future.
6.4. Relevance of ELISA results
The results of our ELISAs were in good agreement with the histological diagnoses and the results of the EMA test confirming that TGc is a major autoantigen of GSD. The ELISA with the human antigen turned out to be slightly more sensitive in this regard than the EMA test or the gpTGc ELISA. Therefore, it is suitable for diagnosis, screen-ing, and follow-up of GSD, although the AI study alerted us that false-positive results are possible in certain disease groups, the cause of which is currently unknown. The role of anti-TGc Abs in the etiology of GSD remains to be investigated.
We found in the gpTGc study that the median serum IgA Ab level against TGc was significantly higher in patients with untreated CD than with untreated DH, results in

62
agreement with those of Dieterich et al. (70), although this could not be confirmed in the hTGc study (a similar difference was found but it was not significant and the 95% CIs overlapped, see 5.2.2). This finding is supported by the observation that the EMA test is often false-negative in untreated DH patients.
Our gpTGc ELISA was able to show the effect of a GFD both in CD and DH patients early after the beginning of the GFD when the EMA test had not yet been turned nega-tive (Fig. 14). This finding is important because the apparent advantage of the quantita-tive TGc ELISA against the semiquantitative EMA test is that the former allows the gastroenterologist to control the compliance to the GFD more effectively.
The ‘Expression of the human tissue transglutaminase in human embryonic kidney cells and purification via StrepTactin affinity chromatography.’ was patented by the European Patent Office (No. 99111975.1.). The human TGc ELISA presented in this work is currently produced on an industrial scale and commercially available.
63
7. CONCLUSIONS
TGc was proved to be the major autoantigen of GSD, although in DH, the dominant autoantigen responsible for skin symptoms was found to be a related isoenzyme, the TGe. It is now evident that serological tests based on indirect immunofluorescence on different tissues (umbilical cord, endomysium, jejunum, liver) detect TGc in these tis-sues, and the IgA Abs previously referred to as anti-endomysium, anti-reticulin or anti-jejunum Abs are identical. The observation that TGc is the major autoantigen of dis-ease-specific Abs in GSD allowed the production of serological tests independent of animal tissues. In this work, the development of an ELISA based on the guinea pig and the human antigen has been presented and tested for usefulness in the clinical practice.
The results showed that both the gpTGc and the hTGc ELISA were specific and sen-sitive enough for use as a simple diagnostic, screening and follow-up method for GSD when compared to healthy controls. If compared to controls with non-AI diseases, the hTGc ELISA was found to be as specific and sensitive as the EMA test, and somewhat superior to the gpTGc ELISA. Our results showed the high diagnostic value of all tested systems in this study, in particular that of the hTGc ELISA, which had almost perfect sensitivity and specificity if compared with healthy controls, and did not have the prac-tical disadvantages of EMA test. However, it is evident that in certain cases, in particu-lar in active AI diseases, TGc ELISA positivity should not alone be taken as the basis for a diagnosis of GSD. Positive results in symptomless individuals should always be verified by EMA test before submitting them for jejunal biopsy, while negative results ought to be controlled if the clinical symptoms and signs are suspicious of GSD.
Thus one can conclude that the hTGc-based ELISA should be the method of choice for simple and non-invasive diagnosis, screening, and follow-up of GSD. The role of TGc in the etiology and pathogenesis of GSD (and possibly in other diseases) remains elusive, further studies are needed to understand whether IgA Abs against TGc have pathological consequences, prognostic uses or are only markers of gluten consumption.
64
8. ACKNOWLEDGEMENTS
First of all I would like to thank Prof. Dr. Sarolta Kárpáti for her inspiration. She was the person who impressed me with the importance of research on the role of transgluta-minases in GSD. She provided me with the opportunity to use the patient sera she had collected, she was the person who organised contact to Prof. Paulsson and sent me to Cologne to spend one of the most useful and successful periods of my life. Her enthusi-asm is fascinating, the energy she invests into research commands respect, and her inde-fatigable efforts to sow the seeds of high quality research into her Ph.D. students’ heads is astonishing. Without her altruistic help and ambitious dreams, this project would not have begun.
I would like to acknowledge the continuous (both personal and financial) support of Prof. Attila Horváth. He has never let me feel he was being my employer, and offered me all the possibilities to develop my dermatology skills. His very (self-)critical and evidence based point of view in the dermatology helped me a lot in the realisation of facts among the impressions.
I am indebted to Prof. Mats Paulsson for his generous help throughout my two years’ stay in Cologne, and for offering me the opportunity to perform these studies in his de-partment. He guided my research in a very competent manner. The proficiency he man-aged to lead both scientifically, and financially, and bureaucratically the huge Institute for Biochemistry II, made him an outstanding example to the younger generation. I have never seen in my life such a person whose door, although being a director under ex-tremely high work load, was practically always open for everyone. The eminently de-mocratic atmosphere he provided ensured a uniquely free feeling of independence, and excellent environment in which to study. I learned that it was worth following his direc-tions even if one was disagreed with him at the first time; being a real master of his pro-fession, he had the special talent to intuitively know in which direction to go. I am also obliged for his prominent assistance to receive financial support especially at the begin-ning and in the second year of my stay. And last but not least, I will never forget that he was able to change my agitated, worrying style into a calmer and patient one, helped to clear my mind of unnecessary, complicated actions, and showed me the way of thinking of a generous, honest, flexible, and talented investigator.
I would like to express my gratefulness to Prof. Dr. Thomas Krieg for contacting Prof. Paulsson for the first time, for inviting me, after I had arrived, to participate on the visits and other activities in the Department of Dermatology, for his help receiving fi-nancial support, and for the critical discussions about our results, useful suggestions, and reviewing of our work.
I am especially grateful to Dr. Neil Smyth for acting as extremely competent scien-tific tutor and English teacher during the whole work. When I first met him, my written English was not bad, but it took months until I began to understand significantly more than 50% of what he told me. As a result of his effect, and like everyone in the lab in Cologne, today I not only understand, but also speak ‘Neilglish’, a Liverpool dialect with individual tone, intonation, accents and idioms, and I often realise that I do not know the Hungarian name of several objects in our lab in Budapest whereas I do know the English name for them. I usually regard people who declare they are always right as
65
conceited, but surprisingly enough, he was really always right when he pronounced he was sure! I also wish to thank for his investments in the numerous visits in pubs and restaurants of Cologne which always induced advantageous progress of research. I will never forget his words that everything should be done as quickly as possible which were not only a slogan but showed his uncommonly efficient way of working which im-pressed me. Special thanks for the CD rack, currently an important piece of furniture next to my computer desk, I received as a memory of someone using his talent not only in pipetting but also in carving ideas. And last but not least, I would like to express my gratitude for reviewing this manuscript.
I would like to acknowledge the help of Petronella Izbéki who not only provided op-timal home background and atmosphere for effective work but also technical help or-ganising the patients’ data, the numerous copies of scientific papers, and slides. I am very grateful to my parents for supporting my studies, doing my business in Hungary when I was abroad, and helping me together with Petronella in the short period when I became disabled.
I thank Uwe Odenthal for his aid in learning the different techniques of molecular biology which was particularly important in the first few months, and for his generous gift, the expression vector pCEP-Pu/BM40SP/C-Strep, together with plenty of experi-ence with using it. He always shared all of his materials with me. I will forever remem-ber his kind personality. Being a genuine lad from ‘Kölle’, he helped every foreigner in adapting to the milieu of Cologne, he always found how to help, even without asking him (his aid in transporting furniture for me was vital), and provided a friendly and cheerful environment in the lab.
I am beholden to Barbara Merkl and Christian Frie for introducing me into the com-plicated world of a biochemical lab, especially into cell culture work, cloning, isotope techniques, and microscopy. Without their help I would have been lost there. How many time they spared me with knowing which reagent where can be found! I still try to eat vegetarian food as often as possible, and now I am deeply skilled in microphotogra-phy and the life of several insects.
I appreciate Getrud Pelzer’s indispensable assistance in the bureaucratic labyrinth of the German rules. She was not only a skilful secretary but also a ‘student-sitter’ taking care for every important detail including a huge, delicate piece of ham at Christmas time.
I thank Nevres Ercan for her kind technical assistance and providing me with a lot of odds and ends around the flat.
I am very grateful to Drs. Judith-Antonia Lummerstorfer and Patrick Tunggal for their support sharing materials with me, showing tricky ways of doing experiments, providing me with chocolate and sweets, producing cheerful atmosphere in the work-place, and inviting me to play basketball together with the Tunggal family, Lutz and Lili, Thomas, Martin, Maria and many others which was one of my most important sport activities in Cologne. I am especially beholden to Lutz Reiche for his help after my disabling basketball accident. I am indebted to Dr. Budi Tunggal for his essential help in computer technical problems, and Dr. Lucy Tunggal for sharing reagents and incubation boxes with me.
I would like to acknowledge the help of Dr. Brigitte Ritter in many details of my work including the confocal microscopy, the site directed mutagenesis, and particularly her aid after midnight when usually nobody else than her was to be found in the insti-tute. I will never forget the countless cinema visits and pizza-parties together with Uwe

66
– usually late in the night. I clearly remember her appreciative sense of humour that made every contact with her a pleasure.
I thank Dr. Jan Modregger for his help in fighting with hardware problems, for the useful instructions showing me how to use certain softwares, and for the generous gift of valuable reagents he had produced. I will never forget his unique sense of humour either which together with Brigitte’s and Markus’ allowed me to enjoy the atmosphere of every visit in Markus’ lab. Special thanks for the photo album showing the life in the institute which I beleive contained mainly his photographs.
I thank Drs. Markus Plomann, Raimund Wagener, Robert Dinser, Harald Hambrock, Frank Zaucke, and Patrik Maurer for unselfish opening of the door to their wisdom.
I thank Ursula Canton for being my partner in the rock ’n’ roll club and Karola Muth for teaching and training me there.
I am grateful to Dr. Márta Csikós for aid in performing ELISAs, the management of my official affairs in Hungary during my stay abroad, and the useful discussions. I would like to acknowledge Ferencné Menyhárt for preparing EMA tests and Prof. Dr. Sarolta Kárpáti and Dr. Klaudia Preisz for evaluating them. I thank Tamás Szaák for the DH patient’s photos. I am indebted to Prof. Dr. Sarolta Kárpáti and Dr. István Kósnai for critically reviewing the manuscript of this thesis. I appreciate Dr. Krisztina Becker’s efforts to solve bureaucratic problems in connection with the Ph.D. programme and the profitable discussions. I am thankful to all colleagues in our Hungarian ‘IF’ lab men-tioned above and to all colleagues in our Department of Dermato-Venereology who enabled with their extra work that I could be absent for more than two years.
I thank Dr. Daniel Aeschlimann for the kind gift of full length cDNA of human TGc. I thank Dr. Marcus Macht for performing mass spectrometry; Drs. Tamás Zágoni, Christof Geisen, Erika Tomsits, Ulrich Töx, Nico Hunzelmann, and Prof. Jörgen Wies-lander for providing patient sera. I acknowledge Elke Dietzel, Birgitta Jakob, and Char-lotte Ziesemer for their technical assistance. I am grateful to Prof. Walter Lehmacher for statistical review of the manuscript and Dr. Martin Hellmich for his help in the statisti-cal comparison of the two ELISA systems. I thank Drs. Ferenc Péterfy and Klára Rásky for their preliminary studies on the guinea pig TGc ELISA system.
I thank Prof. Dr. András Falus for his support to be admitted to the Ph.D. Doctoral School, for his help in the organisation of the final Ph.D. examination, and for regularly inviting me together with Marianna Holub to interesting scientific programmes, the ‘Ph.D. Saturdays’.
I also have to acknowledge the support of several organisations. I was supported by a fellowship of the Deutscher Akademischer Austauschdienst (A/98/23048), the Deutsche Forschungsgemeinschaft (FOR 265), the Immundiagnostik AG, the European Science Foundation (Protein Cross-Linking – the Transglutaminases Programme), and the Maria Pesch Foundation. The study was supported by a common grant of the Deutsche For-schungsgemeinschaft and the Magyar Tudományos Akadémia (project 436 UNG 113/135/0, Pa 660/2-1), the Köln Fortune Program of the Medical Faculty of Cologne, the Friedrich and Maria Sophie Moritz Foundation, the Országos Mûszaki Fejlesztési Bizottság (OMFB 6197), and the University Scientific Grant (ETT 155/2000) of Sem-melweis University.
67
REFERENCES
1. Achyuthan KE, Greenberg CS. Identification of a guanosine triphosphate-binding site on guinea pig liver transglutaminase. J Biol Chem 1987; 262:1901-6.
2. Aeschlimann D, Kaupp O, Paulsson M. Transglutaminase-catalyzed matrix crosslinking in differentiating cartilage: Identification of osteonectin as a major glu-taminyl substrate. J Cell Biol 1995; 129:881-92.
3. Aeschlimann D, Koeller MK, Allen-Hoffmann BL, Mosher DF. Isolation of a cDNA encoding a novel member of the transglutaminase gene family from human keratinocytes. Detection and identification of transglutaminase gene products based on reverse transcription-polymerase chain reaction with degenerate primers. J Biol Chem 1998; 273:3452-60.
4. Aeschlimann D, Paulsson M. Cross-linking of laminin-nidogen complexes by tissue transglutaminase. A novel mechanism for basement membrane stabilization. J Biol Chem 1991;266:15308-17.
5. Aeschlimann D, Paulsson M. Transglutaminases: protein cross-linking enzymes in tissues and body fluids. Thromb Haemost 1994; 71:402-15.
6. Aeschlimann D, Thomázy V. Protein crosslinking in assembly and remodelling of extracellular matrices: the role of transglutaminases. Connect Tissue Res 2000; 41:1-27.
7. Aeschlimann D, Wetterwald A, Fleisch H, Paulsson M. Expression of tissue trans-glutaminase in skeletal tissue correlates with events of terminal differentiation of chondrocytes. J Cell Biol 1993; 120:1461-70.
8. Akimov SS, Krylov D, Fleischman LF, Belkin AM. Tissue transglutaminase is an integrin-binding adhesion coreceptor for fibronectin. J Cell Biol 2000; 148:825-38.
9. Amendola A, Gougeon ML, Poccia F, Bondurand A, Fésüs L, Piacentini M. Induc-tion of "tissue" transglutaminase in HIV pathogenesis: evidence for high rate of apoptosis of CD4+ T lymphocytes and accessory cells in lymphoid tissues. Proc Natl Acad Sci USA 1996; 93:11057-62.
10. Amin M, Eckhardt T, Kapitza S, Fleckenstein B, Jung G, Seissler J, Weichert H, Richter T, Stern M, Mothes T. Correlation between tissue transglutaminase antibod-ies and endomysium antibodies as diagnostic markers of coeliac disease. Clin Chim Acta 1999; 282:219-25.
11. An G, Meka CS, Bright SP, Veltri RW. Human prostate-specific transglutaminase gene: promoter cloning, tissue-specific expression, and down-regulation in metas-tatic prostate cancer. Urology 1999; 54:1105-11.
12. Anderson CM. Histological changes in the jejunal mucosa in coeliac disease. Arch Dis Child 1960; 35:419-27.
13. Arató A, Kósnai I, Szõnyi L, Tóth M. Frequent past exposure to adenovirus 12 in coeliac disease. Acta Paediatr Scand 1991; 80:1101-2.
14. Arentz-Hansen H, Korner R, Molberg Ø, Quarsten H, Vader W, Kooy YM, Lundin KE, Koning F, Roepstorff P, Sollid LM, McAdam SN. The intestinal T cell response to alpha-gliadin in adult celiac disease is focused on a single deamidated glutamine targeted by tissue transglutaminase. J Exp Med 2000; 191:603-12.

68
15. Arnett FC, Edworthy SM, Bloch DA, McShane DJ, Fries JF, Cooper NS, Healey LA, Kaplan SR, Liang MH, Luthra HS, Medsger TA Jr, Mitchell DM, Neustadt DH, Pinals RS, Schaller JG, Sharp JT, Wilder RL, Hunder GG. The American Rheuma-tism Association 1987 revised criteria for the classification of rheumatoid arthritis. Arthritis Rheum 1988; 31:315-24.
16. Auricchio S, Visakorpi JK. Preface. In: Auricchio S, Visakorpi JK (eds). Common food intolerances 1: Epidemiology of coeliac disease. Dyn Nutr Res. Basel: Karger. 1992: VII-IX. pp.
17. Azari P, Rahim I, Clarkson DP. Transglutaminase activity in normal and hereditary cataractous rat lens and its partial purification. Curr Eye Res 1981; 1:463-9.
18. Barkan G, Gaspar A. Zur Frage der Reversibilität der Fibringerinnung II. Biochem Z 1923; 139:291-301.
19. Barry EL, Mosher DF. Binding and degradation of blood coagulation factor XIII by cultured fibroblasts. J Biol Chem 1990; 265:9302-7.
20. Becker K, Csikós M, Sárdy M, Szalai Zs, Horváth A, Kárpáti S. Identification of two novel nonsense mutations in the transglutaminase 1 gene in a Hungarian patient with congenital ichthyosiform erythroderma. Exp Dermatol. 2002; in press.
21. Bergamini CM, Signorini M, Poltronieri L. Inhibition of erythrocyte transglutami-nase by GTP. Biochim Biophys Acta 1987; 916:149-51.
22. Beutner EH, Chorzelski TP, Kumar V, Leonard J, Krasny S. Sensitivity and speci-ficity of IgA-class antiendomysial antibodies for dermatitis herpetiformis and find-ings relevant to their pathogenic significance. J Am Acad Dermatol 1986;15:464-73.
23. Bietz JA, Huebner FR, Sanderson JE, Wall JS. Wheat gliadin homology revealed through N-terminal amino acid sequence analysis. Cereal Chem 1977; 54:1070-83.
24. Boda M. Általános táplálkozási és járulékos károsító tényezõk szerepe a coeliakia pathogenesisében. Kandidátusi értekezés Szeged, 1989.
25. Bodánszky H, Horváth K, Bata A, Horn G, Simon K. Hydrogen breath test in small intestinal malabsorption. Acta Paediatr Hung 1987; 28:45-9.
26. Bodánszky H, Horváth K, Horn G. The D-xylose test in coeliac disease. Acta Paedi-atr Hung 1983; 24:17-22.
27. Bodánszky H, Kósnai I. Hungary. In: Auricchio S, Visakorpi JK (eds). Common food intolerances 1: Epidemiology of coeliac disease. Dyn Nutr Res. Basel: Karger. 1992: 164. p.
28. Bowness JM, Tarr AH, Wiebe RI. Transglutaminase-catalysed cross-linking: a po-tential mechanism for the interaction of fibrinogen, low density lipoprotein and arte-rial type III procollagen. Thromb Res 1989; 54:357-67.
29. Bruce SE, Bjarnason I, Peters TJ. Human jejunal transglutaminase: demonstration of activity, enzyme kinetics and substrate spcificity with special relation to gliadin and coeliac disease. Clin Sci 1985; 68:573-9.
30. Bruner-Lóránd J, Urayama T, Lóránd L. Transglutaminase as a blood clotting en-zyme. Biochem Biophys Res Commun 1966; 23:828-34.
31. Bures DM, Goldsmith LA, Stone KR. Transglutaminase activity of cultured human prostatic epithelium. Invest Urol 1980; 17:298-301.
32. Bürgin-Wolff A, Hadziselimovic F. Screening test for coeliac disease. Lancet 1997; 349:1843-4.
33. Candi E, Melino G, Lahm A, Ceci R, Rossi A, Kim IG, Ciani B, Steinert PM. Transglutaminase 1 mutations in lamellar ichthyosis. Loss of activity due to failure of activation by proteolytic processing. J Biol Chem 1998; 273:3693-3702.

69
34. Candi E, Oddi S, Terrinoni A, Paradisi A, Ranalli M, Finazzi-Agró A, Melino G. Transglutaminase 5 cross-links loricrin, involucrin, and small proline-rich proteins in vitro. J Biol Chem 276: 35014-23.
35. Cariello L, de Cristofaro T, Zanetti L, Cuomo T, Di Maio L, Campanella G, Rinaldi S, Zanetti P, Di Lauro R, Varrone S. Transglutaminase activity is related to CAG repeat length in patients with Huntington’s disease. Hum Genet 1996; 98:633-5.
36. Carpenter CB. The major histocompatibility gene complex. In: Isselbacher KJ, Braunwald E, Wilson JD, Martin JB, Fauci AS, Kasper DL (Eds.). Harrison’s prin-ciples of internal medicine. New York: McGraw-Hill Inc. 1994:380-6. pp.
37. Carroccio A, Custro N, Montalto G, Giannitrapani L, Soresi M. Evidence of tran-sient IgA anti-endomysial antibody positivity in a patient with Graves’ disease. Di-gestion 1999; 60:86-88.
38. Carroccio A, Fabiani E, Iannitto E, Giannitrapani L, Gravina F, Montalto G, Catassi C. Tissue transglutaminase autoantibodies in patients with non-Hodgkin's lym-phoma. Case reports. Digestion 2000; 62:271-5.
39. Carroccio A, Giannitrapani L, Soresi M, Not T, Iacono G, Di Rosa C, Panfili E, No-tarbartolo A, Montalto G. Guinea pig transglutaminase immunolinked assay does not predict coeliac disease in patients with chronic liver disease. Gut 2001; 49:506-11.
40. Caspary WF. Primäre und sekundäre Malassimilationssyndrome. Störungen der Di-gestion und Resorption bei Dünndarmerkrankungen. In: Classen M, Diehl V, Koch-siek K (eds.). Innere Medizin. Urban & Schwarzenberg 1994; p. 586, Fig. 11.4-4.
41. Castro M, Crino A, Papadatou B, Purpura M, Giannotti A, Ferretti F, Colistro F, Mottola L, Digilio MC, Lucidi V, et al. Down’s syndrome and celiac disease: the prevalence of high IgA-antigliadin antibodies and HLA-DR and DQ antigens in tri-somy 21. J Pediatr Gastroenterol Nutr 1993; 16:265-8.
42. Cataldo F, Marino V, Bottaro G, Greco P, Ventura A. Celiac disease and selective immunoglobulin A deficiency. J Pediatr 1997;131:306-8.
43. Catassi C, Fabiani E, Gasparin M, Troncone R, and the Italian Society for Paediatric Gastroenterology and Hepatology Working Group on “Quantitative AGA standardi-sation”. Quantitative antigliadin antibody measurement in clinical practice: an Ital-ian multicentre study. Ital J Gastroenterol Hepatol 1999; 31:366-70.
44. Catassi C, Fabiani E, Rätsch IM, Coppa GV, Giorgi PL, Pierdomenico R, Alessan-drini S, Iwanejko G, Domenici R, Mei E, Miano A, Marani M, Bottaro G, Spina M, Dotti M, Montanelli A, Barbato M, Viola F, Lazzari R, Vallini M, Guariso G, Ple-bani M, Cataldo F, Traverso G, Ughi C, Chiaravalloti G, Baldassarre M, Scarcella P, Bascietto F, Ceglie L, Valenti A, Paolucci P, Caradonna M, Bravi E, Ventura A. The coeliac iceberg in Italy. A multicentre antigliadin antibodies screening for coe-liac disease in school-age subjects. Acta Paediatr 1996; 412(Suppl):29-35.
45. Chen JSK, Mehta K. Tissue transglutaminase: an enzyme with a split personality. Int J Biochem Cell B 1999; 31:817-36.
46. Choi YC, Park GT, Kim TS, Sunwoo IN, Steinert PM, Kim SY. Sporadic inclusion body myositis correlates with increased expression and cross-linking by transgluta-minases 1 and 2. J Biol Chem 2000; 275:8703-10.
47. Chorzelski TP, Beutner EH, Sulej J, Tchorzewska H, Jablonska S, Kumar V, Ka-puscinska A. IgA-antiendomysium antibody. A new immunological marker of der-matitis herpetiformis and coeliac disease. Br J Dermatol 1984;111:395-402.
70
48. Chorzelski TP, Sulej J, Tchorzewska H, Jablonska S, Beutner EH, Kumar V. IgA class endomysium antibodies in dermatitis herpetiformis and coeliac disease. Ann NY Acad Sci 1983; 420:325-34.
49. Christensen OB, Hindsen M, Svensson A. Natural history of dermatitis herpeti-formis in southern Sweden. Dermatologica 1986; 173:271-7.
50. Chung SI, Folk JE. Transglutaminase from hair follicle of guinea pig (crosslinking-fibrin-glutamyllysine-isoenzymes-purified enzyme). Proc Natl Acad Sci USA 1972; 69:303-7.
51. Civatte AC. [Histopathological diagnosis of the polymorphic painful dermatitis, Duhring-Brocq disease.] [In French.] Ann Dermatol Syphil 3:1-30.
52. Clemente MG, Musu MP, Frau F, Brusco G, Sole G, Corazza GR, De Virgiliis S. Immune reaction against the cytoskeleton in coeliac disease. Gut 2000; 47:520-6.
53. Clemente MG, Musu MP, Frau F, Lucia C, De Virgiliis S. Antitissue transglutami-nase antibodies outside celiac disease. J Pediatr Gastroenterol Nutr 2002; 34:31-4.
54. Collin P, Mäki M, Keyriläinen O, Hällström O, Reunala T, Pasternack A. Selective IgA deficiency and coeliac disease. Scand J Gastroenterol 1992;27:367-71.
55. Collin P, Reunala T, Pukkala E, Laippala P, Keyriläinen O, Pasternack A. Coeliac disease-associated disorders and survival. Gut 1994; 35:1215-8.
56. Corazza GR, Gasbarrini G. Coeliac disease in adults. Baillières Clin Gastroenterol 1995; 9:329-50.
57. Cornell H, Wieser H, Belitz HD. Characterization of the gliadin-derived peptides which are biologically active in coeliac disease. Chin Chim Acta 1992; 213:37-50.
58. Costello M. Dermatitis herpetiformis treated with sulphapyridine. Arch Dermatol Syphil 1940; 41:134.
59. Cronin CC, Shanahan F. Insulin-dependent diabetes mellitus and coeliac disease. Lancet 1997; 349:1096-7.
60. D’Amato M, Iannicola C, Monteriù G, Piacentini M. Mapping and sequencing of the murine ‘tissue’ transglutaminase (Tgm2) gene: absence of mutations in MRLIpr/Ipr mice. Cell Death Differ 1999; 6:216-7.
61. D’Argenio G, Biancone L, Cosenza V, Della Valle N, D’Armiento FP, Boirivant M, Pallone F, Mazzacca G. Transglutaminases in Crohn’s disease. Gut 1995; 37:690-5.
62. Darro F, Cahen P, Vianna A, Decaestecker C, Nogaret JM, Leblond B, Chaboteaux C, Ramos C, Petein M, Budel V, Schoofs A, Pourrias B, Kiss R. Growth inhibition of human in vitro and mouse in vitro and in vivo mammary tumor models by reti-noids in comparison with tamoxifen and the RU-486 anti-progestagen. Breast Can-cer Res Treat 1998; 51:39-55.
63. Davies MG, Marks R, Nuki G. Dermatitis herpetiformis – a skin manifestation of a generalized disturbance inimmunity. Q J Med 1978; 47:221-48.
64. De Laurenzi V, Melino G. Gene disruption of tissue transglutaminase. Mol Cell Biol 2001; 21:148-55.
65. De Vincenzi M, Luchetti R, Peruffo AD, Curioni A, Pgna NE, Gasbarrini G. In vitro assessment of acetic acid-soluble proteins (glutenin) in celiac disease. J Biochem Toxicol 1996; 11:205-10.
66. DeLong ER, DeLong DM, Clarke-Pearson, DL. Comparing the areas under two or more correlated receiver operating characteristic curve: A nonparametric approach. Biometrics 1988;44:837-45.
67. Dick HM, Fraser NG, Murray D. Immunofluorescent antibody studies in dermatitis herpetiformis. Br J Dermatol 1969; 81:692-6.

71
68. Dicke WK. [Coeliac disease. Investigation of the harmful effects of certain types of cereals on patients with coeliac disease.] PhD thesis, University of Utrecht [in Dutch]. 1950.
69. Dieterich W, Ehnis T, Bauer M, Donner P, Volta U, Riecken EO, Schuppan D. Identification of tissue transglutaminase as the autoantigen of celiac disease. Nat Med 1997; 3:797-801.
70. Dieterich W, Laag E, Bruckner-Tudermann L, Reunala T, Kárpáti S, Zágoni T, Riecken EO, Schuppan D. Antibodies to tissue transglutaminase as serologic mark-ers in patients with dermatitis herpetiformis. J Invest Dermatol 1999; 113(1):133-6.
71. Dieterich W, Laag E, Schöpper H, Volta U, Ferguson A, Gillett H, Riecken EO, Schuppan D. Autoantibodies to tissue transglutaminase as predictors of celiac dis-ease. Gastroenterology 1998; 115:1317-21.
72. Dieterich W. Identifizierung des Autoantigens der Zöliakie/Sprue. Doctoral thesis. Freie Universität Berlin, 1997.
73. Djilali-Saiah I, Schmitz J, Harfouch-Hammoud E, Mougenot JF, Bach JF, Caillat-Zucman S. CTLA-4 gene polymorphism is associated with predisposition to coeliac disease. Gut 1998; 43:187-9.
74. Duckert F, Jung E, Shmerling DH. A hitherto undescribed congenital haemorrhagic diathesis probably due to fibrin stabilizing factor deficiency. Thromb Diath Haem-orrh 1960; 5:179-86.
75. Dudek SM, Johnson GV. Transglutaminase catalyzes the formation of sodium do-decyl sulfate-insoluble, Alz-50-reactive polymers of tau. J Neurochem 1993; 61:1159-62.
76. Duhring LA. Dermatitis herpetiformis. JAMA 1884; 3:225-9. 77. Esposito C, Paparo F, Caputo I, Rossi M, Maglio M, Sblattero D, Not T, Porta R,
Auricchio S, Marzari R, Troncone R. Serum immunoglobulins A and G, and mono-clonal antibodies anti-tissue transglutaminase from coeliac patients inhibit the cata-lytic activity both in vitro and in situ. In: Mäki M, Tossavainen M (eds.). Proceed-ings of the workshop on transglutaminases, protein-cross-linking and coeliac dis-ease, September 14-15, 2001, Tampere, Finland. University Press Tampere. 145-8. pp.
78. Esposito C, Lombardi ML, Ruocco V, Cozzolino A, Mariniello L, Porta R. Implica-tion of tissue transglutaminase and desmoplakin in cell adhesion mechanism in hu-man epidermis. Mol Cell Biochem 2000; 206:57-65.
79. Eterman KP, Nefkens MJ, van der Meer JB. Failure to detect specific gluten anti-gens associated with the immune aggregates in the skin in dermatitis herpetiformis. Arch Dermatol Res 1977; 260:247-52.
80. Feng JF, Readon M, Yadav SP, Im MJ. Calreticulin down-regulates both GTP bind-ing and transglutaminase activities of transglutaminase II. Biochemistry 1999; 38:10743-9.
81. Fésüs L, Szondy Zs. Tissue transglutaminase and apoptosis. In: Mäki M, Tos-savainen M (eds.). Proceedings of the workshop on transglutaminases, protein-cross-linking and coeliac disease, September 14-15, 2001, Tampere, Finland. Uni-versity Press Tampere. 159-64. pp.
82. Fésüs L, Thomázy V, Falus A. Induction and activation of tissue transglutaminase during programmed cell death. FEBS Lett 1987; 224:104-8.

72
83. Field, JM, Shewry PR, Miflin BJ. The purification and characterization of homolo-gous high molecular weight storage proteins from grains of wheat, rye and barley. Theor Appl Genet 1982; 62:329-36.
84. Fink ML, Chung SI, Folk JE. ã-glutamylamine cyclotransferase: specificity toward å(L-ã-glutamyl) L-lysine and related compounds. Proc Natl Acad Sci USA 1980; 77:4564-8.
85. Folk JE, Cole PW, Mullooly JP. Mechanism of action of guinea pig liver transglu-taminase. The metal-dependent hydrolysis of p-nitrophenyl acetate; further observa-tions on the role of metal in enzyme activation. J Biol Chem 1967; 242:2615-21.
86. Folk JE, Cole PW, Mullooly JP. Mechanism of action of guinea pig liver transglu-taminase. V: The hydrolysis reaction. J Biol Chem 1968; 243:418-27.
87. Folk JE, Cole PW. Mechanism of action of guinea pig liver transglutaminase. J Biol Chem 1966; 241:5518-25.
88. Folk JE, Finlayson JS. The å-(ã-glutamyl)-lysine crosslink and the catalytic role of transglutaminases. Adv Protein Chem 1977; 31:1-133.
89. Folk JE. Mechanism and basis for specifity of transglutaminase catalyzed å-(ã-glutamyl)-lysine bond formation. Adv Enzymol 1983; 54:1-56.
90. Forloni G, Bertani I, Calella AM, Thaler F, Invernizzi R. Alpha-synuclein and Park-inson’s disease: selective neurodegenerative effect of alpha-synuclein fragment on dopaminergic neurons in vitro and in vivo. Ann Neurol 2000; 47:632-40.
91. Fraij BM, Gonzales RA. Organization and structure of the human tissue transgluta-minase gene. Biochim Biophys Acta 1997; 1345:65-71.
92. Friedrichs B, Koob R, Kraemer D, Drenckhahn D. Demonstration of immunoreac-tive forms of erythrocyte protein 4.2 in nonerythroid cells and tissues. Eur J Cell Biol 1989; 48:121-7.
93. Fry L, Keir P, McMinn RM, Cowan JD, Hoffbrand AV. Small-intestinal structure and function and haematological changes in dermatitis herpetiformis. Lancet 1967; ii(7519):729-33.
94. Fry L, McMinn RM, Cowan JD, Hoffbrand AV. Effect of gluten-free diet on derma-tological, intestinal, and haematological manifestations of dermatitis herpetiformis. Lancet 1968; i(7542):557-61.
95. Fry L, Seah PP, Harper PG, Hoffbrand AV, McMinn RM. The small intestine in dermatitis herpetiformis. J Clin Pathol 1974; 27:817-24.
96. Fry L. Dermatitis herpetiformis. Baillière Clin Gastr 1995; 9:371-94. 97. Fry L. Fine points in the management of dermatitis herpetiformis. Semin Dermatol
1988; 7:206-11. 98. Gardner MJ, Altman DG, eds. Statistics with confidence – confidence intervals and
statistical guidelines. London: British Medical Journal, 1989:28 pp. 99. Garioch JJ, Lewis HM, Sargent SA, Leonard JN, Fry L. 25 years’ experience of a
gluten free diet in the teatment of dermatitis herpetiformis. Br J Dermatol 1994; 131:541-5.
100. Gaudry CA, Verderio E, Aeschlimann D, Cox A, Smith C, Griffin M. Cell surface localization of tissue transglutaminase is dependent on a fibronectin-binding site in its N-terminal â-sandwich domain. J Biol Chem 1999; 274:30707-14.
101. Gawkrodger DJ, Blackwell JN, Gilmour HM, Rifkind EA, Heading RC, Barnet-son RS. Dermatitis herpetiformis: diagnosis, diet and demography. Gut 1984; 25:151-7.
102. Gee S. On the coeliac affection. St Bartholomew’s Hosp Rep 1888; 24:17-20.

73
103. Gentile V, Davies PJA, Baldini A. The human tissue transglutaminase gene maps on chromosome 20q12 by in situ fluorescence hybridization. Genomics 1994; 20:295-7.
104. Gentile V, Saydak M, Chiocca EA, Akande O, Birckbichler PJ, Lee KN, Stein JP, Davies PJ. Isolation and characterization of cDNA clones to mouse macrophage and human endothelial cell tissue transglutaminases. J Biol Chem 1991;266:478-83.
105. Gentile V, Thomázy V, Piacentini M, Fésüs L, Davies PJA. Expression of tissue transglutaminase in Balb-c 3T3 fibroblasts: Effects on cellular morphology and ad-hesion. J Cell Biol 1992; 119:463-74.
106. Gentile V, Violante V, D'Amico B, Illiano M, Luongo A. Tissue transglutaminase and coeliac disease pathogenesis: potential molecular mechanisms for other human diseases. Neurochem Int 2002; 40:79-83.
107. Gillberg R, Dotevall G, Ahren C. Chronic inflammatory bowel disease in patients with coeliac disease. Scand J Gastroenterol 1982;17:491-6.
108. Greco L, Mäki M, Di Donato F, Visakorpi JK. Epidemiology of coeliac disease in Europe and the Mediterranean Area. A summary report on the multicentre study by the European Society of Paediatric Gastroenterology and Nutrition. In: Auricchio S, Visakorpi JK (eds). Common food intolerances 1: Epidemiology of coeliac disease. Dyn Nutr Res. Basel: Karger. 1992: 25-44 pp.
109. Greenberg CS, Achyuthan KE, Borowitz MJ, Shuman MA. The transglutaminase in vascular cells and tissues could provide an alternative pathway for fibrin stabiliza-tion. Blood 1987; 70:702-9.
110. Greenberg CS, Birckbichler PJ, Rice RH. Transglutaminases: multifunctional cross-linking enzymes that stabilize tissues. FASEB J 1991; 5:3071-7.
111. Greenberg DA, Hodge SE, Rotter JI. Evidence for recessive and against dominant inheritance at the HLA-"linked" locus in coeliac disease. Am J Hum Genet 1982; 34:263-77.
112. Greenberger NJ, Isselbacher KJ. Disorders of absorption. In: Isselbacher KJ, Braunwald E, Wilson JD, Martin JB, Fauci AS, Kasper DL (Eds.). Harrison’s prin-ciples of internal medicine. New York: McGraw-Hill Inc. 1994:1386-400. pp.
113. Grenard P, Bates MK, Aeschlimann D. Evolution of transglutaminase genes: identification of a transglutaminase gene cluster on human chromosome 15q15. Structure of the gene encoding transglutaminase X and a novel gene family member, transglutaminase Z. J Biol Chem 2001; 276:33066-78.
114. Haas SV. Celiac disease, its specific treatment and cure without nutritional re-lapse. JAMA 1932; 99:448-52.
115. Halttunen T, Mäki M. Serum immunoglobulin A from patients with celiac disease inhibits human T84 intestinal crypt epithelial cell differentiation. Gastroenterology 1999; 116:566-72.
116. Halttunen T, Marttinen A, Rantala I, Kainulainen H, Mäki M. Fibroblasts and transforming growth factor-â induce organization and differentiation of T84 human epithelial cells. Gastroenterology 1996; 111:1252-62.
117. Harding HW, Rogers GE. å-(ã-glutamyl)lysine cross-linkage in citrulline-containing protein fractions from hair. Biochemistry 1971; 10:624-30.
118. Haroon ZA, Hettasch JM, Lai TS, Dewhirst MW, Greenberg CS. Tissue transglu-taminase is expressed, active, and directly involved in rat dermal wound healing and angiogenesis. FASEB J 1999; 13:1787-95.
74
119. Hällström O. Comparison of IgA-class reticulin and endomysium antibodies in coeliac disease and dermatitis herpetiformis. Gut 1989;30:1225-32.
120. Helin H, Mustonen J, Reunala T, Pasternack A. IgA nephropathy associated with celiac disease and dermatitis herpetiformis. Arch Pathol Lab Med 1983; 107:324-7.
121. Hellmich M. Receiver operating characteristic (ROC) Kurven und Flächen da-runter. [PhD thesis] 1996. http://www.medizin.uni-koeln.de/kai/imsie/homepages/ Martin.Hellmich/dr.html (accessed June 1999)
122. Hitomi K, Horio Y, Ikura K, Yamanishi K, Maki M. Analysis of epidermal-type transglutaminase (TGase 3) expression in mouse tissues and cell lines. Int J Bio-chem Cell B 2001; 33:491-498.
123. Hitomi K, Kanehiro S, Ikura K, Maki M. Characterization of recombinant mouse epidermal-type transglutaminase (TGase 3): regulation of its activity by proteolysis and guanine nucleotides. J Biochem 1999; 125:1048-54.
124. Holopainen P, Mustalahti K, Uimari P, Collin P, Mäki M, Partanen J. Candidate gene regions and genetic heterogeneity in gluten sensitivity. Gut 2001; 48:696-701.
125. Horváth K. A gliadin hatásainak vizsgálata in vivo és in vitro körülmények között. Kandidátusi értekezés Budapest, 1987.
126. Horváth K, Horn G, Walcz E, Zavodni I, Bodánszky H. A leukocyta migráció gátlás vizsgálata coeliakiában. Orv Hetil 1990; 131:2471-4.
127. Howdle PD, Ciclitira PJ, Simpson FG, Losowsky MS. Are all gliadins toxic in coeliac disease? An in vitro study of á-, â-, ã-, and ù-gliadins. Scand J Gastroenterol 1984; 19:41-7.
128. Howdle PD, Losowsky MS. Coeliac disease in adults. In: Marsh MN (ed.). Coeliac disease. Oxford: Blackwell 1992; pp. 49-80.
129. Huber M, Rettler I, Bernasconi K, Frenk E, Lavrijsen SPM, Ponec M, Bon A, Lautenschlager S, Schorderet DF, Hohl D. Mutations of keratinocyte transglutami-nase in lamellar ichthyosis. Science 1995; 267:525-8.
130. Humbert P, Dupond JL, Vuitton D, Agache P. Dermatological autoimmune dis-eases and the multiple autoimmune syndromes. Acta Derm Venereol Suppl (Stockh) 1989; 148:1-8.
131. Igarashi S, Koide R, Shimohata T, Yamada M, Hayashi Y, Takano H, Date H, Oyake M, Sato T, Sato A, Egawa S, Ikeuchi T, Tanaka H, Nakano R, Tanaka K, Hozumi I, Inuzuka T, Takahashi H, Tsuji S. Suppression of aggregate formation and apoptosis by transglutaminase inhibitors in cells expressing truncated DRPLA pro-tein with an expanded polyglutamine stretch. Nat Genet 1998; 18:111-7.
132. Iismaa SE, Chung L, Wu MJ, Teller DC, Yee VC, Graham RM. The core domain of the tissue transglutaminase Gh hydrolyzes GTP and ATP. Biochemistry 1997; 36:11655-64.
133. Ikura K, Nasu T, Yokota H, Tsuchiya Y, Sasaki R, Chiba H. Amino acid sequence of guinea pig liver transglutaminase from its cDNA sequence. Biochemistry 1988; 27:2898-905.
134. Ikura K, Yokota H, Sasaki R, Chiba H. Determination of amino- and carboxyl-terminal sequences of guinea pig liver transglutaminase: Evidence for amino-terminal processing. Biochemistry 1989; 28:2344-8.
135. Janatuinen EK, Kemppainen TA, Julkunen RJK, Kosma VM, Mäki M, Heikkinen M, Uusitupa MIJ. No harm from five year ingestion of oats in coeliac disease. Gut 2002; 50:332-5.

75
136. Janatuinen EK, Kemppainen TA, Pikkarainen PH, Holm KH, Kosma VM, Uusi-tupa MIJ, Mäki M, Julkunen RJK. Lack of cellular and humoral immunological re-sponses to oats in adults with coeliac disease. Gut 2000; 46:327-31.
137. Janatuinen EK, Pikkarainen PH, Kemppainen TA, Kosma VM, Järvinen RM, Uusitupa MI, Julkunen RJ. A comparison of diets with and without oats in adults with celiac disease. N Engl J Med 1995; 333:1033-7.
138. Jensen PH, Sorensen ES, Petersen TE, Gliemann J, Rasmussen LK. Residues in the synuclein consensus motif of the alpha-synuclein fragment, NAC, participate in transglutaminase-catalysed cross-linking to Alzheimer-disease amyloid beta A4 peptide. Biochem J 1995; 310:91-4.
139. Jones RA, Nicholas B, Mian S, Davies PJA, Griffin M. Reduced expression of tissue transglutaminase in a human endothelial cell line leads to changes in cell spreading, cell adhesion and reduced polymerisation of fibronectin. J Cell Sci 1997; 110:2461-72.
140. Juhász M, Zágoni T, Tóth M, Tulassay Zs. A coeliakia napjainkban: a bõvülõ is-meretek áttekintése. Orv Hetil 2000; 141:2583-93.
141. Kagnoff MF, Austin RK, Hubert JJ, Bernardin JE, Kasarda DD. Possible role for a human adenovirus in the pathogenesis of celiac disease. J Exp Med 1984; 160:1544-57.
142. Kahlem P, Terre C, Green H, Djian P. Peptides containing glutamine repeats as substrates for transglutaminase-catalyzed cross-linking: relevance to diseases of the nervous system. Proc Natl Acad Sci USA 1996; 93:14580-5.
143. Kaplan RP, Callen JP. Dermatitis herpetiformis: autoimmune disease associations. Clin Dermatol 1991; 9:347-60.
144. Kárpáti S. Advances in pathophysiology of dermatitis herpetiformis. Eur J Derma-tol 1992; 2:389-97.
145. Kárpáti S. A gyermekkori dermatitis herpetiformis Duhring. Kandidátusi érteke-zés Budapest, 1987.
146. Kárpáti S, Bürgin-Wolff A, Krieg T, Meurer M, Stolz W, Braun-Falco O. Binding to human jejunum of serum IgA antibody from children with coeliac disease. Lancet 1990; 336:1335-38.
147. Kárpáti S, Kósnai I, Török É, Kovács JB. Immunoglobulin A deposition in jejunal mucosa of children with dermatitis herpetiformis. J Invest Dermatol 1988; 91:336-9.
148. Kárpáti S, Meurer M, Stolz W, Bürgin-Wolff A, Braun-Falco O, Krieg T. Ultra-structural binding sites of endomysium antibodies from sera of patients with derma-titis herpetiformis and coeliac disease. Gut 1992; 33:191-3.
149. Kárpáti S, Meurer M, Stolz W, Schrallhammer K, Krieg T, Braun-Falco O. Der-matitis herpetiformis bodies. Ultrastructural study on the skin of patients using di-rect preembedding immunogold labeling. Arch Dermatol 1990; 126:1469-74.
150. Kárpáti S, Stolz W, Meurer M, Krieg T, Braun-Falco O. Extracellular binding sites of IgA anti-jejunal antibodies on normal small bowel detected by indirect im-munoelectronmicroscopy. J Invest Dermatol 1991; 96:228-33.
151. Kárpáti S, Török É, Kósnai I. Discrete palmar and plantar symptoms in children with dermatitis herpetiformis Duhring. Cutis 1986; 37:184-7.
152. Kárpáti S, Török É, Kósnai I. IgA class antibody against human jejunum in sera of children with dermatitis herpetiformis. J Invest Dermatol 1986; 87:703-6.

76
153. Kaukinen K, Turjanmaa K, Mäki M, Partanen J, Venäläinen R, Reunala T, Collin P. Intolerance to cereals is not specific for coeliac disease. Scand J Gastroenterol 2000; 35:942-6.
154. Kim HC, Lewis MS, Gorman JJ, Park SC, Girard JE, Folk JE, Chung SI. Pro-transglutaminase E from guinea pig skin. Isolation and partial characterization. J Biol Chem 1990; 265:21971-8.
155. Kim IG, Gorman JJ, Park SC, Chung SI, Steinert PM. The deduced sequence of the novel protransglutaminase E (TGase3) of human and mouse. J Biol Chem 1993; 268:12682-90.
156. Kim, IG, McBride OW, Wang M, Kim SY, Idler WW, Steinert PM. Structure and organization of the human transglutaminase 1 gene. J Biol Chem 1992; 267:7710-7.
157. Kim SY, Jeitner TM, Steinert PM. Transglutaminases in disease. Neurochem Int 2002; 40:85-103.
158. Kohfeldt E, Maurer P, Vannahme C, Timpl R. Properties of the extracellular cal-cium binding module of the proteoglycan testican. FEBS Lett 1997;414:557-61.
159. Koop I, Ilchmann R, Izzi L, Adragna A, Koop H, Barthelmes H. Detection of autoantibodies against tissue transglutaminase in patients with celiac disease and dermatitis herpetiformis. Am J Gastroenterol 2000; 95:2009-14.
160. Kordonouri O, Dieterich W, Schuppan D, Webert G, Muller C, Sarioglu N, Becker M, Danne T. Autoantibodies to tissue transglutaminase are sensitive sero-logical parameters for detecting silent coeliac disease in patients with type 1 diabe-tes mellitus. Diabet Med 2000; 17:441-4.
161. Korponay-Szabó IR, Czinner A, Kovács J, Vámos A, Gorácz Gy, Szabó T. Milyen gyakori a coeliakia elõfordulása a magyar népességben? Gyermek-gyógyászat 1997; 3:236-41.
162. Korponay-Szabó IR, Dahlbom I, Mäki M. Recognition of transglutaminase 2 by coeliac autoantibodies – importance of TG2 conformations and cofactors. In: Mäki M, Tossavainen M (eds.). Proceedings of the workshop on transglutaminases, pro-tein-cross-linking and coeliac disease, September 14-15, 2001, Tampere, Finland. University Press Tampere. 123-133.
163. Korponay-Szabó IR, Sulkanen S, Halttunen T, Maurano F, Rossi M, Mazzarella G, Laurila K, Troncone R, Mäki M. Tissue transglutaminase is the target in both ro-dent and primate tissues for celiac disease-specific autoantibodies. J Pediatr Gastr Nutr. 2000; 31:520-7.
164. Korsgren C, Lawler J, Lambert S, Speicher D, Cohen CM. Complete amino acid sequence and homologies of human erythrocyte membrane protein band 4.2. Proc Natl Acad Sci USA 1990; 87:613-7.
165. Kósnai I, Kárpáti S, Török É, Bucsky P, Gyódi É. Dermatitis herpetiformis in monozygous twins: discordance for dermatitis herpetiformis and concordance for gluten sensitive enteropathy. Eur J Pediatr 1985; 144:404-5.
166. Kósnai I. Gastroenterologiai munkacsoport beszámoló. Magyar Pediáter 1987; 21:31-3.
167. Kósnai I. A tehéntejallergia enteralis formája és a gluténszenzitív enteropathiák. Kandidátusi értekezés Budapest, 1986.
168. Krupièková S, Tuèková L, Flegelová Z, Michalak M, Walters JR, Whelan A, Har-ries J, Vencovsky J, Tlaskalová-Hogenová H. Identification of common epitopes on gliadin, enterocytes, and calreticulin recognised by antigliadin antibodies of patients with coeliac disease. Gut 1999; 44:168-73.

77
169. Kull K, Uibo O, Salupere R, Metsküla K, Uibo R. High frequency of antigliadin antibodies and absence of antireticulin and antiendomysium antibodies in patients with ulcerative colitis. J Gastroenterol 1999; 34:61-5.
170. Kumar V, Hemedinger E, Chorzelski TP, Beutner EH, Valeski JE, Kowalewski C. Reticulin and endomysial antibodies in bullous diseases. Comparison of specificity and sensitivity. Arch Dermatol 1987;123:1179-82.
171. Ladinser B, Rossipal E, Pittschieler K. Endomysium antibodies in coeliac disease: an improved method. Gut 1994;35(6):776-8.
172. Laemmli, UK. Cleavage of structural proteins during the assembly of the head of bacteriophage T4. Nature 1970;227:680-5.
173. Lai TS, Bielawska A, Peoples KA, Hannun YA, Greenberg CS. Sphingosylphos-phocholine reduces the calcium ion requirement for activating tissue transglutami-nase. J Biol Chem 1997; 272:16295-300.
174. Lai TS, Hausladen A, Slaughter TF, Eu JP, Stamler JS, Greenberg CS. Calcium regulates S-nitrosylation, denitrosylation, and activity of tissue transglutaminase. Biochemistry 2001; 40:4904-10.
175. Lai TS, Slaughter TF, Peoples KA, Hettasch JM, Greenberg CS. Regulation of human tissue transglutaminase function by magnesium-nucleotide complexes. Iden-tification of distinct binding sites for Mg2+-GTP and Mg2+-ATP. J Biol Chem 1998; 273:1776-81.
176. Laki K, Lóránd L. On the solubility of fibrin clots. Science 1948; 108:280. 177. Lampasona V, Bonfanti R, Bazzigaluppi E, Venerando A, Chiumello G, Bosi E,
Bonifacio E. Antibodies to tissue transglutaminase C in type I diabetes. Diabetolo-gia 1999; 42:1195-8.
178. Leavitt RY, Fauci AS, Bloch DA, Michel BA, Hunder GG, Arend WP, Calabrese LH, Fries JF, Lie JT, Lightfoot RW Jr, Masi AT, McShane DJ, Mills JA, Stevens MB, Wallace SL, Zvaifler NJ. The American College of Rheumatology 1990 crite-ria for the classification of Wegener’s granulomatosis. Arthritis Rheum 1990; 33:1101-7.
179. Lesort M, Attanavanich K, Zhang J, Johnson GV. Distinct nuclear localization and activity of tissue transglutaminase. J Biol Chem 1998; 273:11991-4.
180. Lesort M, Tucholski J, Miller ML, Johnson GV. Tissue transglutaminase: a possi-ble role in neurodegenerative diseases. Prog Neurobiol 2000; 61:439-63.
181. Lichti U, Ben T, Yuspa SH. Retinoic acid-induced transglutaminase in mouse epidermal cells is distinct from epidermal transglutaminase. J Biol Chem 1985; 260:1422-6.
182. Littlewood JM. Coeliac disease in childhood. Baillière Clin Gastr 1995; 9:295-327.
183. Littlewood JM. Gastrointestinal complications in cystic fibrosis. J Roy Soc Med 1992; 85(suppl. 18):13-9.
184. Liu S, Cerione RA, Clardy J. Structural basis for the guanine nucleotide-binding activity of tissue transglutaminase and its regulation of transamidation activity. Proc Natl Acad Sci USA 2002; 99:2743-7.
185. Lock RJ, Gilmour JEM, Unsworth DJ. Anti-tissue transglutaminase, anti-endomysium and anti-R1-reticulin autoantibodies – the antibody trinity of coeliac disease. Clin Exp Immunol 1999; 116:258-62.
186. Loewy AG, Veneziale C, Forman M. Purification of the factor involved in forma-tion of urea-insoluble fibrin. Biochim Biophys Acta 1957; 26:670-1.

78
187. Lóránd L, Campbell LK, Robertson BJ. Enzymatic coupling of isoniazid to pro-teins. Biochemistry 1972; 11:434-8.
188. Lóránd L, Hsu LK, Siefring GE Jr, Rafferty NS. Lens transglutaminase and cata-ract formation. Proc Natl Acad Sci USA 1981; 78:1356-60.
189. Lóránd L, Conrad SM. Transglutaminases. Mol Cell Biochem 1984; 58:9-35. 190. Lóránd L. A study on the solubility of fibrin clots in urea. Acta Physiol Acad Sci
Hung 1948; 1:192-6. 191. Lóránd L. Fibrin clots. Nature 1950; 166:694-5. 192. Lundin KE, Sollid LM, Anthonsen D, Norén O, Molberg Ø, Thorsby E, Sjöström
H. Heterogeneous reactivity patterns of HLA-DQ-restricted, small intestinal T-cell clones from patients with celiac disease. Gastroenterology 1997; 112:752-9.
193. Mäki M, Collin P. Coeliac disease. Lancet 1997; 349:1755-9. 194. Mäki M, Hällström O, Marttinen A. Reaction of human non-collagenous polypep-
tides with celiac disease autoantibodies. Lancet 1991; 338:724-725. 195. Mäki M, Holm K, Lipsanen V, Hällström O, Viander M, Collin P, Savilahti E,
Koskimies S. Serological markers and HLA genes among healthy first-degree rela-tives of patients with coeliac disease. Lancet 1991; 338:1350-3.
196. Mäki M. The humoral immune system in coeliac disease. Baillière Clin Gastr 1995;9:231-50.
197. Marks J, Shuster S, Watson AJ. Small-bowel changes in dermatitis herpetiformis. Lancet 1966; ii(7476):1280-2.
198. Marsh MN. Gluten, major histocompatibility complex, and the small intestine. Gastroenterology 1992; 102:330-54.
199. Masi AT, Rodnan GP, Medsger TA Jr, Altman RD, D’Angelo WA, Fries JF, LeRoy EC, Kirsner AB, MacKenzie AH, McShane DJ, Myers AR, Sharp GC. Pre-liminary criteria for the classification of systemic sclerosis (scleroderma). Subcom-mittee for scleroderma criteria of the American Rheumatism Association Diagnostic and Therapeutic Criteria Committee. Arthritis Rheum 1980; 23:581-90.
200. Maurino E, Capizzano H, Niveloni S, Kogan Z, Valero J, Boerr L, Bai JC. Value of endoscopic markers in celiac disease. Dig Dis Sci 1993; 38:2028-33.
201. McDonald WC, Dobbins WO, Rubin CE. Studies of the familial nature of celiac sprue using biopsy of the small intestine. N Engl J Med 1965; 272:448-56.
202. Melino G, Bernassola F, Knight RA, Corasaniti MT, Nistico G, Finazzi-Agro A. S-nitrosylation regulates apoptosis. (Letter) Nature 1997; 388:432-3.
203. Meuwisse GW. Diagnostic criteria in coeliac disease. Act Paediatr Scand 1970; 59:461-3.
204. Mobacken H, Kastrup W, Nilsson LA. Incidence and prevalence of dermatitis herpetiformis in western Sweden. Acta Derm Venereol (Stockh) 1984; 64:400-4.
205. Mobacken H, Anderson H, Dahlberg E, Fransson K, Gillberg R, Kastrup W, Stockbrugger R. Spontaneous remission of dermatitis herpetiformis: dietary and gas-trointestinal studies. Acta Derm Venereol (Stockh) 1986; 66:245-50.
206. Moi H. Incidence and prevalence of dermatitis herpetiformis in a county in central Sweden, with comments on the course of the disease and IgA deposits as diagnostic criterion. Acta Derm Venereol (Stockh) 1984; 64:144-50.
207. Molberg Ø, Mcadam SN, Korner R, Quarsten H, Kristiansen C, Madsen L, Fug-ger L, Scott H, Noren O, Roepstorff P, Lundin KE, Sjostrom H, Sollid LM. Tissue transglutaminase selectively modifies gliadin peptides that are recognized by gut-derived T cells in celiac disease. Nat Med 1998; 4:713-7.
79
208. Molberg Ø, McAdam S, Lundin KE, Kristiansen C, Arentz-Hansen H, Kett K, Sollid LM. T cells from celiac disease lesions recognize gliadin epitopes deamidated in situ by endogenous tissue transglutaminase. Eur J Immunol 2001; 31:1317-23.
209. Mossman D. Resampling techniques in the analysis of non-binormal ROC data. Med Decis Making 1995;15:358-66.
210. Moulin G, Barrut D, Franc MP, Viornery P, Knezynski S. Localisations palmaires pseudopurpuriques de la dermatitis herpetiforme. Ann Dermatol Venereol 1983; 110:121-6.
211. Mulder CJ, Tytgat GN. Coeliac disease and related disorders. Neth J Med 1987; 31:286-99.
212. Murray JA. Serodiagnosis of celiac disease. Clin Lab Med 1997; 17:445-64. 213. Muszbek L, Ádány R, Mikkola H. Novel aspects of blood coagulation factor XIII.
I. Structure, distribution, activation, and function. Crit Rev Clin Lab Sci 1996; 33: 357-421.
214. Mycek MJ, Clarke DD, Neidle A, Waelsch H. Arch Biochem Biophys 1959; 84:528-40.
215. Nakachi K, Swift G, Wilmot D, Chapman C, Baker S, Powell M, Furmaniak J, Rees Smith B. Antibodies to tissue transglutaminase: comparison of ELISA and immunoprecipitation assay in the presence and in the absence of calcium ions. Clin Chim Acta 2001; 304:75-84.
216. Nakaoka H, Perez DM, Baek KJ, Das T, Husain A, Misono K, Im MJ, Graham RM. Gh: a GTP-binding protein with transglutaminase activity and receptor signal-ing function. Science 1994; 264:1593-6.
217. Nanda N, Iismaa SE, Owens WA, Husain A, Mackay F, Graham RM. Targeted inactivation of Gh/tissue transglutaminase II. J Biol Chem 2001; 276:20673-8.
218. Nunes I, Gleizes PE, Metz CN, Rifkin DB. Latent transforming growth factor-â binding protein domains involved in activation and transglutaminase-dependent cross-linking of latent transforming growth factor-â. J Cell Biol 1997; 136:1151-63.
219. Ogawa H, Goldsmith LA. Human epidermal transglutaminase. Preparation and properties. J Biol Chem 1976; 251:7281-8.
220. Parenteau NL, Pilato A, Rice H. Induction of keratinocyte type-I transglutaminase in epithelial cells of the rat. Differentiation 1986; 33:130-41.
221. Piacentini M, Ceru MP, Dini L, Dirao M, Piredda L, Thomázy V, Davies PJA, Fésüs L. In vivo and in vitro induction of tissue transglutaminase in rat hepatocytes by retinoic acid. Biochim Biophys Acta 1992; 1135:171-9.
222. Piacentini M, Colizzi V. Tissue transglutaminase: apoptosis versus autoimmunity. Immunol Today 1999; 20:130-4.
223. Picarelli A, Di Tola M, Sabbatella L, Gabrielli F, Di Cello T, Anania MC, Mas-tracchio A, Silano M, De Vincenzi M. Immunologic evidence of no harmful effect of oats in celiac disease. Am J Clin Nutr 2001; 74:137-40.
224. Piredda L, Amendola A, Colizzi V, Davies PJA, Farrace MG, Fraziano M, Gentile V, Uray I, Piacentini M, Fésüs L. Lack of ‘tissue’ transglutaminase protein cross-linking leads to leakage of macromolecules from dying cells: relationship to devel-opment of autoimmunity in MRLIpr/Ipr mice. Cell Death Differ 1997; 4:463-72.
225. Preisz K, Kárpáti S. Analysis of vascular immunoglobulin and C3 deposition in skin of 116 dermatitis herpetiformis patients. J Invest Dermatol 2001; 117:779. (Ab-stract)

80
226. Preisz K, Kárpáti S, Sárdy M, Zágoni T, Horváth A. Codistribution of tissue transglutaminase and tissue-bound IgA in jejunum of patients with dermatitis her-petiformis. J Invest Dermatol 2000; 115:580. (Abstract)
227. Price P, Witt C, Allcock R, Sayer D, Garlepp M, Kok CC, French M, Mallal S, Christiansen F. The genetic basis for the association of the 8.1 ancestral haplotype (A1, B8, DR3) with multiple immunopathological diseases. Immunol Rev 1999; 167:257-74.
228. Reeves GEM, Burns C, Hall ST, Gleeson M, Lemmert K, Clancy RL. The meas-urement of IgA and IgG transglutaminase antibodies in celiac disease: a comparison with current diagnostic methods. Pathology 2000; 32:181-5.
229. Reunala T, Helin H, Pasternack A, Linder E, Kalimo K. Renal involvement and circulating immune complexes in dermatitis herpetiformis. J Am Acad Dermatol 1983; 9:219-23.
230. Reunala T, Kósnai I, Kárpáti S, Kuitunen P, Török É, Savilahti E. Dermatitis her-petiformis in children: Jejunal findings and skin response to gluten-free diet. Arch Dis Child 1984; 59:517-22.
231. Reunala T, Lokki J. Dermatitis herpetiformis in Finland. Acta Derm-Venereol 1978; 58:505-10.
232. Reunala T. Dermatitis herpetiformis: coeliac disease of the skin. Ann Med 1998; 30:416-8.
233. Rosenthal AK, Masuda I, Gohr CM, Derfus BA, Le M. The transglutaminase, factor XIIIA, is present in articular chondrocytes. Osteoarthr Cartilage 2001; 9:578-81.
234. Rubin C, Brandborg LL, Phelps PC, Taylor HC. Studies of celiac disease. Part I. The apparent identical and specific nature of the duodenal and proximal jejunal le-sion in celiac disease and idiopathic sprue. Gastroenterology 1960; 38:28-38.
235. Rubin AL, Rice RH. Differential regulation by retinoic acid and calcium of trans-glutaminases in cultured neoplastic and normal human keratinocytes. Cancer Res 1986; 46:2356-61.
236. Rumbo M, Chirdo FG, Ben R, Saldungaray I, Villalobos R. Evaluation of coeliac disease serological markers in Down syndrome patients. Dig Liver Dis 2002; 34:116-21.
237. Sakula J, Shiner M. Coeliac disease with atrophy of the small intestine mucosa. Lancet 1957; ii:876.
238. Sanchez D, Tuèková L, Sebõ P, Michalak M, Whelan A, Sterzl I, Jelinková L, Havrdová E, Imramovská M, Benes Z, Krupièková S, Tlaskalová-Hogenová H. Oc-currence of IgA and IgG autoantibodies to calreticulin in coeliac disease and various autoimmune diseases. J Autoimmun 2000; 15:441-9.
239. Sárdy M, Kárpáti S, Merkl B, Paulsson M, Smyth N. Epidermal transglutaminase (TGase 3) is the autoantigen of dermatitis herpetiformis. J Exp Med 2002; 195:747-57.
240. Sárdy M, Kárpáti S, Péterfy F, Rásky K, Tomsits E, Zágoni T, Horváth A. Com-parison of a tissue transglutaminase ELISA with the endomysium antibody test in the diagnosis of gluten-sensitive enteropathy. Z Gastroenterol 2000; 38:295-300.
241. Sárdy M, Odenthal U, Kárpáti S, Paulsson M, Smyth N. Recombinant human tis-sue transglutaminase ELISA for the diagnosis of gluten sensitive enteropathy. Clin Chem 1999; 45:2142-9.
81
242. Sarkar NK, Clarke DD, Waelsch H. An enzymically catalyzed incorporation of amines into proteins. Biochim Biophys Acta 1957; 25:451-2.
243. Savilahti E, Arató A, Verkasalo M. Intestinal ã/ä receptor -bearing T lymphocytes in celiac disease and inflammatory bowel diseases in children. Constant increase in celiac disease. Pediatr Res 1990; 28:579-81.
244. Savilahti E, Ormala T, Arató A, Hacsek G, Holm K, Klemola T, Németh A, Mäki M, Reunala T. Density of ã/ä+ T cells in the jejunal epithelium of patients with coeliac disease and dermatitis herpetiformis is increased with age. Clin Exp Immu-nol 1997; 109:464-7.
245. Schmidt R, Michel S, Shroot B, Reichert U. Transglutaminases in normal and transformed human keratinocytes in culture. J Invest Dermatol 1988; 90:475-9.
246. Schmidt TGM, Koepke J, Frank R, Skerra A. Molecular interaction between the Strep-tag affinity peptide and its cognate target streptavidin. J Mol Biol 1996; 255:753-66.
247. Schuppan D. Current concepts of celiac disease pathogenesis. Gastroenterology 2000; 119:234-42.
248. Seah PP, Fry L, Hoffbrand AV, Holborow EJ. Tissue antibodies in dermatitis herpetiformis and adult coeliac disease. Lancet 1971; i:834-6.
249. Seah PP, Fry L, Rossiter MA, Hoffbrand AV, Holborow EJ. Anti-reticulin anti-bodies in childhood coeliac disease. Lancet 1971; ii:681-2.
250. Seitz J, Keppler C, Rausch U, Aumuller G. Immunohistochemistry of secretory transglutaminase from rodent prostate. Histochemistry 1990; 93:525-30.
251. Selkoe DJ, Abraham C, Ihara Y. Brain transglutaminase: in vitro crosslinking of human neurofilament proteins into insoluble polymers. Proc Natl Acad Sci USA 1982; 79:6070-4.
252. Shuster S, Watson AJ, Marks J. Coeliac syndrome in dermatitis herpetiformis. Lancet 1968; i(7552):1101-6.
253. Sjöström H, Lundin KE, Molberg Ø, Korner R, McAdam SN, Anthonsen D, Quarsten H, Norén O, Roepstorff P, Thorsby E, Sollid LM. Identification of a gli-adin T-cell epitope in coeliac disease: general importance of gliadin deamidation for intestinal T-cell recognition. Scand J Immunol 1998; 48:111-5.
254. Small K, Feng JF, Lorenz J, Donnelly ET, Yu A, Im MJ, Dorn GW 2nd, Liggett SB. Cardiac specific overexpression of transglutaminase II (G(h)) results in a unique hypertrophy phenotype independent of phospholipase C activation. J Biol Chem 1999; 274:21291-6.
255. Sollid LM. Molecular basis of celiac disease. Annu Rev Immunol 2000; 18:53-81. 256. Sollid LM, Molberg O, McAdam S, Lundin KE. Autoantibodies in coeliac dis-
ease: tissue transglutaminase – guilt by association? Gut 1997; 41:851-2. 257. Spina AM, Esposito C, Pagano M, Chiosi E, Mariniello L, Cozzolino A, Porta R,
Illiano G. GTPase and transglutaminase are associated in the secretion of the rat an-terior prostate. Biochem Biophys Res Commun 1999; 260:351-356.
258. Stewart K, Willoughby JMT. Postnatal presentation of coeliac disease. Br Med J 1988; 297:1245.
259. Sulkanen S, Halttunen T, Laurila K, Kolho KL, Korponay-Szabó IR, Sarnesto A, Savilahti E, Collin P, Mäki M. Tissue transglutaminase autoantibody enzyme-linked immunosorbent assay in detecting celiac disease. Gastroenterology 1998;115:1322-8.

82
260. Szabó B. A gluten indukálta enteropathia sajátosságai, diagnosztikája és kezelése csecsemõ- és kisgyermekkorban. Kandidátusi értekezés Debrecen, 1988.
261. Szabolcs M, Sipka S, Csorba S. In vitro cross-linking of gluten into high molecu-lar weight polymers with transglutaminase. Acta Paediatr Hung 1987; 28:215-27.
262. Takeuchi Y, Birckbichler PJ, Patterson Jr MK, Lee KN. Putative nucleotide bind-ing sites of guinea pig liver transglutaminase. FEBS Lett 1992; 307:177-80.
263. Tan EM, Cohen AS, Fries JF, Masi AT, McShane DJ, Rothfield NF, Schaller JG, Talal N, Winchester RJ. The 1982 revised criteria for the classification of systemic lupus erythematosus. Arthritis Rheum 1982; 25:1271-7.
264. Teesalu K, Uibo O, Kalkkinen N, Janmey P, Uibo R. Increased levels of IgA anti-bodies against desmin in children with coeliac disease. Int Arch Allergy Immunol 2001; 126:157-66.
265. Thacher SM, Rice RH. Keratinocyte-specific transglutaminase of cultured human epidermal cells: relation to cross-linked envelope formation and terminal differentia-tion. Cell 1985; 40:685-95.
266. Thomas C. On the coeliac affection. In: Major RH, ed. Classic descriptions of disease. Springfield, IL: Charles C. Thomas, 1945:600-1.
267. Thomázy V, Fésüs L. Differential expression of tissue transglutaminase in human cells. An immunohistochemical study. Cell Tissue Res 1989; 255: 215-24.
268. Thorsby E. Invited anniversary review: HLA associated diseases. Hum Immunol 1997; 53:1-11.
269. Towbin H, Staehelin T, Gordon J. Electrophoretic transfer of proteins from poly-acrylamide gels to nitrocellulose sheets: procedure and some applications. Proc Natl Acad Sci USA 1979;76:4350-4.
270. Troncone R, Maurano F, Rossi M, Micillo M, Greco L, Auricchio R, Salerno G, Salvatore F, Sacchetti L. IgA antibodies to tissue transglutaminase: An effective di-agnostic test for celiac disease. J Pediatr 1999; 134:166-71.
271. Uhlig H, Osman AA, Tanev ID, Viehweg J, Mothes T. Role of tissue transgluta-minase in gliadin binding to reticular extracellular matrix and relation to celiac dis-ease autoantibodies. Autoimmunity 1998; 28:185-95.
272. Upchurch HF, Conway E, Patterson Jr MK, Maxwell MD. Localization of cellular transglutaminase on the extracellular matrix after wounding: Characteristics of the matrix-bound enzyme. J Cell Physiol 1991; 149:375-82.
273. Vader LW, de Ru A, van der Wal Y, Kooy Y, Benckhuijsen W, Mearin ML, Drijfhout JW, van Veelen P, Koning F. Specificity of tissue transglutaminase ex-plains cereal toxicity in celiac disease. J Exp Med 2002; 195:643-9.
274. Valentino R, Savastano S, Tommaselli AP, Dorato M, Scarpitta MT, Gigante M, Micillo M, Paparo F, Petrone E, Lombardi G, Troncone R. Prevalence of coeliac disease in patients with thyroid autoimmunity. Horm Res 1999; 51:124-7.
275. Valletta EA, Mastella G. Incidence of coeliac disease in a cystic fibrosis popula-tion. Acta Paediatr Scand 1989; 78:784-5.
276. Van der Meer JB. Granular deposits of immunoglobulins in the skin of patients with dermatitis herpetiformis. An immunofluorescent study. Br J Dermatol 1969; 81:493-503.
277. Van der Wal Y, Kooy Y, van Veelen P, Peña S, Mearin L, Papadopoulos G, Koning F. Selective deamidation by tissue transglutaminase strongly enhances gli-adin-specific T cell reactivity. J Immunol 1998; 161:1585-8.

83
278. Ventura A, Magazzù G, Greco L. Duration of exposure to gluten and risk for autoimmune disorders in patients with celiac disease. Gastroenterology 1999; 117:297-303.
279. Verderio E, Nicholas B, Gross S, Griffin M. Regulated expression of tissue trans-glutaminase in Swiss 3T3 fibroblasts: effects on the processing of fibronectin, cell attachment, and cell death. Exp Cell Res 1998; 239:119-38.
280. Violante V, Luongo A, Pepe I, Annunziata S, Gentile V. Transglutaminase-dependent formation of protein aggregates as possible biochemical mechanism for polyglutamine diseases. Brain Res Bull 2001; 56:169-72.
281. Wajda IJ, Waelsch H, Lee JM. Transglutaminase and experimental allergic en-cephalomyelitis. Life Sci 1965; 4:1853-8.
282. Walker AM, Montgomery DW, Saraiya S, Ho TW, Garewal HS, Wilson J, Lo-rand L. Prolactin-immunoglobulin G complexes from human serum act as costimu-latory ligands causing proliferation of malignant B lymphocytes. Proc Natl Acad Sci USA 1995; 92:3278-82.
283. Walker-Smith JA, Guandalini S, Schmitz J, Shmerling DH, Visakorpi JK. Re-vised criteria for diagnosis of coeliac disease. Arch Dis Child 1990; 65:909-11.
284. Weile B, Cavell B, Nivenius K, Krasilnikoff PR. Striking difference in the inci-dence of childhood celiac disease between Denmark and Sweden: a plausible expla-nation. J Pediatr Gastroenterol 1995; 21:64-8.
285. Weinstein WM. Latent celiac sprue. Gastroenterology 1974; 66:489-93. 286. Werner J. Biomathematik und Medizinische Statistik, 2nd ed. München-Wien-
Baltimore: Urban & Schwarzenberg, 1992:53 pp. 287. Whelan A, Willoughby R, Weir D. Human umbilical vein endothelial cells: a new
easily available source of endomysial antigens. Eur J Gastroenterol Hepatol 1996;8(10):961-6.
288. Wiebe RI, Tarr AH, Bowness JM. Increased transglutaminase in the aortas of cho-lesterol-fed rabbits: occurrence of buffer soluble and insoluble forms and an inhibi-tor. Biochem Cell Biol 1991; 69:821-7.
289. Wieser H. The precipitating factor in coeliac disease. Baillière Clin Gastr 1995;9:191-208.
290. Woychik JH, Boundy JA, Dimler RJ. Starch gel electrophoreses of wheat gluten proteins with concentrated urea. Arch Biochem Biophys 1961; 94:477-82.
291. Wright V, Moll JM. Psoriatic arthritis. Bull Rheum Dis 1971; 21:627-32. 292. Yee VC, Pedersen LC, Le Trong I, Bishop PD, Stenkamp RE, Teller DC. Three-
dimensional structure of a transglutaminase: human blood coagulation factor XIII. Proc Natl Acad Sci USA 1994; 91:7296-300.
293. Zemaitaitis MO, Lee JM, Troncoso JC, Muma NA. Transglutaminase-induced cross-linking of tau proteins in progressive supranuclear palsy. J Neuropathol Exp Neurol 2000; 59:983-9.
294. Zhang J, Guttmann RP, Johnson GV. Tissue transglutaminase is an in situ sub-strate of calpain: regulation of activity. J Neurochem 1998; 71:240-7.
295. Zubillaga P, Vitoria JC, Arrieta A, Echaniz P, Garcia-Masdevall MD. Down’s syndrome and celiac disease. J Pediatr Gastroenterol Nutr 1993; 16:168-71.
84
OWN PUBLICATIONS
Publications in strong connection with this work are underlined, and a reprint is at-tached to the end of this document. ORIGINAL ARTICLES: 1. Molnár J és Sárdy M. Az oxidált LDL mérési módszereinek összehasonlító vizs-
gálata. Élelmiszer vizsgálati közlemények 1993; 39:31-8. IF: 0 2. Simon T, Molnár M, Csanády K, Sárdy M, Simon G. HIV/AIDS felvilágosítás
középiskolákban angol és német nyelvórákon. Egészségnevelés 1994; 35:200-2. IF: 0 3. Hoheisel U, Sárdy M, Mense S. Experiments on the nature of the signal that induces
spinal neuroplastic changes following a peripheral lesion. Eur J Pain 1997; 1:243-59.
IF: 0 4. Sárdy M, Marschalkó M, Somlai B, Gyõri Zs. Subacut cutan lupus erythematodes
és malignus tüdõtumor együttes elõfordulása. Bõrgyógyászati és Venerológiai Szemle 1997; 73:279-83.
IF: 0 5. Sárdy M és Kárpáti S. Needle evacuation of eruptive vellus hair cysts. Br J Derma-
tol 1999; 141:594-5. IF: 1.838 6.* Sárdy M, Odenthal U, Kárpáti S, Paulsson M, Smyth N. Recombinant human tissue
transglutaminase ELISA for the diagnosis of gluten sensitive enteropathy. Clin Chem 1999; 45(12):2142-9.
IF: 3.769 7. Sárdy M, Kárpáti S, Péterfy F, Rásky K, Tomsits E, Zágoni T, Horváth A. Com-
parison of a tissue transglutaminase ELISA with the endomysium antibody test in the diagnosis of gluten-sensitive enteropathy. Z Gastroenterol 2000; 38(5):295-300.
IF: 0.887 8. Várkonyi V, Tisza T, Horváth A, Takácsy T, Berecz M, Kulcsár Gy, Sárdy M. Epi-
demiology of syphilis in Hungary between 1952-1996. Int J STD AIDS 2000; 11:327-33.
IF: 1.019 9. Sárdy M, Fáy A, Kárpáti S, Horváth A. Comèl-Netherton syndrome and peeling
skin syndrome type B: overlapping syndromes or one entity? Int J Dermatol. In press.
IF: 0.869 (2000)
* In 2000, our research group won the scientific award of the German-Hungarian Dermatological Society with this article.
85
10. Becker K, Csikós M, Sárdy M, Szalai Zs, Horváth A, Kárpáti S. Identification of two novel nonsense mutations in the transglutaminase 1 gene in a Hungarian patient with congenital ichthyosiform erythroderma. Exp Dermatol. In press.
IF: 2.434 (2000) 11. Sárdy M, Kárpáti S, Merkl B, Paulsson M, Smyth N. Epidermal transglutaminase
(TGase 3) is the autoantigen of dermatitis herpetiformis. J Exp Med 2002; 195:747-57.
IF: 15.236 (2000) IF total: 25.183 Published reviews and presentation abstracts in connection with this work: 1. Sárdy M, Kárpáti S. Comparison of a tissue transglutaminase enzyme-linked immu-
nosorbent assay with the endomysium antibody test in the diagnosis of dermatitis herpetiformis. J Invest Dermatol 1999; 113:448.
IF: 4.903 2. Preisz K, Kárpáti S, Sárdy M, Zágoni T, Horváth A. Codistribution of tissue trans-
glutaminase and tissue-bound IgA in jejunum of patients with dermatitis herpeti-formis. J Invest Dermatol 2000; 115(3):580.
IF: 4.539 3. Sárdy M. A coeliakia gyakorisága. Avagy mi rejtezik a jéghegy csúcsa alatt? Glu-
ténmentesen 2001; 5:4-7. (review) IF: 0 4. Sárdy M, Csikós M, Geisen C, Preisz K, Tomsits E, Töx U, Wieslander J, Kárpáti
S, Paulsson M, Smyth N. Tissue transglutaminase (TGc) is a minor antigen in auto-immune disease independent of gluten sensitive enteropathy. J Invest Dermatol 2001; 117:779.
IF: 4.539 (2000)


![Pemphigus Herpetiformis [Print] - eMedicine Dermatology Herpetiformis .pdf · • Etiology in the neutrophil-dominant subset of pemphigus herpetiformis includes the following: o In](https://img.pdfslide.us/doc/110x75/603eff65c1246c599955258c/pemphigus-herpetiformis-print-emedicine-herpetiformis-pdf-a-etiology-in.jpg)