Embed Size (px)
Citation preview
University of Tennessee, Knoxville University of Tennessee, Knoxville
TRACE: Tennessee Research and Creative TRACE: Tennessee Research and Creative
Exchange Exchange
Doctoral Dissertations Graduate School
12-2013
Whey Proteins Cross-linked by Transglutaminase or Glycated with Whey Proteins Cross-linked by Transglutaminase or Glycated with
Maltodextrin: Physicochemical Bases of the Improved Heat Maltodextrin: Physicochemical Bases of the Improved Heat
Stability Stability
Wan Wang University of Tennessee - Knoxville, [email protected]
Follow this and additional works at: https://trace.tennessee.edu/utk_graddiss
Part of the Food Science Commons
Recommended Citation Recommended Citation Wang, Wan, "Whey Proteins Cross-linked by Transglutaminase or Glycated with Maltodextrin: Physicochemical Bases of the Improved Heat Stability. " PhD diss., University of Tennessee, 2013. https://trace.tennessee.edu/utk_graddiss/2624
This Dissertation is brought to you for free and open access by the Graduate School at TRACE: Tennessee Research and Creative Exchange. It has been accepted for inclusion in Doctoral Dissertations by an authorized administrator of TRACE: Tennessee Research and Creative Exchange. For more information, please contact [email protected].
To the Graduate Council:
I am submitting herewith a dissertation written by Wan Wang entitled "Whey Proteins Cross-
linked by Transglutaminase or Glycated with Maltodextrin: Physicochemical Bases of the
Improved Heat Stability." I have examined the final electronic copy of this dissertation for form
and content and recommend that it be accepted in partial fulfillment of the requirements for the
degree of Doctor of Philosophy, with a major in Food Science and Technology.
Qixin Zhong, Major Professor
We have read this dissertation and recommend its acceptance:
Svetlana Zivanovic, Federico Harte, Siqun Wang
Accepted for the Council:
Carolyn R. Hodges
Vice Provost and Dean of the Graduate School
(Original signatures are on file with official student records.)
Whey Proteins Cross-linked by Transglutaminase
or Glycated with Maltodextrin: Physicochemical
Bases of the Improved Heat Stability
A Dissertation Presented for the
Doctor of Philosophy
Degree
The University of Tennessee, Knoxville
Wan Wang
December 2013

ii
Copyright © 2013 by Wan Wang
All rights reserved.
iii
DEDICATION
This dissertation is dedicated to my parents Xitang Wang and Jie Yang, who gave me life
and led me to a science world, enabling such a discovery of science to take place today.
And also to my beloved husband, Hua Ouyang, who supported me, encouraged me and
comforted me in this separated period of time.
iv
ACKNOWLEDGEMENTS
I very appreciate my advisor, Dr. Qixin Zhong, for giving me the opportunity to
be the student under his supervision, for giving me his constant help on both my research
project and daily life, and for revising my manuscripts with great patience. I learnt a lot
from him to be a conscientious teacher, a diligent researcher, and a kind elder. Thank you
very much for your trust and support my work as a “lab manager” in the last three years,
which made me more independent, more matured, stronger and wiser, not matter as a
researcher or as a person.
My sincere thanks also go to my doctoral committee professors, Drs. Svetlana
Zivanovic, Federico Harte and Siqun Wang, for their selfless sharing of their expertise to
improve my research ability, widen my vision and develop my problem solving skills. Dr.
Lana, attending your class is a challenge but enjoyable. I am so fortunate to have you in
my committee as you are a person that can make complex points more accessible. Dr.
Harte, thank you for giving me generous support of those complicated instruments and
also the chance to teach in your Food Engineering class. Dr. Wang, your suggestions on
my AFM images really helped me to keep away from massed up my tons of pictures.
I feel much indebted to many people who have assisted and favored me a lot
during my study. I do appreciate the faculty, staffs and graduate students in our
department, who have made my life here impressive and interesting. Thanks to former
groupmates, Bhavini, Sutida, Minfeng, Daniel, Linhan and Dr. Shinya, as well as
students in other groups, Songsong, Ray, Vinay, for helping me get involved into the
“family” when I first came, and also for their kindness when I need any help.

v
Additionally, I would like to express my gratitude to my current groupmates and friends.
Yue, I am so happy to have a friend like you. You are smart and efficient and always give
me good suggestions about my research when I was trapped in complicated problems.
Qiumin, Huaiqiong, Jia and Yun, thank you for assisting me to take good care of our labs.
Without you, our lab routine work probably cannot perform efficiently like today.
Meanwhile, I want to thank my friends, Manneesha, Manpreet, Virginia and May in other
groups for sharing laughs and tears. Manneesha, you are the first friend I made here and
the time we spent together will be an unforgettable experience and will be inscribed on
my memory.
Last but not least, I want to thank my loving parents, my father Xitang Wang and
my mother Jie Yang for loving me, listening to me, supporting me and believing in me
without any hesitate and doubt. I want to thank my beloved husband, Hua Ouyang.
Although we are in a long-distant relationship for years, you make me feel that you are
my aside all the time. Your love and patience are the motion of making me move forward
without any fears. Thank you all for being a part of my life and made it special.
vi
ABSTRACT
Whey protein, as a byproduct in cheese manufacturing, is an ideal source for
producing ready-to-drink protein beverages for different market demands, attributed to its
high content of essential amino acids and versatile functionalities, bland flavor and good
digestibility. Whey protein is a mixture of proteins, which can be categorized into whey
protein concentrate (WPC) with a protein content of 50~80% and whey protein isolate
(WPI) with a protein content higher than 90%, depending on different separation
techniques. Thermal processing is required to ensure microbiological safety and quality
of dairy products, leading to denaturation of whey proteins, especially at pH around its
isoelectric point. Denaturation facilitates the aggregation of whey proteins that involves a
number of colloidal interactions such as hydrophobic, electrostatic, hydrogen bonding
interactions and covalent disulfide bonds, which are significantly influenced by pH,
concentration, temperature, ionic strength, and the presence of co-solutes. Based on the
understanding of physic forces, the thermal stability of protein can be enhanced via two
approaches, which are restricting the denaturation and creating repulsive forces. A
combination of preheating and microbial transglutaminase cross-linking can improve the
thermal stability of whey proteins at neutral pH after second heating at 80 °C or 138 °C in
the presence of different concentration of NaCl. Whey proteins glycated with saccharides
creates a structure with internal whey protein core and an external saccharide shell.
Further aggregation of protein molecules is suppressed because the approaching of
protein molecules has to overcome the saccharide shell. Glycation with saccharides is
markedly affected by reaction conditions such as pH (powder acidity for dry base
reaction), temperature, time, protein:saccharide ratio and types of protein and saccharide,
vii
etc. Addition of monosaccharide such as D-glucose and disaccharide such as sucrose in
the whey protein aqueous system also improve the thermal stability of protein. When
combined with optimized glycation, whey proteins can be stabilized at pH ranging from 4
to 7.
Keywords: whey proteins, thermal stability, preheating, transglutaminase, glycation, co-
solutes
viii
TABLE OF CONTENTS
Chapter 1. Literature Review .......................................................................................... 1
1.1 Introduction ......................................................................................................... 2
1.1.1 Perspective of shelf-stable ready-to-drink beverages with whey proteins ...... 2
1.1.2 Types and composition of whey proteins ingredients..................................... 3
1.1.3 Structures of whey proteins ............................................................................ 4
1.2 Physical and chemical interactions relevant to the stability of whey proteins in
aqueous solutions ............................................................................................................ 7
1.2.1 Stability of colloidal particles interpreted by inter-particle interactions ........ 7
1.2.2 Attractive interaction forces ............................................................................ 9
1.2.3 Repulsive interaction forces .......................................................................... 11
1.3 Heat stability of whey proteins ......................................................................... 12
1.3.1 Heat-induced denaturation and aggregation of whey proteins ..................... 12
1.3.2 Factors impacting heat-induced denaturation and aggregation of whey
proteins ...................................................................................................................... 13
1.4 Strategies of improving heat stability of whey proteins ................................... 18
1.4.1 Overview ....................................................................................................... 18
1.4.2 Cross-linking by transglutaminase ................................................................ 18
1.4.2.1 Introduction ........................................................................................... 18
1.4.2.2 Reactions catalyzed by transglutaminase.............................................. 19
1.4.2.3 Property changes due to transglutaminase cross-linking ...................... 19
1.4.3 Co-solutes ..................................................................................................... 22
1.4.3.1 Types of co-solutes studied for heat stability of whey proteins............ 22
1.4.3.2 Mechanisms of heat stability improvements of whey proteins by co-
solutes 24
1.4.3.3 Property changes due to co-solutes ....................................................... 26
1.4.4 Forming soluble aggregates by preheating ................................................... 27
1.4.4.1 Concept of soluble aggregates .............................................................. 27
1.4.4.2 Mechanisms of improving heat stability by forming soluble aggregates
28
ix
1.4.4.3 Changes in some properties .................................................................. 28
1.4.5 Glycation with reducing sugars .................................................................... 30
1.4.5.1 A brief overview of the Maillard reaction ............................................ 30
1.4.5.2 Principles of improving thermal stability of proteins by glycation ...... 32
1.4.5.3 Changes in some properties due to glycation ....................................... 33
1.5 Conclusions ....................................................................................................... 35
1.6 Scope of dissertation research ........................................................................... 36
References ............................................................................................................. 38
Appendix ............................................................................................................... 47
Chapter 2. Nanoscale Understanding of Thermal Aggregation of Whey Proteins
Pretreated by Transglutaminase ................................................................................... 52
2.1 Abstract ............................................................................................................. 53
2.2 Introduction ....................................................................................................... 54
2.3 Materials and Methods ...................................................................................... 57
2.3.1 Materials ....................................................................................................... 57
2.3.2 Determination of mTGase activity ................................................................ 58
2.3.3 Pretreatment protocol .................................................................................... 58
2.3.4 Evaluation of heat stability ........................................................................... 59
2.3.5 Differential scanning calorimetry (DSC) ...................................................... 59
2.3.6 Surface hydrophobicity ................................................................................. 60
2.3.7 Particle size analysis (DLS) .......................................................................... 60
2.3.8 Zeta-potential ................................................................................................ 61
2.3.9 Atomic force microscopy (AFM) ................................................................. 61
2.3.10 Rheology ................................................................................................... 62
2.3.11 Statistical analysis ..................................................................................... 62
2.4 Results and Discussion ..................................................................................... 62
2.4.1 Heat stability of samples pretreated by mTGase without preheating ........... 63
2.4.2 Heat stability of samples sequentially pretreated by preheating and mTGase
64
2.4.3 Particle size changes measured by DLS ....................................................... 65
x
2.4.4 Structures of whey proteins studied by AFM ............................................... 66
2.4.5 Zeta potential and surface hydrophobicity .................................................... 69
2.4.6 Thermal denaturation properties of whey proteins after pretreatments ........ 71
2.4.7 Viscosity of samples heated at 80 C for 15 min after various pretreatments
72
2.4.8 Physical interpretation of thermal aggregation of whey protein at 100 mM
NaCl and neutral pH as impacted by mTGase pretreatment ..................................... 75
2.5 Conclusions ....................................................................................................... 76
References ............................................................................................................. 78
Appendix ............................................................................................................... 82
Chapter 3. Sequential Preheating and Transglutaminase Pretreatments Improve
Stability of Whey Protein Isolate at pH 7.0 During Thermal Sterilization ............. 102
3.1 Abstract ........................................................................................................... 103
3.2 Introduction ..................................................................................................... 105
3.3 Materials and methods .................................................................................... 108
3.3.1 Materials ..................................................................................................... 108
3.3.2 Determination of mTGase activity .............................................................. 108
3.3.3 Pretreatment protocol .................................................................................. 109
3.3.4 Sodium dodecyl sulfate polyacrylamide gel electrophoresis (SDS-PAGE) 109
3.3.5 Evaluation of heat stability ......................................................................... 110
3.3.6 Differential scanning calorimetry (DSC) .................................................... 110
3.3.7 Dynamic light scattering (DLS) .................................................................. 111
3.3.8 Zeta-potential .............................................................................................. 111
3.3.9 Atomic force microscopy (AFM) ............................................................... 111
3.3.10 Statistical analysis ................................................................................... 112
3.4 Results and discussion .................................................................................... 112
3.4.1 mTGase levels used in pretreatment ........................................................... 112
3.4.2 Structures of WPI analyzed by SDS-PAGE ............................................... 112
3.4.3 Heat stability of samples pretreated by mTGase directly ........................... 114
xi
3.4.4 Heat stability of samples pretreated by sequential preheating and mTGase
116
3.4.5 Thermal denaturation studied by using DSC .............................................. 117
3.4.6 Particle size and zeta-potential after pretreatments .................................... 118
3.4.7 Structure changes of pretreated whey proteins after heating at 138 C ...... 120
3.5 Conclusion ...................................................................................................... 123
References ........................................................................................................... 125
Appendix ............................................................................................................. 128
Chapter 4. Properties of Whey Protein-Maltodextrin Conjugates as Impacted by
Powder Acidity during the Maillard Reaction ........................................................... 140
4.1 Abstract ........................................................................................................... 141
4.2 Introduction ..................................................................................................... 142
4.3 Materials and methods .................................................................................... 145
4.3.1 Materials ..................................................................................................... 145
4.3.2 Production of WPI-MD conjugates ............................................................ 145
4.3.3 Preparation of conjugate solution and heat stability test ............................ 146
4.3.4 Color measurements.................................................................................... 146
4.3.5 Attenuated Total Fourier Transform Infrared (FTIR) Spectroscopy .......... 147
4.3.6 Degree of glycation ..................................................................................... 147
4.3.7 Amino acid composition ............................................................................. 148
4.3.8 Differential scanning Calorimetry (DSC) ................................................... 149
4.3.9 Zeta-potential measurement ........................................................................ 149
4.3.10 Surface hydrophobicity ........................................................................... 149
4.3.11 Digestibility of WPI and its conjugates .................................................. 150
4.3.12 Statistical analysis ................................................................................... 151
4.4 Results and discussion .................................................................................... 151
4.4.1 Changes in powder acidity after glycation .................................................. 151
4.4.2 Thermal stability and color formation ........................................................ 152
4.4.3 Structural changes of glycated WPI analyzed by FTIR .............................. 154
4.4.4 Degree of glycation ..................................................................................... 154
xii
4.4.5 Amino acid composition changes after glycation ....................................... 155
4.4.6 Thermal denaturation properties of glycated WPI ...................................... 155
4.4.7 Surface properties of glycated WPI ............................................................ 156
4.4.8 In vitro digestibility..................................................................................... 157
4.5 Conclusions ..................................................................................................... 158
References ........................................................................................................... 160
Appendix ............................................................................................................. 165
Chapter 5. Improved Thermal Stability of Whey Protein-Maltodextrin Conjugates
at pH 5.0 by D-Glucose, Sucrose, D-cellobiose, and Lactose .................................... 182
5.1 Abstract ........................................................................................................... 183
5.2 Introduction ..................................................................................................... 184
5.3 Material and Methods ..................................................................................... 187
5.3.1 Materials ..................................................................................................... 187
5.3.2 Preparation of glycated WPI ....................................................................... 187
5.3.3 Preparation of protein solution for thermal stability test ............................ 187
5.3.4 Turbidity measurement ............................................................................... 188
5.3.5 Viscosity measurement ............................................................................... 188
5.3.6 Differential scanning calorimetry (DSC) .................................................... 188
5.3.7 Water activity measurement of co-solute solutions .................................... 189
5.3.8 Morphology of aggregated particles ........................................................... 189
5.3.9 Statistical analysis ....................................................................................... 190
5.4 Results and discussion .................................................................................... 190
5.4.1 Heat stability of conjugates as impacted by co-solutes .............................. 190
5.4.2 Viscosity of WPI-MD conjugate solutions with co-solutes ........................ 191
5.4.3 Thermal denaturation properties of WPI-MD conjugates as impacted by co-
solutes 192
5.4.4 Estimation of changes in preferential interactions between conjugates and
co-solutes ................................................................................................................ 193
5.4.5 Structure of whey proteins with sugars studied by AFM ........................... 196
5.5 Conclusions ..................................................................................................... 197
xiii
References ........................................................................................................... 198
Appendix ............................................................................................................. 201
Chapter 6. Concluding Remarks and Future Work .................................................. 214
VITA............................................................................................................................... 218
xiv
LIST OF TABLES
Table 1-1. Typical protein composition of whey (Bryant & McClements, 1998;
Thompson, Boland, & Singh, 2009). ................................................................................ 47
Table 1-2. Characteristics of molecular interactions between two similar protein
molecules in aqueous solutions and the impacts of environmental conditions on force
strength (Bryant & McClements, 1998)............................................................................ 48
Table 2-1. The d4,3 of whey protein dispersions after pretreatments and after further
heating at pH 7.0 and 100 mM NaCl for 15 and 90 min at 80 C. ................................... 82
Table 2-2. Particle heights estimated from AFM for WPI after pretreatments and after
further heating at pH 7.0 and 100 mM NaCl for 15 and 90 min at 80 C. ....................... 83
Table 2-3. Zeta-potential of WPI dispersions at pH 7.0 after various pretreatments and
subsequent heating at pH 7.0 and 0 or 100 mM NaCl for 15 min at 80 C. ..................... 84
Table 2-4. Surface hydrophobicity (S0) of WPI measured at pH 7.0 after pretreatments
and subsequent heating at 80 °C for 15 min in the presence of 100 mM NaCl. ............... 85
Table 2-5. Denaturation temperature (Td) and enthalpy change (ΔH) at pH 7.0 and 100
mM NaCl for WPI dispersions pretreated at different conditions. ................................... 86
Table 3-1. The d4,3 of WPI dispersions at pH 7.0 after heating at 138 °C for 0, 1, 5 and 30
min. ................................................................................................................................. 128
Table 3-2. Zeta-potential of WPI dispersions at pH 7.0 after various pretreatments. .... 129
Table 3-3. Average particle heights from AFM for the sequentially-pretreated* WPI at
pH 7.0 with 0 or 50 mM NaCl after heating at 138 °C for 0, 1, and 30 min. ................. 130
Table 4-1. Color measurement of WPI and WPI-MD conjugate solutions with 5%
protein, without sucrose and adjusted to pH 7.0, before and after heating at 138 °C for 1
min...................................................................................................................................165
Table 4-2. Amino acid compositions of WPI and WPI-MD conjugates prepared at
different m-pH. ............................................................................................................... 166
Table 4-3. Denaturation temperature (Td) and enthalpy change (ΔH) of WPI and
conjugate dispersions at pH 5.0 and 7.0, with 100 mM NaCl. ..................................... 167
Table 4-4. Isoelectric point of WPI and WPI-MD conjugates estimated from zeta
potential profiles. ............................................................................................................ 168
xv
Table 4-5. Surface hydrophobicity (S0) of WPI and WPI-MD conjugates measured at pH
5.0 and 7.0. ...................................................................................................................... 169
Table 4-6. Comparison of SDS-PAGE band patterns of WPI and WPI-MD conjugates,
with and without heat treatment at 138 C for 1 min, before and after simulated gastric
and intestinal digestions. ................................................................................................. 170
Table 5-1. Heat denaturation properties of WPI and WPI-MD conjugate at pH 5.0 as
impacted by co-solutes. * ................................................................................................. 201
Table 5-2. AFM particle heights of WPI-MD conjugates in solutions with 0-0.8 M D-
glucose before and after heating at 138 °C for 1 min at pH 5.0. .................................... 202
Table 5-3. AFM particle heights of WPI-MD conjugates in solutions with 0.6 M co-
solutes and 50 mM NaCl after heating at 138 °C for 1 min at pH 5.0. ........................... 203
xvi
LIST OF FIGURES
Figure 1-1.The colloidal interaction free energy V between hard spheres with a radius of
R separation distance h (Walstra, 2002) . ......................................................................... 49
Figure 1-2. Reactions catalyzed by transglutaminase (TGase): (a) Acyl transfer; (b)
Crosslinking of Gln and Lys residues in proteins or peptide and (c) Deamidation
(Yokoyama, Nio, & Kikuchi, 2004). ................................................................................ 50
Figure 1-3. Proposed mechanisms of whey protein aggregation during heating at neutral
pH in the absence or presence of NaCl as impacted by preheating. Δ indicates heat
treatment and negative charges indicate the overall protein charge (Ryan & others, 2011).
........................................................................................................................................... 51
Figure 2-1. Absorbance of 5% w/v WPI dispersions at 400 nm (Abs400) after heating at
80 C for 15 min. Before heating, samples were adjusted to pH 7.5 and cross-linked by
mTGase at 2.0, 5.1, and 10.2 U/g-WPI for 1-15 h at 50 C before adjusting to pH 7.0 and
(A) 0, (B) 50, and (C) 100 mM NaCl. Control samples were heated directly after
adjusting pH and NaCl concentration. .............................................................................. 87
Figure 2-2. Absorbance of 5% w/v WPI dispersions at 400 nm (Abs400) after heating at
80 C for 15 min. Before heating, samples were adjusted to pH 7.5, preheated at 80 C
for 15 min, and then cross-linked by mTGase at 2.0, 5.1, and 10.2 U/g-WPI for 1-15 h at
50 C before adjusting to pH 7.0 and (A) 0, (B) 50, and (C) 100 mM NaCl. Control
samples were preheated at the same conditions before adjusting pH and NaCl
concentration. .................................................................................................................... 88
Figure 2-3. Photographs showing appearance of 5% w/v WPI dispersions, adjusted to pH
7.0 and 0, 50, and 100 mM NaCl (as labeled on vials), after being heated at 80 C for 15
min. Image (A) shows samples without pretreatment. Samples in (B-D) were pretreated
differently before heating. Samples in (B) were adjusted to pH 7.5 and preheated for 15
min at 80 C before pH and NaCl adjustment for second-time heating at 80 C for 15
min. Samples in (C) were pretreated by mTGase using a level of 5.1 U/g-WPI at pH 7.5
and 50 C for 4 h before adjusting pH and NaCl concentration as in (B). Samples in (D)
were preheated as in (B) and then pretreated by mTGase as in (C) before adjusting pH
and NaCl concentration as in (B). Samples formed gels are indicated with red rectangles.
........................................................................................................................................... 89
Figure 2-4. AFM height images of whey protein samples before (left) and after (right)
heating at 80 C for 15 min at pH 7.0 and 100 mM NaCl. Before pH and NaCl
adjustments, the 5% w/v WPI dispersions were subjected to (A) no pretreatment, (B)
preheating at pH 7.5 for 15 min at 80 C, (C) pretreatment by mTGase at 5.1 U/g-WPI
for 4 h, or (D) sequential pretreatments as in (B) and (C). The scanned dimension is 2×2
μm in all images ................................................................................................................ 90
xvii
Figure 2-5. Samples in Figure 2-4, at pH 7.0 and 100 mM NaCl, after heating at 80C for
90 min: (A) preheating only, (B) mTGase pretreatment only, and (C) sequential
pretreatments. The scanned dimensions are 5×5 μm in (A) and 2×2 μm in (B) and (C).. 91
Figure 2-6. Comparison of DSC thermograms of WPI at pH 7.0 and 100 mM NaCl
before and after pretreatments as in Figure 2-4. ............................................................... 92
Figure 2-7. Apparent viscosities at 20 C and 1000 s-1 for 5% w/v WPI dispersions
heated at 80 C for 15 min. Before heating, WPI samples were adjusted to pH 7.5 and
cross-linked by mTGase at 2.0, 5.1, and 10.2 U/g WPI for 1-15 h at 50 C before
adjusting to pH 7.0 and (A) 0, (B) 50, and (C) 100 mM NaCl. ........................................ 93
Figure 2-8. Apparent viscosities at 20 C and 1000 s-1 for 5% w/v WPI dispersions
heated at 80 C for 15 min. Before heating, WPI samples were adjusted to pH 7.5,
preheated at 80 C for 15 min, cross-linked by mTGase at 2.0, 5.1, and 10.2 U/g WPI for
1-15 h at 50 C, and adjusted to pH 7.0 and (A) 0, (B) 50, and (C) 100 mM NaCl. ........ 94
Figure 2-9. Proposed mechanisms of whey protein aggregation during heating at 80°C,
pH 7.0, and 100 mM NaCl as impacted by individual or sequential preheating and
mTGase pretreatments. ..................................................................................................... 95
Figure 2-S1. AFM height images of whey protein samples before (left) and after (right)
heating at 80 C for 15 min at pH 7.0 and 100 mM NaCl. Before pH and NaCl
adjustments, the 5% w/v WPI dispersions were subjected to (A) no pretreatment, (B)
preheating at pH 7.5 for 15 min at 80 C, (C) pretreatment by mTGase at 5.1 U/g-WPI
for 4 h, or (D) sequential pretreatments as in (B) and (C). The scanned dimension is 5×5
μm in all images. ............................................................................................................... 96
Figure 2-S2. Photographs showing appearance of 5% w/v WPI dispersions, adjusted to
pH 7.0 and 100 mM NaCl, after being heated at 80 C for 90 min. Image (A) shows the
sample without pretreatment. Sample (B) was adjusted to pH 7.5 and preheated for 15
min at 80 C before pH and NaCl adjustment for second-time heating at 80 C for 90
min. Sample (C) was pretreated by mTGase using a level of 5.1 U/g-WPI at pH 7.5 and
50 C for 4 h before adjusting pH and NaCl concentration. Sample (D) was preheated as
in (B) and then pretreated by mTGase as in (C) before adjusting pH and NaCl
concentration. .................................................................................................................... 97
Figure 2-S3. AFM height images of whey protein samples after heating at 80 C for 90
min at pH 7.0 and 100 mM NaCl. Before pH and NaCl adjustments, the 5% w/v WPI
dispersions were subjected to (A) pretreatment by mTGase at 5.1 U/g-WPI for 4 h, or (B)
sequential pretreatments of preheating at pH 7.5 for 15 min at 80 C and mTGase as in
(A). The scanned dimension is 5×5 μm in both images. .................................................. 98
xviii
Figure 2-S4. Shear rate ramps at 20 C for 5%w/v WPI dispersions at pH 7.0 and 0 mM
NaCl after heating at 80 C for 15 min. Before heating, samples were pretreated by
mTGase at 5.1 U/g-WPI for 1-15 h (A) without or (B) with preheating at 80 C for 15
min. Figure C is a schematic illustration of shear-rate dependence of apparent viscosity
for a typical colloidal dispersion, showing zero-shear (o) and infinite-shear ()
viscosities at low and high shear rate regimes. ................................................................. 99
Figure 3-1. SDS-PAGE patterns of WPI after various treatments. Lane codes: MWS =
molecular weight standard; a = native WPI; b = WPI after 15-min preheating at 80 C; c =
WPI after 4 h cross-linking by mTGase at 5.1 U/g WPI; d,e,f,g = WPI preheated at 80 C
for 15 min then cross-linked by mTGase at 5.1 U/g WPI for 1, 4, 8, and 15 h,
respectively. .................................................................................................................... 131
Figure 3-2. Absorbance of samples at 400 nm (Abs400) after heating at 138 C for 1 min.
The 5% w/v WPI samples were adjusted to pH 7.5 and cross-linked by varied
concentrations of mTGase for 1-15 h before adjusting to pH 7.0 and (A) 0, (B) 50, and
(C) 100 mM NaCl for heat stability tests. Error bars are standard deviations from three
replicates. ........................................................................................................................ 132
Figure 3-3. Absorbance of samples at 400 nm (Abs400) after heating at 138 C for 5 min.
The 5% w/v WPI samples were adjusted to pH 7.5 and cross-linked by varied
concentrations of mTGase for 1-15 h before adjusting to pH 7.0 and (A) 0, (B) 50, and
(C) 100 mM NaCl for heat stability tests. Error bars are standard deviations from three
replicates. ........................................................................................................................ 133
Figure 3-4. Absorbance of samples at 400 nm (Abs400) after heating at 138 C for 1 min.
The 5% w/v WPI samples were adjusted to pH 7.5, preheated at 80 C for 15 min, and
then cross-linked by varied concentrations of mTGase for 1-15 h before adjusting to pH
7.0 and (A) 0, (B) 50, and (C) 100 mM NaCl for heat stability tests. Error bars are
standard deviations from three replicates. ...................................................................... 134
Figure 3-5. Absorbance of samples at 400 nm (Abs400) after heating at 138 C for 5 min.
The 5% w/v WPI samples were adjusted to pH 7.5, preheated at 80 C for 15 min, and
then cross-linked by varied concentrations of mTGase for 1-15 h before adjusting to pH
7.0 and (A) 0, (B) 50, and (C) 100 mM NaCl for heat stability tests. Error bars are
standard deviations from three replicates. ...................................................................... 135
Figure 3-6. DSC profiles of 5% w/v (A) native WPI, (B) preheated WPI, (C) mTGase-
pretreated WPI, and (D) sequentially-pretreated WPI dispersions at pH 7.0 and 100 mM
NaCl. The mTGase pretreatments were conducted at 5.1 U/g-WPI for 4 h. The DSC
scans were conducted at a heating rate of 1.5 °C/min. ................................................... 136
Figure 3-7. The 5% w/v WPI at pH 7.0 after heating at 138 C for 1, 5, or 30 min, as
labeled on vials. Samples were pretreated by individual or sequential steps of preheating
xix
and mTGase cross-linking. Preheating was performed at 80 C for 15 min. The mTGase
pretreatment was conducted at 50 C for 4 h with an mTGase level of 5.1 U/g-WPI. Salt
concentrations were adjusted before heat stability tests at 138 C. ................................ 137
Figure 3-8. Topographical AFM images of WPI before (A) and after (B) sequential
pretreatments using conditions as in Figure 3-7. The scanned area is 2 μm 2 μm in each
image. .............................................................................................................................. 138
Figure 3-9. Topographical AFM images of sequentially-pretreated WPI shown in Figure
3-7 after heating at 138 C for 1 (A and B) and 30 (C and D) min with 0 (A and C) and
50 (B and D) mM NaCl. The scanned area is 2 μm 2 μm in each image. ................... 139
Figure 4-1. Comparison of solution pH after hydrating conjugate powder at 5%w/v
protein in deionized water. Conjugates were prepared by incubating powder spray-dried
from WPI and MD mixture solutions adjusted to pH 4-7 (m-pH, the 0-h treatments) at 80
°C and 65% relative humidity for 1-4 h. Error bars are standard deviations from two
replicates. Different letters above bars indicate significant difference in mean (p < 0.05).
......................................................................................................................................... 172
Figure 4-2. Appearance of WPI-MD conjugate solutions after heating at 138 °C for 1
min. Conjugate solutions were prepared with 5%w/v protein, adjusted to pH 4-7 (labeled
above the vials), 0-100 mM NaCl (labeled on vial caps) and 5%w/w sucrose prior to
heating. The conjugates were prepared at 80 °C and 65% relative humidity for 1, 2, and 4
h for the m-pH 6.0 treatment (A) or 2 h for the m-pH 4.0, 5.0, and 7.0 treatments (B). 173
Figure 4-3. Absorbance at 420 nm (Abs420) of conjugate solutions, prepared at 5% w/v
protein, pH 4-7 (X-axis), 50 mM NaCl, and 0 (A) or 5% (B) w/w sucrose, after heating at
138 C for 1 min. Conjugates were prepared by spray-drying WPI-MD solutions adjusted
to pH 4-7 (m-pH, as in the legend) to obtain powder for glycation at 80 C and 65%
relative humidity for 2 h. Samples with Abs420 higher than 2.0 or forming gels are not
plotted. ............................................................................................................................ 174
Figure 4-4. Comparison of FTIR spectra of WPI and the WPI-MD conjugate prepared by
spray-drying WPI-MD solutions adjusted to pH 4-7 (m-pH, as in the legend) to obtain
powder for glycation at 80 C and 65% relative humidity for 2 h. ................................. 175
Figure 4-5. Absorbance at 335 nm (Abs335) of WPI (control) and WPI-MD conjugates
reacted with TNBS for measuring the degree of glycation. Conjugates were prepared by
spray-drying WPI-MD solutions adjusted to pH 4-7 (m-pH, as in the X-axis) to obtain
powder for glycation at 80 C and 65% relative humidity for 2 h. ................................. 176
Figure 4-6. Comparison of DSC thermograms of WPI solutions at pH 5 and 7 (A) and
WPI-MD conjugate solutions at pH 5 (B) and 7 (C). Conjugates were prepared by spray-
drying WPI-MD solutions adjusted to pH 4-7 (m-pH, as in the legend) to obtain powder
xx
for glycation at 80 C and 65% relative humidity for 2 h. All samples were prepared at
1%w/v protein with 100 mM NaCl for DSC. ................................................................. 179
Figure 4-7. Zeta-potential profiles of WPI-MD conjugates prepared by spray-drying
WPI-MD solutions adjusted to pH 4-7 (m-pH, as in the legend) to obtain powder for
glycation at 80 C and 65% relative humidity for 2 h, with comparison to WPI. .......... 180
Figure 4-8. SDS-PAGE analysis of WPI and WPI-MD conjugates before and after
simulated digestions. Conjugates were prepared by spray-drying WPI-MD solutions
adjusted to pH 4-7 (m-pH) to obtain powder for glycation at 80 C and 65% relative
humidity for 2 h. Protein solutions at pH 7.0 before (top panel) and after (bottom panel)
heating at 138 C for 1 min were compared for digestibility. Lanes 1-3 are WPI samples,
while lanes 4-6, 7-9, 10-12, and 13-15 represent conjugates prepared at m-pH 4, 5, 6, and
7, respectively. For each sample group, lanes from left to right represent protein samples
before digestion, after the simulated gastric digestion, and after sequential steps of
simulated gastric and intestinal digestions. Lanes labeled with “M” represent protein
markers. ........................................................................................................................... 181
Figure 5-1. Visual appearance of WPI-MD conjugate solutions before and after heating
at 138 °C for 1 min. Solutions were prepared with 5% w/v protein, 0, 50, and 100 mM
NaCl, and 0, 0.2, 0.4, 0.6 and-0.8 M co-solutes (from left to right in each image), and
adjusted to pH 5.0 prior to heating. ................................................................................. 204
Figure 5-2. Absorbance at 600 nm (Abs600) of WPI-MD conjugate solutions after heating
at 138 C for 1 min. Solutions were prepared at 5% w/v protein, pH 5.0, 0-0.8 M co-
solutes and (A) 0, (B) 50, and (C) 100 mM NaCl after heating and diluted 5 times using
10 mM phosphate citrate buffer (pH 5.0). Error bars are standard deviations from two
replicates. ........................................................................................................................ 205
Figure 5-3. Rheograms of WPI-MD conjugate solutions measured at a sheer rate ramp of
0.1-100 s-1. Sample were prepared with 5% w/v protein, pH 5.0, 0 mM NaCl, and 0-0.8
M of (A) D-glucose, (B) sucrose, (C) lactose, and (D) D-cellobiose. The control sample
was 5% w/v WPI solution at pH 5.0 and 0 M NaCl. ...................................................... 208
Figure 5-4. DSC thermograms of WPI-MD conjugate solutions with (A) 0-0.8 M sucrose
and (B) 0.6 M of various co-solutes at pH 5.0. ............................................................... 211
Figure 5-5. Changes in preferential interaction coefficient (2,3) of WPI-MD conjugates
in pH 5.0 solutions with 0.2-0.8 M co-solutes. Error bars are standard deviations from
two replicates. ................................................................................................................. 212
Figure 5-6. AFM topography images of WPI-MD conjugates at pH 5.0 and 50 mM
NaCl, before (a) and after heating at 138 C for 1 min. Samples after heating are shown
xxi
for treatments with (b) 0, (c) 0.2, (d) 0.4, (e) 0.6, and (f) 0.8 M D-glucose, or 0.6 M (g)
sucrose, (h) lactose, or (i) D-cellobiose. ......................................................................... 213

1
Chapter 1. Literature Review
2
1.1 Introduction
1.1.1 Perspective of shelf-stable ready-to-drink beverages with whey proteins
Shelf-stable beverages and refrigerated beverages belong to ready-to-drink
beverages, which offer the advantages of convenience and portability for consumers. The
food market of shelf-stable beverages is expanding rapidly as the products offer the ease
of distribution and storage. Whey proteins are preferred as a source for manufacturing
ready-to-drink protein beverage because of their excellent nutritional quality and versatile
functional properties (De Wit, 1998; Ha & Zemel, 2003). Ready-to-drink protein
beverages containing whey proteins are developed for different market demands, such as
sports beverages, medical and therapeutic nutritional beverages, milk-based infant
formulas, and smoothies type beverages (Rittmanic, 2006).
Beverages formulated with whey proteins are generally adjusted to a pH from 2.8
to 3.5, showing a high clarity at a high concentration of protein. Thermally processed
acidic beverages are usually filled while hot into containers (hot-fill process) for shelf-
stable beverages. The hot liquid product can sterilize the container which can withstand
filling temperature, and inactivate molds and yeasts (LaClair & Etzel, 2009; Rittmanic,
2006). Protein beverages at pH between 4.6 and 7.5 must be thermally sterilized via ultra-
high-temperature process or retort process for shelf-stable products (Rittmanic, 2006).
Beverages containing > 10 g protein and < 18 g sugar per 240 mL can be labeled as “high
protein” and “reduced sugar” products (Etzel, 2004).
Furthermore, a large amount of sugar is used to formulate acidic beverages to
mask the acid taste and may cause health problems, such as teeth erosion (Mettler, Rusch,
3
& Colombani, 2006), increased body fat, blood lipid titers, insulin secretion and appetite
(Etzel, 2004). Protein beverages with neutral acidity can overcome the drawbacks of
acidic beverages. However, whey proteins are not appropriate as a source for producing
neutral beverages as they are not heat stable, forming gels or aggregates/precipitates with
as little as 2-3% proteins under thermal process conditions unless a stabilizing system is
used (Mleko, 1999). Technologies stabilizing whey proteins during heating can expand
the application of whey proteins as an ingredient in shelf-stable beverages.
1.1.2 Types and composition of whey proteins ingredients
Whey from cheese manufacturing is commonly used as a source of manufacturing
protein ingredients, and the composition in cheese whey depends on cheese making
processes (Damodaran & Paraf, 1997). Whey protein ingredients are produced by
removing non-protein compounds such as lipids, minerals, and lactose to increase the
protein content. The most common whey protein ingredients are whey protein
concentrate (WPC), containing 30-80% protein, and whey protein isolate (WPI),
containing >90% protein (Foegeding, Davis, Doucet, & McGuffey, 2002). Methods of
separation and isolation of whey proteins determine the composition of WPC and WPI,
which may affect suitability for a particular application. WPCs, manufactured by
membrane separation, such as microfiltration, ultrafiltration and nanofiltration processes,
are widely used as ingredients for functions such as gelation, foaming and emulsifying.
WPIs produced by ion-exchange and membrane filtration show compositional differences
in mineral and glycomacropeptide contents, exhibiting better functional properties than
WPCs (Fox & McSweeney, 2003; Fuquay, Fox, & McSweeney, 2011; Rittmanic, 2006).
4
Proteins in WPC and WPI are a mixture comprised primarily of β-lactoglobulin
(β-Lg) and α-lactalbumin (α-La) and secondary bovine serum albumin (BSA),
immunoglobulin G (IgG), and others (Table 1-1) (Thompson, Boland, & Singh, 2009). β-
Lg (~50%) and α-La (~20%) consist approximately 70-80% of total whey proteins and
thus are responsible for many physicochemical properties of whey protein ingredients
such as gelling, hydration, emulsifying and foaming. Although β-Lg has a number of
hydrophobic residues it is soluble in water because most nonpolar amino acid residues
are buried in the interior of protein and polar groups are on the surface, contributing a
good solubility of whey proteins at pH away from isoelectric point (Cayot & Lorient,
1997).
1.1.3 Structures of whey proteins
β-Lg is the most abundant whey protein in bovine milk, accounting for 10% of
total protein or ~50-60% of total whey proteins, depending on the process for isolation of
whey proteins (Fuquay, Fox, & McSweeney, 2011). β-Lg has not been detected in the
milk of humans, rodents or lagomorphs (Thompson, Boland, & Singh, 2009).
β-Lg has a molecular weight of 18.3 kDa, 162 amino acid residues, one free thiol
group and two disulfide bonds (Damodaran & Paraf, 1997). The structure of β-Lg shows
a high degree of organization, with 9 anti-parallel strands and 9 β-sheets forming a β-
barrel. Each β-sheet has one hydrophobic side and a hydrophilic side, and a hydrophobic
cavity is formed by aligning hydrophobic sides of β-sheets facing each other (Allen,
2010). β-Lg contains a large portion of β-sheets (50% of residues) and a small portion of
α-helix (10-15%) and β turns (15-20%). There are ten known genetic variants of bovine
5
β-Lg, with the most abundant variants being β-Lg A and β-Lg B that differ by two amino
acid residues, which are Asp64Gly and Val118Ala, respectively (Farrell Jr, Jimenez-
Flores, Bleck, Brown, Butler, Creamer, et al., 2004).
The isoelectric point (pI) of β-Lg is around pH 5.2-5.35 (Farrell Jr, et al., 2004;
Godovac-Zimmermann & others, 1996). The quaternary structure of protein varies as a
result of a delicate balance among hydrophobic, electrostatic and hydrogen-bond
interactions, depending on the pH, temperature and ionic strength (Sakurai & Goto, 2002;
Sakurai, Oobatake, & Goto, 2001). At pH 5.5-7.5, β-Lg exists as a dimer consisting of
two stacked cones that are the prevalent form at physiological conditions in milk
(Damodaran & Paraf, 1997; Fox & McSweeney, 2003). At pH 3-5, β-Lg dimers associate
to form octomers. β-Lg exists in the monomer form at pH below 3, which resembles that
of a cone with a hydrophobic pocket being capable of binding small hydrophobic ligands
such as vitamin A and fatty acids (Damodaran & Paraf, 1997; Fox & McSweeney, 2003;
Kontopidis, Holt, & Sawyer, 2004). The compact structure of β-Lg, with 9 β-sheets and 2
disulfide bridges, is resistant to complete proteolysis by digestive proteases. At pH >9,
the β-Lg molecule is irreversibly denatured (Damodaran & Paraf, 1997).
The denaturation temperature of β-Lg is ~78 °C, with a loss of solubility at 78-
82 °C caused by denaturation and aggregation (Allen, 2010). Protein unfolding exposes
free thiol groups and hydrophobic residues, leading to formation of a variety of covalent
and hydrophobic intermolecular associations and also the homo- and heteropolymeric
disulfide-bridges (Thompson, Boland, & Singh, 2009).
α-La is a smaller molecule than β-Lg. α-La has a molecular mass of 14.2 kDa,
123 amino acid residues, and 4 disulfide bridges (Damodaran & Paraf, 1997). Unlike β-
6
Lg, there is no free thiol groups in α-La. α-La contains a high level of tryptophan and
1.9% of sulfur and is a major protein in human milk. α-La is an elliptical shaped compact
protein made up of two lobes: the α-lobe contains 3 α-helices and two short 310-helices,
while a small three-stranded β-sheet and a short 310-helix make up the β-lobe (Pike,
Brew, & Acharya, 1996). α-La exhibits high similarity with lysozyme (Kontopidis, Holt,
& Sawyer, 2004). The pI of α-la is around pH 4.5~4.8. Due to the presence of disulfide
bonds and its compact structure, α-La is considered to be heat stable with a reversible
denaturation temperature of 62 °C (Bryant & McClements, 1998; Fox & McSweeney,
2003).
BSA is composed of 583 amino acid residues with an average molecular weight
of 66 kDa and in a multi-domain structure with complex ligand-binding specificities.
BSA has 17 disulfide bonds and one free sulfhydryl group (Considine, Patel, Anema,
Singh, & Creamer, 2007). Serum albumin is found in both blood serum and in the milk of
mammals. BSA enter the milk by passive diffusion from blood streams rather than being
produced by the mammary gland like other whey proteins (Allen, 2010). BSA is also an
elliptically shaped protein and functions as a transporter of hydrophobic molecules such
as fatty acids across membranes, but exists at a much lower quantity in milk than in blood
(Thompson, Boland, & Singh, 2009). BSA accounts for approximately 5% of the protein
in cheese whey and thereby does not have a significant effect on functional properties of
whey protein ingredients (Allen, 2010).
Although the three dimensional structure of BSA has not been determined, it
shares 75% sequence identity with human serum albumin. The secondary structures of
BSA are composed of 76% helix, 10% turn and 23% extended chain, and no β-sheet
7
(Considine, Patel, Anema, Singh, & Creamer, 2007), with several loops connecting the
two sub-domains A and B in the each domain (Fox & McSweeney, 2003). Reversible
changes in the conformation of BSA occur between 42 and 50 °C (Considine, Patel,
Anema, Singh, & Creamer, 2007). When temperature reaches its denaturation
temperature of ~64 °C, both unfolding of BSA and the free thiol group catalyze
aggregation (Considine, Patel, Anema, Singh, & Creamer, 2007). Gelation of BSA might
occur when heated above 70 °C if the concentration of disulfide bonds is sufficiently high
(Considine, Patel, Anema, Singh, & Creamer, 2007).
In bovine milk, immunoglobulin account for approximately 2% of total milk
protein and 10% of whey proteins with molecular weight varies (Christen & Smith,
2000). IgG, in particular IgG1 with a molecular weight of 161 kDa, is the predominant
species of immunoglobulins. IgG contains two heavy chains and two light chains and has
predominantly β-sheet structures. The two heavy chains are linked each other by disulfide
bonds, and a heavy chain and a light chain are linked via disulfide bonds (Thompson,
Boland, & Singh, 2009).
1.2 Physical and chemical interactions relevant to the stability of whey proteins
in aqueous solutions
1.2.1 Stability of colloidal particles interpreted by inter-particle interactions
Whey proteins are colloidal particles, and understanding the unique structure and
interaction of whey proteins is essential to the development and application of new
protein ingredients. A generalized illustration is given in Figure 1-1 to correlate the
8
stability of two ideal colloidal particles (hard spheres) with the overall interaction energy
(V) between them (Walstra, 2002). The V needed to bring two particles into contact can
be either positive or negative, resulting from repulsive or attractive inter-particle
interactions, respectively. The V is always positive at very close distance (< 0.5 nm)
because hard spheres cannot be compressed, but varies at longer separation distance.
When the V is always positive (top dashed curve), the dispersion is stable against
aggregation. Whereas, the always negative V (bottom dashed curve) indicates the
irreversible aggregation of particles being separated at a distance corresponding to the
primary minimum. The example (solid curve) between these two extreme cases shows
the significance of both attractive and repulsive forces, and the possibility of irreversible
(point A) or reversible (point C) aggregation depends on the magnitude of energy barrier
(point B) (Walstra, 2002).
The stability and aggregation of colloidal particles in the aspects of
thermodynamics and kinetics has been described using the Derjaguin-Landau-Verwey-
Overbeek (DLVO) theory, which is the first useful theory that takes into account the
combined effect of van der Waals attraction and electrostatic repulsion between
molecules in solution (De Young, Fink, & Dill, 1993). For charged particles, an increase
in salt concentration results in stronger attraction between particles and faster aggregation
since the free energy barrier is reduced. Whey proteins are more complicated than hard
spheres because several molecular interactions (Table 1-2) are significant to their
stability, discussed below.
9
1.2.2 Attractive interaction forces
Hydrophobic interactions. Hydrophobic interactions describe the aggregation
tendency of nonpolar substances to minimize the contact with water. When a non-polar
molecule is introduced in water, hydrogen bonds between water molecules are interrupted
to cause the rearrangement of water molecules around the non-polar molecule, and this
changes both enthalpy and entropy of the system (Bryant & McClements, 1998). The
aggregation of non-polar molecules in aqueous systems is thermodynamically favored
because of the significance in reducing enthalpy (Dill, 1990; Evans & Wennerström,
1999). Hydrophobic interactions are influenced by the structure of the non-polar
molecules and external factors such as temperature. The hydrophobic interactions
between whey proteins are stronger at a higher temperature in the range from 0 to ~60
°C, reach the maximum at about 60-70 °C, and are weakened upon further increases in
temperature (Bryant & McClements, 1998).
Hydrogen bonds. A hydrogen bond is formed between the electron-rich and
electron-depleted portions within a molecular or from two separate polar molecules.
Electrostatic, van der Waals and steric interactions can impact hydrogen bond formation
(Dill, 1990). Intermolecular hydrogen bonding is responsible for the high boiling point of
water, whereas intra-molecular hydrogen bonding partly contributes to the secondary,
tertiary and quaternary structures of proteins (Damodaran, 2008). Hydrogen bonds are
usually not to be considered as a major force in determining the aggregation of globular
protein, however, they are responsible for many unique properties of water and also for
stabilizing the structures once formed (Kinsella & Whitehead, 1989). The actual strength
10
of a particular hydrogen bond depends on the electronegativity and orientation of the
donor and the acceptor groups (Baker & Hubbard, 1984). Environmental factors such as
pH and ionic strength in the system thus may influence on the strength of hydrogen
bonding and heating reduces the number of hydrogen bonds because of the increased
molecular mobility at higher temperatures (Tang, Pikal, & Taylor, 2002).
van der Waals forces. The inter-protein van der Waals forces in aqueous systems
are always attractive and are contributed by dipole-dipole, dipole-induced dipole, and
induced dipole-induced dipole interactions (Walstra, 2002). The strength of van der
Waals interactions decays with intermolecular distance. Changes in van der Waals forces
during protein denaturation, from folded to unfolded state, is too little to be considered in
determining the conformational stability of proteins in solution (Bryant & McClements,
1998; Damodaran, 2008; Walstra, 2002).
Disulfide bonds. Disulfide bonds are formed between amino acids containing thiol
group such as cysteine, which is found in whey proteins (Shimada & Cheftel, 1989). Both
free thiol groups and disulfide bonds exist in the interior of native whey proteins in the
folded structure thereby are not contributing to inter-protein interactions. Unfolding of
whey proteins exposes the embedded thiol groups that become available to form inter-
and intra-molecular disulfide bonds as long as the thiol groups are brought to close
vicinity (Bryant & McClements, 1998; Damodaran, 2008; Walstra, 2002). The strength
of disulfide bonds is independent on pH and ionic strength, but can be reduced at extreme
high temperatures attributed by the disruption of disulfide bonds and oxidation of
cysteine (Betz, 1993; Bryant & McClements, 1998).
11
1.2.3 Repulsive interaction forces
Electrostatic interactions. Electrostatic interactions can be attractive or repulsive
depending on the types of surface charges (Bryant & McClements, 1998). The strength
and effective distance of electrostatic interactions vary with the pH and ionic strength
(Bryant & McClements, 1998; Walstra, 2002). At the isoelectric point (pI) of whey
proteins (Table 1-1), the net charge of protein molecules is zero. At a pH away from pI,
protein molecules are either positively (below pI) or negatively (above pI) charged
(Bryant & McClements, 1998). The electrostatic interactions are affected by the ionic
strength due to electrostatic screening by electrolytes. The strength of electrostatic
interactions between charged species increases with the increase of temperature because
of the entropic nature of the interactions (Bryant & McClements, 1998; Damodaran,
2008; Walstra, 2002).
Steric repulsion. Steric repulsion is generated due to overlap of electron clouds of
molecules. Steric repulsion is very significant in protein conformation as it reflects how
close the protein molecules could be packed together. The strength of steric repulsion is
indirectly influenced by the pH, ionic strength, and temperature (Bryant & McClements,
1998; Walstra, 2002). The expansion of the chains on the surface of molecules results in
an increased steric repulsion at low ionic strength caused by the reduced Debye-Hückel
screening of the proteins charges at lower ionic strength (Belfort & Lee, 1991). The
intensity of steric interactions showed a decrease at pH around pI, which is caused by the
reduced net charge density in the absorbed protein molecules (Belfort & Lee, 1991).
12
Hydration interactions. Hydration interactions are the result of the energy
required to break hydrogen bonds between the molecules and the water molecules in its
immediate vicinity (Besseling, 1997). The strength of hydration interactions depends on
the degree of protein hydration, which is influenced by pH and ionic strength (Bryant &
McClements, 1998).
1.3 Heat stability of whey proteins
Food processing is used to ensure food safety, extend shelf-life, or modify
functionality of ingredients. This may involve temperature, pressure, ionic strength, and
pH, all of which can result in the denaturation and aggregation of whey proteins (Jelen,
Rattray, & Fox, 1995). Effects of heating are discussed in this section.
1.3.1 Heat-induced denaturation and aggregation of whey proteins
Heating strongly affects the protein structures and thereby a variety of protein
functionality of commercial importance. The undesirable changes include the (turbid)
appearance of protein-containing solutions, precipitation, and loss of flowability
(gelation) due to aggregation of denatured whey proteins during heating. Heat-induced
denaturation and aggregation of whey proteins can be described by a kinetic model
developed by Roefs and de Kruif (1994) at neutral pH and an intermediate temperature
(65 °C) based on a generalized free radical reaction scheme involving steps of initiation,
propagation and termination (Roefs & Kruif, 1994). In general, a protein such as β-Lg
initially reversibly dissociates from dimers into monomers, which undergo partial
unfolding and expose a reactive thiol group. The reactive thiol group then reacts with a
13
disulfide bond, forming a new thiol to continue the reaction via disulfide interchange.
The aggregation is terminated when thiol groups on reactive intermediates are consumed
to form bigger structures (Ryan, Zhong, & Foegeding, 2013). However, non-covalent
forces are not accounted for in this model. With additional consideration of physical
forces such as hydrophobic attraction, the denaturation of β-Lg at neutral pH starts with a
dissociation step of dimer into monomers, which occurs at a temperature of 30~50 °C
(Sawyer, 1969). The conformational changes of monomers occur at a higher temperature
around 78 °C to expose a reactive thiol group and increase thiol activity (Bryant &
McClements, 1998; Zhu & Damodaran, 1994). Reactive monomers then interact via
disulfide bonds to form non-native dimers, trimmers and other small aggregates, followed
by formation of large aggregates through covalent and non-covalent interactions,
corresponding to macroscopic gels or precipitates as end products (Ryan, Zhong, &
Foegeding, 2013).
1.3.2 Factors impacting heat-induced denaturation and aggregation of whey
proteins
Initial protein concentration. A series of studies on heat-induced denaturation of
β-Lg showed that the protein initial concentration had a marked effect on the thermal
denaturation and aggregation (Hoffmann, Sala, Olieman, & de Kruif, 1997; Le Bon,
Nicolai, & Durand, 1999a). The average molecular mass and the radius of gyration of the
heat-induced β-Lg aggregates increased with increasing initial concentration, which may
be attributed to the shift of weight fraction of the aggregates towards higher molecular
mass (Hoffmann, Sala, Olieman, & de Kruif, 1997; Le Bon, Nicolai, & Durand, 1999a).
14
The conversion rate of native to aggregated protein is proportional to the initial
protein/monomer concentration (Elofsson, Dejmek, & Paulsson, 1996; Le Bon, Nicolai,
& Durand, 1999b). A greater intrinsic viscosity was found for the sample with 11%
protein than that with 8% protein after treatment for identical heating temperature and
duration (Vardhanabhuti & Foegeding, 1999). Protein concentration showed no
correlation with the changes in tertiary structure of the protein induced by heating but
was correlated to the formation of multimeric species (Iametti, Cairoli, De Gregori, &
Bonomi, 1995), with fewer dimers and trimmers when heated at a higher initial protein
concentration (Hoffmann, Sala, Olieman, & de Kruif, 1997).
pH. The aggregation of whey proteins, especially β-Lg, is very sensitive to the
system pH. The aggregation rate is higher at a pH closer to the isoelectric point of whey
proteins (Verheul, Roefs, & de Kruif, 1998). β-Lg bears only positive charges at very
acidic pH around 2-3 in contrast to its amphoteric behavior at neutral pH, resulting in a
considerable different mechanism of aggregation from that at neutral pH (de la Fuente,
Singh, & Hemar, 2002). A lower acidic pH results in an increase in denaturation
temperature, with the maximum at pH 3-4 for β-Lg, due to the weakened intra-molecular
electrostatic repulsion and enhanced conformational stability, which reduces
denaturation/aggregation reaction rate. The properties of whey proteins aggregates
formed at acidic pH have been studies for years (Aymard, Nicolai, Durand, & Clark,
1999; Ikeda & Morris, 2002; Schokker, Singh, Pinder, & Creamer, 2000). β-Lg with
different initial concentrations heated at pH 2.5 and 80 °C for 0-180 min resulted in large
aggregates whose dimension increased with increases in heating duration and ionic
strength but was independent on protein concentration (Schokker, Singh, Pinder, &
15
Creamer, 2000). The aggregates formed at acidic pH mostly have a worn-like shape,
which may be attributed to association of monomers with a larger aggregates at a fixed
location on β-Lg molecules (Schokker, Singh, Pinder, & Creamer, 2000). The end-to-end
aggregation is more likely than forming oligomers due to strong electrostatic repulsion at
the acidic pH around pH 2-2.5 (Schokker, Singh, Pinder, & Creamer, 2000), which was
observed by electron microscopy (Aymard, Nicolai, Durand, & Clark, 1999) and atomic
force microscopy (Ikeda & Morris, 2002). The contribution of exchange reaction between
the reactive thiol groups and disulfide bonds to the aggregation is negligible for the
aggregates formed at pH 2-3 because the thiol groups are very stable at low pH (de la
Fuente, Singh, & Hemar, 2002; Schokker, Singh, Pinder, & Creamer, 2000).
Unlike at very acidic pH values, the aggregation of whey proteins at around
neutral pH involves the interchange of reactive thiol groups. The reactivity and the
accessibility of thiol groups are higher between pH 7 and 8.5 (de la Fuente, Singh, &
Hemar, 2002) . Proteins such as β-Lg undergo a conformational change and a refolding
process that result in the exposure of responsible amino acid, Glu89 of β-Lg at pH 7.1
(Brownlow, Cabral, Cooper, Flower, Yewdall, Polikarpov, et al., 1997) and 8.2 (Qin,
Bewley, Creamer, Baker, Baker, & Jameson, 1998), which is buried at pH 6.2. This
conformational change accounts for the physical and chemical pH-dependent properties
of β-Lg and has functional implications for the reversible binding and release of ligands
(de la Fuente, Singh, & Hemar, 2002). At pH 8, the thiol group of β-Lg is more readily
available for reaction since the pKa of the cysteine is approximately 8. Conversely,
proteins have to be heated or unfolded by other mechanisms to expose the thiol group at
pH below 7 (de la Fuente, Singh, & Hemar, 2002). A study of β-Lg at 65 °C in a pH
16
range of 6.4 to 8.0 showed that intermolecular disulfide bonds played an important role in
the formation of heat-induced β-Lg aggregation, whereas at pH 6.0, both physical forces
and thiol/disulfide exchange reaction were involved in aggregation (Hoffmann, Sala,
Olieman, & de Kruif, 1997; Hoffmann & van Mil, 1999). At pH 6.0, very large
aggregates formed , which can be attributed to secondary, non-covalent interactions
between primary, disulfide-linked aggregates (de la Fuente, Singh, & Hemar, 2002).
Increase of pH results in an increase in the conversion rate of native β-Lg to aggregates
and a decrease in the size of aggregates, however, at pH 6.4-6.8, the aggregates formed
with a higher molecular weight and a more compact conformation and less negatively
charged when compared with the aggregates formed at higher pH (de la Fuente, Singh, &
Hemar, 2002; Hoffmann & van Mil, 1999). The decrease in size of aggregates with an
increase of pH was attributed to the fact that a higher pH accelerates the dissociation and
initiation reactions to form a large number of reactive intermediates in the early stages of
the reaction (Hoffmann & van Mil, 1999). This also increases the probability of
termination reaction and thus facilitates the formation of more but smaller disulfide-
linked aggregates (de la Futente, Singh, & Hemar, 2002).
Temperature and heating time. Like reactions, the structures of aggregates can be
controlled by the rate (temperature) and duration. The aggregation is completed in a
shorter time at a higher temperature at neutral pH, because of the slower denaturation and
reduced collision frequency of proteins at a lower temperature (Hoffmann, Sala, Olieman,
& de Kruif, 1997; McSwiney, Singh, & Campanella, 1994; Zuniga, Tolkach, Kulozik, &
Aguilera, 2010). A two-step process, a first-order denaturation reaction followed by a
17
second-order aggregation reaction, has been proposed to interpret the phenomena during
heating β-Lg at various conditions (Verheul, Roefs, & de Kruif, 1998), with the
aggregation step activated after reaching a certain extent of denaturation. The reaction
rates in both steps are influenced by heating conditions, pH, and ionic strength of the
system. The unfolding reaction is rate-limiting at a low temperature, at pH close to pI,
and at a high ionic strength, whereas the aggregation is rate limiting at high temperature,
a pH further from pI, and a low ionic strength (de la Fuente, Singh, & Hemar, 2002). The
contribution of non-covalent interactions to β-Lg aggregation varies with temperature,
with an increasing importance at temperature of 90-110 °C (Galani, 1999). When
temperature exceeds 100 °C, a reduced aggregate size and viscosity were observed,
probably due to the decomposition of protein above 113 °C and peptide bond breakage
above >140 °C (Photchanachai & Kitabatake, 2001).
Ionic strength. Ionic strength impacts the thermal stability of whey proteins by
affecting solubility, denaturation, electrostatic interactions, and specific binding. The
increased solubility of protein (salting-in) at low ionic strength and reduced solubility
(salting-out) are well-known as the Hofmeister effects. The presence of NaCl at high
concentrations can stabilize native protein conformation and reduce the denaturation rate,
whereas an increased ionic strength promotes aggregation via weakening the electrostatic
repulsion due to the screening of surface charge (Ryan, Zhong, & Foegeding, 2013). The
critical salt concentration required to induce the formation of aggregates is dependent on
types of salt (e.g., lower molar concentration for CaCl2 than NaCl) and increases with
increasing pH above pI (Kuhn & Foegeding, 1991; Schmitt & others, 2007). Ions may
also act as a ligand binding with protein molecules at a specific position or being a part of
18
the native structure, which is observed for the better heat stability of α-La when bound
with calcium (Hendrix, Griko, & Privalov, 2000).
1.4 Strategies of improving heat stability of whey proteins
1.4.1 Overview
As discussed above, thermal processing conditions are dependent on product
acidity, while products are formulated to have quality, safety, nutrition, and sensory
characteristics meeting consumer demands. When whey proteins become a part of a
product, solution conditions such as pH, ionic strength, and types and concentrations of
other solutes can impact the types and magnitudes of protein interactions. Because
denaturation precedes aggregation during heating, strategies can be developed to restrict
the denaturation of whey proteins. This has been studied by adopting other co-solutes or
pretreatments such as preheating and enzymatic cross-linking. The surface properties of
proteins can also be fabricate to introduce repulsive forces such as electrostatic and steric
repulsions to prevent or reduce protein aggregation. These strategies are briefly discussed
below.
1.4.2 Cross-linking by transglutaminase
1.4.2.1 Introduction
Transglutaminase (TGase) is a transferase that forms isopeptide bonds between
lysyl and glytaminyl residues. TGase can be produced by both mammals and
microorganisms. Compared to mammalian TGase, microbial TGase (mTGase) is smaller,
and more stable, and has calcium-independent activity (Ando, Adachi, Umeda, Matsuura,
19
Nonaka, Uchio, et al., 1989). The mTGase is the most commonly used enzyme in
modification of whey proteins, which catalyzes the formation of covalent crosslinking
between proteins to modify functional properties such as gelation (Truong, Clare,
Catignani, & Swaisgood, 2004), and emulsifying properties (Færgemand, Otte, & Qvist,
1998; Liu & Damodaran, 1999), and thermal stability (Zhang & Zhong, 2010).
1.4.2.2 Reactions catalyzed by transglutaminase
Reactions catalyzed by TGase are summarized in Figure 1-2. TGase catalyzes the
acyl transfer reaction between the -carboxyamide moiety of protein-bound glutamine
residue (acyl donors) and a variety of primary amines (acyl acceptors) (Yokoyama, Nio,
& Kikuchi, 2004). At the absence of amino substrates, TGase catalyzes the hydrolysis of
the -carboxyamide group, resulting in deamination (Yokoyama, Nio, & Kikuchi, 2004).
The formation of enzyme catalyzed lysyl-glutamyl bonds attenuates hydrophobic
interactions through steric hindrance and formation of compact molecules, which limits
the exposure of hydrophobic moieties and thus improves the thermal stability of proteins
(Eissa & Khan, 2006).
1.4.2.3 Property changes due to transglutaminase cross-linking
Surface hydrophobicity. The surface hydrophobicity of proteins can either
increase or decrease after treatment by mTGase. Babiker et al. (1996) found that surface
hydrophobicity of the protease- and acid-pretreated soy proteins decreased greatly after
polymerization by mTGase, suggesting that the exposed hydrophobic residues of the
pretreated peptides were buried after polymerization by mTGase. A later study of WPI
treated by mTGase also reported the decrease of surface hydrophobicity, which however
20
was concluded to be caused by the occlusion of hydrophobic cavities to the fluorescent
probes (Agyare & Damodaran, 2010). Other studies also demonstrated the decrease in
surface hydrophobicity after mTGase was applied to treat sodium caseinate (Tang, Yang,
Chen, Wu, & Peng, 2005), soy and wheat proteins (Ahn, Kim, & Ng, 2005). The increase
in surface hydrophobicity was also reported for whey protein isolate (Hiller & Lorenzen,
2007) and soy protein films (Tang & Jiang, 2007) after mTGase treatment. The increase
in surface hydrophobicity may be attributed to the exposure of embedded hydrophobic
groups during enzymatic cross-linking at a mild temperature. A few studies also found no
significant changes in surface hydrophobicity when β-casein, WPI and 11S soy globulins
after being treated with mTGase, suggesting that the cross-linking of lysine and
glutamine residues did not alter the exposure of hydrophobic amino acids (Liu &
Damodaran, 1999; Yildirim, Hettiarachchy, & Kalapathy, 1996). The difference in
changes of surface hydrophobicity may be attributed to the type of proteins based on the
premise of same enzymatic cross-linking conditions. Some proteins may not be suitable
substrates for enzymatic cross-linking due to lacking of or the embedment of substrate
amino acid residues (Ercili-Cura, Partanen, Husband, Ridout, Macierzanka, Lille, et al.,
2011; Reddy, Kella, & Kinsella, 1988).
Charges. TGase treatment at neutral pH increases the surface potential as a result
of partial deamidation of glutamine and asparagine (Figure 1-2) (Yokoyama, Nio, &
Kikuchi, 2004). TGase cross-linked protein results in an increase in overall net charge
(more negatively charged) because acyl- reaction can introduce new groups to charged
amino acid residues of proteins (DeJong & Koppelman, 2002).
21
Heat stability. Treatment of proteins with TGase can modify their heat stability
through the incorporation of amines, cross-linking and deamidation reaction (O'Sullivan,
Kelly, & Fox, 2002). TGase treatment can improved the heat stability of caseins at
pH>6.5 (O'Sullivan, Kelly, & Fox, 2002). The solubility and heat stability of sodium
caseinate at pH 4.6 were also improved after TGase treatment (Flanagan, Gunning, &
FitzGerald, 2003). The mTGase treatment increased the thermal denaturation temperature
of glycinin and β-conglycinin component and thus improved the heat stability (Tang,
Chen, Li, & Yang, 2006). β-Lg after excessive treatment with mTGase (23 h) also
showed the improved heat stability, and the prior treatment by the reducing agent
dithiothreitol (DTT) was observed to be not needed (Tang & Ma, 2007). The enhanced
heat stability after TGase treatment may be attributed to the partial unfolding of protein
molecules and the subsequent re-arrangement of protein conformation (Tang & Ma,
2007).
Rheology. Applying mTGase in dairy products provides an alternative for
improving texture and functional properties. A number of studies showed that proteins
cross-linked with mTGase generally increased gel strength and improved viscosity
(Dickinson & Yamamoto, 1996; Hernàndez-Balada, Taylor, Phillips, Marmer, & Brown,
2009). The viscosity of whey protein isolate at pH 6-7 was not significantly influenced
after mTGase treatment, but a considerable increase was observed when the solution pH
was 8, implying the pH-dependence of polymerization reaction (Eissa, Bisram, & Khan,
2004). Increasing incubation time from 0 to 8 h at pH 7.5 and 40 °C also increased the
apparent viscosity of WPI cross-linked by mTGase (Truong, Clare, Catignani, &
Swaisgood, 2004). The firmness of mTGase-treated protein gels is much higher than
22
those formed from untreated protein solutions (Jaros, Partschefeld, Henle, & Rohm,
2006) with a markedly increase in gelation temperature of WPI. However, a high level of
mTGase resulted in the loss of gelation properties after heating (Truong, Clare,
Catignani, & Swaisgood, 2004).
1.4.3 Co-solutes
1.4.3.1 Types of co-solutes studied for heat stability of whey proteins
Co-solutes can be categorized into four classes depending on whether their effects
on protein stability is neutral, favorable, unfavorable or combined (McClements, 2002).
The stabilizing co-solutes are those that oppose protein denaturation. This can be
described by the transfer free energy, the energy change when protein molecules are
transferred from a pure solvent to a co-solute solution (McClements, 2002). When the
transfer free energy is positive, the transfer of proteins is thermodynamically unfavorable,
that is, protein molecules prefer to be surrounded by solvent molecules, and co-solute
molecules are excluded from protein molecules, forming a region that protein molecules
cannot get through and thus cannot aggregate. For stabilizing co-solutes, the transfer free
energy is greater for the native state than for the denatured state; these co-solutes
therefore restrict proteins from denaturation.
Sugars or sugar alcohols, used as sweeteners, are a category of stabilizing co-
solutes. Generally, an increase of sugar/sugar alcohol concentration leads to an increased
denaturation temperature of proteins and therefore the enhanced thermal stability (Baier
& McClement, 2001; Kulmyrzaev, Bryant, & McClements, 2000). Disaccharides such as
sucrose and trehalose reduce the thermal aggregation rate of β-Lg, whereas
23
polysaccharide dextran did not prevent the aggregation during heating (Perez-Moral,
Adnet, Noel, & Parker, 2011). Sugar alcohols with molecular weight less than 200 g/mol
such as xylitol, sorbital, erythitol and mannitol also showed better effects in improving
heat stability of whey proteins than higher molecular weight sugar alcohols such as
maltitol, lactitol and isomalt (LaClair & Etzel, 2009).
Other co-solutes have also shown the ability to improve the stability of whey
proteins after heating. Glycerol at a concentration of 20% v/v can improve the heat
stability whey protein solutions at 2% protein, pH 4, attributed to the increase of
denaturation temperature (Gekko, 1982). 4 M of Urea, 10% v/v of propylene glycol and
10% v/v of ethanol also improved the thermal stability of whey proteins at pH 4 after
heating at 88 °C for 2 min, resulting in reduced whey protein solution turbidity (LaClair
& Etzel, 2009). β-casein with >90% purity is a feasible component to stabilize higher
concentrations of whey proteins in beverages (Yong & Foegeding, 2008). Hydrophilic
amino acids such as proline (Samuel, Ganesh, Yang, Chang, Wang, Hwang, et al., 2000),
asparagine and glutamine (LaClair & Etzel, 2009) when used at a sufficiently high
concentration also are effective in decreasing the turbidity of protein solution after
heating. Surfactants, such as sodium alkyl sulfates and alkyl maltopyranosieds reduce
aggregation, suggesting that surfactants may modulate whey protein properties (Giroux &
Britten, 2004; Hansted, Wejse, Bertelsen, & Otzen, 2011; Tran Le, Sabatino, Heyman,
Kasinos, Dinh, Dewettinck, et al., 2011).
24
1.4.3.2 Mechanisms of heat stability improvements of whey proteins by co-solutes
One of the most accepted mechanisms of simple sugars stabilizing whey proteins
is that sugar molecules are preferentially excluded from the region immediately
surrounding the proteins, due to a combination of excluded volume effect, caused by
steric exclusion of larger sugar molecules, and differential interaction effects
(McClements, 2001). Sugars increase the thermal denaturation temperature of proteins
because their interactions with native proteins are thermodynamically more favorable
than with denatured proteins (Baier & McClements, 2006). The excluded volume effect
leads to molecular arrangements around proteins to reduce the contact between proteins
and surrounding co-solute molecules (McClements, 2001). The inclusion of co-solutes
also decreases the collision frequency of native and denatured globular protein molecules
due to the increased viscosity of the continuous phase (LaClair & Etzel, 2009;
McClements, 2002; Semenova, Antipova, & Belyakova, 2002). In the presence of
glycerol, the interaction between glycerol molecules hydrophobic groups on protein
surfaces is not preferred, resulting in less exposure of nonpolar groups involved in protein
aggregation (McClements, 2002). A study on sucrose and glycerol used at different levels
revealed that sucrose was more effective than glycerol in increasing the thermal stability
of globular BSA because of the stronger steric exclusion effect (Baier & McClements,
2006).
At 70 °C, the dimers of β-Lg solution (6% w/v) were partially unfolded and
formed opaque particulate aggregates (Yong & Foegeding, 2008).In the presence of β-
casein, the formation of particulate aggregates of β-Lg is blocked but formed clear fine-
25
stranded aggregates (Yong & Foegeding, 2008). Amino acids stabilize proteins based on
different mechanisms. Proline can suppress protein aggregation by interacting with
hydrophobic amino acids exposed during heating (Samuel, et al., 2000), while arginine
can prevent the heat-induced aggregation of lysozyme at neutral pH via the hindrance of
intermolecular interaction between unfolded molecules (Matsuoka, Tomita, Hamada, &
Shiraki, 2007).
Urea stabilizes proteins through the rupture of hydrogen bonds and interference
with hydrophobic interactions, resulting in completely denatured proteins with high
solubility (Damodaran, 2008). Propylene glycol and ethanol also stabilize protein due to
the favorable interaction between glycols/ethanol and exposed hydrophobic amino acid
residues of denatured proteins (LaClair & Etzel, 2009).
Surfactants interact with proteins and modulate the thermal aggregation
depending on charge properties (Hansted, Wejse, Bertelsen, & Otzen, 2011). Cationic
surfactants promote protein aggregation at pH 6.5 after heating at 85 °C by a combination
of destabilization and charge neutralization. Anionic and non-ionic surfactants stabilize
proteins through solubilizing unfolded proteins and inhibiting protein aggregation.
Anionic surfactants suppress the protein aggregation by not only stabilizing potential
aggregation sites of proteins but also altering charge properties of proteins (Hansted,
Wejse, Bertelsen, & Otzen, 2011), with the latter strengthening electrostatic repulsion
that is not possible for non-ionic surfactants.

26
1.4.3.3 Property changes due to co-solutes
Solubility. Water solubility of proteins during heating usually decreases due to the
increased surface hydrophobicity and weakened electrostatic repulsion due to ionic co-
solutes causing the charge screening. However, co-solutes influence the water solubility
of proteins in different ways, either by altering the balance of the soluble-insoluble
protein equilibrium or by altering the protein conformation (McClements, 2002). In
addition to types of proteins and co-solutes, the water solubility of proteins is dependent
on external conditions such as pH and temperature. The water solubility of different
globular proteins was found to increase by adding sugar (sorbitol, saccharose, sorbose
and sucrose) and glycols (glycerol, propylene glycol and ethylene glycol) near their pI
(Antipova & Semenova, 1997; McClements, 2002) but sucrose decreased the solubility
of ovalbumin at pH away from the pI (Antipova, Semenova, & Belyakova, 1999).
Charged amino acids such as L-Arg and L-Glu at 50 mM dramatically increased the
concentration of soluble protein, and long-term stability of protein (Golovanov,
Hautbergue, Wilson, & Lian, 2004). Surfactants also can improve the solubility of
proteins. Sodium dodecyl sulfate (SDS) binds with hydrophobic sites of soy proteins and
increases negative charges on proteins and thereby increases the protein solubility
(Malhotra & Coupland, 2004; Nakai, Ho, Tung, & Quinn, 1980). Lecithin can largely
minimize the heat-induced protein intermolecular interactions thus prevent protein
aggregation during heating at 80 °C for 15 min at pH 6.55, thus increases the solubility of
proteins after heating (Tran Le, et al., 2011)
27
Rheology. In addition to increasing the viscosity of protein solutions to improve
heat stability, co-solutes can alter the gelation of proteins through increasing the
temperature of protein unfolding and the magnitude of attractive and repulsive forces
between protein molecules (McClements, 2002). This can increase the rigidity of gels
after heating (McClements, 2002). Sucrose increased the temperature of BSA gelation
when 2% w/w BSA solution was heated at pH 7 from 30-90 °C and held at 90 °C for
various durations (Baier & McClements, 2001). For the protein-SDS system, the
viscosity of protein solution was not significantly changed when SDS was used at a low
concentration; the denaturation of proteins at higher SDS concentration, also possibly by
binding with SDS micelles, significantly increase the viscosity (Malhotra & Coupland,
2004).
1.4.4 Forming soluble aggregates by preheating
1.4.4.1 Concept of soluble aggregates
Whey protein soluble aggregates (WPSAs) are defined as thermally-formed
intermediates between monomeric proteins and an insoluble gel network or precipitate
(McSwiney, Singh, & Campanella, 1994). The heating step used to form WPSAs changes
protein structures and confers the improved structural and thermal stability upon further
processing. The formation of WPSAs and the resulting properties are related to both
internal (whey protein type and concentration) and external factors (solution chemistry,
co-solutes, heating conditions). WPSAs are formed below the protein concentration
corresponding to gelation at a specific combination of heating temperature and duration
(McSwiney, Singh, & Campanella, 1994). Besides the protein concentration and heating
28
temperature/time, physicochemical properties of WPSAs including surface
hydrophobicity, zeta-potential, size and shapes can be fabricated by controlling pH, ionic
strength, ion type and co-solutes during heating (Ryan, Zhong, & Foegeding, 2013).
1.4.4.2 Mechanisms of improving heat stability by forming soluble aggregates
WPSAs can be formed by heating whey protein aqueous solutions at a pH
approximately from 6.0 to 7.5 (Ryan, Zhong, & Foegeding, 2013). A proposed
mechanism of improved salt and thermal stability of whey protein after forming WPSAs
is outlined in Figure 1-3 (Ryan, Zhong, & Foegeding, 2013). The hydrophobic amino
acid residues initially embedded at the native state become exposed after thermal
denaturation. The denatured proteins, behaving like anionic polymers with abundant
charges, aggregate only when hydrophobic patches on separate molecules approach each
other, and the aggregation of unfolded whey proteins now allows the formation of inter-
protein disulfide bonds at the exposed thiol groups (Vardhanabhuti & Foegeding, 1999).
The WPSAs formed at neutral pH and low ionic strength have the increased zeta-
potential, which, together with the formed covalent disulfide bonds, increases the heat
stability of whey proteins at an increased salt concentration (Ryan & others, 2011;
Schmitt & others., 2007).
1.4.4.3 Changes in some properties
Surface hydrophobicity. The surface hydrophobicity of WPSAs is typically
determined indirectly through the binding with hydrophobic probes such as 8-anilino-1-
naphthalenesulfonic acid (ANS) (Ryan, Zhong, & Foegeding, 2013). The surface
hydrophobicity of WPSAs is markedly impacted by pH, temperature and ionic strength
29
during preparation (Ryan, Zhong, & Foegeding, 2013). Heating of whey proteins at pH
6.0-7.0 corresponded to a reduction in surface hydrophobicity at pH 6.0, forming
spherical and dense WPSAs possibly due to limited exposure of hydrophobic patches
(Schmitt & others., 2007). At pH 7.0, heating facilitates the exposure of hydrophobic
patches and therefore increases surface hydrophobicity; extended heating however may
result in the decrease in surface hydrophobicity because aggregation via hydrophobic
amino acid residues on surfaces reduces the sites for binding with hydrophobic probes
(Ryan, Zhong, & Foegeding, 2013).
Zeta-potential. The zeta-potential is calculated by determining the electrophoretic
mobility, which is obtained by performing an electrophoresis experiment on the sample
and measuring the velocity of the particles using laser Doppler velocimetry (LDV)
(Ryan, Zhong, & Foegeding, 2013). The magnitude of zeta-potential, either positive or
negative, indicates the strength of electrostatic repulsion. Zeta-potential of whey protein
solutions can increase or decrease after thermal treatments, depending on solution and
heating conditions. The zeta-potential of native β-Lg, ~-25 mV at pH 7.0, was observed
to have decreased after heating at 70 °C for 24 h but have increased after heating at 85 °C
for 8 h (Donato, Schmitt, Bovetto, & Rouvet, 2009). Zeta-potential is affected by the
presence of salt, because charge screening by the added salt lowers the electrophoretic
mobility of proteins (Schmitt & others., 2007).
Morphology. The morphology of WPSAs depends strongly on a number of
factors, mostly pH, initial concentration, temperature, and ionic strength during
preheating. At pH 2-3, large, rigid and rod shaped aggregates are formed after preheating;
the aggregates become more spherical when pH gets closer to pI. At pH above pI, the
30
shape of aggregates varies depend on protein concentration during preheating. Small and
elongated aggregates are observed at lower protein concentrations, while larger and
randomly branched aggregates with self-similar structures are formed at higher protein
concentration (Phan-Xuan & others., 2011). Generally, a higher temperature during
preheating results in large aggregates, but heating at temperatures above ~140 °C can
results in the cleavage of peptide bonds and thus a reduction in aggregate size
(Photchanachai & Kitabatake, 2001). A longer heating time may have little influence on
the aggregates size but facilitate the yield of aggregates, indicating aggregate growth
phase reached a steady state (Le Bon, Nicolai, & Durand, 1999a, 1999b). The size of
aggregates increases with NaCl concentration, but different shapes can be observed
during heating at different pH conditions due to the effects on electrostatic interactions
(Schmitt & others., 2007). For WPSAs formed by heating at pH 7.0 with NaCl, the
WPSAs were denser, more curved and thinner than those formed with the absence of
NaCl, suggesting that the oriented aggregation at the absence of salt is no longer the case
due to charge screening (Schmitt & others., 2007).
1.4.5 Glycation with reducing sugars
1.4.5.1 A brief overview of the Maillard reaction
Glycation, also known as the Maillard reaction, occurs between the -amino
groups of the lysine residues in food proteins and the reducing-end carbonyl group of a
sugar (Liu, Ru, & Ding, 2012). The Maillard reaction starts with a condensation reaction
between a reducing sugar and an amino group to yield a Schiff base (formation of N-
glycoside). After formation of N-glycoside, Amodori rearrangement takes place for
31
isomerization, leading to formation of Amodori rearrangement products (ARPs), 1-
amino-1-deoxy-2-ketose (Ames, 1992). Subsequently, ARPs undergo a series of
reactions, depending on the pH of the system, forming complex products for Strecker
degradation. In the advanced stage, some of the Maillard reaction products with dark
color are formed in various reactions and are responsible for the brown pigments and
aromas which can be desirable or undesirable (Liu, Ru, & Ding, 2012).
Glycation can occur either in the aqueous solution (wet base) or spray-
dried/freeze-dried powder (dry base). Temperature, duration, pH, water activity, intrinsic
properties of protein and sugar, and the protein:sugar ratio are factors that influence
physicochemical properties of glycated proteins. Glycation by heating powder mixtures
of protein and reducing sugar is faster than in aqueous solutions because of the lower
concentration of reactants in the latter (Liu, Ru, & Ding, 2012). Additionally, the rate of
initial ARPs formation can be reduced due to the presence of water that further slows
later steps in the Maillard reaction (Van Boekel, 2001).
Attachment of oligosaccharides to proteins through the Maillard reaction is more
limited when compared to monosaccharides because of the steric hindrance of the
initially attached carbohydrate chains (Jiménez-Castaño, Villamiel, & López-Fandiño,
2007). However, side reaction products and color developments may be suppressed in the
subsequent reactions when bigger reducing saccharides are used. Glycation of protein
with reducing saccharides greatly enhances the solubility, thermal stability, and
emulsifying properties of proteins (Kato & Kobayashi, 1991; Liu, Ru, & Ding, 2012).
The rate of reaction increases with increases in temperature due to an increase of the
reactivity (Damodaran, 2008). In aqueous solution, more brown color compounds are
32
formed during reaction at a high temperature for a short time when compared to a mild
temperature for a long heating time. The rate of Maillard reaction is influenced by pH
(Damodaran, 2008). At a lower pH, the amino group is more protonated and becomes
less nucleophilic. In contrast, the amino group is deprotonated at alkaline pH and more
nucleophilic and is reactive with the carbonyl group of reducing saccharides (Nemet,
Šošo, & Lazić, 2010). A number of reaction pathways can result in the formation of
brown pigments. The rate of color formation is reduced by decreasing pH because the
pathway of forming melanoidins is favored under alkaline conditions (Dattatreya &
Rankin, 2006) . The fate of the ARPs is also determined by pH (Martins, Jongen, & Van
Boekel, 2000). The effect of water on Maillard reaction is complicated as water is
involved in various reaction mechanisms. The rate of Maillard reaction increases from
the dry state with an initial water activity of 0.2-0.3, is optimum at a water activity of 0.6-
0.7, and decreases at a higher water activity due to the dilution of reactants and hindrance
of further stages of reactions (Damodaran, 2008; Labuza & Saltmarch, 1981; Van
Boekel, 2001). The ratio of protein to saccharide is considered as an important factor
determining the rate of Maillard reaction. At low protein:saccharide ratios, saccharide
molecules are sufficient for reaction with available amino groups (Jones & McClements,
2010), requiring a shorter reaction time (Carabasa-Giribet & Ibarz-Ribas, 2000).
1.4.5.2 Principles of improving thermal stability of proteins by glycation
The improved thermal stability of whey proteins has been observed after
glycation with reducing saccharides (Chevalier, Chobert, Popineau, Nicolas, & Haertlé,
2001; Liu & Zhong, 2012, 2013). This can be attributed to steric effects based on the
33
well-established theory that polymers grafted on a colloidal particle provide steric
hindrance against aggregation with the premise that the solvent condition allows the
extension of polymer chains to the continuous phase (Israelachvili, 2011). The reducing
saccharide molecules attached on protein molecules act as a hairy layer (Israelachvili,
2011). Because the strength of steric hindrance is a function of polymer chain density on
colloidal particle surface (Israelachvili, 2011), a higher degree of glycation facilitates the
improvement of functional properties of proteins.
1.4.5.3 Changes in some properties due to glycation
Surface hydrophobicity. With the attachment of hydrophilic reducing saccharides
during glycation, the surface hydrophobicity of proteins changes, affecting greatly their
functional properties (Liu, Ru, & Ding, 2012). The measured surface hydrophobicity was
reported to either increase or decrease after glycation due to factors such as types of
protein and reducing sugar and the degree of glycation (Liu, Ru, & Ding, 2012). The
increase in surface hydrophobicity was found to be related to the increased availability
for binding fluorescence probes due to the exposure of hydrophobic patches resulting
from protein denaturation. The extent of surface hydrophobicity increase depends on the
protein:sugar ratio and glycation duration (Tang, Sun, & Foegeding, 2011). Many studies
on different proteins reported the maximum surface hydrophobicity at an intermediate
reaction duration, followed by a gradual decrease at longer glycation duration (Sava &
others., 2005; Sun, Hayakawa, & Izumori, 2004; Tang, Sun, & Foegeding, 2011). The
reduction of surface hydrophobicity after glycation has been attributed to the blocking of
fluorescent probes to bind lysine and/or arginine residues by the attached saccharides
34
(Gasymov & Glasgow, 2007) and the aggregation of proteins resulting from attraction
between hydrophobic patches exposed during glycation (Sava & others., 2005).
Isoelectric point (pI). Glycation of proteins results in the blockage of basic lysine
by reducing saccharides and a shift of protein pI to a lower pH (Liu, Ru, & Ding, 2012).
The extent of pI shift depends on the chemistry of protein and reducing sugars and
glycation conditions. The pI of WPI shifted from pH 4.86 to pH 4.28 after partial
glycation (Wang & Ismail, 2012). The pI of phaseolin progressively decreased within
reaction duration, from 4.85 to 4.27 and 4.45 at a protein/glucose molar ratio of 1:100
and 1:50, respectively, after incubation of 10 h, and a greater reduction of pI was due to a
higher degree of glycation (Tang, Sun, & Foegeding, 2011).
Heat stability. Heat-induced aggregation of protein can be controlled by
formation of protein-polysaccharide conjugate. The thermal aggregation can be inhibited
by the interactions of globular proteins and charged polysaccharides by lowering the
accessibility of protein reactive sites, which has been demonstrated in the case of β-Lg
and Sodium polypectate system (Ndi, Swanson, Dunker, & Luedecke, 1996). Glycation
of β-Lg (2 mg/mL) exhibited a better thermal stability when heated at pH 5, 25-90 °C as
compared to native protein (Chevalier, Chobert, Popineau, Nicolas, & Haertlé, 2001). β-
Lg glycated with dextrans at 60 °C and water activity of 0.44 showed an improved
thermal stability at pH 5 above 85 °C (Jiménez-Castaño, Lopez-Fandino, Olano, &
Villamiel, 2005). In our group, whey proteins glycated with different sugars (D-glucose,
sucrose, lactose) under various reaction conditions have been studied, suggesting that a
steric hindrance was created during glycation thus enhanced the heat stability of whey
proteins (Liu & Zhong, 2012, 2013).
35
Rheology. Several studies reported the increased viscosity and viscoelastic
properties after glycation. The increase of viscosity of glycated proteins may be attributed
to the increased dimension of proteins after glycation and possibly cross-linked proteins
(Liu, Ru, & Ding, 2012). A longer period of incubation and a longer chain length of
reducing saccharides result in a greater increase of viscosity, suggesting the viscosity is
related to the number of reducing sugars attached to the protein (Corzo-Martínez,
Moreno, Villamiel, & Harte, 2010; O’Regan & Mulvihill, 2009). It was also observed for
the increased viscosity and gelation after reconstituting sodium caseinate powder
glycated with maltodextrin for a longer duration (O’Regan & Mulvihill, 2009). For egg
white, the increase in gel strength formed by heating glycated proteins was observed to
be a function of saccharide structure, following the order of psicose>fructose>glucose
(Sun, Hayakawa, & Izumori, 2004).
1.5 Conclusions
Thermal stability of whey proteins is critically needed to produce shelf-stable
protein beverages. Thermal stability of whey proteins is a function of pH, ionic strength,
thermal treatment conditions, and the presence of other co-solutes. Thermal stability of
whey proteins at neutral pH can be improved by adopting conditions restricting protein
denaturation during heating such as dissolving co-solutes, enzymatic crosslinking, or
preheating to form soluble aggregates. Glycation of whey proteins with appropriate
saccharides can improve thermal stability at various acidic and ionic conditions. These
strategies may also be used in combination. Much work however is needed to improve

36
the properties of these systems and understand physicochemical mechanisms associated
with the property improvements.
1.6 Scope of dissertation research
Heat-induced aggregation of whey proteins can be suppressed through a variety of
approaches based on the understanding of colloidal interactions in the system. Although
these strategies result in small particles and lower turbidity after heating, most of them
were employed at low whey protein concentration and at pH far away from pI. The
current work focused on the physicochemical bases of improved heat stability of whey
proteins, at high concentration (5% w/v), different pH conditions (pH 4-7), after heating
at temperatures above the denaturation temperature of native whey proteins (80 °C, 15
min), simulated hot-filling process (88 °C, 2 min), and simulated UHT process (138 °C, 1
min).
The heat stability of whey proteins was first studied at neutral pH through
sequential preheating and mTGase pretreatments (Chapter 2 and 3). Preheating whey
proteins at neutral pH in the absence of salt leads to partial unfolding of proteins, which
alters the overall charge on the protein surface, as a result, affecting the electrostatic
interactions between protein molecules. Additionally, substrate amino acids embedded in
the interior can be exposed during preheating, which could increase the accessibility of
reactive amino acids (lysine and glutamine) for mTGase cross-linking. TGase cross-
linking limit the further exposure of hydrophobic moieties of whey proteins, thus
improved the heat stability of whey proteins. Chapter 2 focused on the physicochemical
37
properties of whey proteins after heating at 80 °C, with determination of changes in
turbidity, particle size, charges, surface hydrophobicity, denaturation behavior, rheology,
and particle morphology, etc. A more severe heating process (138 °C) was applied on
sequentially pretreated whey proteins, revealing the physicochemical changes in a high
temperature environment, presented in Chapter 3.
Heat-induced aggregation of whey proteins can be inhibited at pH 4-7 via
glycation with reducing saccharides, that is, Maillard reaction (Chapter 4 and 5). Whey
proteins glycated with saccharides creates a structure with internal whey protein core and
an external saccharide shell. The aggregation of proteins therefore can be prevented since
protein molecules have to overcome the saccharide shell to aggregate. Reaction
conditions significantly affect the glycation of whey protein and reducing saccharides,
including temperature, relative humidity and pH, resulting in final products with a variety
of functional properties. The pathway of Maillard reaction varies under different pH
conditions that determine the reaction rate and color formation. Combined with addition
of co-solutes in the system, whey proteins can be stabilized at pH 4-7. In Chapter 4, the
impact of powder acidity on the glycation of whey protein and maltodextrin was studied.
In Chapter 5, the effects of four types of saccharides: D-glucose, sucrose, lactose and D-
cellobiose on the improvement of heat stability of whey proteins were studied at pH 5.0.
38
References
Agyare, K. K., & Damodaran, S. (2010). pH-stability and thermal properties of microbial
transglutaminase-treated whey protein isolate. Journal of Agricultural and Food
chemistry, 58(3), 1946-1953.
Ahn, H., Kim, J., & Ng, P. (2005). Functional and thermal properties of wheat, barley,
and soy flours and their blends treated with a microbial transglutaminase. Journal
of Food Science, 70(6), 380-c386.
Allen, M. D. (2010). A Comparison of Analytical Methods for Quantifying Denatured
Whey Proteins and Their Correlation to Solubility. Master's Thesis. California
Polytechnic State University.
Ames, J. M. (1992). The Maillard reaction. In: Biochemistry of food proteins. Springer.,
99-153.
Ando, H., Adachi, M., Umeda, K., Matsuura, A., Nonaka, M., Uchio, R., Tanaka, H., &
Motoki, M. (1989). Purification and characteristics of a novel transglutaminase
derived from microorganisms. Agricultural and Biological Chemistry, 53(10),
2613-2617.
Antipova, A., & Semenova, M. (1997). Effect of neutral carbohydrate structure in the set
glucose/sucrose/maltodextrin/dextran on protein surface activity at the air/water
interface. Food Hydrocolloids, 11(1), 71-77.
Antipova, A. S., Semenova, M. G., & Belyakova, L. E. (1999). The effect of sucrose on
the thermodynamic properties of ovalbumin and sodium caseinate in bulk solution
and at air–water interface. Colloids and Surfaces B: Biointerfaces, 12(3), 261-
270.
Aymard, P., Nicolai, T., Durand, D., & Clark, A. (1999). Static and dynamic scattering of
β-lactoglobulin aggregates formed after heat-induced denaturation at pH 2.
Macromolecules, 32(8), 2542-2552.
Babiker, E. E. (2000). Effect of transglutaminase treatment on the functional properties of
native and chymotrypsin-digested soy protein. Food Chemistry, 70(2), 139-145.
Baier, S., & McClements, D. J. (2001). Impact of preferential interactions on thermal
stability and gelation of bovine serum albumin in aqueous sucrose solutions.
Journal of Agricultural and Food Chemistry, 49(5), 2600-2608.
Baier, S. K., & Julian McClements, D. (2006). The effect of binary cosolvent systems
(glycerol–sucrose mixtures) on the heat‐induced gelation mechanism of bovine
serum albumin. International Journal of Food Science & Technology, 41(2), 189-
199.
Baker, E. N. & Hubbard, R. E. (1984). Hydrogen bonding in globular proteins. In:
Progress in Biophysics and Molecular Biology. 44, 97.
Belfort, G. & Lee, Cheng-sheng. (1991). Attractive and repulsive interactions between
and within absorbed ribonuclease A layers. Biophysics, 88, 9146-9150.
Besseling, N. (1997). Theory of hydration forces between surfaces. Langmuir, 13(7),
2113-2122.
Betz, S. F. (1993). Disulfide bonds and the stability of globular proteins. Protein Science,
2(10), 1551-1558.
39
Brownlow, S., Cabral, J. H. M., Cooper, R., Flower, D. R., Yewdall, S. J., Polikarpov, I.,
North, A. C., & Sawyer, L. (1997). Bovine β-lactoglobulin at 1.8 Å resolution still
an enigmatic lipocalin. Structure, 5(4), 481-495.
Bryant, C. M., & McClements, D. J. (1998). Molecular basis of protein functionality with
special consideration of cold-set gels derived from heat-denatured whey. Trends
in Food Science & Technology, 9(4), 143-151.
Carabasa-Giribet, M., & Ibarz-Ribas, A. (2000). Kinetics of colour development in
aqueous glucose systems at high temperatures. Journal of Food Engineering,
44(3), 181-189.
Cayot, P., & Lorient, D. (1997). Structure-function relationships of whey proteins. In:
Food Proteins and Their Applications. New York-Marcel Dekker., 225-256.
Chevalier, F., Chobert, J. M., Popineau, Y., Nicolas, M. G., & Haertlé, T. (2001).
Improvement of functional properties of β-lactoglobulin glycated through the
Maillard reaction is related to the nature of the sugar. International Dairy Journal,
11(3), 145-152.
Christen, G. L., & Smith, J. S. (2000). Food Chemistry: Principles and Applications:
Science Technology System West Sacramento, CA, USA.
Considine, T., Patel, H., Anema, S., Singh, H., & Creamer, L. (2007). Interactions of
milk proteins during heat and high hydrostatic pressure treatments - a review.
Innovative Food Science & Emerging Technologies, 8(1), 1-23.
Corzo-Martínez, M., Moreno, F. J., Villamiel, M., & Harte, F. M. (2010).
Characterization and improvement of rheological properties of sodium caseinate
glycated with galactose, lactose and dextran. Food Hydrocolloids, 24(1), 88-97.
Damodaran, S., & Paraf, A. (1997). Food Proteins and Their Applications: Marcel
Dekker Inc.
Damodaran, S., (2008). Amino acids, peptides, and proteins. In: Fennema's Food
Chemistry: CRC Press/Taylor & Francis.
Dattatreya, A., & Rankin, S. A. (2006). Moderately acidic pH potentiates browning of
sweet whey powder. International Dairy Journal, 16(7), 822-828.
de la Fuente, M. A., Singh, H., & Hemar, Y. (2002). Recent advances in the
characterisation of heat-induced aggregates and intermediates of whey proteins.
Trends in Food Science & Technology, 13(8), 262-274.
De Wit, J. (1998). Nutritional and functional characteristics of whey proteins in food
products. Journal of Dairy Science, 81(3), 597-608.
De Young, L. R., Fink, A. L., & Dill, K. A. (1993). Aggregation of globular proteins.
Accounts of Chemical Research, 26(12), 614-620.
Dickinson, E., & Yamamoto, Y. (1996). Rheology of milk protein gels and protein-
stabilized emulsion gels cross-linked with transglutaminase. Journal of
Agricultural and Food Chemistry, 44(6), 1371-1377.
Dill, K. A. (1990). Dominant forces in protein folding. Biochemistry, 29(31), 7133-7155.
Donato, L., Schmitt, C., Bovetto, L., & Rouvet, M. (2009). Mechanism of formation of
stable heat-induced β-lactoglobulin microgels. International Dairy Journal, 19(5),
295-306.
40
Eissa, A. S., Bisram, S., & Khan, S. A. (2004). Polymerization and gelation of whey
protein isolates at low pH using transglutaminase enzyme. Journal of Agricultural
and Food Chemistry, 52(14), 4456-4464.
Eissa, A. S., & Khan, S. A. (2006). Modulation of hydrophobic interactions in denatured
whey proteins by transglutaminase enzyme. Food Hydrocolloids, 20(4), 543-547.
Elofsson, U. M., Dejmek, P., & Paulsson, M. A. (1996). Heat-induced aggregation of β-
lactoglobulin studied by dynamic light scattering. International Dairy Journal,
6(4), 343-357.
Ercili-Cura, D., Partanen, R., Husband, F., Ridout, M., Macierzanka, A., Lille, M., Boer,
H., Lantto, R., Buchert, J., & Mackie, A. R. (2011). Enzymatic cross-linking of β-
lactoglobulin in solution and at air-water interface: Structural constraints. Food
Hydrocolloids, 28(1), 1-9.
Etzel, M. R. (2004). Manufacture and use of dairy protein fractions. The Journal of
Nutrition, 134(4), 996S-1002S.
Evans, D. F., & Wennerström, H. (1999). The Colloidal Domain: where physics,
chemistry, and biology meet: Wiley-VCH New York.
Færgemand, M., Otte, J., & Qvist, K. B. (1998). Emulsifying properties of milk proteins
cross-linked with microbial transglutaminase. International Dairy Journal, 8(8),
715-723.
Farrell Jr, H., Jimenez-Flores, R., Bleck, G., Brown, E., Butler, J., Creamer, L., Hicks, C.,
Hollar, C., Ng-Kwai-Hang, K., & Swaisgood, H. (2004). Nomenclature of the
proteins of cows’ milk—sixth revision. Journal of Dairy Science, 87(6), 1641-
1674.
Flanagan, J., Gunning, Y., & FitzGerald, R. (2003). Effect of cross-linking with
transglutaminase on the heat stability and some functional characteristics of
sodium caseinate. Food Research International, 36(3), 267-274.
Foegeding, E. A., Davis, J. P., Doucet, D., & McGuffey, M. K. (2002). Advances in
modifying and understanding whey protein functionality. Trends in Food Science
& Technology, 13(5), 151-159.
Fox, P. F., & McSweeney, P. L. (2003). Advanced Dairy Chemistry (Vol. 1): Plenum
Publishing Corporation.
Fuquay, J. W., Fox, P. F., & McSweeney, P. L. (2011). Encyclopedia of Dairy Sciences
2nd Edition Online: Academic Press.
Galani, D. (1999). Heat‐induced denaturation and aggregation of β‐Lactoglobulin:
kinetics of formation of hydrophobic and disulphide‐linked aggregates.
International Journal of Food Science & Technology, 34(5‐6), 467-476.
Gasymov, O. K., & Glasgow, B. J. (2007). ANS fluorescence: Potential to augment the
identification of the external binding sites of proteins. Biochimica et Biophysica
Acta (BBA)-Proteins and Proteomics, 1774(3), 403-411.
Gekko, K. (1982). Calorimetric study on thermal denaturation of lysozyme in polyol-
water mixtures. Journal of Biochemistry, 91(4), 1197-1204.
Giroux, H. J., & Britten, M. (2004). Heat treatment of whey proteins in the presence of
anionic surfactants. Food Hydrocolloids, 18(4), 685-692.
41
Godovac-Zimmermann, J., & others, a. (1996). Isolation and rapid sequence
characterization of two novel bovine β-lactoglobulins I and J. Journal of Protein
Chemistry, 15(8), 743-750.
Golovanov, A. P., Hautbergue, G. M., Wilson, S. A., & Lian, L.-Y. (2004). A simple
method for improving protein solubility and long-term stability. Journal of the
American Chemical Society, 126(29), 8933-8939.
Ha, E., & Zemel, M. B. (2003). Functional properties of whey, whey components, and
essential amino acids: mechanisms underlying health benefits for active people
(review). The Journal of Nutritional Biochemistry, 14(5), 251-258.
Hansted, J. G., Wejse, P. L., Bertelsen, H., & Otzen, D. E. (2011). Effect of protein–
surfactant interactions on aggregation of β-lactoglobulin. Biochimica et
Biophysica Acta (BBA)-Proteins and Proteomics, 1814(5), 713-723.
Hendrix, T., Griko, Y. V., & Privalov, P. L. (2000). A calorimetric study of the influence
of calcium on the stability of bovine α-lactalbumin. Biophysical Chemistry, 84(1),
27-34.
Hernàndez-Balada, E., Taylor, M. M., Phillips, J. G., Marmer, W. N., & Brown, E. M.
(2009). Properties of biopolymers produced by transglutaminase treatment of
whey protein isolate and gelatin. Bioresource Technology, 100(14), 3638-3643.
Hiller, B., & Lorenzen, P. C. (2007). Surface hydrophobicity of physicochemically and
enzymatically treated milk proteins in relation to techno-functional properties.
Journal of Agricultural and Food Chemistry, 56(2), 461-468.
Hoffmann, M. A., Sala, G., Olieman, C., & de Kruif, K. G. (1997). Molecular mass
distributions of heat-induced β-lactoglobulin aggregates. Journal of Agricultural
and Food Chemistry, 45(8), 2949-2957.
Hoffmann, M. A., & van Mil, P. J. (1999). Heat-induced aggregation of β-lactoglobulin
as a function of pH. Journal of Agricultural and Food Chemistry, 47(5), 1898-
1905.
Iametti, S., Cairoli, S., De Gregori, B., & Bonomi, F. (1995). Modifications of High-
Order Structures upon Heating of. beta.-Lactoglobulin: Dependence on the
Protein Concentration. Journal of Agricultural and Food Chemistry, 43(1), 53-58.
Ikeda, S., & Morris, V. J. (2002). Fine-stranded and particulate aggregates of heat-
denatured whey proteins visualized by atomic force microscopy.
Biomacromolecules, 3(2), 382-389.
Israelachvili, J. N. (2011). Intermolecular and Surface Forces, 3rd edition: Academic
press.
Jaros, D., Partschefeld, C., Henle, T., & Rohm, H. (2006). Transglutaminase in dairy
products: chemistry, physics, applications. Journal of Texture Studies, 37(2), 113-
155.
Jelen, P., Rattray, W., & Fox, P. (1995). Thermal denaturation of whey proteins. in Heat-
induced changes in milk. P.F. Fox, Editior. International Dairy Federation:
Brussels.(Edition. 2.), 66-85.
Jiménez-Castaño, L., Lopez-Fandino, R., Olano, A., & Villamiel, M. (2005). Study on β-
lactoglobulin glycosylation with dextran: effect on solubility and heat stability.
Food Chemistry, 93(4), 689-695.
42
Jiménez-Castaño, L., Villamiel, M., & López-Fandiño, R. (2007). Glycosylation of
individual whey proteins by Maillard reaction using dextran of different
molecular mass. Food Hydrocolloids, 21(3), 433-443.
Jones, O. G., & McClements, D. J. (2011). Recent progress in biopolymer nanoparticle
and microparticle formation by heat-treating electrostatic protein-polysaccharide
complexes. Advances in Colloid and Interface Science, 167(2), 49-62.
Kato, A., & Kobayashi, K. (1991). Excellent emulsifying properties of protein-dextran
conjugates. Microemulsions and Emulsions in Foods, 213-229.
Kinsella, J., & Whitehead, D. (1989). Proteins in whey: chemical, physical, and
functional properties. Advances in Food and Nutrition Research, 33(3), 437-438.
Kontopidis, G., Holt, C., & Sawyer, L. (2004). Invited Review: β-Lactoglobulin: Binding
Properties, Structure, and Function. Journal of Dairy Science, 87(4), 785-796.
Kuhn, P. R., & Foegeding, E. A. (1991). Mineral salt effects on whey protein gelation.
Journal of Agricultural and Food Chemistry, 39(6), 1013-1016.
Kulmyrzaev, A., Bryant, C., & McClements, D. J. (2000). Influence of sucrose on the
thermal denaturation, gelation, and emulsion stabilization of whey proteins.
Journal of Agricultural and Food Chemistry, 48(5), 1593-1597.
Labuza, T., & Saltmarch, M. (1981). In; water activity: Influence on food quality,
Rockland, LB and Stewart, GF Eds. In): Academic Press, NewYork.
LaClair, C. E., & Etzel, M. R. (2009). Turbidity and protein aggregation in whey protein
beverages. Journal of Food Science, 74(7), C526-C535.
Le Bon, C., Nicolai, T., & Durand, D. (1999a). Growth and structure of aggregates of
heat denatured β-Lactoglobulin. International Journal of Food Science &
Technology, 34(5‐6), 451-465.
Le Bon, C., Nicolai, T., & Durand, D. (1999b). Kinetics of aggregation and gelation of
globular proteins after heat-induced denaturation. Macromolecules, 32(19), 6120-
6127.
Liu, G., & Zhong, Q. (2012). Glycation of Whey Protein To Provide Steric Hindrance
against Thermal Aggregation. Journal of Agricultural and Food Chemistry,
60(38), 9754-9762.
Liu, G., & Zhong, Q. (2013). Thermal aggregation properties of whey protein glycated
with various saccharides. Food Hydrocolloids, 32(1), 87-96.
Liu, J., Ru, Q., & Ding, Y. (2012). Glycation a promising method for food protein
modification: Physicochemical properties and structure, a review. Food Research
International, 49(1), 170-183.
Liu, M., & Damodaran, S. (1999). Effect of transglutaminase-catalyzed polymerization of
β-casein on its emulsifying properties. Journal of Agricultural and Food
Chemistry, 47(4), 1514-1519.
Malhotra, A., & Coupland, J. N. (2004). The effect of surfactants on the solubility, zeta
potential, and viscosity of soy protein isolates. Food Hydrocolloids, 18(1), 101-
108.
Martins, S. I., Jongen, W. M., & Van Boekel, M. A. (2000). A review of Maillard
reaction in food and implications to kinetic modelling. Trends in Food Science &
Technology, 11(9), 364-373.
43
Matsuoka, T., Tomita, S., Hamada, H., & Shiraki, K. (2007). Amidated amino acids are
prominent additives for preventing heat-induced aggregation of lysozyme.
Journal of Bioscience and Bioengineering, 103(5), 440-443.
McClements, D. J. (2001). Estimation of steric exclusion and differential interaction
contributions to protein transfer free energies in aqueous cosolvent solutions.
Food Hydrocolloids, 15(4), 355-363.
McClements, D. J. (2002). Modulation of globular protein functionality by weakly
interacting cosolvents. Critical Reviews in Food Science and Nutrition, 42(5),
417-471.
McSwiney, M., Singh, H., & Campanella, O. H. (1994). Thermal aggregation and
gelation of bovine β-lactoglobulin. Food Hydrocolloids, 8(5), 441-453.
Mettler, S., Rusch, C., & Colombani, P. C. (2006). Osmolality and pH of sport and other
drinks available in Switzerland. Schweizerische Zeitschrift fur Sportmedizin und
Sporttraumatologie, 54(3), 92.
Mleko, S. (1999). Effect of protein concentration on whey protein gels obtained by a two-
stage heating process. European Food Research and Technology, 209(6), 389-
392.
Nakai, S., Ho, L., Tung, M., & Quinn, J. (1980). Solubilization of rapeseed, soy and
sunflower protein isolates by surfactant and proteinase treatments. Canadian
Institute of Food Science and Technology Journal, 13(1), 14-22.
NDI, E. E., Swanson, B., Dunker, A., & Luedecke, L. (1996). Relation of
β‐Lactoglobulin–Sodium Polypectate Aggregation to Bulk Macromolecular
Concentration. Journal of Food Science, 61(1), 69-73.
Nemet, N. T., Šošo, V. M., & Lazić, V. L. (2010). Effect of glycerol content and pH
value of film-forming solution on the functional properties of protein-based edible
films. Acta Periodica Technologica(41), 57-67.
O'Sullivan, M., Kelly, A., & Fox, P. (2002). Effect of transglutaminase on the heat
stability of milk: a possible mechanism. Journal of Dairy Science, 85(1), 1-7.
O’Regan, J., & Mulvihill, D. M. (2009). Preparation, characterisation and selected
functional properties of sodium caseinate–maltodextrin conjugates. Food
Chemistry, 115(4), 1257-1267.
Perez-Moral, N., Adnet, C., Noel, T., & Parker, R. (2011). The aggregative stability of β-
lactoglobulin in glassy mixtures with sucrose, trehalose and dextran. European
Journal of Pharmaceutics and Biopharmaceutics, 78(2), 264-270.
Phan-Xuan, T., & others., a. (2011). On the Crucial Importance of the pH for the
Formation and Self-Stabilization of Protein Microgels and Strands. Langmuir,
27(24), 15092-15101.
Photchanachai, S., & Kitabatake, N. (2001). Heating of β-Lactoglobulin A Solution in a
Closed System at High Temperatures. Journal of Food Science, 66(5), 647-652.
Pike, A. C., Brew, K., & Acharya, K. R. (1996). Crystal structures of guinea-pig, goat
and bovine α-lactalbumin highlight the enhanced conformational flexibility of
regions that are significant for its action in lactose synthase. Structure, 4(6), 691-
703.
44
Qin, B. Y., Bewley, M. C., Creamer, L. K., Baker, H. M., Baker, E. N., & Jameson, G. B.
(1998). Structural basis of the Tanford transition of bovine β-lactoglobulin.
Biochemistry, 37(40), 14014-14023.
Reddy, I. M., Kella, N. K. D., & Kinsella, J. E. (1988). Structural and conformational
basis of the resistance of β-lactoglobulin to peptic and chymotryptic digestion.
Journal of Agricultural and Food Chemistry, 36(4), 737-741.
Rittmanic, S. (2006). US Whey Proteins in Ready-to-drink Beverages. US Dairy Export
Council News. Accessed online :
http://www.usdec.org/files/Publications/BEVERAGESwebversion8-16-06.pdf
Roefs, S. P., & Kruif, K. G. (1994). A Model for the Denaturation and Aggregation of β-
Lactoglobulin. European Journal of Biochemistry, 226(3), 883-889.
Ryan, K., Vardhanabhuti, B., Jaramillo, D. P., van Zanten, J. H., Coupland, J. N., &
Foegeding, E. A. (2012). Stability and mechanism of whey protein soluble
aggregates thermally treated with salts. Food Hydrocolloids, 27(2), 411-420.
Ryan, K. N., Zhong, Q., & Foegeding, E. A. (2013). Use of Whey Protein Soluble
Aggregates for Thermal Stability—A Hypothesis Paper. Journal of Food Science,
78(8), R1105-R1115.
Sakurai, K., & Goto, Y. (2002). Manipulating monomer-dimer equilibrium of bovine β-
lactoglobulin by amino acid substitution. Journal of Biological Chemistry,
277(28), 25735-25740.
Sakurai, K., Oobatake, M., & Goto, Y. (2001). Salt‐dependent monomer–dimer
equilibrium of bovine β‐lactoglobulin at pH 3. Protein Science, 10(11), 2325-
2335.
Samuel, D., Ganesh, G., Yang, P. W., Chang, M. M., Wang, S. L., Hwang, K. C., Yu, C.,
Jayaraman, G., Kumar, T. K. S., & Trivedi, V. D. (2000). Proline inhibits
aggregation during protein refolding. Protein Science, 9(2), 344-352.
Sava, N., Van der Plancken, I., Claeys, W., & Hendrickx, M. (2005). The Kinetics of
Heat-Induced Structural Changes of β-Lactoglobulin. Journal of Dairy Science,
88(5), 1646-1653.
Sawyer, W. (1969). Complex between β-lactoglobulin and κ-casein. A review. Journal of
Dairy Science, 52(9), 1347-1355.
Schmitt, C., & others. (2007). Whey protein soluble aggregates from heating with NaCl:
physicochemical, interfacial, and foaming properties. Langmuir, 23(8), 4155-
4166.
Schmitt, C., & others., a. (2007). Whey protein soluble aggregates from heating with
NaCl: physicochemical, interfacial, and foaming properties. Langmuir, 23(8),
4155-4166.
Schokker, E., Singh, H., Pinder, D., & Creamer, L. (2000). Heat-induced aggregation of
β-lactoglobulin AB at pH 2.5 as influenced by ionic strength and protein
concentration. International Dairy Journal, 10(4), 233-240.
Semenova, M. G., Antipova, A. S., & Belyakova, L. E. (2002). Food protein interactions
in sugar solutions. Current Opinion in Colloid & Interface Science, 7(5), 438-444.
Shimada, K., & Cheftel, J. C. (1989). Sulfhydryl group/disulfide bond interchange
reactions during heat-induced gelation of whey protein isolate. Journal of
Agricultural and Food Chemistry, 37(1), 161-168.
45
Sun, Y., Hayakawa, S., & Izumori, K. (2004). Modification of ovalbumin with a rare
ketohexose through the Maillard reaction: effect on protein structure and gel
properties. Journal of Agricultural and Food Chemistry, 52(5), 1293-1299.
Tang, C.-H., Chen, Z., Li, L., & Yang, X.-Q. (2006). Effects of transglutaminase
treatment on the thermal properties of soy protein isolates. Food Research
International, 39(6), 704-711.
Tang, C.-H., & Jiang, Y. (2007). Modulation of mechanical and surface hydrophobic
properties of food protein films by transglutaminase treatment. Food Research
International, 40(4), 504-509.
Tang, C.-H., & Ma, C.-Y. (2007). Modulation of the thermal stability of β-lactoglobulin
by transglutaminase treatment. European Food Research and Technology, 225(5-
6), 649-652.
Tang, C., Sun, X., & Foegeding, E. A. (2011). Modulation of Physicochemical and
Conformational Properties of Kidney Bean Vicilin (Phaseolin) by Glycation with
Glucose: Implications for Structure–Function Relationships of Legume Vicilins.
Journal of Agricultural and Food Chemistry, 59(18), 10114-10123.
Tang, C., Yang, X., Chen, Z., Wu, H., & Peng, Z. (2005). Physicochemical and structural
characteristics of sodium caseinate biopolymers induced by microbial
transglutaminase. Journal of Food Biochemistry, 29(4), 402-421.
Tang, X. C., Pikal, M. J., & Taylor, L. S. (2002). The effect of temperature on hydrogen
bonding in crystalline and amorphous phases in dihydropyrine calcium channel
blockers. Pharmaceutical Research, 19(4), 484-490.
Thompson, A., Boland, M., & Singh, H. (2009). Milk Proteins: From Expression to
Food: Access Online via Elsevier.
Tran Le, T., Sabatino, P., Heyman, B., Kasinos, M., Dinh, H. H., Dewettinck, K.,
Martins, J., & Van Der Meeren, P. (2011). Improved heat stability by whey
protein–surfactant interaction. Food Hydrocolloids, 25(4), 594-603.
Truong, V.-D., Clare, D. A., Catignani, G. L., & Swaisgood, H. E. (2004). Cross-linking
and rheological changes of whey proteins treated with microbial transglutaminase.
Journal of Agricultural and Food Chemistry, 52(5), 1170-1176.
Van Boekel, M. (2001). Kinetic aspects of the Maillard reaction: a critical review.
Food/Nahrung, 45(3), 150-159.
Vardhanabhuti, B., & Foegeding, E. A. (1999). Rheological properties and
characterization of polymerized whey protein isolates. Journal of Agricultural
and Food Chemistry, 47(9), 3649-3655.
Verheul, M., Roefs, S. P., & de Kruif, K. G. (1998). Kinetics of heat-induced aggregation
of β-lactoglobulin. Journal of Agricultural and Food Chemistry, 46(3), 896-903.
Walstra, P. (2002). Physical Chemistry of Foods (Vol. 121): CRC Press.
Wang, Q., & Ismail, B. (2012). Effect of Maillard-induced glycosylation on the
nutritional quality, solubility, thermal stability and molecular Configuration of
whey protein. International Dairy Journal.
Yildirim, M., Hettiarachchy, N., & Kalapathy, U. (1996). Properties of Biopolymers from
Cross‐linking Whey Protein Isolate and Soybean 11S Globulin. Journal of Food
Science, 61(6), 1129-1132.
46
Yokoyama, K., Nio, N., & Kikuchi, Y. (2004). Properties and applications of microbial
transglutaminase. Applied Microbiology and Biotechnology, 64(4), 447-454.
Yong, Y. H., & Foegeding, E. A. (2008). Effects of caseins on thermal stability of bovine
β-lactoglobulin. Journal of Agricultural and Food Chemistry, 56(21), 10352-
10358.
Zhang, W., & Zhong, Q. (2010). Microemulsions as nanoreactors to produce whey
protein nanoparticles with enhanced heat stability by thermal pretreatment. Food
Chemistry, 119(4), 1318-1325.
Zhu, H., & Damodaran, S. (1994). Heat-induced conformational changes in whey protein
isolate and its relation to foaming properties. Journal of Agricultural and Food
Chemistry, 42(4), 846-855.
Zuniga, R., Tolkach, A., Kulozik, U., & Aguilera, J. (2010). Kinetics of Formation and
Physicochemical Characterization of Thermally-Induced β-Lactoglobulin
Aggregates. Journal of Food Science, 75(5), E261-E268.
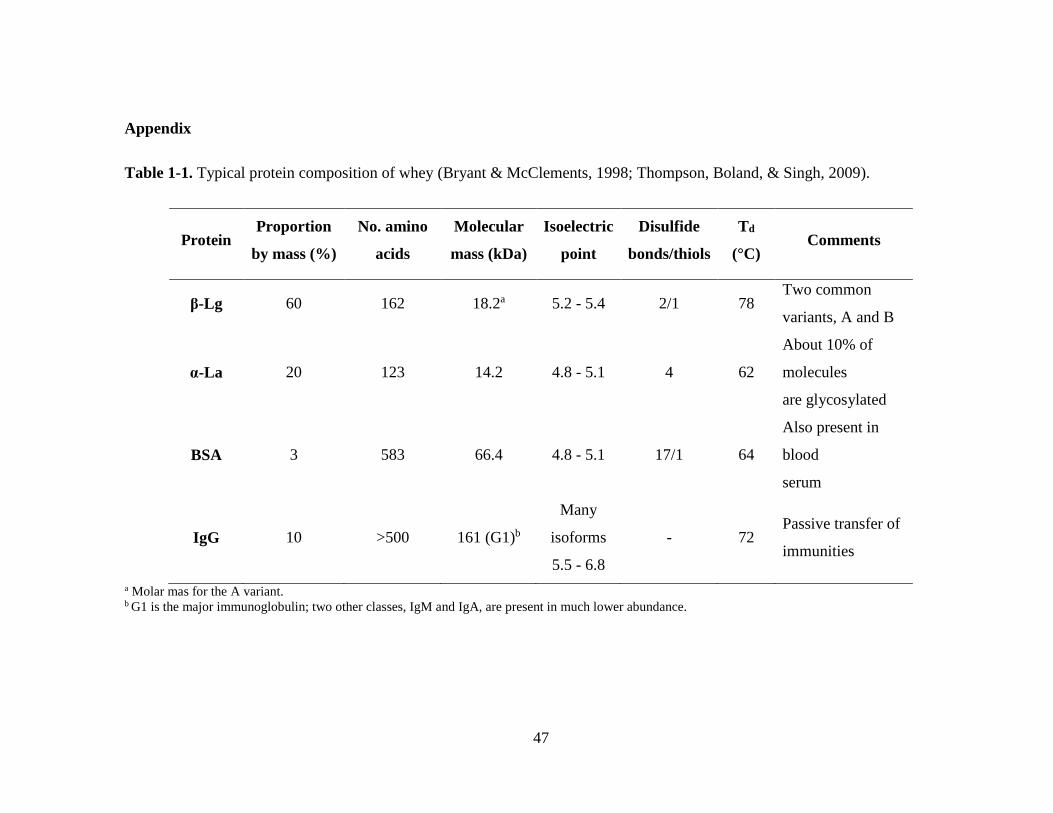
47
Appendix
Table 1-1. Typical protein composition of whey (Bryant & McClements, 1998; Thompson, Boland, & Singh, 2009).
Protein Proportion
by mass (%)
No. amino
acids
Molecular
mass (kDa)
Isoelectric
point
Disulfide
bonds/thiols
Td
(°C) Comments
β-Lg 60 162 18.2a 5.2 - 5.4 2/1 78 Two common
variants, A and B
α-La 20 123 14.2 4.8 - 5.1 4 62
About 10% of
molecules
are glycosylated
BSA 3 583 66.4 4.8 - 5.1 17/1 64
Also present in
blood
serum
IgG 10 >500 161 (G1)b
Many
isoforms
5.5 - 6.8
- 72 Passive transfer of
immunities
a Molar mas for the A variant. b G1 is the major immunoglobulin; two other classes, IgM and IgA, are present in much lower abundance.
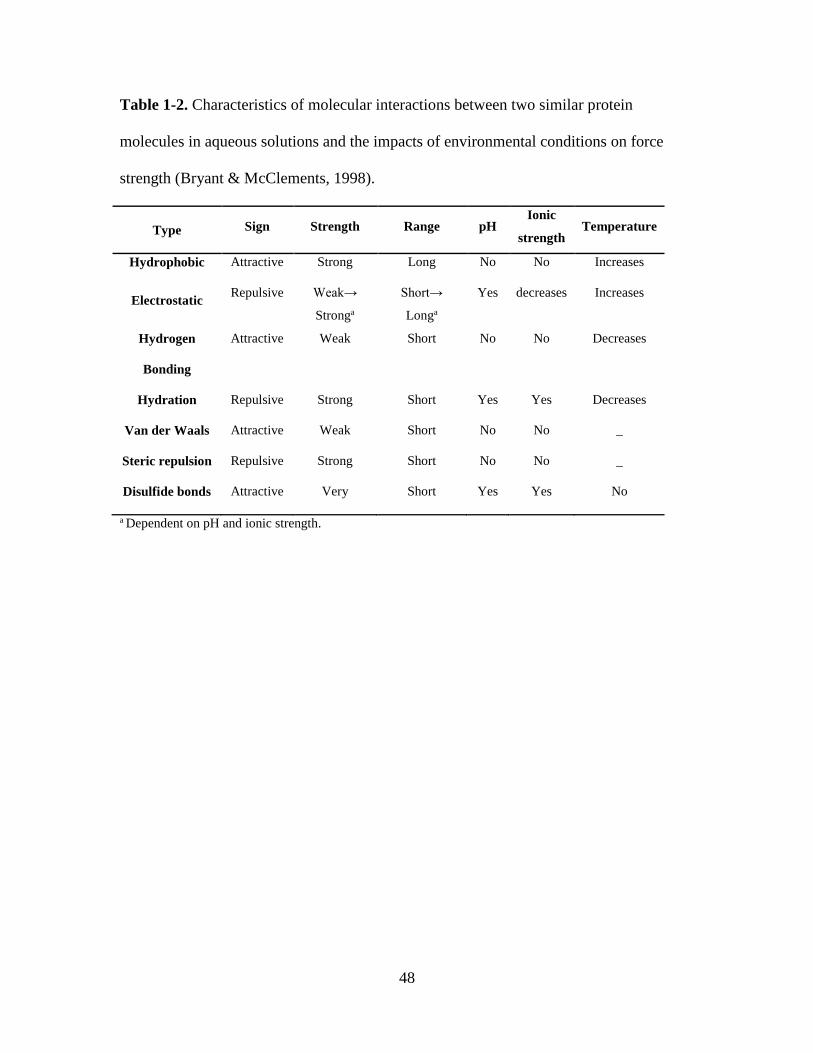
48
Table 1-2. Characteristics of molecular interactions between two similar protein
molecules in aqueous solutions and the impacts of environmental conditions on force
strength (Bryant & McClements, 1998).
Type Sign Strength Range pH Ionic
strength Temperature
Hydrophobic Attractive Strong Long No No Increases
Electrostatic Repulsive Weak→
Stronga
Short→
Longa
Yes decreases Increases
Hydrogen
Bonding
Attractive Weak Short No No Decreases
Hydration Repulsive Strong Short Yes Yes Decreases
Van der Waals Attractive Weak Short No No _
Steric repulsion Repulsive Strong Short No No _
Disulfide bonds Attractive Very Short Yes Yes No
a Dependent on pH and ionic strength.
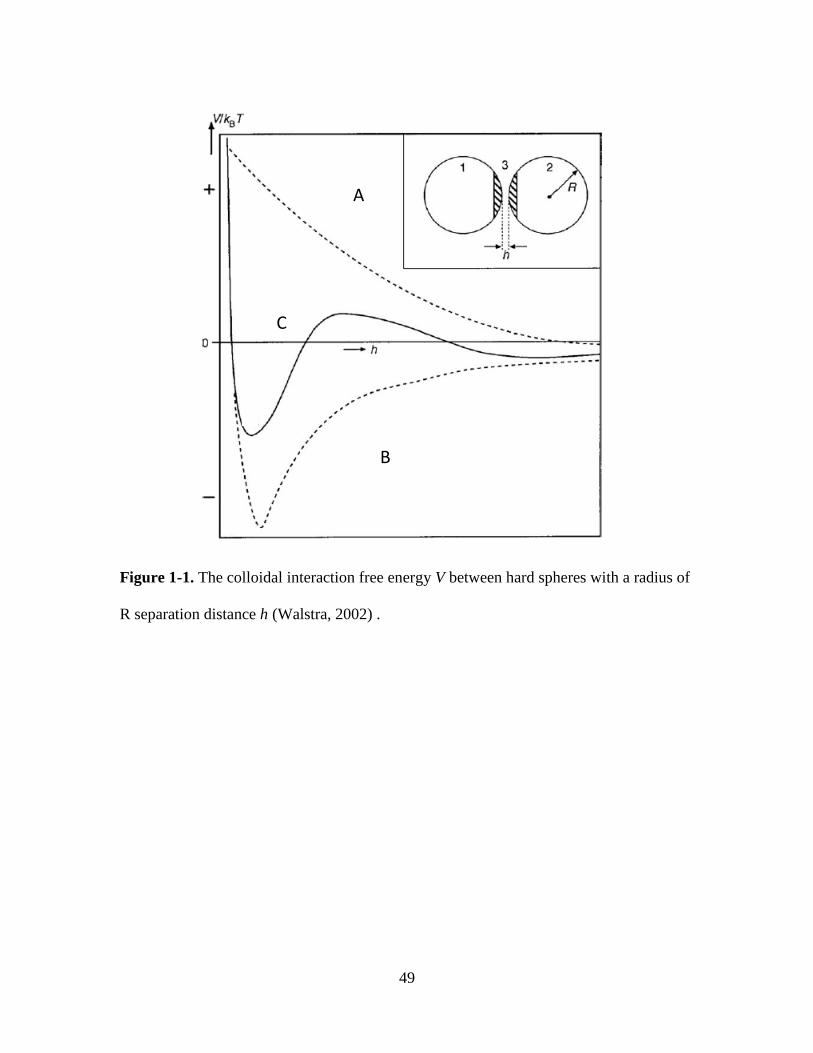
49
A
B
C
Figure 1-1. The colloidal interaction free energy V between hard spheres with a radius of
R separation distance h (Walstra, 2002) .
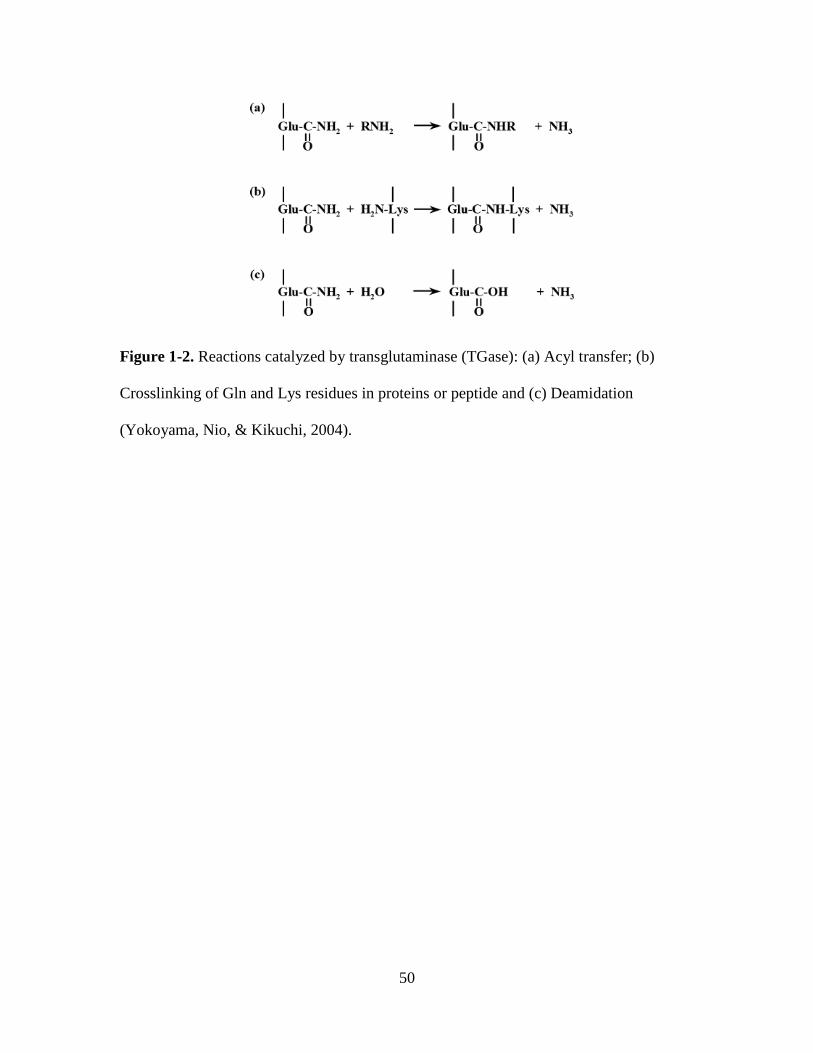
50
Figure 1-2. Reactions catalyzed by transglutaminase (TGase): (a) Acyl transfer; (b)
Crosslinking of Gln and Lys residues in proteins or peptide and (c) Deamidation
(Yokoyama, Nio, & Kikuchi, 2004).
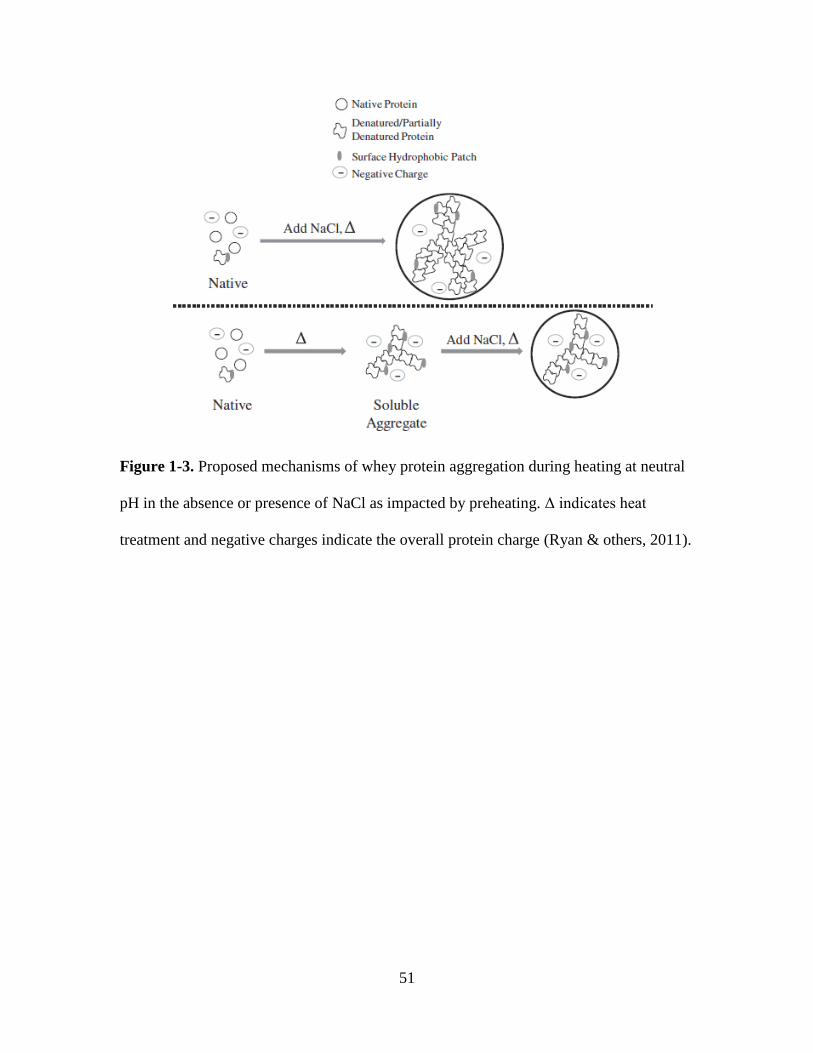
51
Figure 1-3. Proposed mechanisms of whey protein aggregation during heating at neutral
pH in the absence or presence of NaCl as impacted by preheating. Δ indicates heat
treatment and negative charges indicate the overall protein charge (Ryan & others, 2011).
52
Chapter 2. Nanoscale Understanding of Thermal
Aggregation of Whey Proteins Pretreated by
Transglutaminase
53
2.1 Abstract
Nanoscale structures of whey protein isolate (WPI) pretreated by microbial
transglutaminase (mTGase) and subsequent heating were studied in this work and were
correlated to zeta-potential, surface hydrophobicity, thermal denaturation properties, and
macroscopic turbidity and viscosity. Dispersions of 5% w/v WPI were pretreated by
individual or sequential steps of preheating at 80 C for 15 min and mTGase, used at 22-
110 U/g-WPI for 1-15 h, before adjusting to pH 7.0 and 0-100 mM NaCl for heating at
80 C for 15 and 90 min. Zeta-potential and surface hydrophobicity of WPI increased
after all pretreatment steps. Preheating increased cross-linking reactivity of WPI by
mTGase, corresponding to significantly increased denaturation temperature. Particle size
analysis and atomic force microscopy revealed that structures of sequentially-pretreated
WPI remained stable after heating at 100 mM NaCl, corresponding to transparent
dispersions. Conversely, WPI pretreated by one step only aggregated at 100 mM NaCl
and resulted in turbid dispersions. The present study provides both physical chemical and
structural information, which are essential for better understanding the mechanisms of
WPI aggregation at neutral pH and offers a feasible way for food industrial applications
of WPI as the major composition.
Keywords: whey protein, thermal aggregation, enzymatic cross-linking, rheology,
nanostructure, surface properties
54
2.2 Introduction
Whey proteins are among the most studied biopolymers because of their
properties to form emulsions and nanoemulsions (Lee, Choi, Li, Decker, & McClements,
2011), nanofibers (Loveday, Su, Rao, Anema, & Singh, 2011), hydrogels (Betz,
Hörmansperger, Fuchs, & Ulrich Kulozik, 2012), and nanostructures for delivering
nutraceuticals and pharmaceuticals (Chen & Subirade, 2005, 2006). Cheese whey is the
major source for commercial production of whey protein ingredients, and whey protein
isolates (WPI) refer to products purified to a protein content higher than 90%. WPI are
composed of a mixture with -lactoglobulin, -lactalbumin, and bovine serum albumin
being the major components (Foegeding, Davis, Doucet, & McGuffey, 2002). WPI have
been used to fabricate a variety of structures by engineering their aggregation induced by
acidity, electrolytes and temperatures (Bryant & McClements, 1998; Foegeding, Davis,
Doucet, & McGuffey, 2002). Particularly, heating is a common approach to form fibrillar
or particulate aggregates of whey proteins by controlling repulsive and attractive
intra/intermolecular physical forces such as electrostatic interactions, hydrophobic
interactions, and hydrogen bonding and intra- and intermolecular disulfide bonds via
sulfhydryl-disulfide interchange (Bryant & McClements, 1998). The property of concern
in the present study is the dispersibility after heating whey proteins. In a concentrated
dispersion, thermal aggregation of whey protein into a three-dimension network is
important to the formation of hydrogels but is problematic for systems requiring the
maintained fluidity and low viscosity. Furthermore, because micrometer-sized structures
deflect light to cause turbidity and precipitate during storage, fabricating nanostructures
55
of whey proteins after thermal processing is needed to maintain the visual transparency of
dispersions, commonly referred as heat stability.
Thermal aggregation of native whey protein at neutral pH has been well-studied
(Bryant & McClements, 1998). At low ionic strength, WPI dispersions typically remain
transparent after heating because the strong repulsive electrostatic interactions correspond
to reaction-limited aggregation and the formed fibril structures are too small to reflect
visible light. At high ionic strength, the shortened Debye length favors protein
aggregation that is diffusion-limited, forming particulates that results in turbid
dispersions or gels. Reducing thermal aggregation of whey proteins has been studied after
incorporation of small molecule co-solutes such as sucrose (Baier & McClements, 2001;
Kulmyrzaev, Bryant, & McClements, 2000), glycerol (Chanasattru, Decker, &
McClements, 2007; Chantrapornchai & McClements, 2002), and sorbitol (Chanasattru,
Decker, & McClements, 2007), or chaperones (Yong & Foegeding, 2008). These
compounds increase denaturation temperatures of whey proteins. However, it remains a
challenge to maintain dispersion transparency after heating at neutral pH and increased
ionic strength. We recently applied microemulsions as templates to produce whey protein
nanoparticles by preheating, with and without prior pretreatment by microbial
transglutaminase (mTGase), and observed that nanoparticles had much improved heat
stability at 100 mM NaCl (Zhang & Zhong, 2009; Zhang & Zhong, 2010). However, the
capacity of producing nanoparticles in microemulsions is limited and is an obstacle for
practical applications.
TGase (EC 2.3.2.13, protein-glutamine γ-glutamyltransferase) catalyzes the
crosslinking reaction between protein molecules through acyl transfer reactions to form
56
inter- or intramolecular ε-(γ-glutamyl)lysine isopeptidic bonds (Jaros, Partschefeld,
Henle, & Rohm, 2006). Although the enzyme is commonly used to cross-link proteins to
strengthen gel networks, mTGase has been reported to improve the heat stability of whey
protein (Jaros, Partschefeld, Henle, & Rohm, 2006). The study on the specificity of
mTGase inducing protein cross-linking varied with the type of proteins. β-lactoglobulin,
the major type of proteins in WPI, can be significantly cross-linked by mTGase after
preheating, whereas no prerequisite of heating for α-lactalbumin which is another type of
proteins in WPI (Rodriguez-Nogales, 2006). The direct treatment of WPI by mTGase was
observed to increase thermal denaturation temperature of whey proteins (Agyare &
Damodaran, 2010). The reasonable explanation of the increase of denaturation
temperature was attributed to covalent cross-linking without any major structural change,
however, the cross-linked protein exhibited maximum turbidity at pH 4.0-4.5, indicating
that the pI was shifted (Agyare & Damodaran, 2010). The 5% -lactoglobulin (Tanimoto
& Kinsella, 1988) and WPI solutions reduced by 10 mM dithiothreitol (DTT) (Truong,
Clare, Catignani, & Swaisgood, 2004) no longer formed gels at pH 7.5 after extensive
cross-linking by mTGase. Intra- and intermolecular bonds formed by mTGase were
proposed to impact the unfolding of whey proteins during heating (Truong, Clare,
Catignani, & Swaisgood, 2004). Tanimoto and Kinsella (Tanimoto & Kinsella, 1988)
separated -lactoglobulin, with prior reduction by DTT and addition of CaCl2 and cross-
linking by guinea pig liver TGase, into two fractions based on molecular weight (MW)
and evaluated the stability of fractions constituted to 5% protein by heating at 90 C for
30 min. The fraction bigger than 100 kDa was stable, but a soft gel was observed for the
other smaller MW fraction. Moderate mTGase pretreatment conditions (10 U/g-protein,
57
6-9 h at 37C and pH 7.4) were observed to reduce the heat stability of -lactoglobulin
(Tang & Ma, 2007), but mTGase cross-linking for 23 h or longer improved the heat
stability, at which conditions the prior denaturation by DTT was not required (Tang &
Ma, 2007). Despite these related studies, much work is needed to technologically
improve the heat stability of WPI solutions with 5% or more protein, at neutral acidity
and increased NaCl concentration, and without using toxic DTT. Scientifically, the
formation of supramolecular structures of whey proteins as impacted by mTGase
pretreatment is to be studied and interpreted by integration with information of protein
denaturation properties and colloidal chemistry.
The objective of this work was to study thermal aggregation of WPI after being
pretreated by mTGase at different enzyme levels and durations, with and without prior
preheating. Preheating was studied because of the improvement in reactivity of whey
protein as a substrate for mTGase (Rodriguez-Nogales, 2006a, 2006b). Physicochemical
changes were interpreted using several complimentary techniques illustrating rheological,
surface-charge, and thermal denaturation properties of whey proteins, as well as
supramolecular structures studied using particle size measurements by dynamic light
scattering (DLS) and atomic force microscopy (AFM).
2.3 Materials and Methods
2.3.1 Materials
The WPI was a product from Hilmar Ingredients (Hilmar, CA). The powdered
mTGase sample (product Activa TG-TI) was a gift from Ajinomoto Food Ingredients
58
LLC (Chicago, IL). Other chemicals were purchased from Fisher Scientific (Pittsburgh,
PA).
2.3.2 Determination of mTGase activity
The freshly-prepared mTGase solution was quantified for activity using the
literature method (Folk & Cole, 1966), with modification of pH and temperature. One
unit (U) of activity was defined as the grams of powdered enzyme able to produce 1
mol of hydroxamate per min at pH 7.0 and 50 °C when substrates of N-carbobenzoxy-
glutaminyl-glycine and hydroxylamine were catalyzed by the enzyme.
2.3.3 Pretreatment protocol
The WPI powder was hydrated at 5% w/v in 20 mL of a 50 mM sodium
phosphate buffer overnight at room temperature (21 C). For sequential pretreatments of
preheating and enzymatic cross-linking, samples were adjusted to pH 7.5 using 1 N
NaOH and preheated for 15 min in a water bath maintained at 80 C, followed by cooling
immediately in a room temperature water bath. The mTGase powder was dissolved at 2,
5, and 10% mass of WPI. If necessary, the pH was readjusted to 7.5 (Truong, Clare,
Catignani, & Swaisgood, 2004) before incubation in a 50 C shaking water bath for 1-15
h. After immersion in a room-temperature water bath, samples were adjusted to pH 7.0
and 2.0 mL of solution was transferred into 4.0 mL vials. The vials were supplemented
with 0, 20, or 40 L of a 5.0 M NaCl solution (in distilled water), corresponding to a final
NaCl concentration of 0, 50, and 100 mM.
59
To compare with sequentially-pretreated samples, a set of samples were prepared
by heating the pH 7.5 solutions at 80 C for 15 min only, while another set of samples
were directly pretreated by dissolving the enzyme powder in the pH 7.5 solutions,
followed by incubation at 50 C for cross-linking. These samples were adjusted to pH 7.0
and NaCl concentrations as above. The control without pretreatment was the 5% w/v
WPI solution directly adjusted to pH 7.0 and 0, 50, and 100 mM NaCl.
2.3.4 Evaluation of heat stability
The vials prepared as above were heated for 15 min in a water bath pre-
equilibrated to 80 C. After cooling to room temperature in a water bath, the vials were
compared for visual appearance by photographing or for absorbance acquired at 400 and
600 nm using a UV/Vis spectrophotometer (model Biomate 5, Thermo Electron
Corporation, Woburn, MA).
2.3.5 Differential scanning calorimetry (DSC)
Thermal denaturatation properties of WPI after different pretreatments were
studied using a differential scanning calorimeter (VP-DSC, MicroCal, Northamption,
MA). The WPI dispersions after different pretreatments were diluted to 2% w/v using the
pH 7.0 phosphate buffer. Samples were degassed at 20 °C for 10 min before injection
into the sample cell, with deionized water used as a reference. The scanning was
conducted from 25 to 105 °C at a rate of 1.0 °C/min. The total calorimetric apparent
enthalpy change (ΔH) and the denaturation temperature (Td) were determined via analysis
of the thermographs, which was performed by using two-state model (supplied by
MicroCal).
60
2.3.6 Surface hydrophobicity
Surface hydrophobicity of WPI was determined using fluorescence probe 1-
anilino-8-naphtalene-sulphonate (ANS) according to a literature method (Alizadeh-
Pasdar & Li-Chan, 2000), with modification. Each sample was diluted to 5
concentrations from 0.005 to 0.2% w/v using a 10 mM phosphate buffer at pH 7.0. The
ANS solution was prepared at 8 mM in the same buffer. Ten µL ANS solution was added
to 2 mL of each protein solution. The fluorescence intensity was measured at excitation
wavelength of 365 nm and emission wavelength of 484 nm using a RF-1501
spectrofluorometer (Shimadzu Corp., Tokyo, Japan). The background fluorescence was
calibrated using distilled water. Surface hydrophobicity was calculated by linear
regression analysis, using the initial slope of the fluorescence intensity-protein
concentration plots as an index of surface hydrophobicity (S0).
2.3.7 Particle size analysis (DLS)
The native WPI dispersion with 50 mM sodium phosphate and 100 mM NaCl
formed a gel after heating at 80 °C for 15 min. To overcome this difficulty, this 5% w/v
WPI dispersion was prepared without sodium phosphate but with 100 mM NaCl to
produce a flowable sample after heating. Other samples were prepared as in the
pretreatment protocol and adjusted to 100 mM NaCl. Protein dispersions before and after
heating at 80 °C for 15 min were measured using a DelsaTM Nano particle size/zeta
potential analyzer from Beckman Coulter, Inc. (Brea, CA). The volume-length mean
particle diameter was calculated using eq 1.
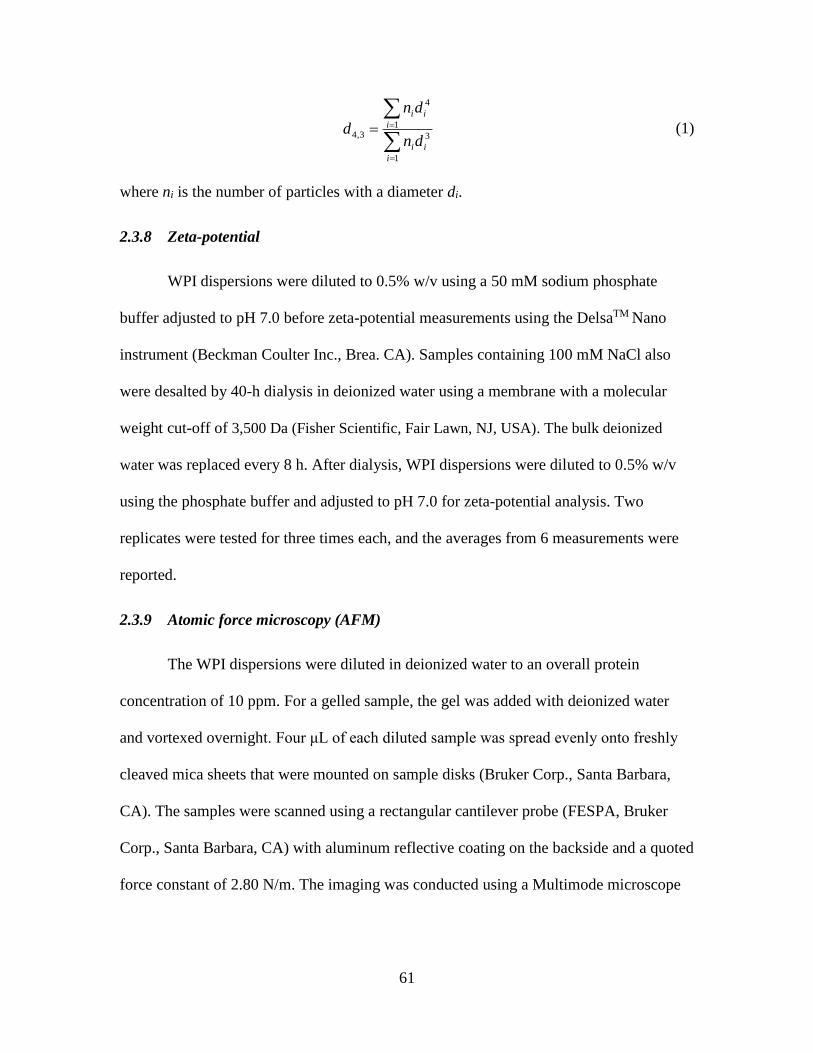
61
1
3
1
4
3,4
i
ii
i
ii
dn
dn
d (1)
where ni is the number of particles with a diameter di.
2.3.8 Zeta-potential
WPI dispersions were diluted to 0.5% w/v using a 50 mM sodium phosphate
buffer adjusted to pH 7.0 before zeta-potential measurements using the DelsaTM Nano
instrument (Beckman Coulter Inc., Brea. CA). Samples containing 100 mM NaCl also
were desalted by 40-h dialysis in deionized water using a membrane with a molecular
weight cut-off of 3,500 Da (Fisher Scientific, Fair Lawn, NJ, USA). The bulk deionized
water was replaced every 8 h. After dialysis, WPI dispersions were diluted to 0.5% w/v
using the phosphate buffer and adjusted to pH 7.0 for zeta-potential analysis. Two
replicates were tested for three times each, and the averages from 6 measurements were
reported.
2.3.9 Atomic force microscopy (AFM)
The WPI dispersions were diluted in deionized water to an overall protein
concentration of 10 ppm. For a gelled sample, the gel was added with deionized water
and vortexed overnight. Four μL of each diluted sample was spread evenly onto freshly
cleaved mica sheets that were mounted on sample disks (Bruker Corp., Santa Barbara,
CA). The samples were scanned using a rectangular cantilever probe (FESPA, Bruker
Corp., Santa Barbara, CA) with aluminum reflective coating on the backside and a quoted
force constant of 2.80 N/m. The imaging was conducted using a Multimode microscope
62
(Veeco Instruments, Inc., Plainview, NY) operated using the tapping mode. Both height
and phase images with a preset scan area of 55 or 22 μm were generated. Height
images were used to measure heights of individual particles using the instrument software
and the averages of particle heights were reported.
2.3.10 Rheology
Fifteen mL samples were contained in 20 mL vials and pretreated using the above
protocols. After heating at 80 C for 15 min, samples were transferred into the sample
cup of a Searle setup (bob outer diameter = 28 mm and cup inner diameter = 30 mm) of
an AR2000 rheometer (TA Instruments, New Castle, DE). Shear rate ramps were
performed from 0.1 to 1000 s-1 at 20 C.
2.3.11 Statistical analysis
Results were presented as averages and standard deviations from replicates. All
statistical analyses were performed using SAS software (version 9.2, SAS Institute, Cary,
NC). A two-way analysis of variance (ANOVA) was carried out to test significance
between treatments. Statistical differences among comparable data points for various
treatments were calculated by post-hoc comparison of means according to the least-
significant-difference (LSD) mean separation method at a p level of 0.05.
2.4 Results and Discussion
The mTGase activity was measured to be 102.1 U/g powder. The levels of
mTGase were thus 2.0, 5.1, and 10.2 U/g-WPI when the mTGase powder was used at 2,
63
5, and 10% mass of WPI. Absorbance values at 400 and 600 nm for heated samples
followed similar trends after pretreatment at various conditions. The absorbance at 600
nm was smaller than that at 400 nm, and only the results at 400 nm are presented here.
The results are first presented for heat stability in two groups for samples with and
without preheating, followed by properties probed by DLS, AFM, zeta potential, surface
hydrophobicity, DSC, and rheology.
2.4.1 Heat stability of samples pretreated by mTGase without preheating
Heat stability was compared for absorbance because bigger structures formed
during thermal treatment cause higher absorbance/turbidity. Samples pretreated by three
levels of mTGase without preheating were heated at 80 C for 15 min, and the
absorbance values are shown in Figure 2-1A, B, and C for pH 7.0 samples at 0, 50, and
100 mM NaCl, respectively. A higher level of mTGase and a longer treatment time
generally resulted in a lower absorbance value. Samples at 0 mM NaCl were all clear
after heating, corresponding to an absorbance value lower than 0.45 at 400 nm (Figure 2-
1A) and below 0.1 at 600 nm (not shown). The heat stability of WPI at a low ionic
strength and neutral pH is well-known, due to strong electrostatic repulsion (Bryant &
McClements, 1998). At 50 mM NaCl, samples pretreated by mTGase to a greater extent
had lower absorbance (Figure 2-1B), consistent with improved visual clarity of
dispersions. At 100 mM NaCl, the control sample and the sample treated with the least
amount of mTGase for the shortest duration (at 2.0 U/g-WPI for 1 h, Figure 2-1C)
formed gels after heating, while other samples were fluidic, with improved clarity after
being pretreated by a higher level of mTGase for a longer time. The statistical analysis
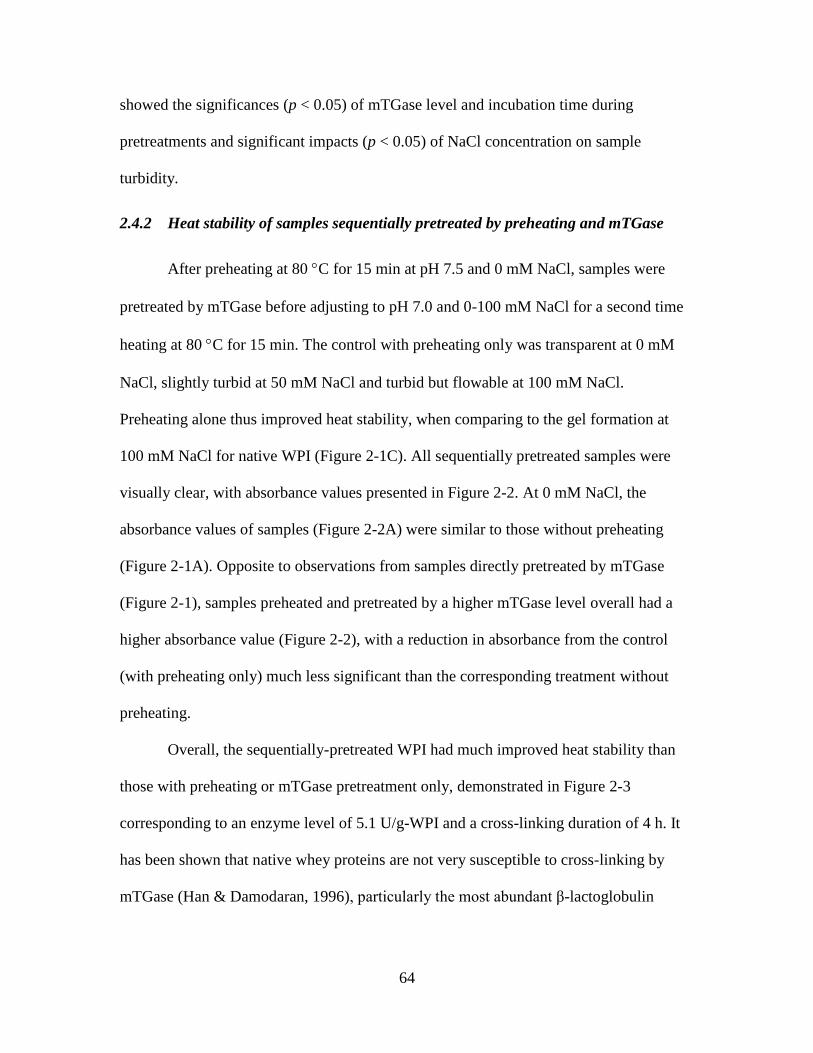
64
showed the significances (p < 0.05) of mTGase level and incubation time during
pretreatments and significant impacts (p < 0.05) of NaCl concentration on sample
turbidity.
2.4.2 Heat stability of samples sequentially pretreated by preheating and mTGase
After preheating at 80 C for 15 min at pH 7.5 and 0 mM NaCl, samples were
pretreated by mTGase before adjusting to pH 7.0 and 0-100 mM NaCl for a second time
heating at 80 C for 15 min. The control with preheating only was transparent at 0 mM
NaCl, slightly turbid at 50 mM NaCl and turbid but flowable at 100 mM NaCl.
Preheating alone thus improved heat stability, when comparing to the gel formation at
100 mM NaCl for native WPI (Figure 2-1C). All sequentially pretreated samples were
visually clear, with absorbance values presented in Figure 2-2. At 0 mM NaCl, the
absorbance values of samples (Figure 2-2A) were similar to those without preheating
(Figure 2-1A). Opposite to observations from samples directly pretreated by mTGase
(Figure 2-1), samples preheated and pretreated by a higher mTGase level overall had a
higher absorbance value (Figure 2-2), with a reduction in absorbance from the control
(with preheating only) much less significant than the corresponding treatment without
preheating.
Overall, the sequentially-pretreated WPI had much improved heat stability than
those with preheating or mTGase pretreatment only, demonstrated in Figure 2-3
corresponding to an enzyme level of 5.1 U/g-WPI and a cross-linking duration of 4 h. It
has been shown that native whey proteins are not very susceptible to cross-linking by
mTGase (Han & Damodaran, 1996), particularly the most abundant β-lactoglobulin
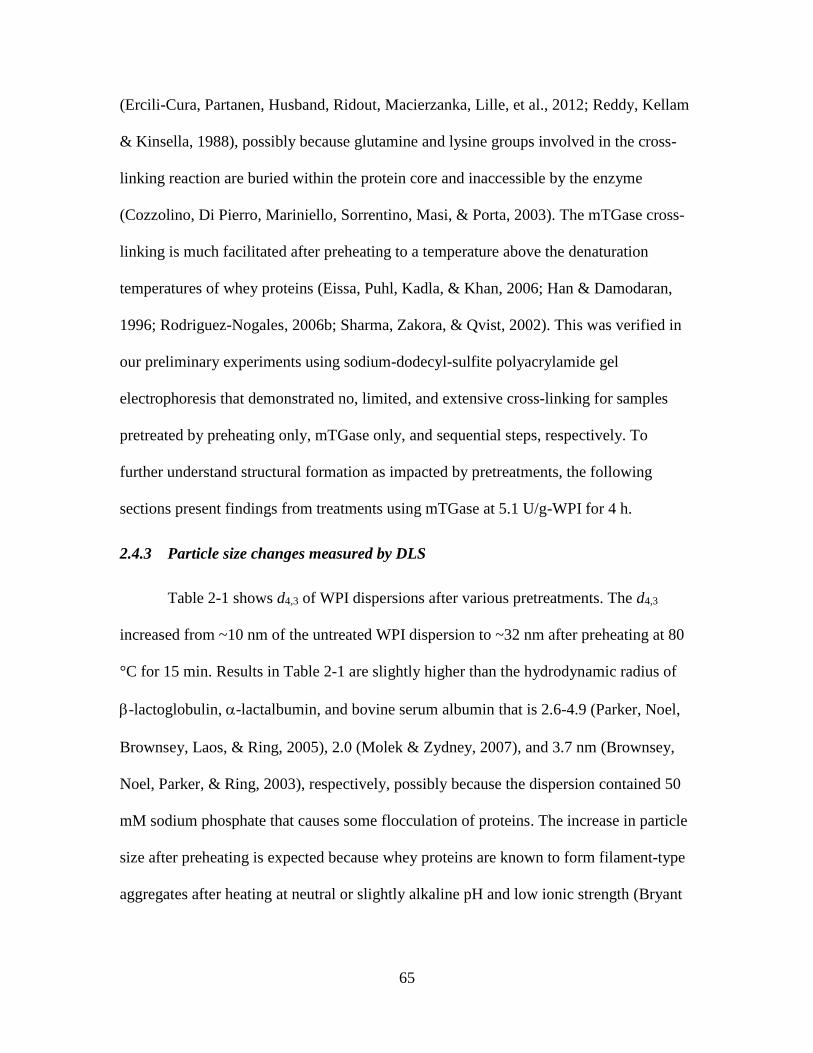
65
(Ercili-Cura, Partanen, Husband, Ridout, Macierzanka, Lille, et al., 2012; Reddy, Kellam
& Kinsella, 1988), possibly because glutamine and lysine groups involved in the cross-
linking reaction are buried within the protein core and inaccessible by the enzyme
(Cozzolino, Di Pierro, Mariniello, Sorrentino, Masi, & Porta, 2003). The mTGase cross-
linking is much facilitated after preheating to a temperature above the denaturation
temperatures of whey proteins (Eissa, Puhl, Kadla, & Khan, 2006; Han & Damodaran,
1996; Rodriguez-Nogales, 2006b; Sharma, Zakora, & Qvist, 2002). This was verified in
our preliminary experiments using sodium-dodecyl-sulfite polyacrylamide gel
electrophoresis that demonstrated no, limited, and extensive cross-linking for samples
pretreated by preheating only, mTGase only, and sequential steps, respectively. To
further understand structural formation as impacted by pretreatments, the following
sections present findings from treatments using mTGase at 5.1 U/g-WPI for 4 h.
2.4.3 Particle size changes measured by DLS
Table 2-1 shows d4,3 of WPI dispersions after various pretreatments. The d4,3
increased from ~10 nm of the untreated WPI dispersion to ~32 nm after preheating at 80
°C for 15 min. Results in Table 2-1 are slightly higher than the hydrodynamic radius of
-lactoglobulin, -lactalbumin, and bovine serum albumin that is 2.6-4.9 (Parker, Noel,
Brownsey, Laos, & Ring, 2005), 2.0 (Molek & Zydney, 2007), and 3.7 nm (Brownsey,
Noel, Parker, & Ring, 2003), respectively, possibly because the dispersion contained 50
mM sodium phosphate that causes some flocculation of proteins. The increase in particle
size after preheating is expected because whey proteins are known to form filament-type
aggregates after heating at neutral or slightly alkaline pH and low ionic strength (Bryant
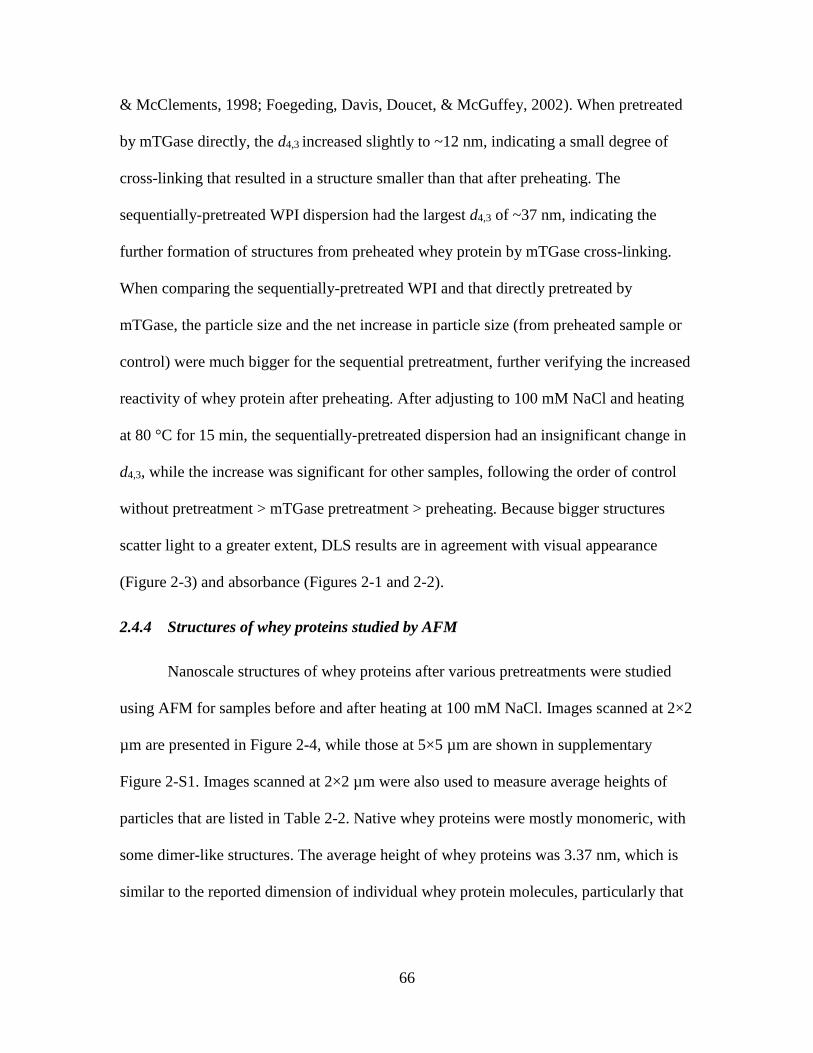
66
& McClements, 1998; Foegeding, Davis, Doucet, & McGuffey, 2002). When pretreated
by mTGase directly, the d4,3 increased slightly to ~12 nm, indicating a small degree of
cross-linking that resulted in a structure smaller than that after preheating. The
sequentially-pretreated WPI dispersion had the largest d4,3 of ~37 nm, indicating the
further formation of structures from preheated whey protein by mTGase cross-linking.
When comparing the sequentially-pretreated WPI and that directly pretreated by
mTGase, the particle size and the net increase in particle size (from preheated sample or
control) were much bigger for the sequential pretreatment, further verifying the increased
reactivity of whey protein after preheating. After adjusting to 100 mM NaCl and heating
at 80 °C for 15 min, the sequentially-pretreated dispersion had an insignificant change in
d4,3, while the increase was significant for other samples, following the order of control
without pretreatment > mTGase pretreatment > preheating. Because bigger structures
scatter light to a greater extent, DLS results are in agreement with visual appearance
(Figure 2-3) and absorbance (Figures 2-1 and 2-2).
2.4.4 Structures of whey proteins studied by AFM
Nanoscale structures of whey proteins after various pretreatments were studied
using AFM for samples before and after heating at 100 mM NaCl. Images scanned at 2×2
µm are presented in Figure 2-4, while those at 5×5 µm are shown in supplementary
Figure 2-S1. Images scanned at 2×2 µm were also used to measure average heights of
particles that are listed in Table 2-2. Native whey proteins were mostly monomeric, with
some dimer-like structures. The average height of whey proteins was 3.37 nm, which is
similar to the reported dimension of individual whey protein molecules, particularly that
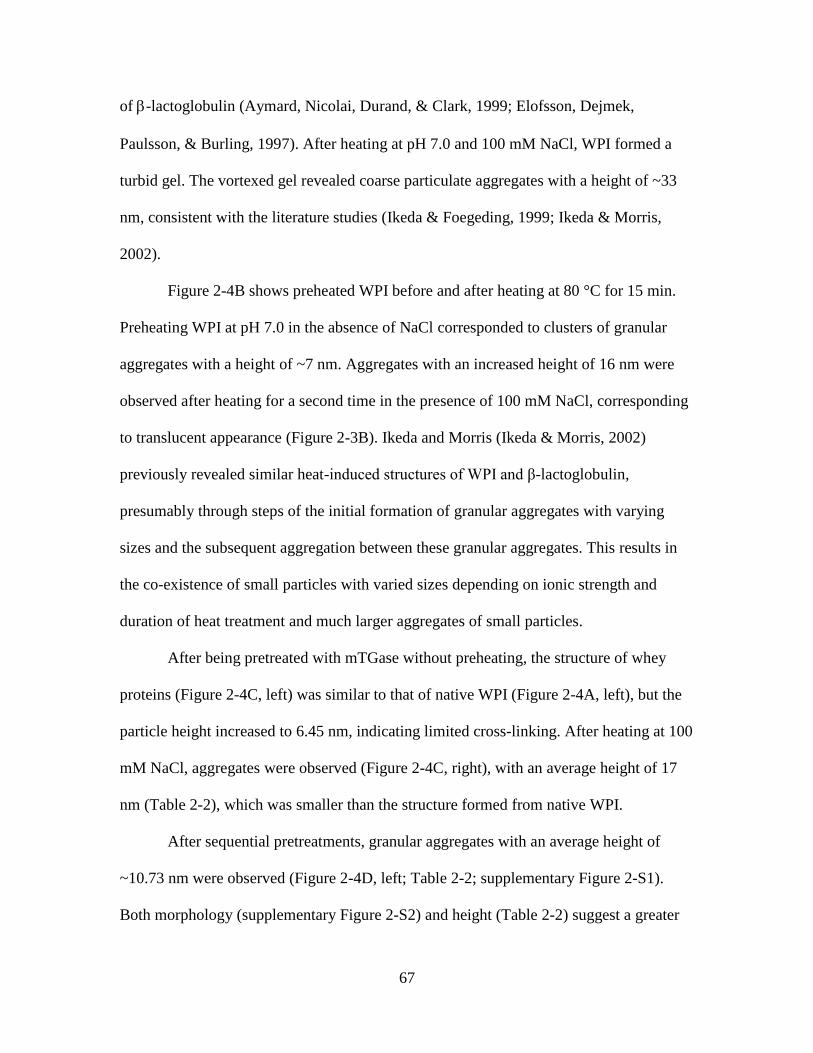
67
of -lactoglobulin (Aymard, Nicolai, Durand, & Clark, 1999; Elofsson, Dejmek,
Paulsson, & Burling, 1997). After heating at pH 7.0 and 100 mM NaCl, WPI formed a
turbid gel. The vortexed gel revealed coarse particulate aggregates with a height of ~33
nm, consistent with the literature studies (Ikeda & Foegeding, 1999; Ikeda & Morris,
2002).
Figure 2-4B shows preheated WPI before and after heating at 80 °C for 15 min.
Preheating WPI at pH 7.0 in the absence of NaCl corresponded to clusters of granular
aggregates with a height of ~7 nm. Aggregates with an increased height of 16 nm were
observed after heating for a second time in the presence of 100 mM NaCl, corresponding
to translucent appearance (Figure 2-3B). Ikeda and Morris (Ikeda & Morris, 2002)
previously revealed similar heat-induced structures of WPI and β-lactoglobulin,
presumably through steps of the initial formation of granular aggregates with varying
sizes and the subsequent aggregation between these granular aggregates. This results in
the co-existence of small particles with varied sizes depending on ionic strength and
duration of heat treatment and much larger aggregates of small particles.
After being pretreated with mTGase without preheating, the structure of whey
proteins (Figure 2-4C, left) was similar to that of native WPI (Figure 2-4A, left), but the
particle height increased to 6.45 nm, indicating limited cross-linking. After heating at 100
mM NaCl, aggregates were observed (Figure 2-4C, right), with an average height of 17
nm (Table 2-2), which was smaller than the structure formed from native WPI.
After sequential pretreatments, granular aggregates with an average height of
~10.73 nm were observed (Figure 2-4D, left; Table 2-2; supplementary Figure 2-S1).
Both morphology (supplementary Figure 2-S2) and height (Table 2-2) suggest a greater
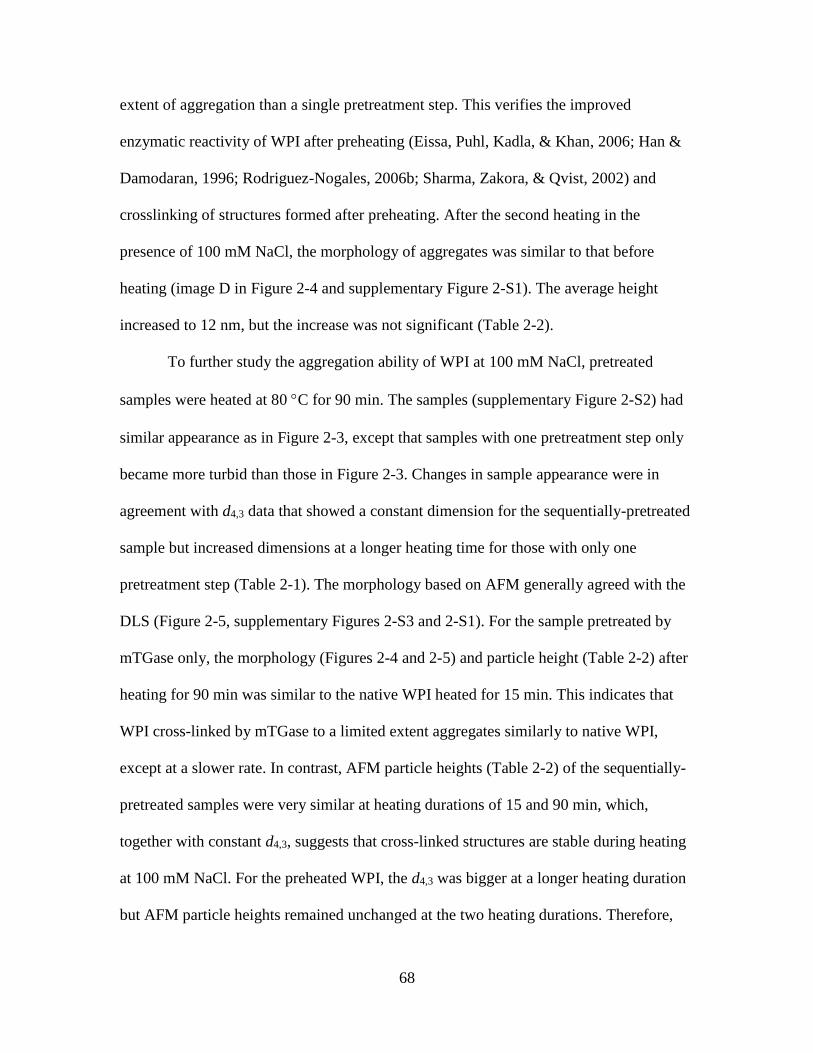
68
extent of aggregation than a single pretreatment step. This verifies the improved
enzymatic reactivity of WPI after preheating (Eissa, Puhl, Kadla, & Khan, 2006; Han &
Damodaran, 1996; Rodriguez-Nogales, 2006b; Sharma, Zakora, & Qvist, 2002) and
crosslinking of structures formed after preheating. After the second heating in the
presence of 100 mM NaCl, the morphology of aggregates was similar to that before
heating (image D in Figure 2-4 and supplementary Figure 2-S1). The average height
increased to 12 nm, but the increase was not significant (Table 2-2).
To further study the aggregation ability of WPI at 100 mM NaCl, pretreated
samples were heated at 80 C for 90 min. The samples (supplementary Figure 2-S2) had
similar appearance as in Figure 2-3, except that samples with one pretreatment step only
became more turbid than those in Figure 2-3. Changes in sample appearance were in
agreement with d4,3 data that showed a constant dimension for the sequentially-pretreated
sample but increased dimensions at a longer heating time for those with only one
pretreatment step (Table 2-1). The morphology based on AFM generally agreed with the
DLS (Figure 2-5, supplementary Figures 2-S3 and 2-S1). For the sample pretreated by
mTGase only, the morphology (Figures 2-4 and 2-5) and particle height (Table 2-2) after
heating for 90 min was similar to the native WPI heated for 15 min. This indicates that
WPI cross-linked by mTGase to a limited extent aggregates similarly to native WPI,
except at a slower rate. In contrast, AFM particle heights (Table 2-2) of the sequentially-
pretreated samples were very similar at heating durations of 15 and 90 min, which,
together with constant d4,3, suggests that cross-linked structures are stable during heating
at 100 mM NaCl. For the preheated WPI, the d4,3 was bigger at a longer heating duration
but AFM particle heights remained unchanged at the two heating durations. Therefore,
69
denatured whey proteins after preheating at studied conditions can still aggregate at 100
mM NaCl, with possible interpretation given in the later section.
Overall, the measured particle heights from AFM (Table 2-2) are much smaller
than the dimensions measured in DLS (Table 2-1). In a dispersion, the measured
dimension (hydrodynamic diameter) in DLS indicates the overall space occupied by the
aggregated particles and is expected to be bigger than the height of granular aggregates
(Table 2-2) that is smaller than the dimension suggested by aggregate morphology
(Figures 2-4 and 2-5). Furthermore, the 5% w/v dispersion used in particle size
measurements was diluted to 10 ppm in AFM, and weakly flocculated aggregates may be
measured in DLS but not AFM. The drying process also can reduce the dimension of
aggregates, resulting in smaller particle heights measured in AFM.
2.4.5 Zeta potential and surface hydrophobicity
The long-range electrostatic repulsion and shorter range hydrophobic attraction
are critical for the stability of whey protein (Bryant & McClements, 1998; Rabiey &
Britten, 2009). Table 2-3 shows the zeta-potential of WPI samples at pH 7.0 after various
pretreatments and subsequent heating at pH 7.0 and 0 or 100 mM NaCl for 15 min at 80
C. The zeta-potential of native WPI dispersion was -27 mV at pH 7.0 and became more
negative after pretreatments, with the magnitude increased further after heating at 0 mM
NaCl. The results in Table 2-3 are higher than the -24.6 mV of native WPI and -26.6 mV
of WPI heated at 90 C for 10 min at pH 6.8 (Ryan, Vardhanabhuti, Jaramillo, van
Zanten, Coupland, & Foegeding, 2012), and the difference can be due to different
supplies of WPI, pH, and heating conditions. For the crosslinking catalyzed by mTGase,
70
the reaction between an acyl donor (glutamine) and an acyl acceptor (lysine) results in the
loss of an amino group (Jaros, Partschefeld, Henle, & Rohm, 2006), which reduces the
number of positive charges. Cysteine, with pKa of 8.5, is an amino acid with free thiol
groups available for formation of intra- and intermolecular disulfide bonds after heating
(Bryant & McClements, 1998), which may reduce the surface positive charges.
Furthermore, denaturation causes the redistribution of surface amino acids and the
number of negatively-charged surface amino acids can increase after heating and/or
mTGase cross-linking. Because zeta potential increased more significantly after heating
than after mTGase treatments (Table 2-3), whey protein structure changes due to thermal
denaturation are the major cause of increased zeta-potential. The increased zeta-potential,
i.e. electrostatic repulsion of pretreated WPI can reduce the aggregation during heating
but is not the major cause of the improvement in heat stability, because the preheated
WPI (with zeta potential of -33.50 mV) formed bigger structures (Tables 2-1 and 2-2)
and more turbid dispersion (Figure 2-3) than the sequentially-pretreated WPI (with zeta
potential of -32.72 mV).
For the samples heated at 100 mM NaCl, the zeta-potential was significantly
lower than that before heating when samples were measured directly. After dialysis, the
measured zeta-potential was significantly higher than that before dialysis and that before
heating, and was similar to that heated at 0 mM NaCl. The increased zeta-potential
measured after dialysis is expected because colloidal particles have an increased mobility
at decreased ionic strength due to the shortened Debye length, which was observed in the
electrophoresis study (Israelachvili, 1992).
71
As for surface hydrophobicity, the S0 increased after all pretreatment steps (Table
2-4). Heating caused a greater increase in S0 than mTGase, and the increase in S0 was
greater when heated at 0 mM NaCl (the preheated sample) than at 100 mM NaCl (the
control sample). Thermal denaturation causes the exposure of initially embedded
hydrophobic amino acid residues and therefore the increase in S0 (Zhu & Damodaran,
1994). The protection of NaCl against thermal denaturation has been reported for a higher
extent of whey protein denaturation at 0 mM NaCl (~100%) than at 100 mM NaCl
(~10%) (Nicorescu, Loisel, Vial, Riaublanc, Djelveh, Cuvelier, et al., 2008). The overall
trend in Table 2-4 is consistent with the results of Ryan et al. (Ryan, Vardhanabhuti,
Jaramillo, van Zanten, Coupland, & Foegeding, 2012). Because an increase in S0 favors
protein aggregation, changes in S0 are not responsible for the observed heat stability of
WPI after pretreatment.
2.4.6 Thermal denaturation properties of whey proteins after pretreatments
All DSC thermograms of samples at pH 7.0 and 100 mM NaCl showed an
endothermic peak (Figure 2-6), with the estimated H and Td summarized in Table 2-5.
Thermal denaturation of whey proteins involves both endothermic and exothermic
processes, with the former attributed by protein unfolding due to mechanisms such as
disruption of intramolecular hydrogen bonds and the latter resulting from hydrophobic
attraction and formation of covalent (disulfide) bonds during the aggregation of
denatured protein (Fitzsimons, Mulvihill, & Morris, 2007; Nicorescu, et al., 2008;
Unterhaslberger, Schmitt, Sanchez, Appolonia-Nouzille, & Raemy, 2006). The overall
thermogram depends on dispersion pH, ionic strength, protein concentration, and heating
72
rate (Unterhaslberger, Schmitt, Sanchez, Appolonia-Nouzille, & Raemy, 2006). The Td of
native WPI at 100 NaCl was at 77 °C, which is in a good agreement with the literature
(Haug, Skar, Vegarud, Langsrud, & Draget, 2009; Nicorescu, et al., 2008;
Unterhaslberger, Schmitt, Sanchez, Appolonia-Nouzille, & Raemy, 2006). The center of
endothermic peak of preheated WPI shifted to 80 °C, with a much reduced intensity when
compared to native WPI, corresponding to increased Td and decreased H that indicate
improved thermal stability of WPI after preheating. Preheated WPI is highly charged due
to increased electrostatic repulsion and formation of covalent disulfide bonds during
preheating, thus exhibited greater resistant to salt-induced aggregation. The Td and H of
WPI cross-linked by mTGase directly were not statistically different from those of native
WPI, suggesting limited improvement of heat stability. This agrees with studies showing
that native α-lactalbumin and β-lactoglobulin are not very reactive substrates during
mTGase cross-linking (Han & Damodaran, 1996). Preheating partially unfolds whey
protein and increase the susceptibility to cross-linking by mTGase (Rodriguez-Nogales,
2006b; Sharma, Zakora, & Qvist, 2002; Zhang & Zhong, 2010), corresponding to
significantly increased Td and decreased H of sequentially-pretreated WPI. Because
zeta-potential alone is insufficient to interpret the most improved heat stability after
sequent pretreatments, the denaturation properties of whey protein are responsible for
thermal stability observed in Figure 2-3.
2.4.7 Viscosity of samples heated at 80 C for 15 min after various pretreatments
Shear rate ramps of WPI samples after heating at 80 C for 15 min showed typical
shear-thinning properties, i.e., a reduced viscosity at a higher shear rate, shown in

73
supplementary Figure 2-S4 for those with 0 mM NaCl. Whey proteins are globular
proteins, and the aggregation of whey proteins during heating has been described in the
theoretical framework of colloidal interactions (Bryant & McClements, 1998). For
colloidal dispersions, the dependence of apparent viscosity on shear rate measured using
a mechanical rheometer typically shows a plateau regime at the low shear rate regime,
called zero-shear viscosity (o) and another plateau at the high shear rate regime, called
infinite-shear viscosity (), illustrated in supplementary Figure 2-S4. There was no
identifiable o for all samples tested, possibly because the lowest shear rate used in tests,
0.1 s-1 (10 times of the instrument limit of 0.01 s-1), was not sufficiently low.
The impact of various pretreatment conditions on whey protein structures is best
indicated by o that is not interfered by external shear force. The apparent viscosity of
samples at 0.1 s-1 did not show any trend as impacted by the studied pretreatment
conditions and is thus not reported here. This may have been caused by two factors. First,
the apparent viscosity at 0.1 s-1 was not o, as discussed above. Second, samples were
heated in vials before being loaded in the sample cup of rheometer because of the need to
adjust solvent conditions during sample preparation. Transferring samples during the
process may interrupt some structures formed during pretreatments and the final heating
step. On the other hand, is another indicator of sample characteristics because weaker
interactions are disrupted by shear, which also can overcome the errors resulting from
sample preparation.
Apparent viscosities at 1000 s-1 are treated as for samples heated at 80 C for
15 min after pretreatment at various conditions. For samples without preheating (Figure
74
2-7), the general trend was similar to absorbance values as impacted by pretreatments
(Figure 2-1): lower at a greater extent of enzymatic treatment. For preheated samples
(Figure 2-8), samples treated by a higher enzyme level showed higher . At each NaCl
concentration, the maximum was observed for WPI pretreated by mTGase for 4 h at
the highest level of enzyme and 8 h at two other enzyme levels, and the overall trend is
similar to the impact of pretreatment on sample absorbance (Figure 2-2).
The agreement between viscosity and absorbance data and the different trend
observed for the treatments with and without preheating are to be interpreted carefully. A
higher extent of aggregated structures is correlated to a higher viscosity because of
increased inertia against fluid flow (McClements, 2005). Because WPI without
preheating is not an active substrate of mTGase, the extent of cross-linking is expected to
follow reaction kinetics that is a function of reaction time and mTGase concentration.
Since cross-linked whey proteins are stable against aggregation during heating at 80 C
for 15 min, thermal aggregation is less extensive for samples subjected to a higher degree
of enzyme treatment, corresponding to a lower absorbance value (Figure 2-1) and
viscosity after heating (Figure 2-7). In contrast, the preheated WPI is cross-linked by
mTGase easily and becomes resistant against aggregation during the final heating step at
80 C for 15 min. The extent of mTGase cross-linking then determines absorbance and
viscosity, which shows a higher absorbance value and viscosity at a higher mTGase level
at the same ionic strength. At the same level of mTGase, the highest absorbance and
viscosity were observed at an intermediate cross-linking duration. It is possible that
individual aggregates formed during preheating are cross-linked initially, corresponding
75
to an increase in viscosity, followed by cross-linking between initially cross-linked
structures, which reduces viscosity if cross-linking is not end-to-end. This corresponds to
the maximum space occupied by aggregates at an intermediate cross-linking duration,
which is shorter when mTGase is used at a higher level, as indicated by absorbance and
viscosity data (Figures 2-2 and 2-8).
2.4.8 Physical interpretation of thermal aggregation of whey protein at 100 mM NaCl
and neutral pH as impacted by mTGase pretreatment
Based on the nanoscale structural information reported in this work, the impacts
of pretreatments on thermal aggregation of whey protein at 100 mM NaCl can be
summarized in Figure 2-9. Aggregation between colloidal particles is either reaction- or
diffusion-limited (Russel, Saville, & Schowalter, 1989). For native WPI, proteins are
denatured during heating and become more hydrophobic, and the weakened electrostatic
repulsion at an increased ionic strength (100 mM NaCl) favors protein aggregation. This
corresponds to diffusion-limited aggregation, resulting in turbid gels formed of particular
aggregates with much increased d4,3 and AFM particle height (Tables 2-1 and 2-2).
Heating whey proteins at low ionic strength is known to be diffusion-limited, forming
filament-type aggregates (Bryant & McClements, 1998). In this work, preheating was
conducted at pH 7.5 with 50 mM sodium phosphate for limited duration, forming flake-
like aggregates (Figure 2-4 and supplementary Figure 2-S1) with mostly two-three layers
of denatured proteins (Table 2-2). The remaining protein molecules can still be denatured
and join the aggregates during the second heating with 100 mM NaCl, corresponding to
both increased d4,3 and AFM particle height (Tables 2-1 and 2-2) when heated for 15 min.
76
At an elongated heating duration, the initially formed aggregates form bigger structures
laterally due to excluded volume, corresponding to increased d4,3 and similar AFM
particle height (Tables 2-1 and 2-2). Compared to native WPI, the increased zeta-
potential and Td after preheating reduce the extent of aggregation, corresponding to
fluidic translucent dispersion.
For samples directly pretreated by mTGase, the aggregation characteristics are
similar to native WPI, except to a less extent due to a portion of cross-linked structures
that are stable against thermal aggregation. For the sequentially-pretreated sample, it can
be deduced that mTGase crosslinking occurs mostly between proteins within flakes
formed during preheating and those between flakes and individual proteins,
corresponding to bigger AFM particle height and d4,3 than the preheated sample. The
cross-linked whey proteins have much higher Td, corresponding to practically constant
particle heights and d4,3 during heating with 100 mM NaCl (Tables 2-1 and 2-2) and
transparent dispersions (Figure 2-3 and supplementary Figure 2-S2).
2.5 Conclusions
Individual or combined pretreatment methods of preheating and mTGase
improved heat stability of WPI to different degrees. The sequential pretreatment showed
the best improvement as transparent dispersions were observed for the three NaCl
concentrations tested. When comparing to increased zeta-potential and surface
hydrophobicity after different pretreatments, the reduced protein aggregation resulted
from the increased Td. The excellent agreement between absorbance and viscosity results
revealed the structure formation kinetics as catalyzed by mTGase. Nanostructures
77
assessed by DLS and AFM revealed nanoscale phenomena underlying macroscopic
properties of whey protein aggregation as impacted by prior pretreatments. Native WPI
and that pretreated by mTGase directly to a limited extent aggregated similarly, forming
particulate structures. Preheating increased the resistance of whey protein against thermal
aggregation, and the subsequent heating at increased ionic strength involved the addition
of free proteins and lateral aggregation of initially formed structures. Sequential
pretreatments induced the formation of aggregates resistant against aggregation, enabling
transparent dispersions regardless of heating duration and ionic strength. Findings of this
work may be used to produce transparent beverages with added salts such as sports
drinks.
Acknowledgements
This work was partially supported by University of Tennessee and Dairy
Research Institute. The authors thank Ajinomoto for supplying mTGase sample and
Hilmar Ingredients for the WPI sample. We appreciate expertise and insightful discussion
provided by Dr. Shinya Ikeda.
78
References
Agyare, K. K., & Damodaran, S. (2010). pH-stability and thermal properties of microbial
transglutaminase-treated whey protein isolate. J. Agric. Food Chem., 58, 1946-
1953.
Alizadeh-Pasdar, N., & Li-Chan, E. C. Y. (2000). Comparison of protein surface
hydrophobicity measured at various pH values using three different fluorescent
probes. J. Agric. Food Chem., 48, 328-334.
Aymard, P., Nicolai, T., Durand, D., & Clark, A. (1999). Static and dynamic scattering of
β-lactoglobulin aggregates formed after heat-induced denaturation at pH 2.
Macromolecules, 32, 2542-2552.
Baier, S., & McClements, D. J. (2001). Impact of preferential interactions on thermal
stability and gelation of bovine serum albumin in aqueous sucrose solutions. J.
Agric. Food Chem., 49, 2600-2608.
Betz, M., Hörmansperger, J., Fuchs, T., & Ulrich Kulozik, U. (2012). Swelling
behaviour, charge and mesh size of thermal protein hydrogels as influenced by pH
during gelation. Soft Matter, 8, 2477-2485.
Brownsey, G. J., Noel, T. R., Parker, R., & Ring, S. G. (2003). The glass transition
behavior of the globular protein bovine serum albumin. Biophys. J., 85, 3943-
3950.
Bryant, C. M., & McClements, D. J. (1998). Molecular basis of protein functionality with
special consideration of cold-set gels derived from heat-denatured whey. Trends
Food Sci. Technol., 9, 143-151.
Chanasattru, W., Decker, E. A., & McClements, D. J. (2007). Modulation of thermal
stability and heat-induced gelation of -lactoglobulin by high glycerol and
sorbitol levels. Food Chem., 103, 512-520.
Chantrapornchai, W., & McClements, D. J. (2002). Influence of glycerol on optical
properties and large-strain rheology of heat-induced whey protein isolate gels.
Food Hydrocolloid, 16, 461-466.
Chen, L., & Subirade, M. (2005). Chitosan/β-lactoglobulin core-shell nanoparticles as
nutraceutical carriers. Biomaterials, 26, 6041-6053.
Chen, L., & Subirade, M. (2006). Alginate-whey protein granular microspheres as oral
delivery vehicles for bioactive compounds. Biomaterials, 27, 4646-4654.
Cozzolino, A., Di Pierro, P., Mariniello, L., Sorrentino, A., Masi, P., & Porta, R. (2003).
Incorporation of whey proteins into cheese curd by using transglutaminase.
Biotechnol. Appl. Biochem., 38, 289-295.
Eissa, A. S., Puhl, C., Kadla, J. F., & Khan, S. A. (2006). Enzymatic cross-linking of β-
lactoglobulin: Conformational properties using FTIR spectroscopy.
Biomacromolecules, 7, 1707-1713.
Elofsson, C., Dejmek, P., Paulsson, M., & Burling, H. (1997). Atomic force microscopy
studies on whey proteins. Int. Dairy J., 7, 813-819.
Ercili-Cura, D., Partanen, R., Husband, F., Ridout, M., Macierzanka, A., Lille, M., Boer,
H., Lantto, R., Buchert, J., & Mackie, A. R. (2012). Enzymatic cross-linking of β-
lactoglobulin in solution and at air-water interface: Structural constraints. Food
Hydrocolloid, 28, 1-9.
79
Fitzsimons, S. M., Mulvihill, D. M., & Morris, E. R. (2007). Denaturation and
aggregation processes in thermal gelation of whey proteins resolved by
differential scanning calorimetry. Food Hydrocolloid, 21, 638-644.
Foegeding, E. A., Davis, J. P., Doucet, D., & McGuffey, M. K. (2002). Advances in
modifying and understanding whey protein functionality. Trends Food Sci.
Technol., 13, 151-159.
Folk, J. E., & Cole, P. W. (1966). Transglutaminase: mechanistic features of the active
site as determined by kinetic and inhibitor studies. Biochim. Biophys. Acta, 122,
244-264.
Han, X. Q., & Damodaran, S. (1996). Thermodynamic compatibility of substrate proteins
affects their cross-linking by transglutaminase. J. Agric. Food Chem., 44, 1211-
1217.
Haug, I., Skar, H., Vegarud, G., Langsrud, T., & Draget, K. (2009). Electrostatic effects
on β-lactoglobulin transitions during heat denaturation as studied by differential
scanning calorimetry. Food Hydrocolloids, 23(8), 2287-2293.
Ikeda, S., & Foegeding, E. (1999). Effects of lecithin on thermally induced whey protein
isolate gels. Food Hydrocolloid, 13, 239-244.
Ikeda, S., & Morris, V. J. (2002). Fine-stranded and particulate aggregates of heat-
denatured whey proteins visualized by atomic force microscopy.
Biomacromolecules, 3, 382-389.
Israelachvili, J. N. (1992). Intermolecular and Surface Forces (2 ed.): Academic Press,
San Diego, CA.
Jaros, D., Partschefeld, C., Henle, T., & Rohm, H. (2006). Transglutaminase in dairy
products: Chemistry, physics, applications. J. Texture Stud., 37, 113-155.
Kulmyrzaev, A., Bryant, C., & McClements, D. J. (2000). Influence of sucrose on the
thermal denaturation, gelation, and emulsion stabilization of whey proteins. J.
Agric. Food Chem., 48, 1593-1597.
Lee, S. J., Choi, S. J., Li, Y., Decker, E. A., & McClements, D. J. (2011). Protein-
stabilized nanoemulsions and emulsions: comparison of physicochemical
stability, lipid oxidation, and lipase digestibility. J. Agric. Food Chem., 59, 415-
427.
Loveday, S. M., Su, J., Rao, M. A., Anema, S. G., & Singh, H. (2011). Effect of calcium
on the morphology and functionality of whey protein nanofibrils.
Biomacromolecules, 12, 3780-3788.
McClements, D. J. (2005). Food Emulsions: Principles, Practice, and Techniques (2nd
ed.). Boca Raton: CRC Press.
Molek, J. R., & Zydney, A. L. (2007). Separation of PEGylated -lactalbumin from
unreacted precursors and byproducts using ultrafiltration. Biotechnol. Prog., 23,
1417 - 1424.
Nicorescu, I., Loisel, C., Vial, C., Riaublanc, A., Djelveh, G., Cuvelier, G., & Legrand, J.
(2008). Combined effect of dynamic heat treatment and ionic strength on
denaturation and aggregation of whey proteins–Part I. Food Res. Int., 41, 707-
713.
80
Parker, R., Noel, T. R., Brownsey, G. J., Laos, K., & Ring, S. G. (2005). The
nonequilibrium phase and glass transition behavior of -lactoglobulin. Biophys.
J., 89, 1227-1236.
Rabiey, L., & Britten, M. (2009). Effect of protein composition on the rheological
properties of acid-induced whey protein gels. Food Hydrocolloids, 23(3), 973-
979.
Reddy, I. M., Kella, N. K. D., & Kinsella, J. E. (1988). Structural and conformational
basis of the resistance of. beta.-lactoglobulin to peptic and chymotryptic
digestion. J. Agric. Food Chem., 36, 737-741.
Rodriguez-Nogales, J. (2006a). Enhancement of transglutaminase-induced protein cross-
linking by preheat treatment of cows' milk: A statistical approach. International
dairy journal, 16(1), 26-32.
Rodriguez-Nogales, J. M. (2006b). Effect of preheat treatment on the transglutaminase-
catalyzed cross-linking of goat milk proteins. Process Biochem., 41, 430-437.
Russel, W. B., Saville, D. A., & Schowalter, W. R. (1989). Colloidal Dispersions:
Cambridge University Press, Cambridge, UK.
Ryan, K., Vardhanabhuti, B., Jaramillo, D., van Zanten, J., Coupland, J., & Foegeding, E.
(2012). Stability and mechanism of whey protein soluble aggregates thermally
treated with salts. Food Hydrocolloid, 27, 411-420.
Schmitt, C., Bovay, C., Rouvet, M., Shojaei-Rami, S., & Kolodziejczyk, E. (2007). Whey
protein soluble aggregates from heating with NaCl: physicochemical, interfacial,
and foaming properties. Langmuir, 23(8), 4155-4166.
Sharma, R., Zakora, M., & Qvist, K. B. (2002). Susceptibility of an industrial a-
lactalbumin concentrate to cross-linking by microbial transglutaminase. Int. Dairy
J., 12, 1005-1012.
Tang, C. H., & Ma, C. Y. (2007). Modulation of the thermal stability of β-lactoglobulin
by transglutaminase treatment. Eur. Food Res. Technol., 225, 649-652.
Tanimoto, S. Y., & Kinsella, J. E. (1988). Enzymatic modification of proteins: effects of
transglutaminase cross-linking on some physical properties of -lactoglobulin. J.
Agric. Food Chem., 36, 281-285.
Truong, V. D., Clare, D. A., Catignani, G. L., & Swaisgood, H. E. (2004). Cross-linking
and rheological changes of whey proteins treated with microbial transglutaminase.
J. Agric. Food Chem., 52, 1170-1176.
Unterhaslberger, G., Schmitt, C., Sanchez, C., Appolonia-Nouzille, C., & Raemy, A.
(2006). Heat denaturation and aggregation of β-lactoglobulin enriched WPI in the
presence of arginine HCl, NaCl and guanidinium HCl at pH 4.0 and 7.0. Food
Hydrocolloid, 20, 1006-1019.
Yong, Y. H., & Foegeding, E. A. (2008). Effects of caseins on thermal stability of bovine
b-lactoglobulin. J. Agric. Food Chem., 56, 10352-10358.
Zhang, W., & Zhong, Q. (2009). Microemulsions as nanoreactors to produce whey
protein nanoparticles with enhanced heat stability by sequential enzymatic cross-
linking and thermal pretreatments. J. Agric. Food Chem., 57, 9181-9189.
Zhang, W., & Zhong, Q. (2010). Microemulsions as nanoreactors to produce whey
protein nanoparticles with enhanced heat stability by thermal pretreatment. Food
Chem., 119, 1318-1325.
81
Zhu, H. M., & Damodaran, S. (1994). Heat-induced conformational-changes in whey-
protein isolate and its relation to foaming properties. J. Agric. Food Chem., 42,
846-855.
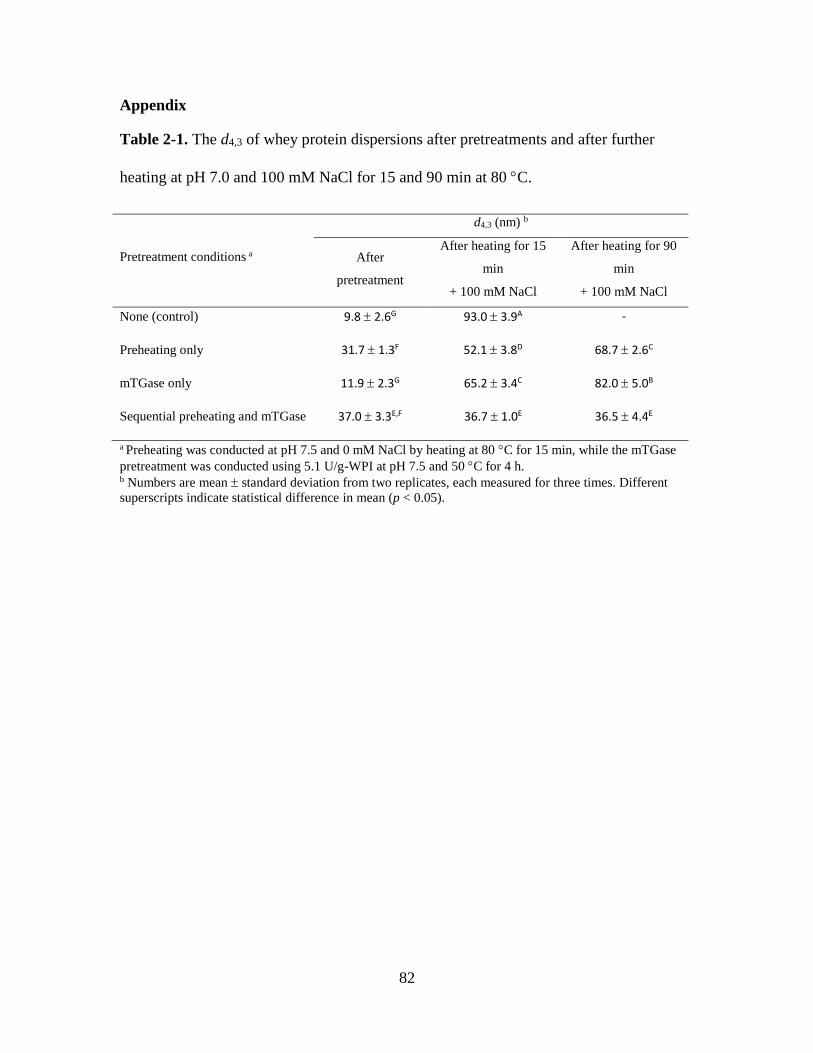
82
Appendix
Table 2-1. The d4,3 of whey protein dispersions after pretreatments and after further
heating at pH 7.0 and 100 mM NaCl for 15 and 90 min at 80 C.
Pretreatment conditions a
d4,3 (nm) b
After
pretreatment
After heating for 15
min
+ 100 mM NaCl
After heating for 90
min
+ 100 mM NaCl
None (control) 9.8 2.6G 93.0 3.9A -
Preheating only 31.7 1.3F 52.1 3.8D 68.7 2.6C
mTGase only 11.9 2.3G 65.2 3.4C 82.0 5.0B
Sequential preheating and mTGase 37.0 3.3E,F 36.7 1.0E 36.5 4.4E
a Preheating was conducted at pH 7.5 and 0 mM NaCl by heating at 80 C for 15 min, while the mTGase
pretreatment was conducted using 5.1 U/g-WPI at pH 7.5 and 50 C for 4 h. b Numbers are mean standard deviation from two replicates, each measured for three times. Different
superscripts indicate statistical difference in mean (p < 0.05).
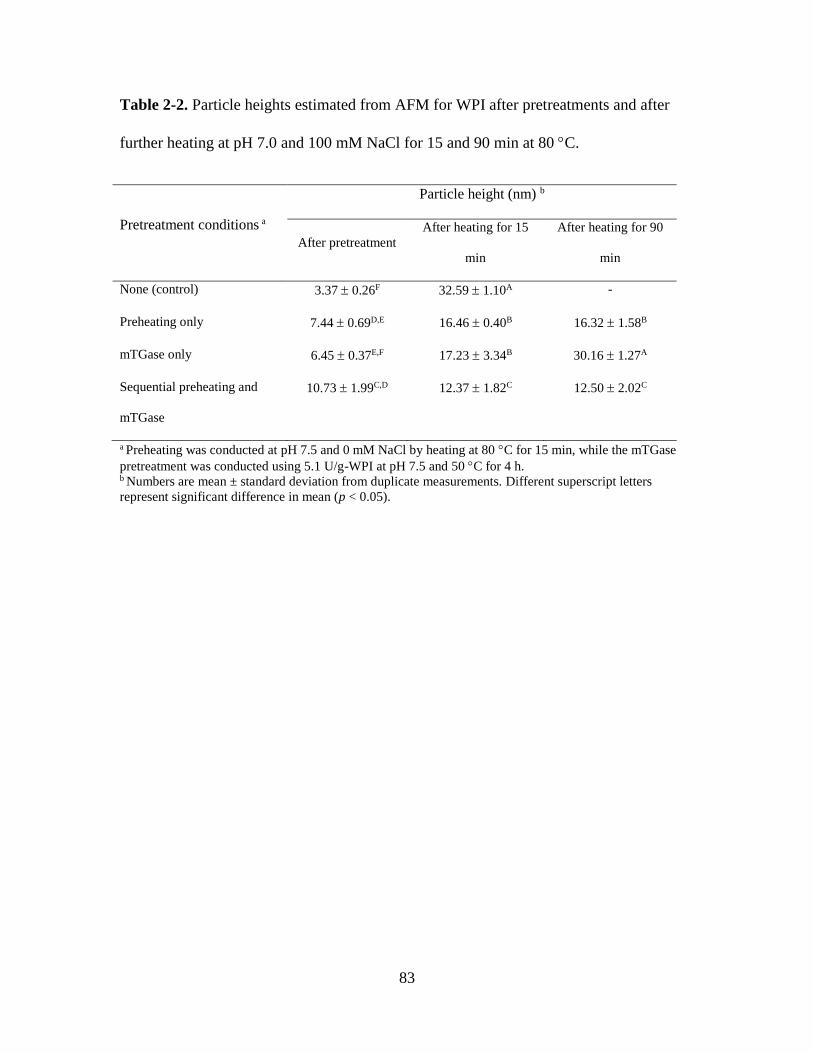
83
Table 2-2. Particle heights estimated from AFM for WPI after pretreatments and after
further heating at pH 7.0 and 100 mM NaCl for 15 and 90 min at 80 C.
Pretreatment conditions a
Particle height (nm) b
After pretreatment
After heating for 15
min
After heating for 90
min
None (control) 3.37 0.26F 32.59 1.10A -
Preheating only 7.44 0.69D,E 16.46 0.40B 16.32 1.58B
mTGase only 6.45 0.37E,F 17.23 3.34B 30.16 1.27A
Sequential preheating and
mTGase
10.73 1.99C,D 12.37 1.82C 12.50 2.02C
a Preheating was conducted at pH 7.5 and 0 mM NaCl by heating at 80 C for 15 min, while the mTGase
pretreatment was conducted using 5.1 U/g-WPI at pH 7.5 and 50 C for 4 h. b Numbers are mean ± standard deviation from duplicate measurements. Different superscript letters
represent significant difference in mean (p < 0.05).
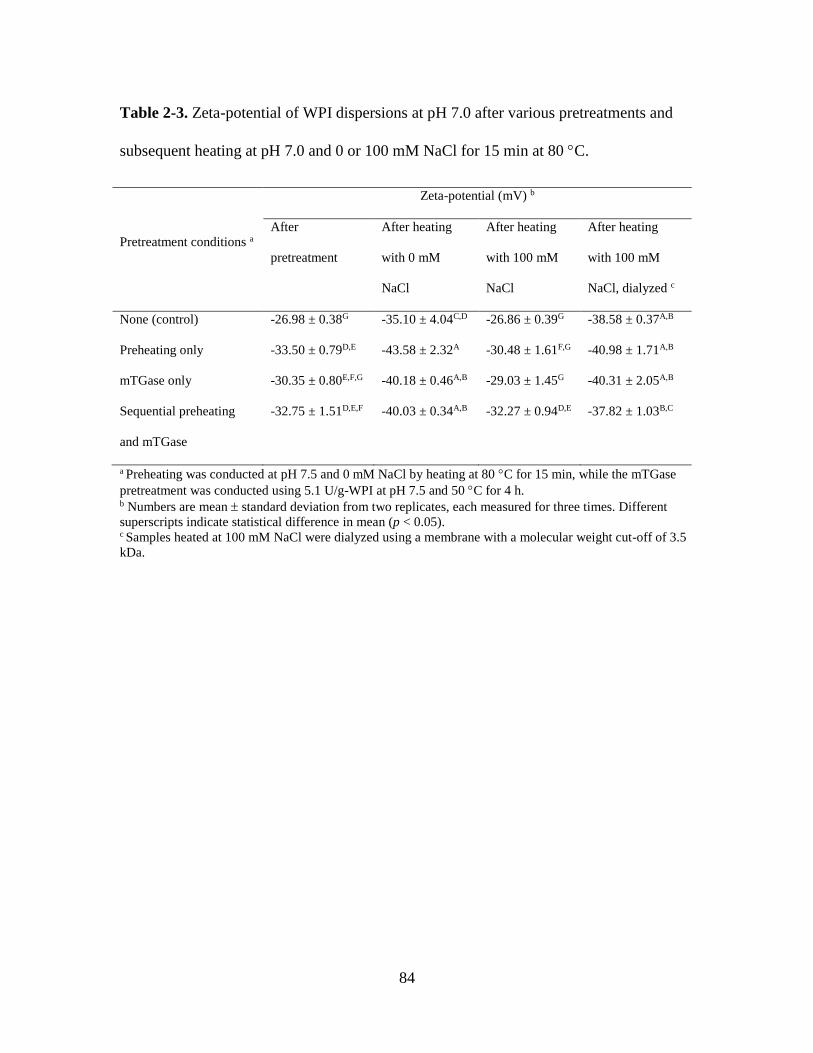
84
Table 2-3. Zeta-potential of WPI dispersions at pH 7.0 after various pretreatments and
subsequent heating at pH 7.0 and 0 or 100 mM NaCl for 15 min at 80 C.
Pretreatment conditions a
Zeta-potential (mV) b
After
pretreatment
After heating
with 0 mM
NaCl
After heating
with 100 mM
NaCl
After heating
with 100 mM
NaCl, dialyzed c
None (control) -26.98 ± 0.38G -35.10 ± 4.04C,D -26.86 ± 0.39G -38.58 ± 0.37A,B
Preheating only -33.50 ± 0.79D,E -43.58 ± 2.32A -30.48 ± 1.61F,G -40.98 ± 1.71A,B
mTGase only -30.35 ± 0.80E,F,G -40.18 ± 0.46A,B -29.03 ± 1.45G -40.31 ± 2.05A,B
Sequential preheating
and mTGase
-32.75 ± 1.51D,E,F -40.03 ± 0.34A,B -32.27 ± 0.94D,E -37.82 ± 1.03B,C
a Preheating was conducted at pH 7.5 and 0 mM NaCl by heating at 80 C for 15 min, while the mTGase
pretreatment was conducted using 5.1 U/g-WPI at pH 7.5 and 50 C for 4 h. b Numbers are mean standard deviation from two replicates, each measured for three times. Different
superscripts indicate statistical difference in mean (p < 0.05). c Samples heated at 100 mM NaCl were dialyzed using a membrane with a molecular weight cut-off of 3.5
kDa.
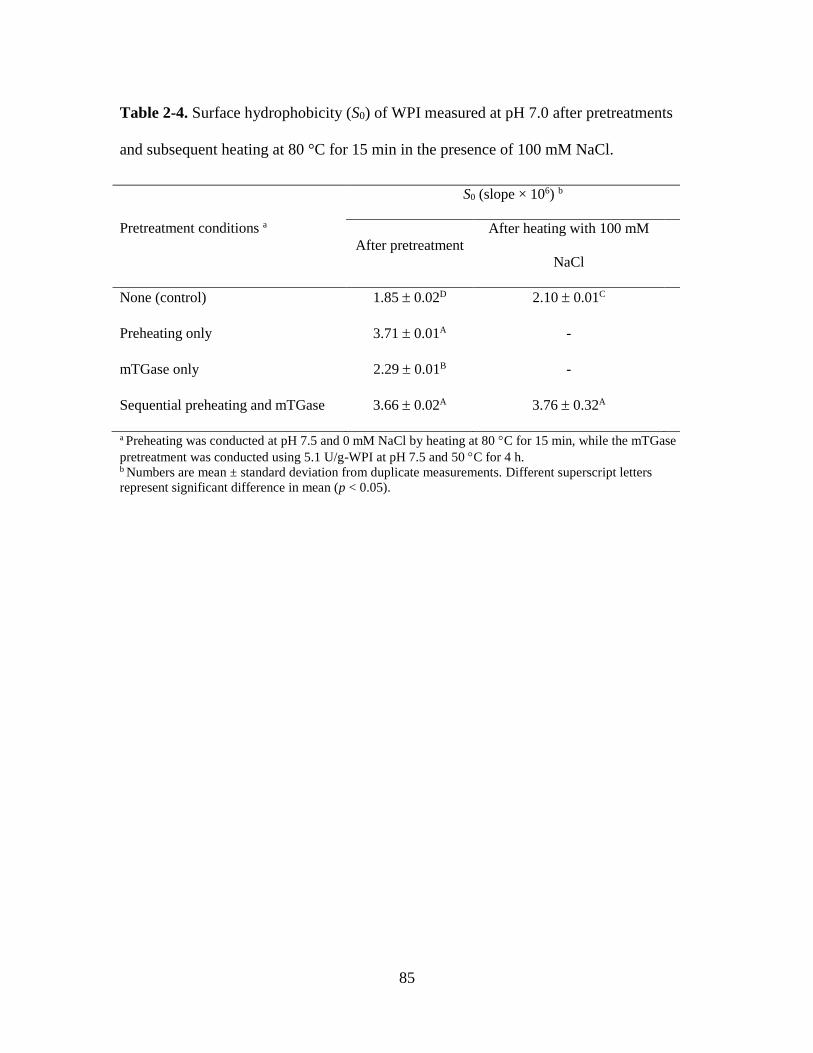
85
Table 2-4. Surface hydrophobicity (S0) of WPI measured at pH 7.0 after pretreatments
and subsequent heating at 80 °C for 15 min in the presence of 100 mM NaCl.
Pretreatment conditions a
S0 (slope × 106) b
After pretreatment
After heating with 100 mM
NaCl
None (control) 1.85 0.02D 2.10 0.01C
Preheating only 3.71 0.01A -
mTGase only 2.29 0.01B -
Sequential preheating and mTGase 3.66 0.02A 3.76 0.32A
a Preheating was conducted at pH 7.5 and 0 mM NaCl by heating at 80 C for 15 min, while the mTGase
pretreatment was conducted using 5.1 U/g-WPI at pH 7.5 and 50 C for 4 h. b Numbers are mean ± standard deviation from duplicate measurements. Different superscript letters
represent significant difference in mean (p < 0.05).
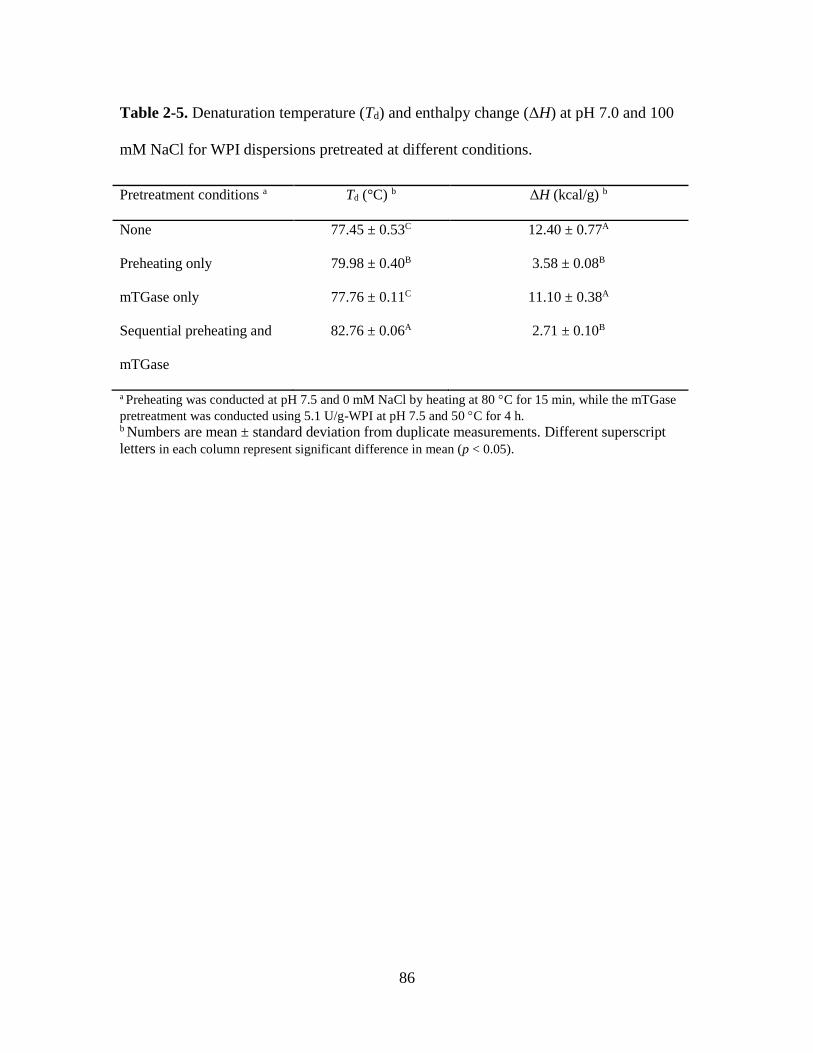
86
Table 2-5. Denaturation temperature (Td) and enthalpy change (ΔH) at pH 7.0 and 100
mM NaCl for WPI dispersions pretreated at different conditions.
Pretreatment conditions a Td (°C) b ΔH (kcal/g) b
None 77.45 ± 0.53C 12.40 ± 0.77A
Preheating only 79.98 ± 0.40B 3.58 ± 0.08B
mTGase only 77.76 ± 0.11C 11.10 ± 0.38A
Sequential preheating and
mTGase
82.76 ± 0.06A 2.71 ± 0.10B
a Preheating was conducted at pH 7.5 and 0 mM NaCl by heating at 80 C for 15 min, while the mTGase
pretreatment was conducted using 5.1 U/g-WPI at pH 7.5 and 50 C for 4 h. b Numbers are mean ± standard deviation from duplicate measurements. Different superscript
letters in each column represent significant difference in mean (p < 0.05).
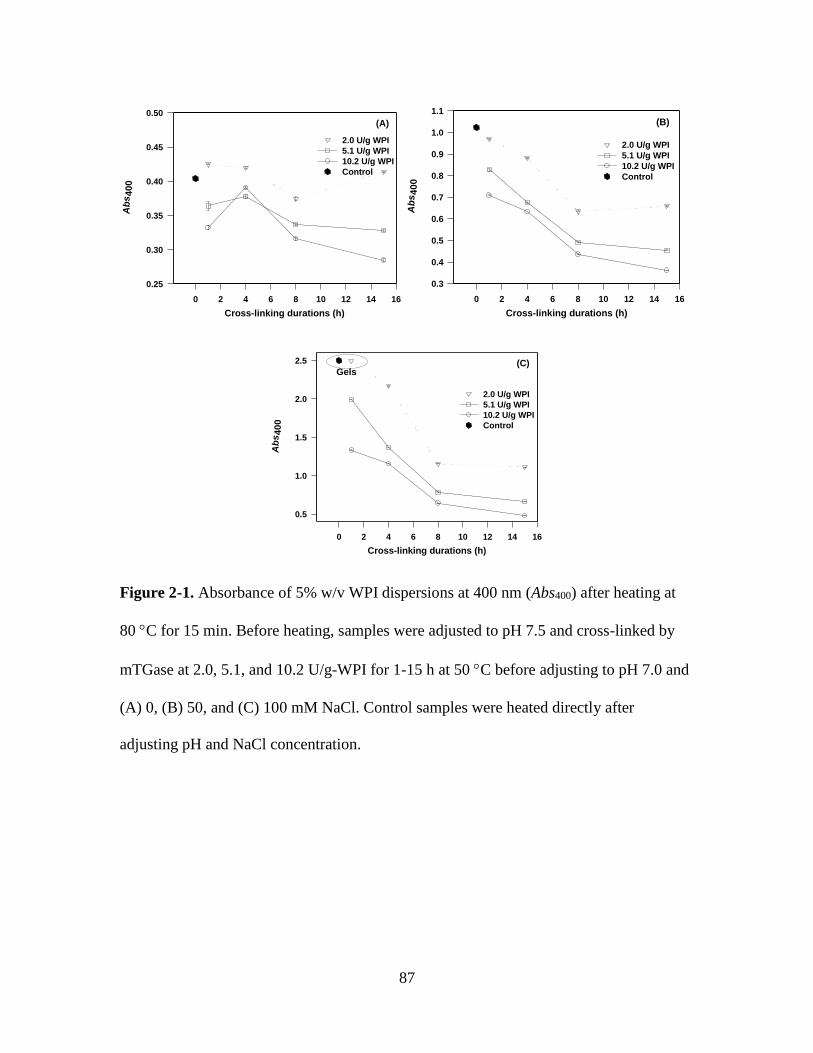
87
Cross-linking durations (h)
0 2 4 6 8 10 12 14 16
Ab
s400
0.25
0.30
0.35
0.40
0.45
0.50
2.0 U/g WPI
5.1 U/g WPI
10.2 U/g WPI
Control
(A)
Cross-linking durations (h)
0 2 4 6 8 10 12 14 16
Ab
s400
0.3
0.4
0.5
0.6
0.7
0.8
0.9
1.0
1.1
2.0 U/g WPI
5.1 U/g WPI
10.2 U/g WPI
Control
(B)
Cross-linking durations (h)
0 2 4 6 8 10 12 14 16
Ab
s400
0.5
1.0
1.5
2.0
2.5
2.0 U/g WPI
5.1 U/g WPI
10.2 U/g WPI
Control
(C)Gels
Figure 2-1. Absorbance of 5% w/v WPI dispersions at 400 nm (Abs400) after heating at
80 C for 15 min. Before heating, samples were adjusted to pH 7.5 and cross-linked by
mTGase at 2.0, 5.1, and 10.2 U/g-WPI for 1-15 h at 50 C before adjusting to pH 7.0 and
(A) 0, (B) 50, and (C) 100 mM NaCl. Control samples were heated directly after
adjusting pH and NaCl concentration.
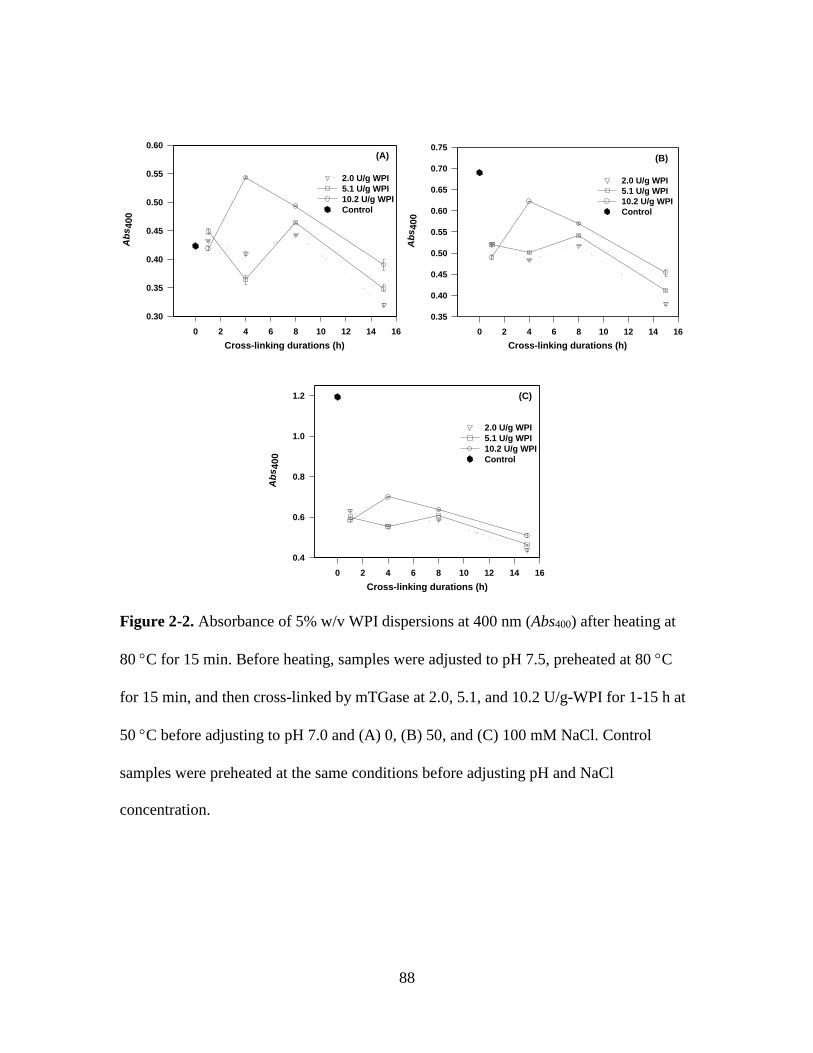
88
Cross-linking durations (h)
0 2 4 6 8 10 12 14 16
Ab
s400
0.30
0.35
0.40
0.45
0.50
0.55
0.60
2.0 U/g WPI
5.1 U/g WPI
10.2 U/g WPI
Control
(A)
Cross-linking durations (h)
0 2 4 6 8 10 12 14 16
Ab
s400
0.35
0.40
0.45
0.50
0.55
0.60
0.65
0.70
0.75
2.0 U/g WPI
5.1 U/g WPI
10.2 U/g WPI
Control
(B)
Cross-linking durations (h)
0 2 4 6 8 10 12 14 16
Ab
s400
0.4
0.6
0.8
1.0
1.2
2.0 U/g WPI
5.1 U/g WPI
10.2 U/g WPI
Control
(C)
Figure 2-2. Absorbance of 5% w/v WPI dispersions at 400 nm (Abs400) after heating at
80 C for 15 min. Before heating, samples were adjusted to pH 7.5, preheated at 80 C
for 15 min, and then cross-linked by mTGase at 2.0, 5.1, and 10.2 U/g-WPI for 1-15 h at
50 C before adjusting to pH 7.0 and (A) 0, (B) 50, and (C) 100 mM NaCl. Control
samples were preheated at the same conditions before adjusting pH and NaCl
concentration.
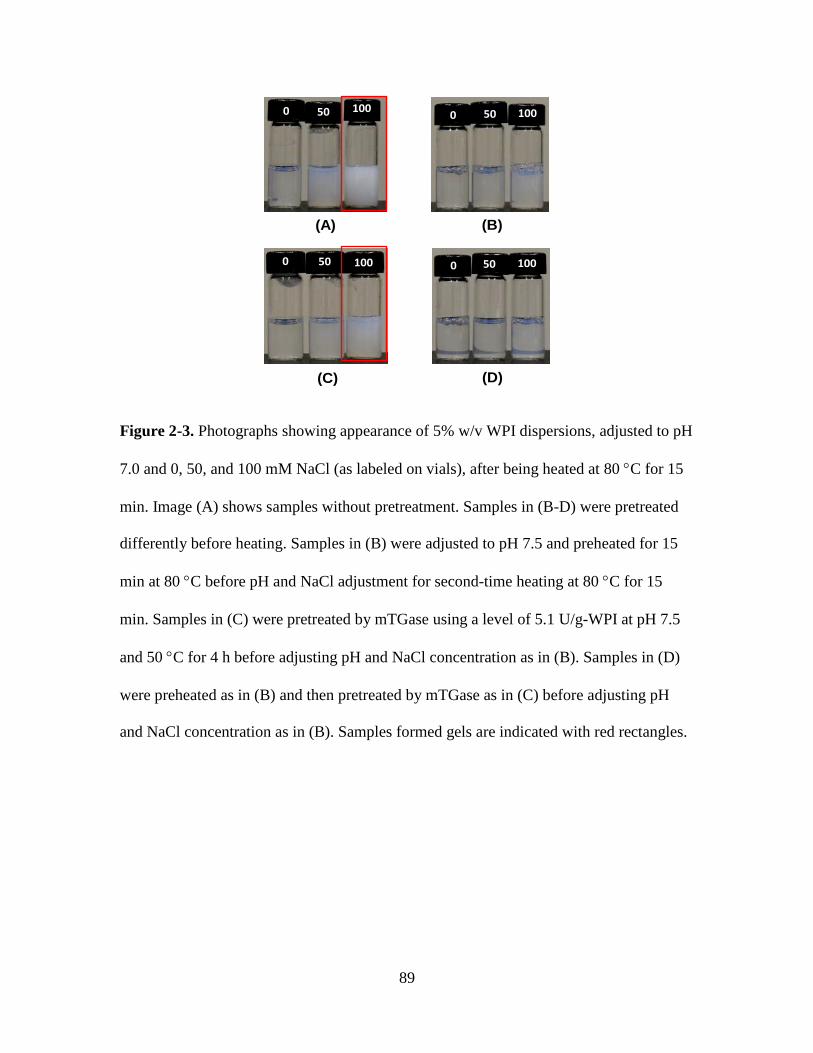
89
(A)
(D)
(B)
(C)
0 50 100
0 50 100
0 50 100
0 50 100
Figure 2-3. Photographs showing appearance of 5% w/v WPI dispersions, adjusted to pH
7.0 and 0, 50, and 100 mM NaCl (as labeled on vials), after being heated at 80 C for 15
min. Image (A) shows samples without pretreatment. Samples in (B-D) were pretreated
differently before heating. Samples in (B) were adjusted to pH 7.5 and preheated for 15
min at 80 C before pH and NaCl adjustment for second-time heating at 80 C for 15
min. Samples in (C) were pretreated by mTGase using a level of 5.1 U/g-WPI at pH 7.5
and 50 C for 4 h before adjusting pH and NaCl concentration as in (B). Samples in (D)
were preheated as in (B) and then pretreated by mTGase as in (C) before adjusting pH
and NaCl concentration as in (B). Samples formed gels are indicated with red rectangles.
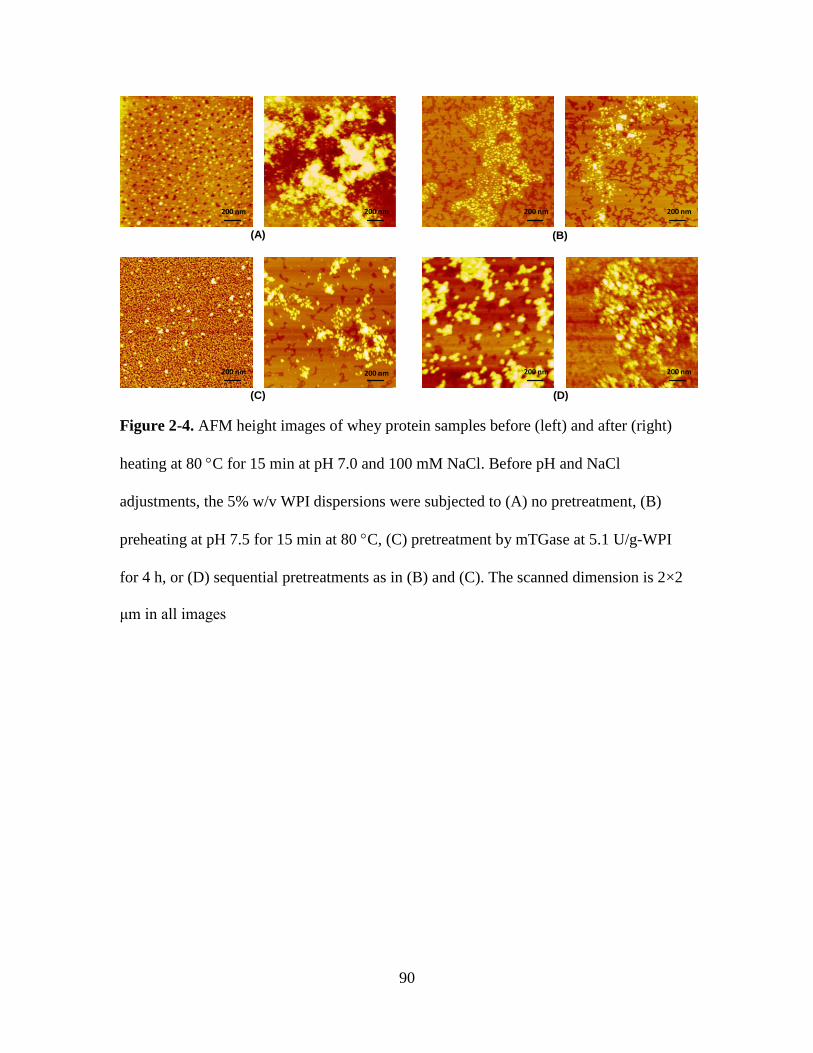
90
(A) (B)
(C) (D)
200 nm200 nm200 nm200 nm
200 nm200 nm 200 nm200 nm
Figure 2-4. AFM height images of whey protein samples before (left) and after (right)
heating at 80 C for 15 min at pH 7.0 and 100 mM NaCl. Before pH and NaCl
adjustments, the 5% w/v WPI dispersions were subjected to (A) no pretreatment, (B)
preheating at pH 7.5 for 15 min at 80 C, (C) pretreatment by mTGase at 5.1 U/g-WPI
for 4 h, or (D) sequential pretreatments as in (B) and (C). The scanned dimension is 2×2
μm in all images
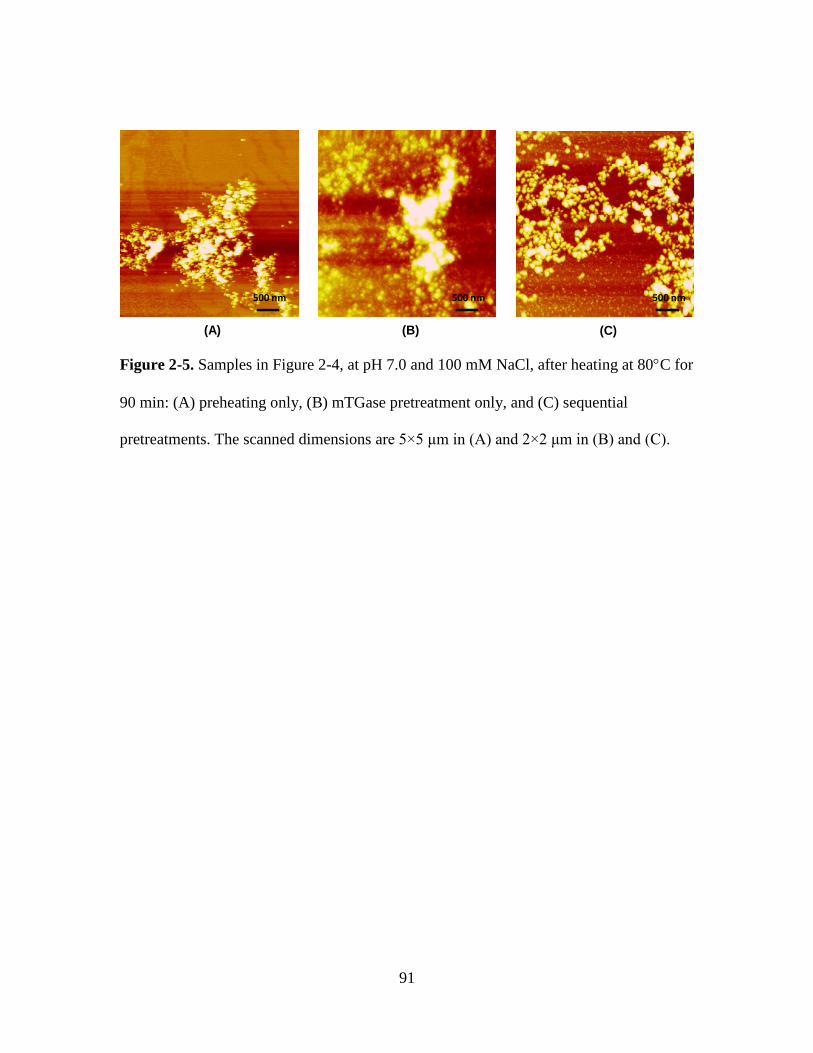
91
(A) (B) (C)
500 nm500 nm500 nm
Figure 2-5. Samples in Figure 2-4, at pH 7.0 and 100 mM NaCl, after heating at 80C for
90 min: (A) preheating only, (B) mTGase pretreatment only, and (C) sequential
pretreatments. The scanned dimensions are 5×5 μm in (A) and 2×2 μm in (B) and (C).
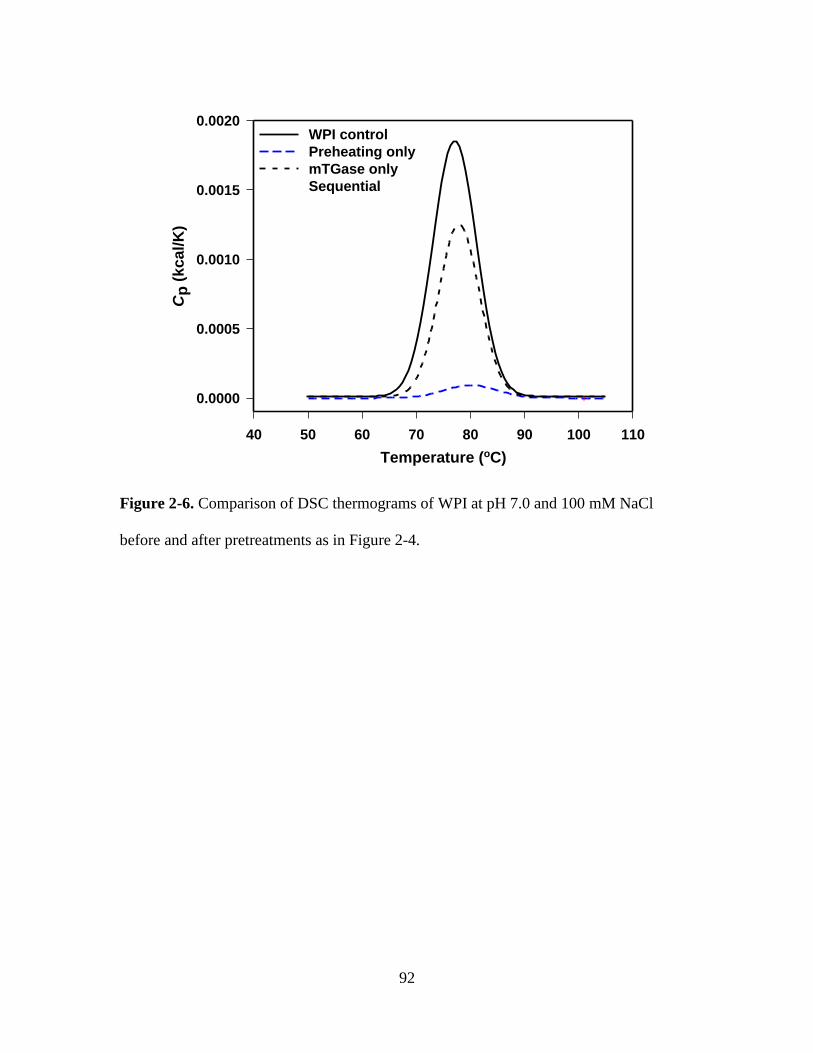
92
Temperature (oC)
40 50 60 70 80 90 100 110
Cp
(kcal/K
)
0.0000
0.0005
0.0010
0.0015
0.0020WPI control
Preheating only
mTGase only
Sequential
Figure 2-6. Comparison of DSC thermograms of WPI at pH 7.0 and 100 mM NaCl
before and after pretreatments as in Figure 2-4.
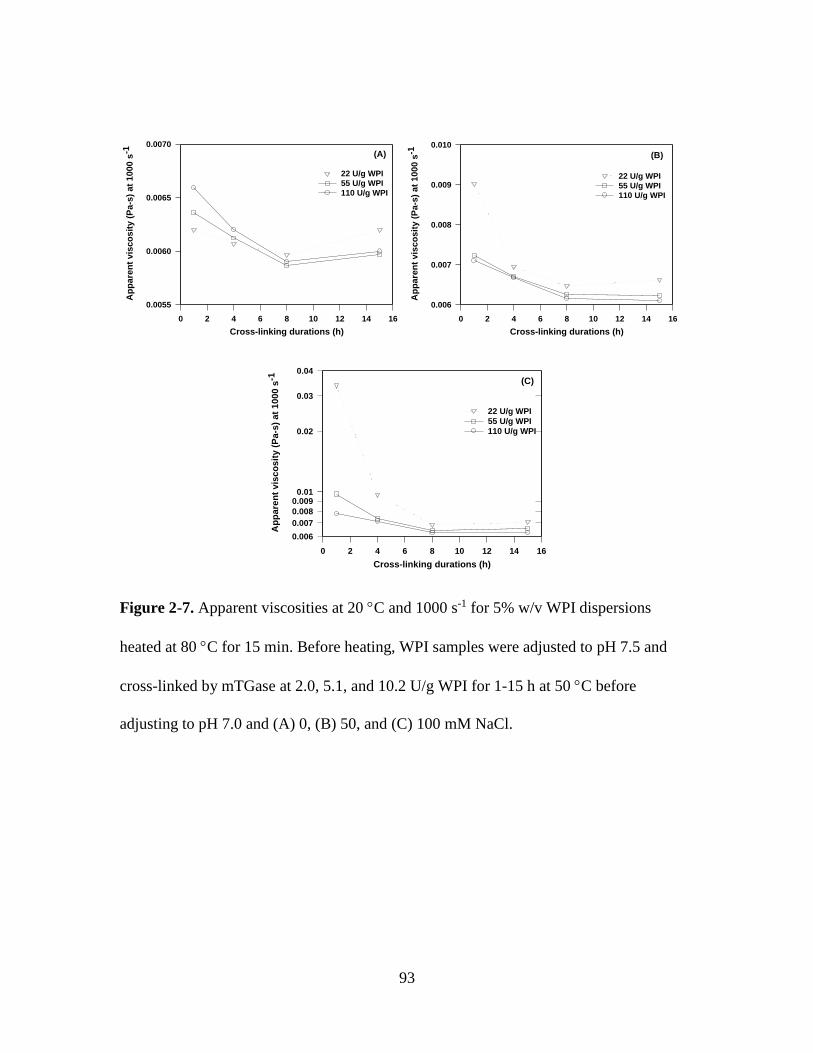
93
Cross-linking durations (h)
0 2 4 6 8 10 12 14 16
Ap
pare
nt
vis
co
sit
y (
Pa-s
) at
100
0 s
-1
0.0055
0.0060
0.0065
0.0070
22 U/g WPI
55 U/g WPI
110 U/g WPI
(A)
Cross-linking durations (h)
0 2 4 6 8 10 12 14 16
Ap
pare
nt
vis
co
sit
y (
Pa-s
) a
t 100
0 s
-1
0.006
0.007
0.008
0.009
0.010
22 U/g WPI
55 U/g WPI
110 U/g WPI
(B)
Cross-linking durations (h)
0 2 4 6 8 10 12 14 16
Ap
pa
ren
t v
isc
os
ity
(P
a-s
) a
t 1
00
0 s
-1
0.006
0.007
0.008
0.009
0.02
0.03
0.04
0.01
22 U/g WPI
55 U/g WPI
110 U/g WPI
(C)
Figure 2-7. Apparent viscosities at 20 C and 1000 s-1 for 5% w/v WPI dispersions
heated at 80 C for 15 min. Before heating, WPI samples were adjusted to pH 7.5 and
cross-linked by mTGase at 2.0, 5.1, and 10.2 U/g WPI for 1-15 h at 50 C before
adjusting to pH 7.0 and (A) 0, (B) 50, and (C) 100 mM NaCl.
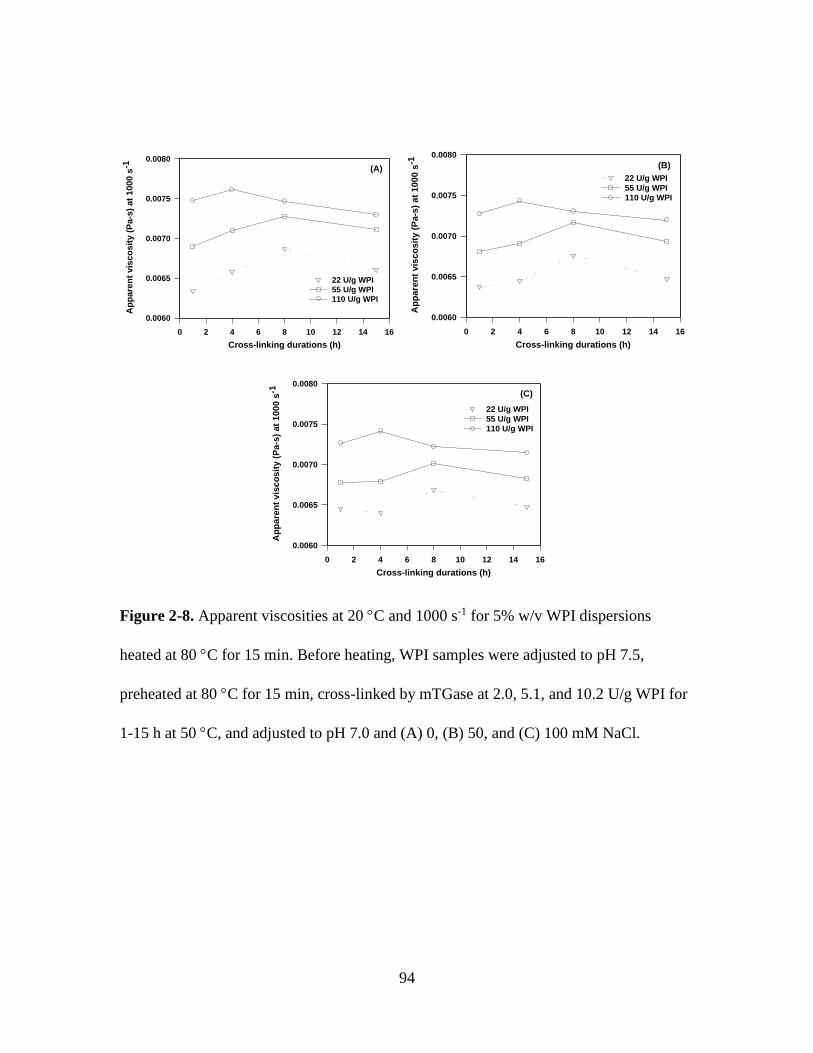
94
Cross-linking durations (h)
0 2 4 6 8 10 12 14 16
Ap
pare
nt
vis
co
sit
y (
Pa-s
) at
100
0 s
-1
0.0060
0.0065
0.0070
0.0075
0.0080
22 U/g WPI
55 U/g WPI
110 U/g WPI
(A)
Cross-linking durations (h)
0 2 4 6 8 10 12 14 16
Ap
pa
ren
t v
isc
os
ity
(P
a-s
) a
t 1
00
0 s
-1
0.0060
0.0065
0.0070
0.0075
0.0080
22 U/g WPI
55 U/g WPI
110 U/g WPI
(B)
Cross-linking durations (h)
0 2 4 6 8 10 12 14 16
Ap
pa
ren
t v
isc
os
ity
(P
a-s
) a
t 1
00
0 s
-1
0.0060
0.0065
0.0070
0.0075
0.0080
22 U/g WPI
55 U/g WPI
110 U/g WPI
(C)
Figure 2-8. Apparent viscosities at 20 C and 1000 s-1 for 5% w/v WPI dispersions
heated at 80 C for 15 min. Before heating, WPI samples were adjusted to pH 7.5,
preheated at 80 C for 15 min, cross-linked by mTGase at 2.0, 5.1, and 10.2 U/g WPI for
1-15 h at 50 C, and adjusted to pH 7.0 and (A) 0, (B) 50, and (C) 100 mM NaCl.
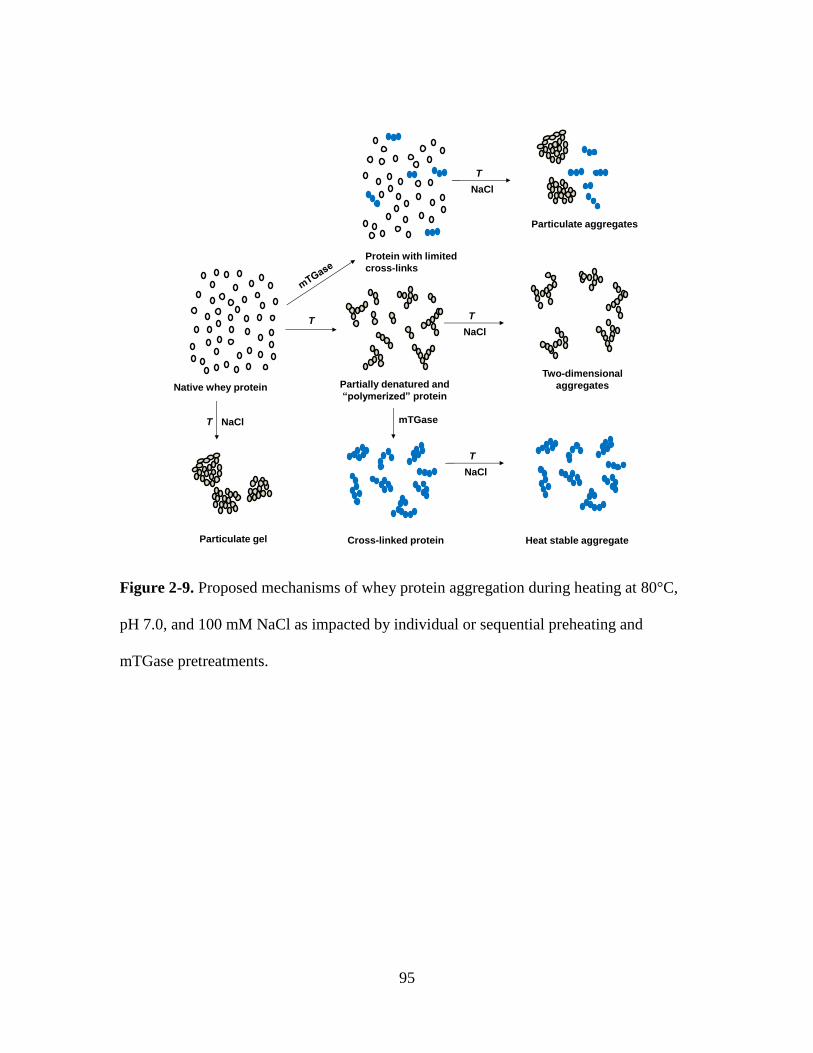
95
Native whey protein Partially denatured and
“polymerized” protein
T
Particulate aggregates
Protein with limited
cross-links
mTGase
T
NaCl
Heat stable aggregate
Two-dimensional
aggregates
NaClT
Particulate gel Cross-linked protein
T
NaCl
T
NaCl
Figure 2-9. Proposed mechanisms of whey protein aggregation during heating at 80°C,
pH 7.0, and 100 mM NaCl as impacted by individual or sequential preheating and
mTGase pretreatments.
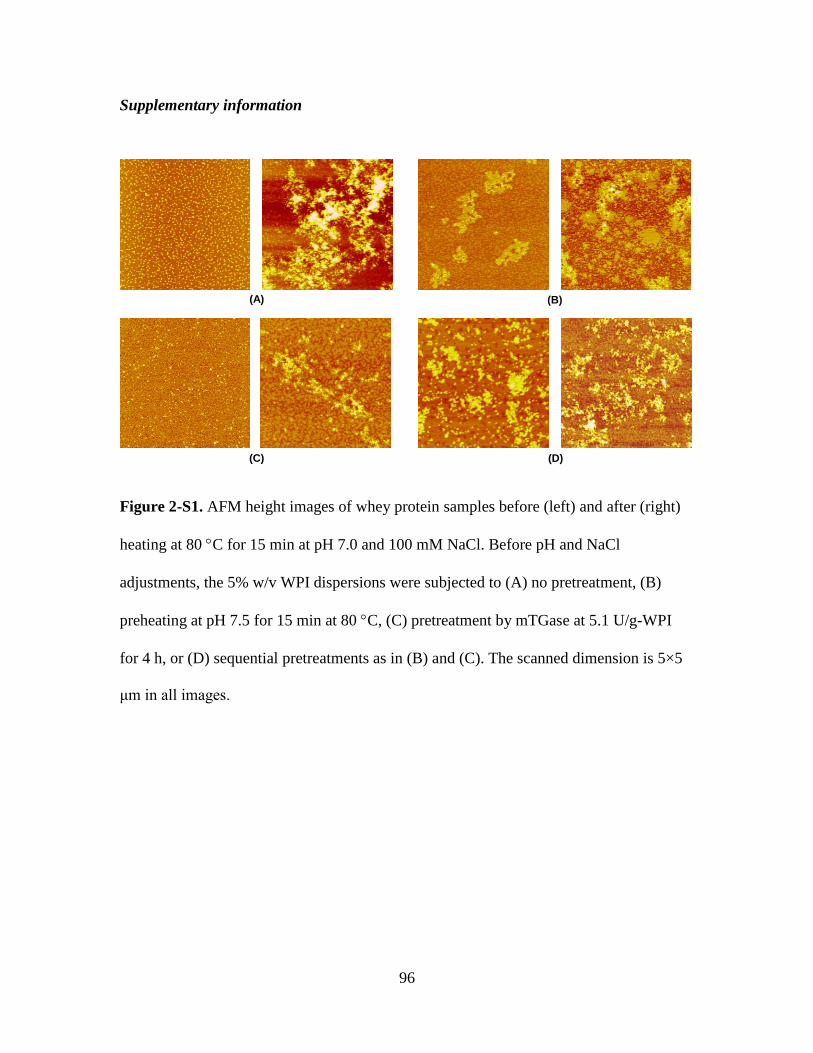
96
Supplementary information
(A) (B)
(C) (D)
Figure 2-S1. AFM height images of whey protein samples before (left) and after (right)
heating at 80 C for 15 min at pH 7.0 and 100 mM NaCl. Before pH and NaCl
adjustments, the 5% w/v WPI dispersions were subjected to (A) no pretreatment, (B)
preheating at pH 7.5 for 15 min at 80 C, (C) pretreatment by mTGase at 5.1 U/g-WPI
for 4 h, or (D) sequential pretreatments as in (B) and (C). The scanned dimension is 5×5
μm in all images.
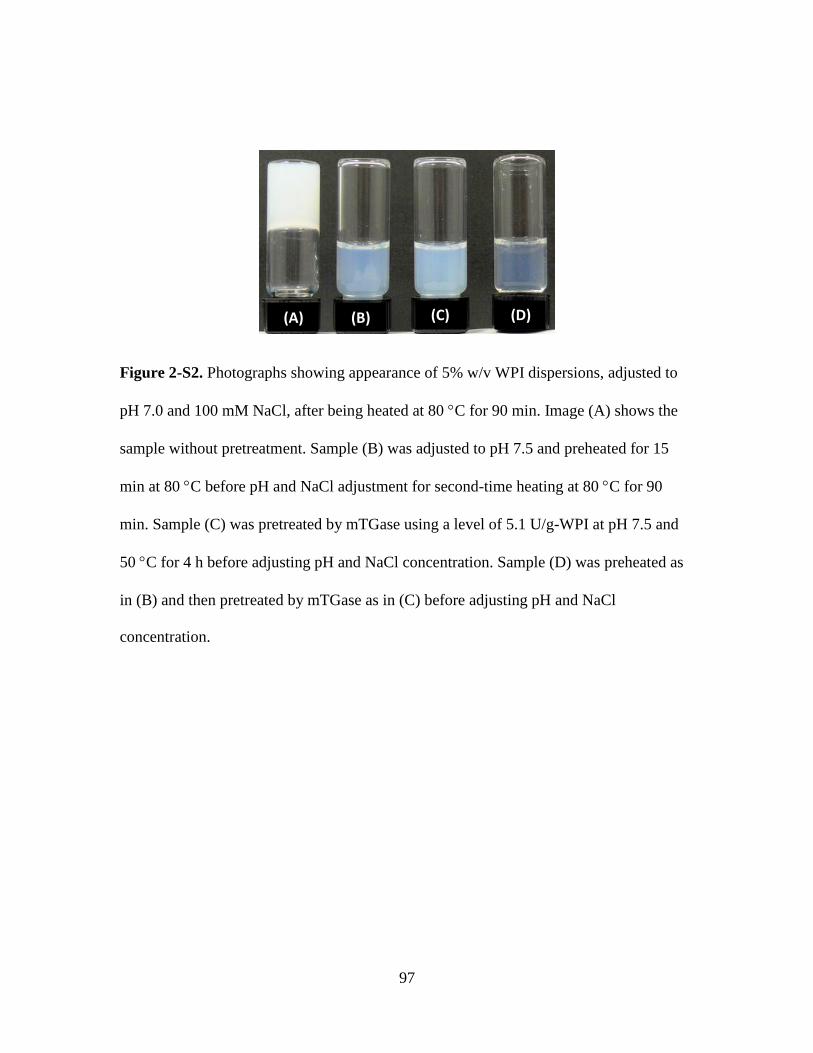
97
(A) (B) (C) (D)
Figure 2-S2. Photographs showing appearance of 5% w/v WPI dispersions, adjusted to
pH 7.0 and 100 mM NaCl, after being heated at 80 C for 90 min. Image (A) shows the
sample without pretreatment. Sample (B) was adjusted to pH 7.5 and preheated for 15
min at 80 C before pH and NaCl adjustment for second-time heating at 80 C for 90
min. Sample (C) was pretreated by mTGase using a level of 5.1 U/g-WPI at pH 7.5 and
50 C for 4 h before adjusting pH and NaCl concentration. Sample (D) was preheated as
in (B) and then pretreated by mTGase as in (C) before adjusting pH and NaCl
concentration.
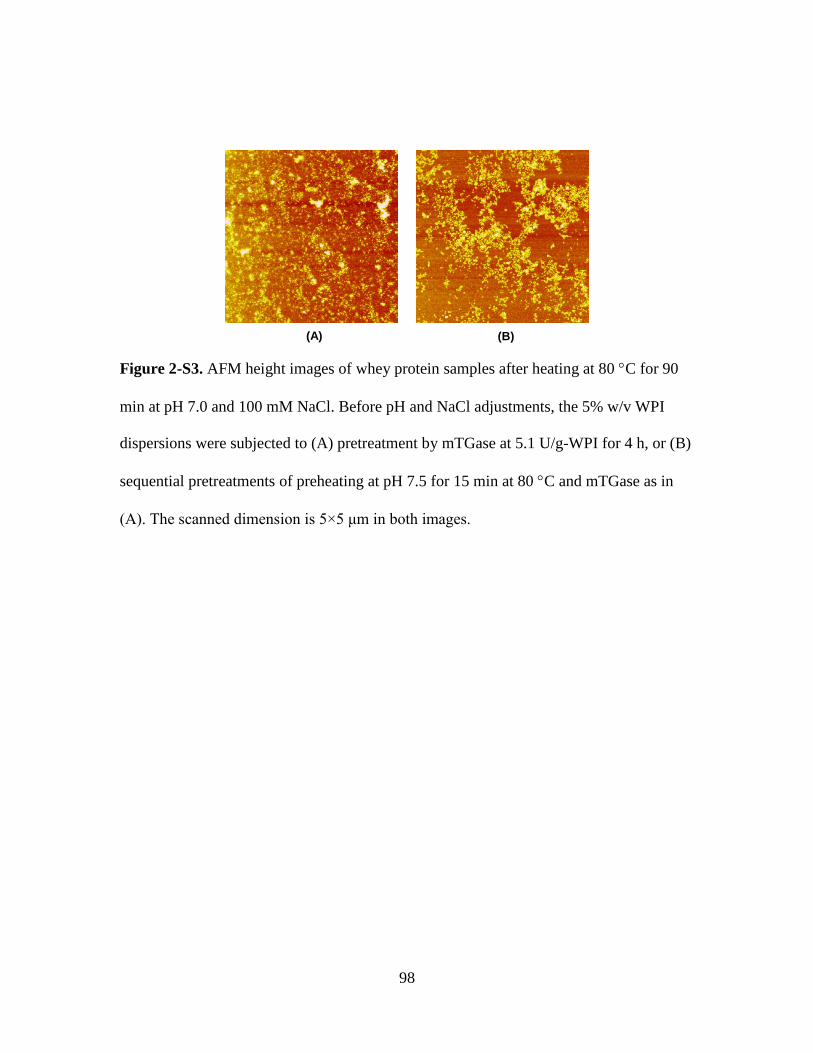
98
(A) (B)
Figure 2-S3. AFM height images of whey protein samples after heating at 80 C for 90
min at pH 7.0 and 100 mM NaCl. Before pH and NaCl adjustments, the 5% w/v WPI
dispersions were subjected to (A) pretreatment by mTGase at 5.1 U/g-WPI for 4 h, or (B)
sequential pretreatments of preheating at pH 7.5 for 15 min at 80 C and mTGase as in
(A). The scanned dimension is 5×5 μm in both images.
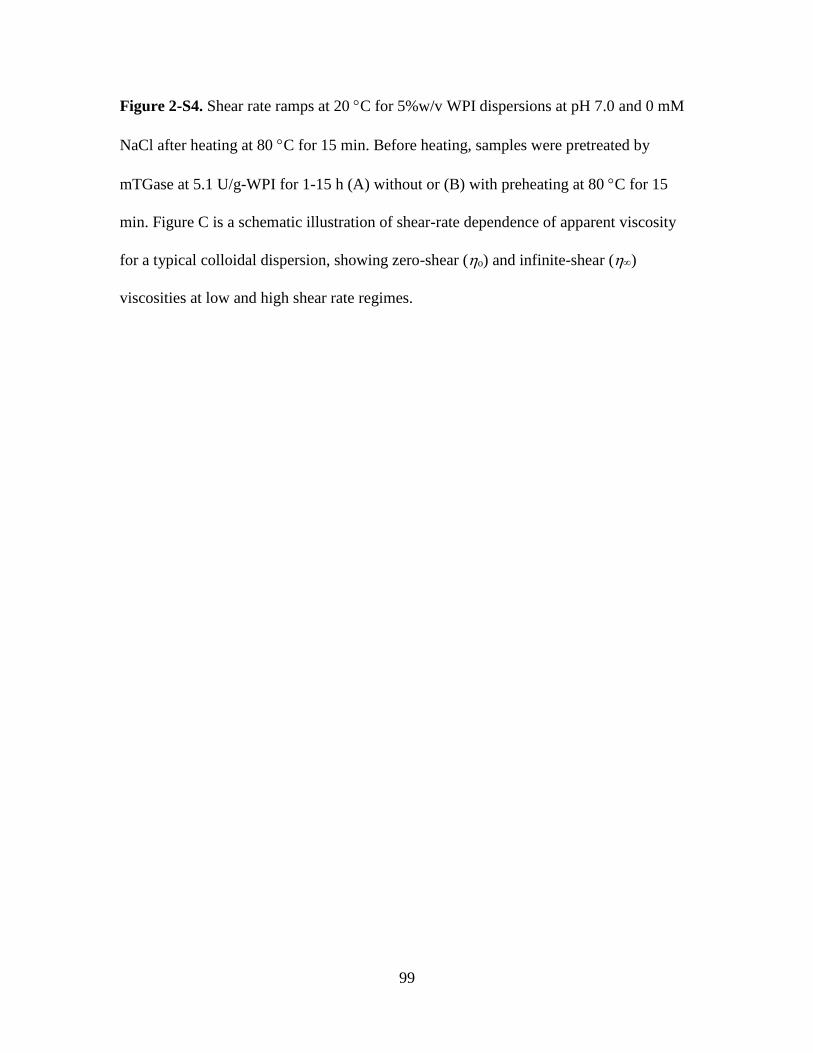
99
Figure 2-S4. Shear rate ramps at 20 C for 5%w/v WPI dispersions at pH 7.0 and 0 mM
NaCl after heating at 80 C for 15 min. Before heating, samples were pretreated by
mTGase at 5.1 U/g-WPI for 1-15 h (A) without or (B) with preheating at 80 C for 15
min. Figure C is a schematic illustration of shear-rate dependence of apparent viscosity
for a typical colloidal dispersion, showing zero-shear (o) and infinite-shear ()
viscosities at low and high shear rate regimes.
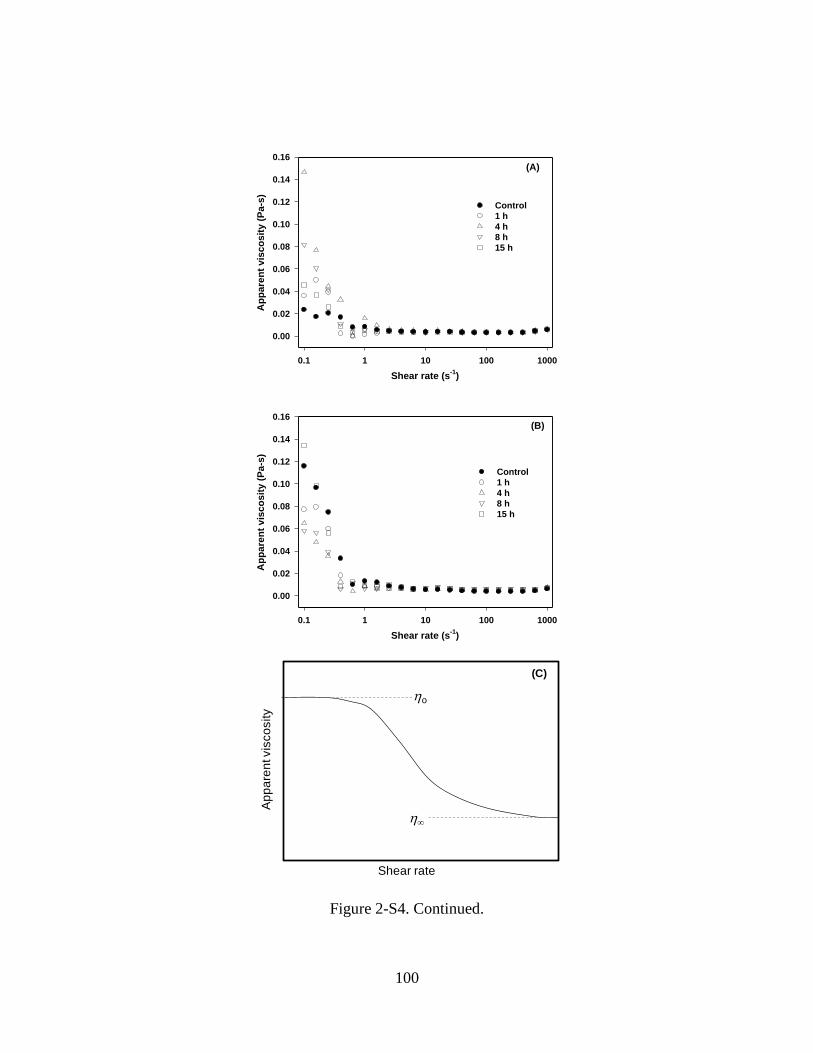
100
Shear rate (s-1
)
0.1 1 10 100 1000
Ap
pare
nt
vis
co
sit
y (
Pa-s
)
0.00
0.02
0.04
0.06
0.08
0.10
0.12
0.14
0.16
Control
1 h
4 h
8 h
15 h
(A)
Shear rate (s-1
)
0.1 1 10 100 1000
Ap
pare
nt
vis
co
sit
y (
Pa-s
)
0.00
0.02
0.04
0.06
0.08
0.10
0.12
0.14
0.16
Control
1 h
4 h
8 h
15 h
(B)
Ap
pa
ren
t vis
co
sity
o
Shear rate
(C)
Figure 2-S4. Continued.
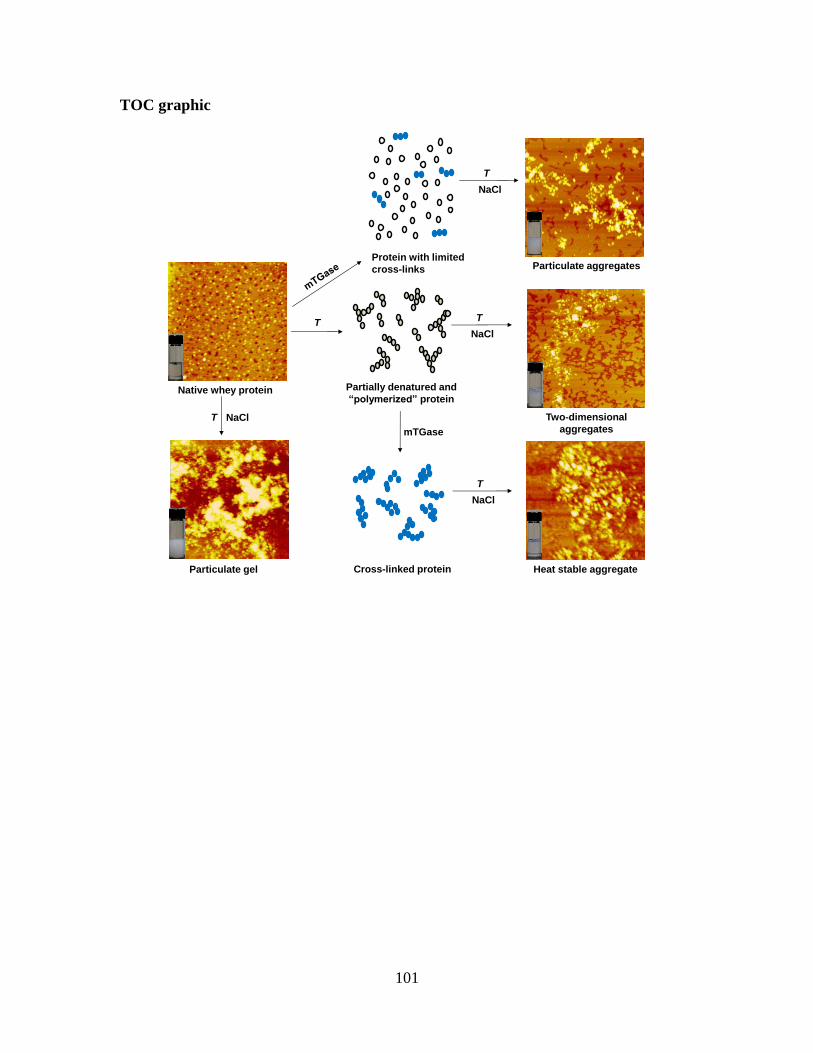
101
TOC graphic
Native whey protein Partially denatured and
“polymerized” protein
T
Particulate aggregatesProtein with limited
cross-links
mTGase
T
NaCl
Heat stable aggregate
Two-dimensional
aggregatesNaClT
Particulate gel Cross-linked protein
T
NaCl
T
NaCl
102
Chapter 3. Sequential Preheating and
Transglutaminase Pretreatments Improve
Stability of Whey Protein Isolate at pH 7.0 During
Thermal Sterilization
103
3.1 Abstract
Whey protein isolate (WPI) is a potential ingredient to manufacture shelf-stable
transparent beverages if proteins are heat stable, i.e., without causing turbidity,
precipitation and gelation after the required thermal processing to obtain commercial
sterility (138 C for 8 s or longer). However, the information is lacking about stability of
WPI during heating at 138 C. Furthermore, novel technology and mechanistic
understanding on how to produce clear products after heating systems with >5% WPI,
particularly with salt, is needed. In this work, 5%w/v WPI was pretreated by microbial
transglutaminase (mTGase) at three levels for 1-15 h at 50 C, with and without prior
preheating at 80 C for 15 min. Heat stability of pretreated samples at pH 7.0 and 0, 50,
and 100 mM NaCl was evaluated at 138 C. Samples directly pretreated by mTGase for a
greater extent demonstrated improved heat stability. For samples after sequential
preheating and mTGase pretreatments, clear dispersions were observed at 0 and 50 mM
NaCl even after heating at 138 C for 30 min. All pretreatments increased the magnitude
of zeta-potential and resistance against thermal denaturation. The sequentially-pretreated
WPI was the most heat-resistant, with decreasing hydrodynamic diameter (< 36 nm)
during extended heating at 138 C and 50 mM NaCl and the initially increased particle
height (< 12 nm) assessed in atomic force microscopy. The nanoscale particles enabled
transparent dispersions after heating. In contrast, other samples showed different extents
of aggregation at 50 mM NaCl, forming turbid dispersions or gels.

104
Keywords: whey protein, transglutaminase, thermal pretreatment, sterilization,
transparency
105
3.2 Introduction
Shelf-stable protein beverages as replacement diets supply required nutrients and
consumption convenience. To be shelf-stable, beverages are preferably clear after the
required sterilization using processes such as ultra-high temperature (UHT) processing at
138 C (280 F) for 8 s (McGarrahan, 1982). Therefore, heat stable protein ingredients
are needed to prevent turbidity, precipitation and gelation after thermal sterilization.
Based on our experience with several commercial whey protein isolate (WPI) supplies,
most WPI products maintain clarity after thermal treatment if pH is 3.5 and below, which
makes WPI a common choice to manufacture protein-based or -fortified clear beverages.
Furthermore, protein-containing beverages with acidity closer to neutral conditions may
reduce the consumption of carbohydrate and increase that of proteins (Etzel, 2004), and
those with additional mineral salts such as those found in sports drinks may present an
opportunity for product development.
At neutral pH, whey proteins, mainly -lactoglobulin, -lactalbumin, and bovine
serum albumin, exist at the molten globular state when heated at a temperature above
about 65 C (Bryant & McClements, 1998). The thermally denatured whey protein has
the increased zeta-potential and surface hydrophobicity than the native protein (Ryan,
Vardhanabhuti, Jaramillo, van Zanten, Coupland, & Foegeding, 2012). The extent of
whey protein aggregation depends on heating temperature and duration and is determined
by the overall impact of three types of molecular forces: electrostatic repulsion,
hydrophobic attraction, and intra- and inter-molecular disulfide bonds formed via
sulfhydryl-disulfide interchange (Baier & McClements, 2005; Bryant & McClements,
1998; de la Fuente, Singh, & Hemar, 2002; Foegeding, Davis, Doucet, & McGuffey,
106
2002). An increase in ionic strength shortens the Debye length and thus the effective
distance of electrostatic repulsion, favoring whey protein aggregation and forming bigger
aggregates after heating (Bryant & McClements, 1998; Schmitt, Bovay, Rouvet, Shojaei-
Rami, & Kolodziejczyk, 2007). Coarse protein aggregates cause turbid appearance and
precipitate during storage, which are infeasible for clear beverage products. Additionally,
thermal gelation of whey protein samples is commonly observed at neutral acidity,
moderate ionic strength and protein concentration (Bryant & McClements, 1998;
Foegeding, Davis, Doucet, & McGuffey, 2002). Therefore, maintaining dispersibility of
whey proteins and visual transparency of fluidic dispersions after thermal treatment,
referred as heat stability in this work, is important for producing relevant beverage
products.
Improving heat stability of whey proteins has been an active research topic in the
past two decades. Heat stability of single whey protein components and WPI at neutral
pH was improved after incorporating an appropriate amount of co-solutes such as
sucrose, glycerol, sorbitol (Baier & McClements, 2001; Chanasattru, Decker, &
McClements, 2007; Chantrapornchai & McClements, 2002; Kulmyrzaev, Bryant, &
McClements, 2000), and -casein with >90% purity (Yong & Foegeding, 2008).
Preheating WPI solutions dispersed in microemulsions to form nanometer-sized whey
protein particles was recently observed to improve the heat stability, further improved by
prior treatment using microbial transglutaminase (mTGase) (Zhang & Zhong, 2009;
Zhang & Zhong, 2010).
The mTGase is commonly used to cross-link proteins for strengthening gel
networks (Jaros, Partschefeld, Henle, & Rohm, 2006) but has also been observed to
107
improve heat stability of whey proteins (Tanimoto & Kinsella, 1998; Truong, Clare,
Catignani, & Swaisgood, 2004). Some studies applied denaturing agents such as
dithiothreitol (DTT) prior to mTGase pretreatment (Tanimoto & Kinsella, 1998; Truong,
Clare, Catignani, & Swaisgood, 2004), while others observed heat stability improvement
after extensive mTGase pretreatment, without the use of DTT (Agyare & Damodaran,
2010; Lorenzen, 2007; Tang & Ma, 2007). At present, it has not been reported for WPI
dispersions that maintain visual clarity after UHT processing at neutral acidity, moderate
NaCl concentration, and 5% or more protein. Supramolecular structure formation as
impacted by mTGase pretreatment also is to be studied.
The first objective of this work was to study heat stability of WPI at UHT
conditions after individual or sequential pretreatments of preheating and mTGase. The
second objective was to understand physicochemical changes due to pretreatments and
supramolecular structural changes during UHT processing. Heat stability of samples was
evaluated for 5% w/v WPI dispersions at pH 7.0 and with 0-100 mM NaCl after heating
at 138 C for 1-30 min. Physicochemical properties were characterized using a variety of
techniques interpreting changes of primary structures, surface charge properties, thermal
denaturation properties, and nanoscale structures. Surface charge properties determine the
magnitude of repulsive electrostatic interactions between whey proteins and are
commonly measured for zeta-potential that is assessed based on electrophoretic
properties of colloidal particles (Ryan, Vardhanabhuti, Jaramillo, van Zanten, Coupland,
& Foegeding, 2012; Schmitt, Bovay, Rouvet, Shojaei-Rami, & Kolodziejczyk, 2007).
Dynamic light scattering (DLS) and atomic force microscopy (AFM) were used to
characterize nanoscale structures. DLS is commonly used to evaluate hydrodynamic
108
radius of whey protein structures after heating in dispersions (Schmitt, Bovay, Rouvet,
Shojaei-Rami, & Kolodziejczyk, 2007; Unterhaslberger, Schmitt, Sanchez, Appolonia-
Nouzille, & Raemy, 2006). AFM has been used to characterize detailed topographical
information of heat-induced structural formation of whey proteins without complicated
sample preparations, e.g., fine-stranded and particulate structures in our early study after
heating at neutral acidity with low and high ionic strengths, respectively (Ikeda & Morris,
2002).
3.3 Materials and methods
3.3.1 Materials
WPI was obtained from Hilmar Ingredients, Inc (Hilmar, CA). The product had
95% protein (dry-basis) according to the manufacturer. The Activa TG-TI mTGase in the
powdered form was a product from Ajinomoto Food Ingredients, LLC (Chicago, IL). The
brochure from the manufacturer indicated that the enzyme activity is optimum at 50 C
and pH 7.0. Double-distilled water and other chemicals were procured from Fisher
Scientific (Pittsburgh, PA).
3.3.2 Determination of mTGase activity
The freshly-prepared mTGase solution was quantified for activity using the
method of Sigma-Aldrich for TGase (EC 2.3.2.13). One unit (U) of activity was defined
as the ability of an enzyme sample to catalyze the formation of 1 mol hydroxamate per
min when substrates of N-carbobenzoxy-glutaminyl-glycine and hydroxylamine were
incubated with the enzyme at pH 7.0 and 50 C.
109
3.3.3 Pretreatment protocol
WPI powders were hydrated at 5% w/v in 50 mM sodium phosphate overnight at
room temperature. For preheating whey proteins, samples were adjusted to pH 7.5 using
1 N NaOH, heated in an 80 C water bath for 15 min, and immediately cooled in a room
temperature water bath. To cross-link whey proteins by mTGase, WPI samples, with or
without preheating, were adjusted to pH 7.5 using 4 N NaOH, dissolved with mTGase
powder to 2, 5, and 10% mass of WPI, incubated in a 50 C water bath for different
durations, and cooled in a room temperature water bath. pH 7.5 was chosen from the
literature mTGase cross-linking conditions (Truong, Clare, Catignani, & Swaisgood,
2004). The pretreated samples were adjusted to pH 7.0 using 1 N HCl, and 1.0 mL
aliquots of samples were transferred into 4.0 mL vials. To adjust NaCl concentration, a
5.0 M NaCl solution was pre-prepared in distilled water. Each WPI sample vial was
supplemented with 10 or 20 L of the 5.0 M NaCl solution, yielding a final NaCl
concentration of 50 or 100 mM, respectively. The untreated control was the 5% w/v WPI
solution directly adjusted to the same pH and NaCl concentrations using similar
procedures.
3.3.4 Sodium dodecyl sulfate polyacrylamide gel electrophoresis (SDS-PAGE)
The SDS-PAGE was performed under the reducing conditions using a Mini
Protean Tetra Cell (Bio-Rad Laboratories, Inc., Hercules, CA) at a constant voltage of
200 V. The 18% Tris-HCl gel (Ready Gel Precast Gel) was from Bio-Rad Laboratories,
Inc. (Hercules, CA). The gel was stained with Coomassie Blue.
110
3.3.5 Evaluation of heat stability
Although the continuous UHT process requires 138 C for 8 s (McGarrahan,
1982), samples were heated for 1, 5, or 30 min in a glycerol bath maintained at 138 C.
The shortest time of 1 min was longer than 8 s because of the need to address the come-
up time required to reach the target temperature in entire sample vials. The two additional
heating durations were used to better understand the structural changes of whey protein
during sterilization. After heating, the vials were immediately cooled in a room-
temperature water bath. Samples were then photographed and measured for absorbance at
400 and 600 nm using a UV/Vis spectrophotometer (model Biomate 5, Thermo Electron
Corporation, Woburn, MA).
3.3.6 Differential scanning calorimetry (DSC)
The influence of pretreatment on thermal denaturation properties of whey protein
was studied using a differential scanning calorimeter (model Q2000, TA Instrument, New
Castle, DE). The samples containing 5% w/v protein were pretreated as above and
adjusted to pH 7.0 with 100 mM NaCl. For samples pretreated by mTGase alone or
sequential preheating and mTGase, the enzyme powder was used at 5% of WPI mass and
the cross-linking duration was 4 h. The scanning was conducted from 25 to 105 °C at a
rate of 1.5 °C/min, and an empty cell was used as a reference. To facilitate the
examination of samples after various pretreatments, baseline adjustment was applied
(Bruylants, Wouters, & Michaux, 2005; Gauche, Barreto, & Bordignon-Luiz, 2010;
Giancola, De Sena, Fessas, Graziano, & Barone, 1997). The thermographs were
processed by using the instrument analysis software (TA Instrument, New Castle, DE).
111
3.3.7 Dynamic light scattering (DLS)
The particle size distribution of WPI dispersions was measured using a model
DelsaTM Nano particle size/zeta-potential analyzer (Beckman Coulter, Inc., Brea, CA). To
prevent gelation, the WPI dispersions were prepared at 5% w/v protein in deionized water
instead of 50 mM phosphate buffer. After pretreatments and supplementing with 0 and 50
mM NaCl, samples were heated at 138 °C for 1, 5 and 30 min and diluted using 0.01 M
phosphate buffer (pH 7.0) to an appropriate concentration for DLS. The measurements
were carried out on two replicates and the volume-length mean particle diameter (d4,3)
was calculated according to equation (1).
1
3
1
4
3,4
i
ii
i
ii
dn
dn
d (1)
where ni is the number of particles of a diameter di.
3.3.8 Zeta-potential
Impacts of pretreatments on zeta-potential of WPI were analyzed using the
DelsaTM Nano particle size/zeta-potential analyzer (Beckman Coulter Inc., Brea. CA).
The dispersions were adjusted to pH 7.0 and diluted to 0.5% w/v using a 50 mM sodium
phosphate buffer adjusted to pH 7.0. Two replicates were tested for three times each.
3.3.9 Atomic force microscopy (AFM)
The WPI dispersions were diluted in deionized water to an overall protein
concentration of 10 ppm. Four μL of each diluted sample was spread evenly onto freshly
cleaved mica sheets that were mounted on sample disks (Bruker Corp., Santa Barbara,
CA) for AFM. A rectangular cantilever having an aluminum reflective coating on the
112
backside and a quoted force constant of 2.80 N/m (FESPA, Bruker Corp., Santa Barbara,
CA) and a Multimode microscope (Veeco Instruments, Inc. Plainview, NY) operated in
the tapping mode were used to scan the sample. Both topographical and phase images
were generated with a preset scan area of 22 μm. Topographical images were used to
measure heights of individual particles.
3.3.10 Statistical analysis
Statistical differences were analyzed using post-hoc comparison of means
according to the least-significant-difference (LSD) mean separation method at a p level of
0.05. The SAS software (version 9.2, SAS Institute, Cary, NC) was used in analyses.
3.4 Results and discussion
3.4.1 mTGase levels used in pretreatment
The mTGase activity was estimated to be 102.1 U/g powder. When the powdered
mTGase sample was used at 2, 5, and 10% mass of WPI, this corresponded to an
activity/substrate level of ca. 2.0, 5.1, and 10.2 U/g-WPI.
3.4.2 Structures of WPI analyzed by SDS-PAGE
SDS-PAGE patterns of selected samples are presented in Figure 3-1. Compared to
native WPI, preheating alone did not apparently change the pattern of protein bands
because the SDS-PAGE buffer disrupts any possible physical and chemical (disulfide)
bonds formed during heating, as reported elsewhere (Zhang & Zhong, 2009). For the
WPI sample directly treated by mTGase at a level of 5.1 U/g-WPI for 4 h without
preheating, the lower molecular weight band corresponding to -lactalbumin (MW =
14.1 kDa (Swaisgood, 1996) became very vague, and the density of band corresponding
113
to -lactoglobulin (MW = 18.4 kDa (Swaisgood, 1996) decreased slightly. The upper
section of the lane showed smearing areas, indicating the weakened bands of -
lactalbumin and -lactoglobulin resulted from cross-linking by mTGase. For samples
sequentially treated by preheating and mTGase at a level of 5.1 U/g-WPI, the band
patterns were similar for the 4 treatment durations from 1 to 15 h that showed significant
reduction of bands corresponding to -lactalbumin and -lactoglobulin, significant
smearing in the upper molecular weight regimes of lanes, and a significant portion of
cross-linked whey proteins that remained in the sample loading wells. The mTGase has a
molecular weight of ~40 kDa (Jaros, Partschefeld, Henle, & Rohm, 2006) and appeared
in the gel for samples applying the enzyme.
Native whey proteins are not very susceptible to cross-linking by mTGase (Han &
Damodaran, 1996) possibly because glutamine and lysine groups involved in the cross-
linking reaction are buried within the protein core and inaccessible for the enzyme
(Cozzolino, Di Pierro, Mariniello, Sorrentino, Masi, & Porta, 2003). It was also
recognized that native and preheated -lactalbumin is cross-linked by mTGase more
easily than -lactoglobulin (Rodriguez-Nogales, 2006a). Therefore, the band
corresponding to -lactalbumin diminished to a greater extent than -lactoglobulin after
mTGase treatment (Figure 3-1). Preheating (Han & Damodaran, 1996; Rodriguez-
Nogales, 2006b; Sharma, Zakora, & Qvist, 2002) or denaturation using a reducing agent
such as DTT (Aboumahmoud & Savello, 1990; Gauche, Vieira, Ogliari, & Bordignon-
Luiz, 2008; Sharma, Zakora, & Qvist, 2002; Truong, Clare, Catignani, & Swaisgood,
2004) facilitates the cross-linking of whey proteins greatly. Although the SDS-PAGE
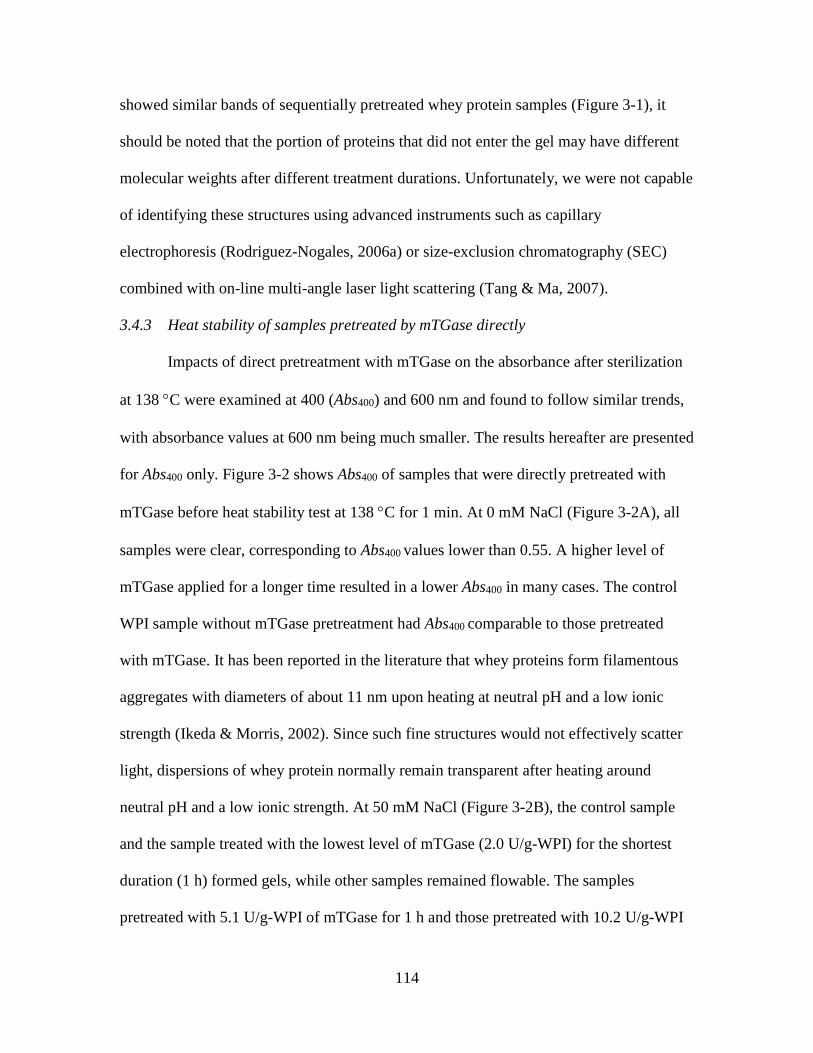
114
showed similar bands of sequentially pretreated whey protein samples (Figure 3-1), it
should be noted that the portion of proteins that did not enter the gel may have different
molecular weights after different treatment durations. Unfortunately, we were not capable
of identifying these structures using advanced instruments such as capillary
electrophoresis (Rodriguez-Nogales, 2006a) or size-exclusion chromatography (SEC)
combined with on-line multi-angle laser light scattering (Tang & Ma, 2007).
3.4.3 Heat stability of samples pretreated by mTGase directly
Impacts of direct pretreatment with mTGase on the absorbance after sterilization
at 138 C were examined at 400 (Abs400) and 600 nm and found to follow similar trends,
with absorbance values at 600 nm being much smaller. The results hereafter are presented
for Abs400 only. Figure 3-2 shows Abs400 of samples that were directly pretreated with
mTGase before heat stability test at 138 C for 1 min. At 0 mM NaCl (Figure 3-2A), all
samples were clear, corresponding to Abs400 values lower than 0.55. A higher level of
mTGase applied for a longer time resulted in a lower Abs400 in many cases. The control
WPI sample without mTGase pretreatment had Abs400 comparable to those pretreated
with mTGase. It has been reported in the literature that whey proteins form filamentous
aggregates with diameters of about 11 nm upon heating at neutral pH and a low ionic
strength (Ikeda & Morris, 2002). Since such fine structures would not effectively scatter
light, dispersions of whey protein normally remain transparent after heating around
neutral pH and a low ionic strength. At 50 mM NaCl (Figure 3-2B), the control sample
and the sample treated with the lowest level of mTGase (2.0 U/g-WPI) for the shortest
duration (1 h) formed gels, while other samples remained flowable. The samples
pretreated with 5.1 U/g-WPI of mTGase for 1 h and those pretreated with 10.2 U/g-WPI
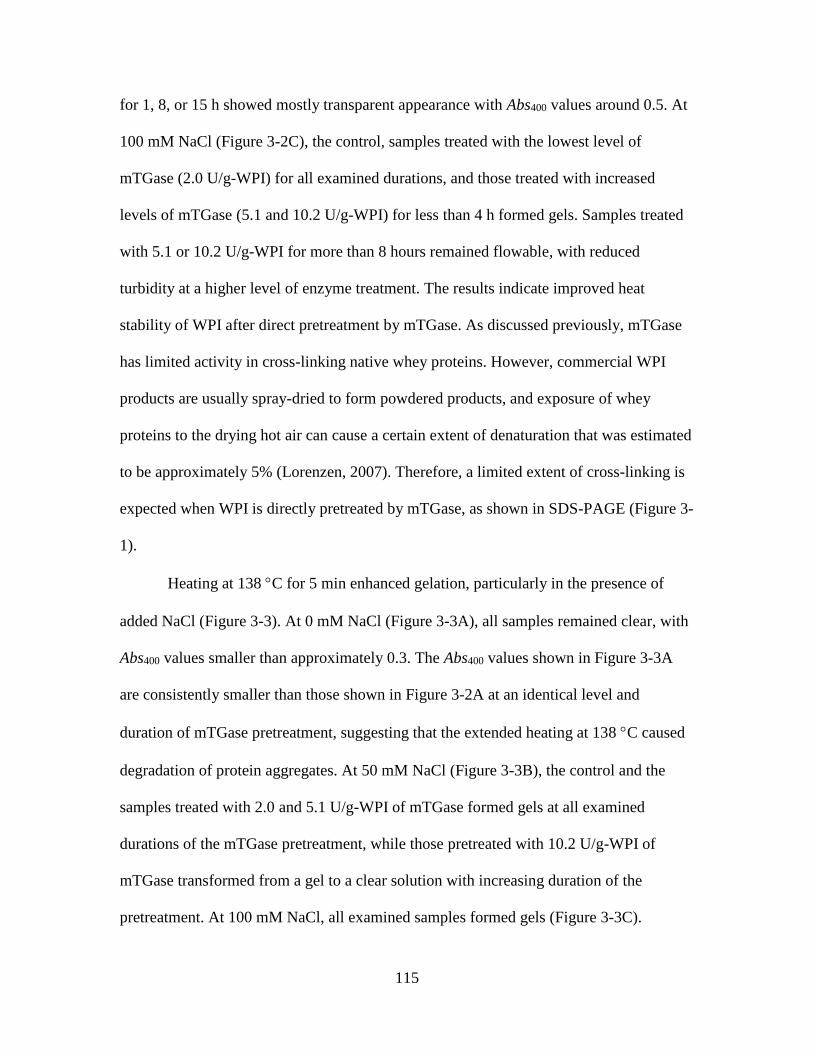
115
for 1, 8, or 15 h showed mostly transparent appearance with Abs400 values around 0.5. At
100 mM NaCl (Figure 3-2C), the control, samples treated with the lowest level of
mTGase (2.0 U/g-WPI) for all examined durations, and those treated with increased
levels of mTGase (5.1 and 10.2 U/g-WPI) for less than 4 h formed gels. Samples treated
with 5.1 or 10.2 U/g-WPI for more than 8 hours remained flowable, with reduced
turbidity at a higher level of enzyme treatment. The results indicate improved heat
stability of WPI after direct pretreatment by mTGase. As discussed previously, mTGase
has limited activity in cross-linking native whey proteins. However, commercial WPI
products are usually spray-dried to form powdered products, and exposure of whey
proteins to the drying hot air can cause a certain extent of denaturation that was estimated
to be approximately 5% (Lorenzen, 2007). Therefore, a limited extent of cross-linking is
expected when WPI is directly pretreated by mTGase, as shown in SDS-PAGE (Figure 3-
1).
Heating at 138 C for 5 min enhanced gelation, particularly in the presence of
added NaCl (Figure 3-3). At 0 mM NaCl (Figure 3-3A), all samples remained clear, with
Abs400 values smaller than approximately 0.3. The Abs400 values shown in Figure 3-3A
are consistently smaller than those shown in Figure 3-2A at an identical level and
duration of mTGase pretreatment, suggesting that the extended heating at 138 C caused
degradation of protein aggregates. At 50 mM NaCl (Figure 3-3B), the control and the
samples treated with 2.0 and 5.1 U/g-WPI of mTGase formed gels at all examined
durations of the mTGase pretreatment, while those pretreated with 10.2 U/g-WPI of
mTGase transformed from a gel to a clear solution with increasing duration of the
pretreatment. At 100 mM NaCl, all examined samples formed gels (Figure 3-3C).
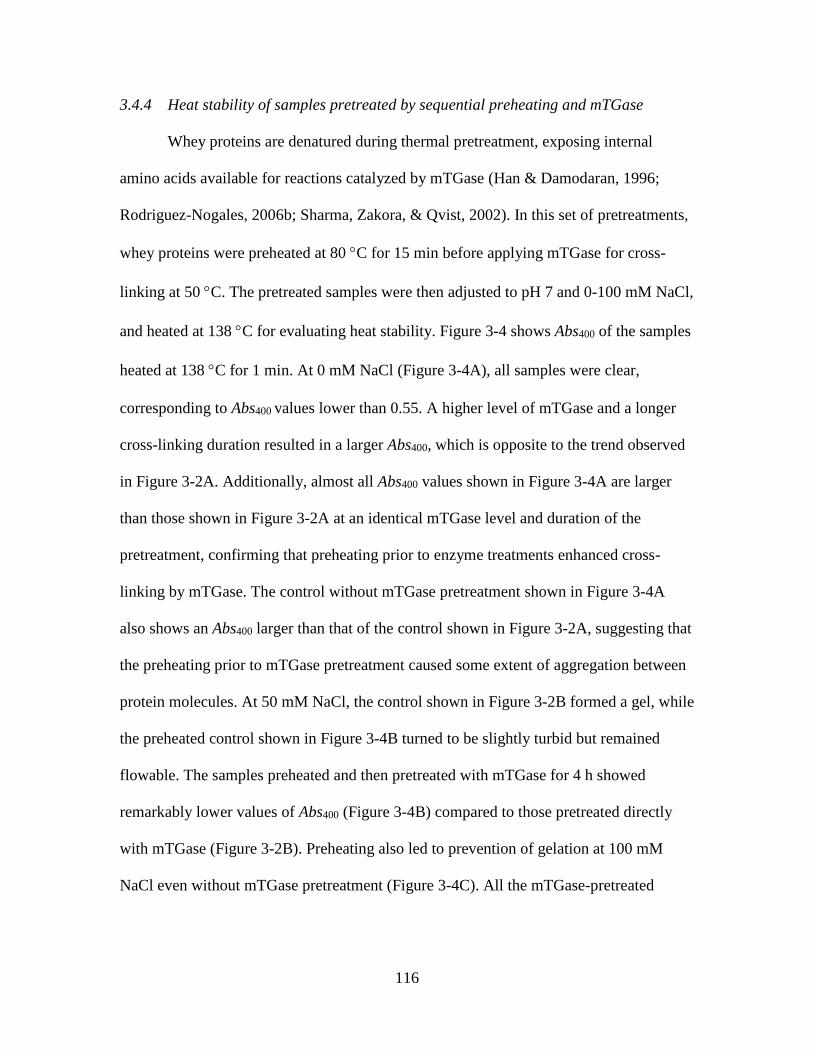
116
3.4.4 Heat stability of samples pretreated by sequential preheating and mTGase
Whey proteins are denatured during thermal pretreatment, exposing internal
amino acids available for reactions catalyzed by mTGase (Han & Damodaran, 1996;
Rodriguez-Nogales, 2006b; Sharma, Zakora, & Qvist, 2002). In this set of pretreatments,
whey proteins were preheated at 80 C for 15 min before applying mTGase for cross-
linking at 50 C. The pretreated samples were then adjusted to pH 7 and 0-100 mM NaCl,
and heated at 138 C for evaluating heat stability. Figure 3-4 shows Abs400 of the samples
heated at 138 C for 1 min. At 0 mM NaCl (Figure 3-4A), all samples were clear,
corresponding to Abs400 values lower than 0.55. A higher level of mTGase and a longer
cross-linking duration resulted in a larger Abs400, which is opposite to the trend observed
in Figure 3-2A. Additionally, almost all Abs400 values shown in Figure 3-4A are larger
than those shown in Figure 3-2A at an identical mTGase level and duration of the
pretreatment, confirming that preheating prior to enzyme treatments enhanced cross-
linking by mTGase. The control without mTGase pretreatment shown in Figure 3-4A
also shows an Abs400 larger than that of the control shown in Figure 3-2A, suggesting that
the preheating prior to mTGase pretreatment caused some extent of aggregation between
protein molecules. At 50 mM NaCl, the control shown in Figure 3-2B formed a gel, while
the preheated control shown in Figure 3-4B turned to be slightly turbid but remained
flowable. The samples preheated and then pretreated with mTGase for 4 h showed
remarkably lower values of Abs400 (Figure 3-4B) compared to those pretreated directly
with mTGase (Figure 3-2B). Preheating also led to prevention of gelation at 100 mM
NaCl even without mTGase pretreatment (Figure 3-4C). All the mTGase-pretreated
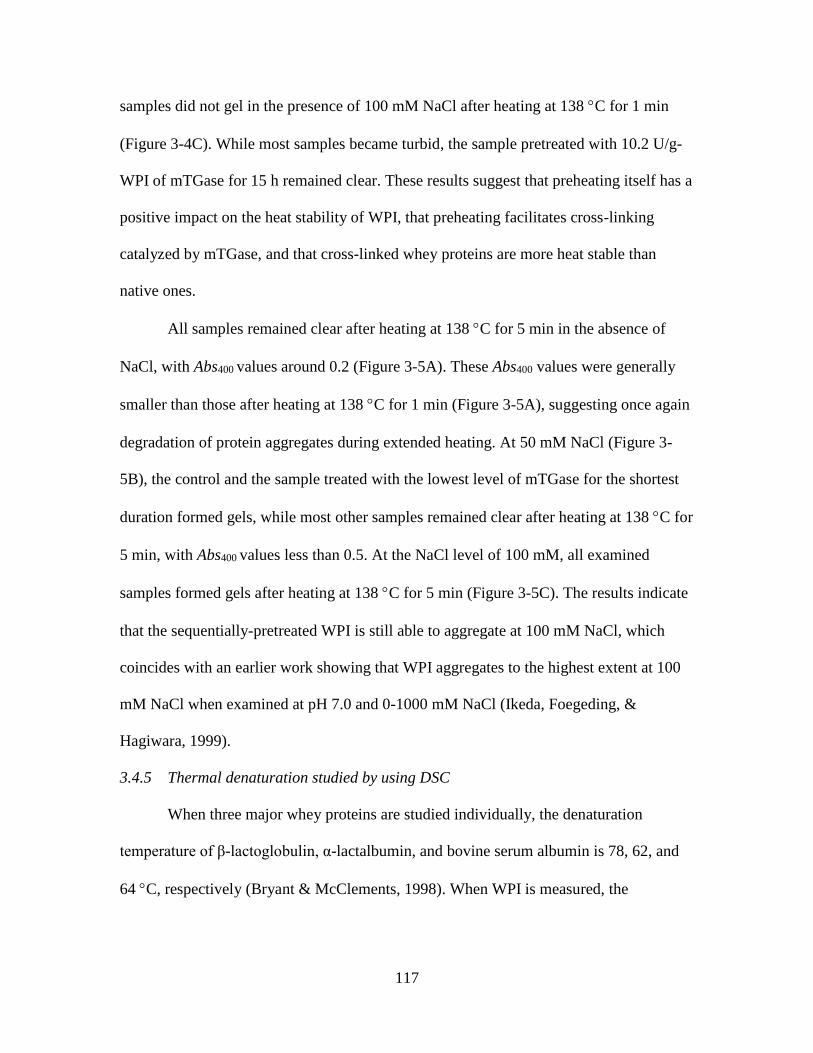
117
samples did not gel in the presence of 100 mM NaCl after heating at 138 C for 1 min
(Figure 3-4C). While most samples became turbid, the sample pretreated with 10.2 U/g-
WPI of mTGase for 15 h remained clear. These results suggest that preheating itself has a
positive impact on the heat stability of WPI, that preheating facilitates cross-linking
catalyzed by mTGase, and that cross-linked whey proteins are more heat stable than
native ones.
All samples remained clear after heating at 138 C for 5 min in the absence of
NaCl, with Abs400 values around 0.2 (Figure 3-5A). These Abs400 values were generally
smaller than those after heating at 138 C for 1 min (Figure 3-5A), suggesting once again
degradation of protein aggregates during extended heating. At 50 mM NaCl (Figure 3-
5B), the control and the sample treated with the lowest level of mTGase for the shortest
duration formed gels, while most other samples remained clear after heating at 138 C for
5 min, with Abs400 values less than 0.5. At the NaCl level of 100 mM, all examined
samples formed gels after heating at 138 C for 5 min (Figure 3-5C). The results indicate
that the sequentially-pretreated WPI is still able to aggregate at 100 mM NaCl, which
coincides with an earlier work showing that WPI aggregates to the highest extent at 100
mM NaCl when examined at pH 7.0 and 0-1000 mM NaCl (Ikeda, Foegeding, &
Hagiwara, 1999).
3.4.5 Thermal denaturation studied by using DSC
When three major whey proteins are studied individually, the denaturation
temperature of β-lactoglobulin, α-lactalbumin, and bovine serum albumin is 78, 62, and
64 C, respectively (Bryant & McClements, 1998). When WPI is measured, the
118
denaturation temperature represents the overall mixture, which was measured to be 74.6
C in a study at pH 7.0 and 0 mM NaCl (Ibanoglu, 2005). In the present study, DSC
profiles of WPI after different pretreatments were characterized at 100 mM NaCl. A
sharp endothermic peak centered on ca. 77 C was observed for untreated WPI (Figure 3-
6A), slightly higher than the reported 74.6 C at 0 mM NaCl (Ibanoglu, 2005). The WPI
pretreated by mTGase only at 5.1 U/g-WPI for 4 h also showed an endothermic peak at
around 75 C (Figure 3-6C), likely because of limited cross-linking at these conditions
(Figure 3-1). This peak became broader for the preheated WPI (Figure 3-6B) and almost
unidentifiable for the sequentially-pretreated WPI (Figure 3-6D). The DSC results
indicate that treatment using mTGase only for 4 h did not significantly change
denaturation properties of whey protein. Preheating caused irreversible denaturation of
whey protein, but the preheating conditions in this work (80 C for 15 min) did not
induce complete denaturation. The sequentially-pretreated whey protein demonstrated
very limited further thermal denaturation. The DSC profiles generally agree with
observations of heat stability evaluated at 138 C for 1 min for samples with 100 mM
NaCl, in the order of sequentially-pretreated > preheated > mTGase-pretreated >
untreated (Figures 3-2 and 3-4).
3.4.6 Particle size and zeta-potential after pretreatments
The d4,3 of WPI dispersions before and after pretreatments at pH 7.0 is listed in
Table 3-1. Direct pretreatment of WPI using 5.1 U/g-WPI of mTGase for 4 h increased
d4,3 slightly but the increase was insignificant. Preheating significantly increased d4,3 that
further increased significantly after mTGase pretreatment. The d4,3 changes agree with
119
SDS-PAGE in Figure 3-1 and the literature showing native WPI is not an active substrate
of mTGase (Han & Damodaran, 1996) but is reactive after preheating (Han &
Damodaran, 1996; Rodriguez-Nogales, 2006a; Sharma, Zakora, & Qvist, 2002).
Table 3-2 presents zeta-potential of WPI dispersions at pH 7.0 before and after
pretreatments. The -24.45 mV of native WPI dispersion at pH 7.0 is in agreement with
the -24.6 mV at pH 6.8 in a study (Ryan, Vardhanabhuti, Jaramillo, van Zanten,
Coupland, & Foegeding, 2012). The increase in zeta-potential was insignificant after
direct pretreatment of WPI using 5.1 U/g-WPI of mTGase for 4 h. Preheating
significantly increased zeta-potential of WPI that remained unchanged after further
mTGase cross-linking. Thermal denaturation is thus the major factor in changing the
distribution of charged surface amino acids of whey proteins. The sequentially-pretreated
WPI was more resistant to thermal aggregation than the preheated WPI at increased ionic
strength (Figures 3-4, 3-5, and 3-7; Table 3-1), but both samples had similar zeta-
potential (Table 3-2). This suggests that electrostatic repulsion is not the mechanism
responsible for the improved heat stability of the sequentially-pretreated WPI.
Conversely, because denaturation precedes aggregation during heating at neutral pH, the
increased resistance against thermal denaturation (Figure 3-6) is the major contributor to
the improved heat stability of WPI after sequential pretreatments. However, because
denaturation properties were evaluated below 100 C, structural changes during heating
at 138 C were further studied, presented below.
120
3.4.7 Structure changes of pretreated whey proteins after heating at 138 C
Figure 3-7 shows photographs of WPI dispersions after heating at 138 C for up
to 30 min in the absence or presence of 50 mM NaCl. All the dispersions without NaCl
remained clear after heating at 138 C for 30 min. In the presence of 50 mM NaCl,
dispersions without any pretreatment and those treated with either preheating at 80 C for
15 min or mTGase turned into turbid dispersions or even gelled after heating at 138 C
for 5 min. The samples sequentially pretreated first with heating at 80 C for 15 min and
then with 5.1 U/g-WPI of mTGase remained clear after heating at 138 C for 30 min even
in the presence of 50 mM NaCl. Samples heated for 30 min had darkened color, likely
due to thermal decomposition of organic matter.
The d4,3 changes after heating at 138 C are presented in Table 3-1. Native WPI
and that directly pretreated by mTGase showed initial aggregation after heating for 1 min,
followed by the decrease in particle size upon further heating. In contrast, preheated WPI,
with and without subsequent mTGase pretreatment showed a monotonic decrease in d4,3
when heated at 0 mM NaCl. At 50 mM NaCl, the d4,3 of preheated WPI increased after 1-
min heating, likely because there is a fraction of WPI that can still be denatured after
preheating at the studied conditions (Figure 3-6) and aggregate similarly to native WPI
during heating at 138 C. Conversely, the sequentially-pretreated WPI showed no
increase in d4,3 after heating. The reduction in particle size at 0 mM NaCl is responsible
for the lowered absorbance of samples when heating was increased from 1 min to 5 min
(Figures 2-5). Furthermore, the significantly bigger particles (P < 0.05) after heating at 50
mM NaCl than at 0 mM NaCl for samples with preheating or mTGase pretreatment only
121
agree with the expectation that a higher ionic strength weakens electrostatic repulsion and
facilitates protein aggregation (Bryant & McClements, 1998; Schmitt, Bovay, Rouvet,
Shojaei-Rami, & Kolodziejczyk, 2007).
When β-lactoglobulin A was heated at pH 6.4 up to 180 C, complimentary data
from native and reducing SDS-PAGE, with and without 2-mecaptoethanol, DSC,
viscosity, amino acid analysis, and particle size analysis suggested that protein
aggregation occurred up to 113 C, followed by collapsing of initially formed aggregates
at a temperature higher than about 113 C and decomposition of β-lactoglobulin A above
around 140 C due to hydrolysis of peptide bonds (Photchanachai & Kitabatake, 2001).
By reviewing studies of heating β-lactoglobulin at pH above 6.8, it was suggested that, in
addition to primary unfolding events at around 65-75 C, decomposition of disulfide
bonds formed at lower temperatures is possible above 125 C, which is accompanied by
complete unfolding of all amino acid residues (de Wit, 2009). At the early stage of
heating at 138 C, native WPI and those pretreated by preheating or mTGase only are
denatured to different extents, and the denatured proteins aggregate. As aggregation and
decomposition are both controlled by reaction kinetics, it is likely that aggregation
dominates initially, followed by the domination of structural reorganization and thermal
decomposition of aggregated proteins at longer heating times. This is evident for
macroscopic observations (Figure 3-7) of samples heated with 50 mM NaCl at different
durations, especially for the native WPI sample that formed a gel after heating for 5 min,
followed by macroscopic structure collapse at a longer heating time. This also agrees
with d4,3 data in Table 3-1. Conversely, the sequentially pretreated WPI is resistant
122
against thermal denaturation and therefore subsequent aggregation, showing transparent
samples (Figure 3-7) and a monotonic decrease in d4,3 at a longer heating duration (Table
3-1).
To further understand nanoscale structure changes of whey proteins, AFM studies
were carried out for samples sequentially pretreated with heating and mTGase. The AFM
image shows that native whey proteins were mostly spherical particles, with a portion
present as dimers or trimers (Figure 3-8A), corresponding to particle heights smaller than
3.5 nm. The estimated particle heights are similar to the literature AFM study of β-
lactoglobulin (height = 2.2 nm) (Ikeda & Morris, 2002) and light scattering studies that
reported the hydrodynamic radius of -lactoglobulin, -lactalbumin, and bovine serum
albumin to be 2.6-4.9 (Parker, Noel, Brownsey, Laos, & Ring, 2005), 2.0 (Molek &
Zydney, 2007), and 3.7 nm (Brownsey, Noel, Parker, & Ring, 2003), respectively. The
presence of dimeric whey protein structures also agrees with the well-known fact that β-
lactoglobulin forms dimers at pH 7 (Adams, Anderson, Norris, Creamer, & Jameson,
2006; Haug, Skar, Vegarud, Langsrud, & Draget, 2009). After sequential pretreatment,
aggregates (Figure 3-8B) with particle height of 6.34 nm (Table 3-3) were observed. The
AFM and DLS results suggest that cross-linking of preheated whey proteins by mTGase
occurs among a few to several whey protein molecules. Furthermore, the particle heights
measured in AFM were consistently smaller than d4,3 from DLS. In DLS, d4,3 is an
indication of hydrodynamic diameter occupied by the entire structure, while the particle
height indicates the dimension at only one direction. Sample drying in AFM can also
reduce the overall dimension. Additionally, samples were diluted to 10 ppm in AFM, and
the dilution may separate weakly flocculated structures that are measured in DLS.
123
After heating at 138 C for 1 and 30 min, particular structures were observed
(Figure 3-8). At 0 mM NaCl, particle heights did not increase significantly after heating
(Table 3-3). At 50 mM NaCl, particle heights almost doubled after heating for 1 min,
followed by no significant increase after heating for 30 min. The AFM images suggest
that the cross-linked whey proteins are resistant against aggregation and are disassociated
during heating at 138 C. The increased height of mostly spherical particles likely results
from the melting and reorganization of aggregated whey proteins during heating at 138
C. The complimentary results from AFM and DLS thus unveiled nanoscale structure
changes of WPI after pretreatments and during UHT processing.
3.5 Conclusion
Preheating WPI at 80 C for 15 min or direct pretreatment with varied levels of
mTGase was observed to have improved the stability of WPI dispersions during
sterilization at neutral pH to certain extents, while the sequential pretreatments first with
heat and then with mTGase significantly enhanced the heat stability of WPI. The
sequentially-pretreated WPI dispersions remained transparent after heating at 138 C for
30 min in the presence of 0 and 50 mM NaCl at pH 7. Analysis of nanostructure changes
revealed that cross-linking by mTGase occurred between a few to several whey protein
molecules. The increased resistance against thermal denaturation was responsible for the
improved heat stability of sequentially-pretreated WPI at 50 mM NaCl. When heated for
a longer time at 138 C, the cross-linked whey proteins were dissociated and reformed to
bigger particles, and the resultant nanoscale particles (< 40 nm based on DLS, < 13 nm
124
based on AFM) enabled transparent dispersions. The present study demonstrates the
feasibility of using sequential pre-heating and mTGase pretreatments to develop sterilized
beverage products with a high content (5%w/v) of whey protein and yet of transparent
appearance at ambient temperatures.
Acknowledgements
This work was supported by the University of Tennessee and Dairy Research
Institute. The authors thank Ajinomoto for supplying the transglutaminase sample.
125
References
Aboumahmoud, R., & Savello, P. (1990). Crosslinking of whey protein by
transglutaminase. Journal of Dairy Science, 73, 256-263.
Adams, J. J., Anderson, B. F., Norris, G. E., Creamer, L. K., & Jameson, G. B. (2006).
Structure of bovine beta-lactoglobulin (variant A) at very low ionic strength.
Journal of Structural Biology, 154, 246-254.
Agyare, K. K., & Damodaran, S. (2010). pH-stability and thermal properties of microbial
transglutaminase-treated whey protein isolate. Journal of Agricultural and Food
Chemistry, 58, 1946-1953.
Baier, S., & McClements, D. J. (2001). Impact of preferential interactions on thermal
stability and gelation of bovine serum albumin in aqueous sucrose solutions.
Journal of Agricultural and Food Chemistry, 49, 2600-2608.
Baier, S. K., & McClements, D. J. (2005). Influence of cosolvent systems on the gelation
mechanism of globular protein: Thermodynamic, kinetic, and structural aspects of
globular protein gelation Comprehensive Reviews in Food Science and Food
Safety, 4, 43-54.
Brownsey, G. J., Noel, T. R., Parker, R., & Ring, S. G. (2003). The glass transition
behavior of the globular protein bovine serum albumin. Biophysics Journal, 85,
3943-3950.
Bruylants, G., Wouters, J., & Michaux, C. (2005). Differential scanning calorimetry in
life science: thermodynamics, stability, molecular recognition and application in
drug design. Current Medicinal Chemistry, 12(17), 2011-2020.
Bryant, C. M., & McClements, D. J. (1998). Molecular basis of protein functionality with
special consideration of cold-set gels derived from heat-denatured whey. Trends
in Food Science and Technology, 9, 143-151.
Chanasattru, W., Decker, E. A., & McClements, D. J. (2007). Modulation of thermal
stability and heat-induced gelation of -lactoglobulin by high glycerol and
sorbitol levels. Food Chemistry, 103, 512-520.
Chantrapornchai, W., & McClements, D. J. (2002). Influence of glycerol on optical
properties and large-strain rheology of heat-induced whey protein isolate gels.
Food Hydrocolloids, 16, 461-466.
Cozzolino, A., Di Pierro, P., Mariniello, L., Sorrentino, A., Masi, P., & Porta, R. (2003).
Incorporation of whey proteins into cheese curd by using transglutaminase.
Biotechnology and Applie Biochemistry, 38, 289-295.
de la Fuente, M. A., Singh, H., & Hemar, Y. (2002). Recent advances in the
characterisation of heat-induced aggregates and intermediates of whey proteins.
Trends in Food Science and Technology, 13, 262-274.
de Wit, J. N. (2009). Thermal behaviour of bovine β-lactoglobulin at temperatures up to
150 °C. A review. Trends in Food Science & Technology, 20(1), 27-34.
Etzel, M. R. (2004). Manufacture and use of dairy protein fractions. Journal of Nutrition,
134, 996S-1002S.
Foegeding, E. A., Davis, J. P., Doucet, D., & McGuffey, M. K. (2002). Advances in
modifying and understanding whey protein functionality. Trends in Food Science
and Technology, 13, 151-159.
126
Gauche, C., Barreto, P. L. M., & Bordignon-Luiz, M. T. (2010). Effect of thermal
treatment on whey protein polymerization by transglutaminase: Implications for
functionality in processed dairy foods. LWT-Food Science and Technology, 43(2),
214-219.
Gauche, C., Vieira, J. T. C., Ogliari, P. J., & Bordignon-Luiz, M. T. (2008). Crosslinking
of milk whey proteins by transglutaminase. Process Biochemistry, 43, 788-794.
Giancola, C., De Sena, C., Fessas, D., Graziano, G., & Barone, G. (1997). DSC studies
on bovine serum albumin denaturation Effects of ionic strength and SDS
concentration. International Journal of Biological Macromolecules, 20(3), 193-
204.
Han, X. Q., & Damodaran, S. (1996). Thermodynamic compatibility of substrate proteins
affects their cross-linking by transglutaminase. Journal of Agricultural and Food
Chemistry, 44, 1211-1217.
Haug, I. J., Skar, H. M., Vegarud, G. E., Langsrud, T., & Draget, K. I. (2009).
Electrostatic effects on beta-lactoglobulin transitions during heat denaturation as
studied by differential scanning calorimetry. Food Hydrocolloids, 23, 2287-2293.
Ibanoglu, E. (2005). Effect of hydrocolloids on the thermal denaturation of proteins.
Food Chemistry, 90, 621-626.
Ikeda, S., Foegeding, E. A., & Hagiwara, T. (1999). Rheological study on the fractal
nature of the protein gel structure. Langmuir, 15, 8584-8589.
Ikeda, S., & Morris, V. J. (2002). Fine-stranded and particulate aggregates of heat-
denatured whey proteins visualized by atomic force microscopy.
Biomacromolecules, 3, 382-389.
Jaros, D., Partschefeld, C., Henle, T., & Rohm, H. (2006). Transglutaminase in dairy
products: Chemistry, physics, applications. Journal of Texture Studies, 37, 113-
155.
Kulmyrzaev, A., Bryant, C., & McClements, D. J. (2000). Influence of sucrose on the
thermal denaturation, gelation, and emulsion stabilization of whey proteins.
Journal of Agricultural and Food Chemistry, 48, 1593-1597.
Lorenzen, P. C. (2007). Effects of varying time/temperature-conditions of pre-heating
and enzymatic cross-linking on techno-functional properties of reconstituted dairy
ingredients. Food Research International, 40, 700-708.
McGarrahan, E. T. (1982). Considerations necessary to provide for sterilized milk and
milk products in htermetically sealed, nonrefrigetated containers. Journal of
Dairy Science, 65, 2023-2034.
Molek, J. R., & Zydney, A. L. (2007). Separation of PEGylated -lactalbumin from
unreacted precursors and byproducts using ultrafiltration. Biotechnology
Progress, 23, 1417 - 1424.
Parker, R., Noel, T. R., Brownsey, G. J., Laos, K., & Ring, S. G. (2005). The
Nonequilibrium Phase and Glass Transition Behavior of -Lactoglobulin.
Biophysics Journal, 89, 1227-1236.
Photchanachai, S., & Kitabatake, N. (2001). Heating of beta-lactoglobulin A solution in a
closed system at high temperatures. Journal of Food Science, 66(5), 647-652.
Rodriguez-Nogales, J. M. (2006a). Effect of preheat treatment on the transglutaminase-
catalyzed cross-linking of goat milk proteins. Process Biochemistry, 41, 430-437.
127
Rodriguez-Nogales, J. M. (2006b). Enhancement of transglutaminase-induce protein
cross-linking by preheat treatment of cows' milk: A statistical approach.
International Dairy Journal, 16, 26-32.
Ryan, K., Vardhanabhuti, B., Jaramillo, D., van Zanten, J., Coupland, J., & Foegeding, E.
(2012). Stability and mechanism of whey protein soluble aggregates thermally
treated with salts. Food Hydrocolloids, 27, 411-420.
Schmitt, C., Bovay, C., Rouvet, M., Shojaei-Rami, S., & Kolodziejczyk, E. (2007). Whey
protein soluble aggregates from heating with NaCl: physicochemical, interfacial,
and foaming properties. Langmuir, 23, 4155-4166.
Sharma, R., Zakora, M., & Qvist, K. B. (2002). Susceptibility of an industrial a-
lactalbumin concentrate to cross-linking by microbial transglutaminase.
International Dairy Journal, 12, 1005-1012.
Swaisgood, H. E. (1996). Characteristics of milk. In O. R. Fenneman (Ed.), Food
Chemistry (Third ed., pp. 841-878): Marcel Dekker, Inc.: New York.
Tang, C. H., & Ma, C. Y. (2007). Modulation of the thermal stability of β-lactoglobulin
by transglutaminase treatment. European Food Research and Technology, 225,
649-652.
Tanimoto, S. Y., & Kinsella, J. E. (1988). Enzymatic modification of proteins: effects of
transglutaminase cross-linking on some physical properties of -lactoglobulin.
Journal of Agricultural and Food Chemistry, 36, 281-285.
Truong, V. D., Clare, D. A., Catignani, G. L., & Swaisgood, H. E. (2004). Cross-linking
and rheological changes of whey proteins treated with microbial transglutaminase.
Journal of Agricultural and Food Chemistry, 52, 1170-1176.
Unterhaslberger, G., Schmitt, C., Sanchez, C., Appolonia-Nouzille, C., & Raemy, A.
(2006). Heat denaturation and aggregation of β-lactoglobulin enriched WPI in the
presence of arginine HCl, NaCl and guanidinium HCl at pH 4.0 and 7.0. Food
Hydrocolloids, 20, 1006-1019.
Yong, Y. H., & Foegeding, E. A. (2008). Effects of caseins on thermal stability of bovine
b-lactoglobulin. Journal of Agricultural and Food Chemistry, 56, 10352-10358.
Zhang, W., & Zhong, Q. (2009). Microemulsions as Nanoreactors to produce whey
protein nanoparticles with enhanced heat stability by sequential enzymatic cross-
linking and thermal pretreatments. Journal of Agricultural and Food Chemistry,
57, 9181-9189.
Zhang, W., & Zhong, Q. (2010). Microemulsions as nanoreactors to produce whey
protein nanoparticles with enhanced heat stability by thermal pretreatment. Food
Chemistry, 119, 1318-1325.
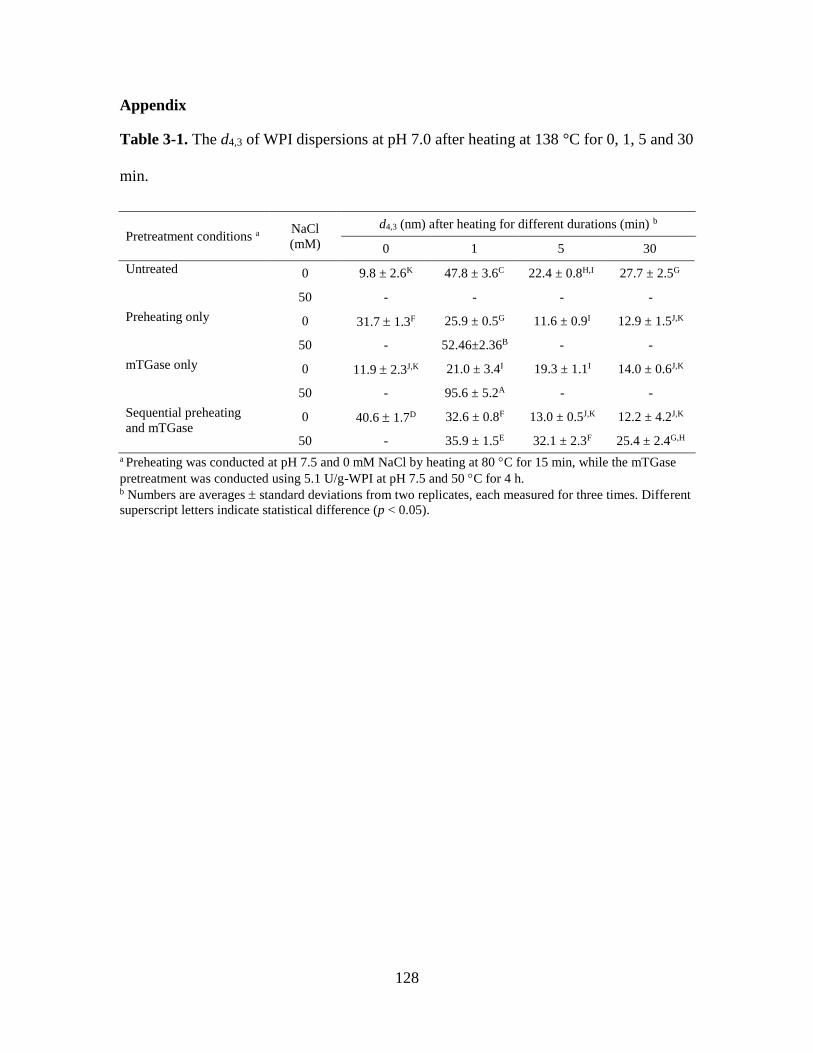
128
Appendix
Table 3-1. The d4,3 of WPI dispersions at pH 7.0 after heating at 138 °C for 0, 1, 5 and 30
min.
Pretreatment conditions a NaCl
(mM)
d4,3 (nm) after heating for different durations (min) b
0 1 5 30
Untreated 0 9.8 ± 2.6K 47.8 ± 3.6C 22.4 ± 0.8H,I 27.7 ± 2.5G
50 - - - -
Preheating only 0 31.7 1.3F 25.9 ± 0.5G 11.6 ± 0.9I 12.9 ± 1.5J,K
50 - 52.46±2.36B - -
mTGase only 0 11.9 2.3J,K 21.0 ± 3.4I 19.3 ± 1.1I 14.0 ± 0.6J,K
50 - 95.6 ± 5.2A - -
Sequential preheating
and mTGase 0 40.6 1.7D 32.6 ± 0.8F 13.0 ± 0.5J,K 12.2 ± 4.2J,K
50 - 35.9 ± 1.5E 32.1 ± 2.3F 25.4 ± 2.4G,H
a Preheating was conducted at pH 7.5 and 0 mM NaCl by heating at 80 C for 15 min, while the mTGase
pretreatment was conducted using 5.1 U/g-WPI at pH 7.5 and 50 C for 4 h. b Numbers are averages standard deviations from two replicates, each measured for three times. Different
superscript letters indicate statistical difference (p < 0.05).
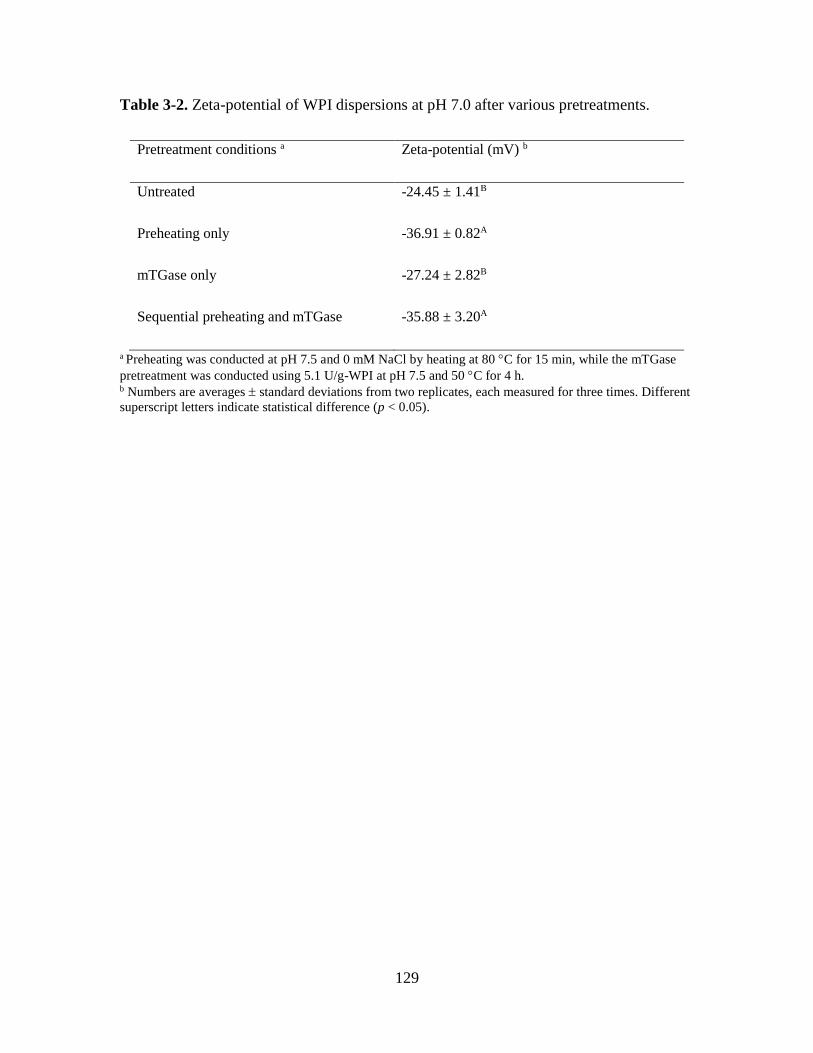
129
Table 3-2. Zeta-potential of WPI dispersions at pH 7.0 after various pretreatments.
Pretreatment conditions a Zeta-potential (mV) b
Untreated -24.45 ± 1.41B
Preheating only -36.91 ± 0.82A
mTGase only -27.24 ± 2.82B
Sequential preheating and mTGase -35.88 ± 3.20A
a Preheating was conducted at pH 7.5 and 0 mM NaCl by heating at 80 C for 15 min, while the mTGase
pretreatment was conducted using 5.1 U/g-WPI at pH 7.5 and 50 C for 4 h. b Numbers are averages standard deviations from two replicates, each measured for three times. Different
superscript letters indicate statistical difference (p < 0.05).
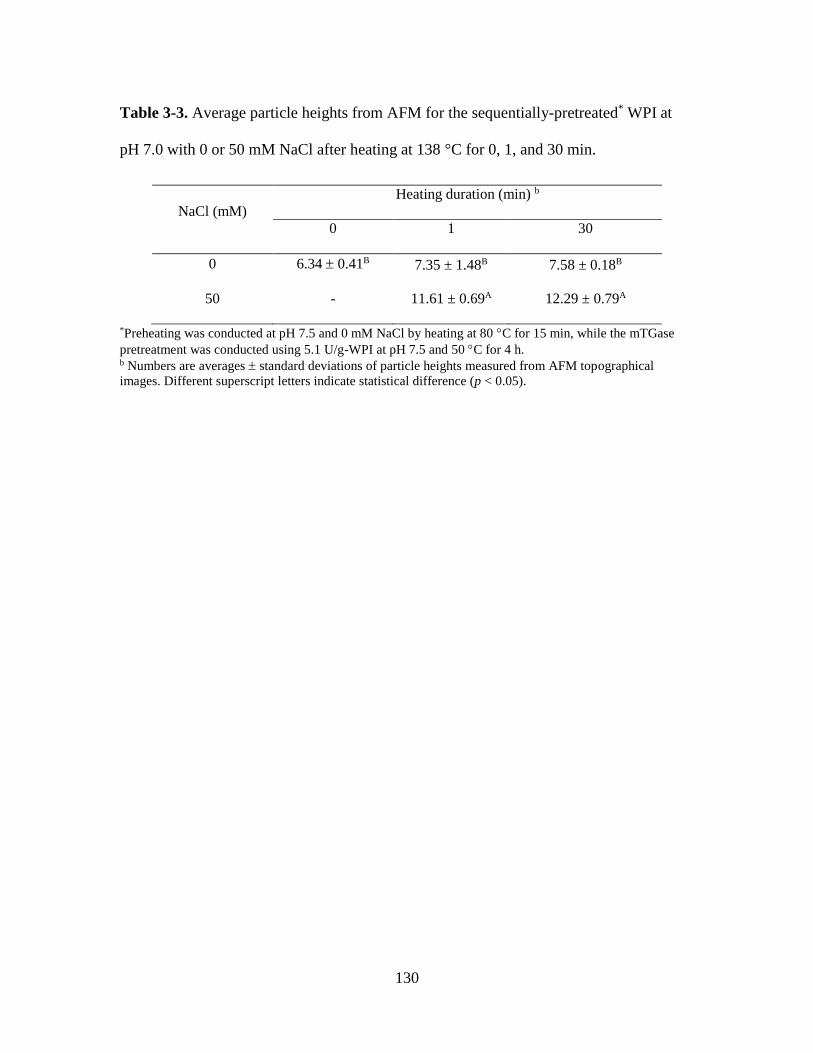
130
Table 3-3. Average particle heights from AFM for the sequentially-pretreated* WPI at
pH 7.0 with 0 or 50 mM NaCl after heating at 138 °C for 0, 1, and 30 min.
NaCl (mM) Heating duration (min) b
0 1 30
0 6.34 0.41B 7.35 ± 1.48B 7.58 ± 0.18B
50 - 11.61 ± 0.69A 12.29 ± 0.79A
*Preheating was conducted at pH 7.5 and 0 mM NaCl by heating at 80 C for 15 min, while the mTGase
pretreatment was conducted using 5.1 U/g-WPI at pH 7.5 and 50 C for 4 h. b Numbers are averages standard deviations of particle heights measured from AFM topographical
images. Different superscript letters indicate statistical difference (p < 0.05).

131
MW (kDa) MW (kDa)
Figure 3-1. SDS-PAGE patterns of WPI after various treatments. Lane codes: MWS =
molecular weight standard; a = native WPI; b = WPI after 15-min preheating at 80 C; c =
WPI after 4 h cross-linking by mTGase at 5.1 U/g WPI; d,e,f,g = WPI preheated at 80 C
for 15 min then cross-linked by mTGase at 5.1 U/g WPI for 1, 4, 8, and 15 h,
respectively.
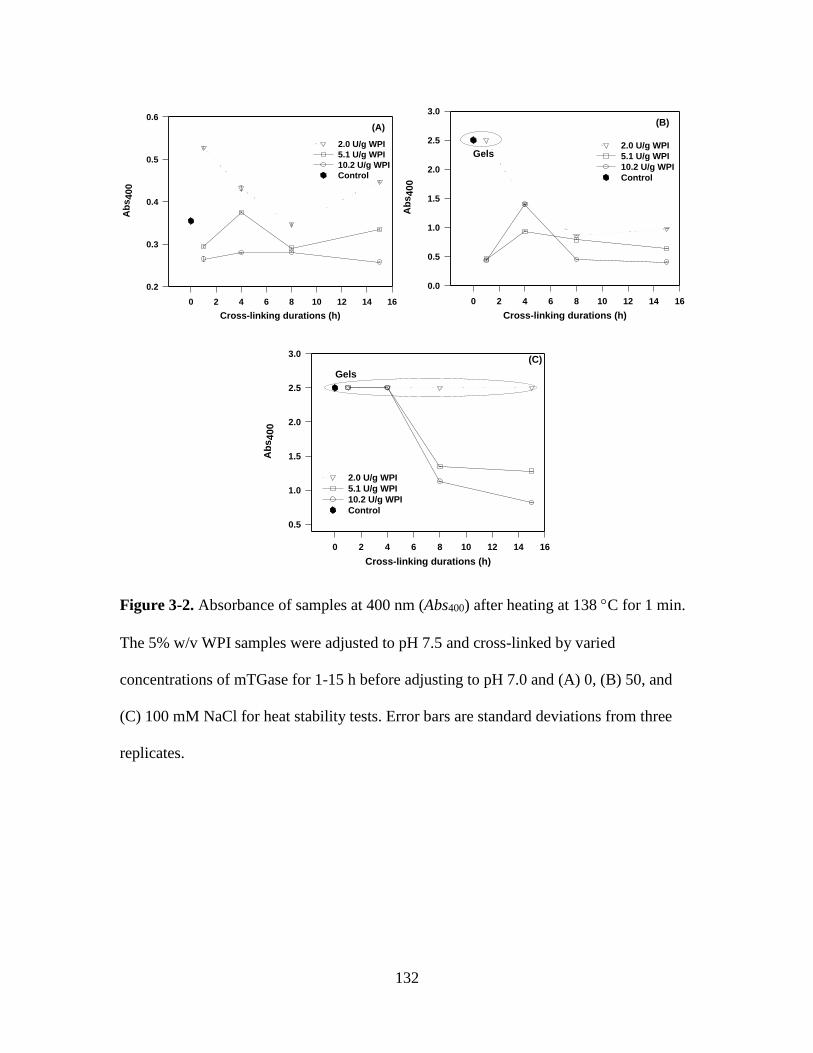
132
Cross-linking durations (h)
0 2 4 6 8 10 12 14 16
Ab
s400
0.2
0.3
0.4
0.5
0.6
2.0 U/g WPI
5.1 U/g WPI
10.2 U/g WPI
Control
(A)
Cross-linking durations (h)
0 2 4 6 8 10 12 14 16
Ab
s400
0.0
0.5
1.0
1.5
2.0
2.5
3.0
2.0 U/g WPI
5.1 U/g WPI
10.2 U/g WPI
Control
(B)
Gels
Cross-linking durations (h)
0 2 4 6 8 10 12 14 16
Ab
s400
0.5
1.0
1.5
2.0
2.5
3.0
2.0 U/g WPI
5.1 U/g WPI
10.2 U/g WPI
Control
(C)
Gels
Figure 3-2. Absorbance of samples at 400 nm (Abs400) after heating at 138 C for 1 min.
The 5% w/v WPI samples were adjusted to pH 7.5 and cross-linked by varied
concentrations of mTGase for 1-15 h before adjusting to pH 7.0 and (A) 0, (B) 50, and
(C) 100 mM NaCl for heat stability tests. Error bars are standard deviations from three
replicates.
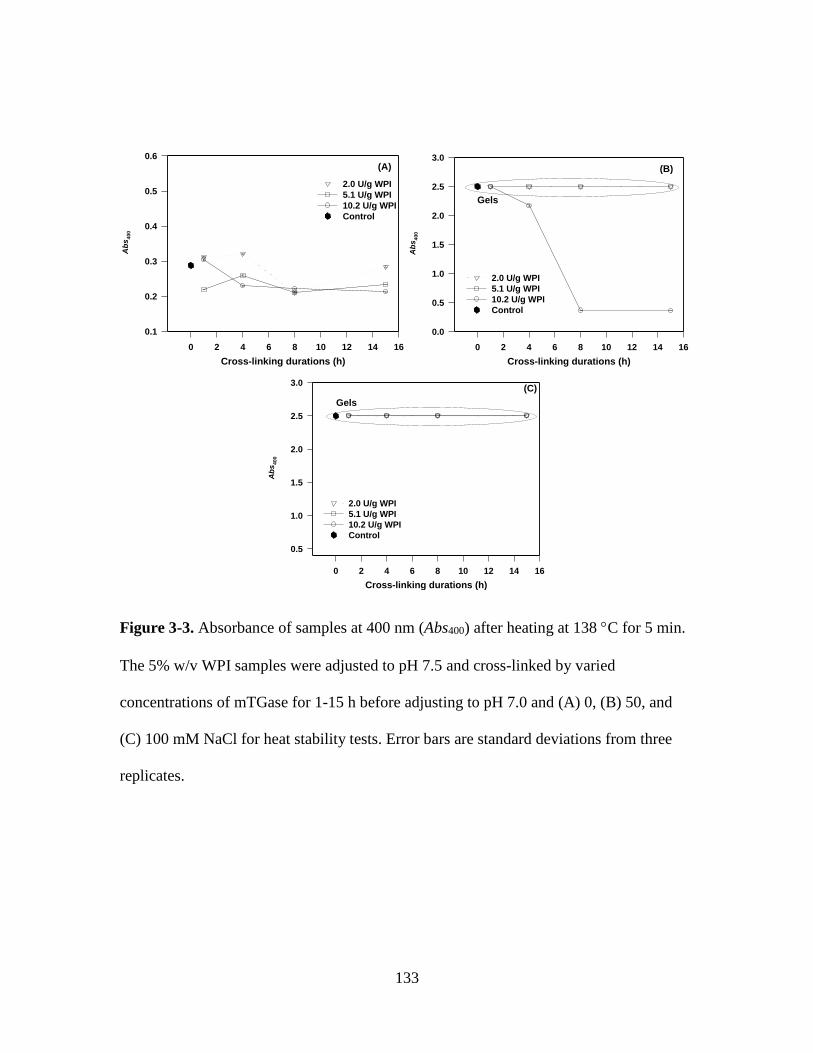
133
Cross-linking durations (h)
0 2 4 6 8 10 12 14 16
Ab
s4
00
0.1
0.2
0.3
0.4
0.5
0.6
2.0 U/g WPI
5.1 U/g WPI
10.2 U/g WPI
Control
(A)
Cross-linking durations (h)
0 2 4 6 8 10 12 14 16
Ab
s4
00
0.0
0.5
1.0
1.5
2.0
2.5
3.0
2.0 U/g WPI
5.1 U/g WPI
10.2 U/g WPI
Control
(B)
Gels
Cross-linking durations (h)
0 2 4 6 8 10 12 14 16
Ab
s4
00
0.5
1.0
1.5
2.0
2.5
3.0
2.0 U/g WPI
5.1 U/g WPI
10.2 U/g WPI
Control
(C)
Gels
Figure 3-3. Absorbance of samples at 400 nm (Abs400) after heating at 138 C for 5 min.
The 5% w/v WPI samples were adjusted to pH 7.5 and cross-linked by varied
concentrations of mTGase for 1-15 h before adjusting to pH 7.0 and (A) 0, (B) 50, and
(C) 100 mM NaCl for heat stability tests. Error bars are standard deviations from three
replicates.
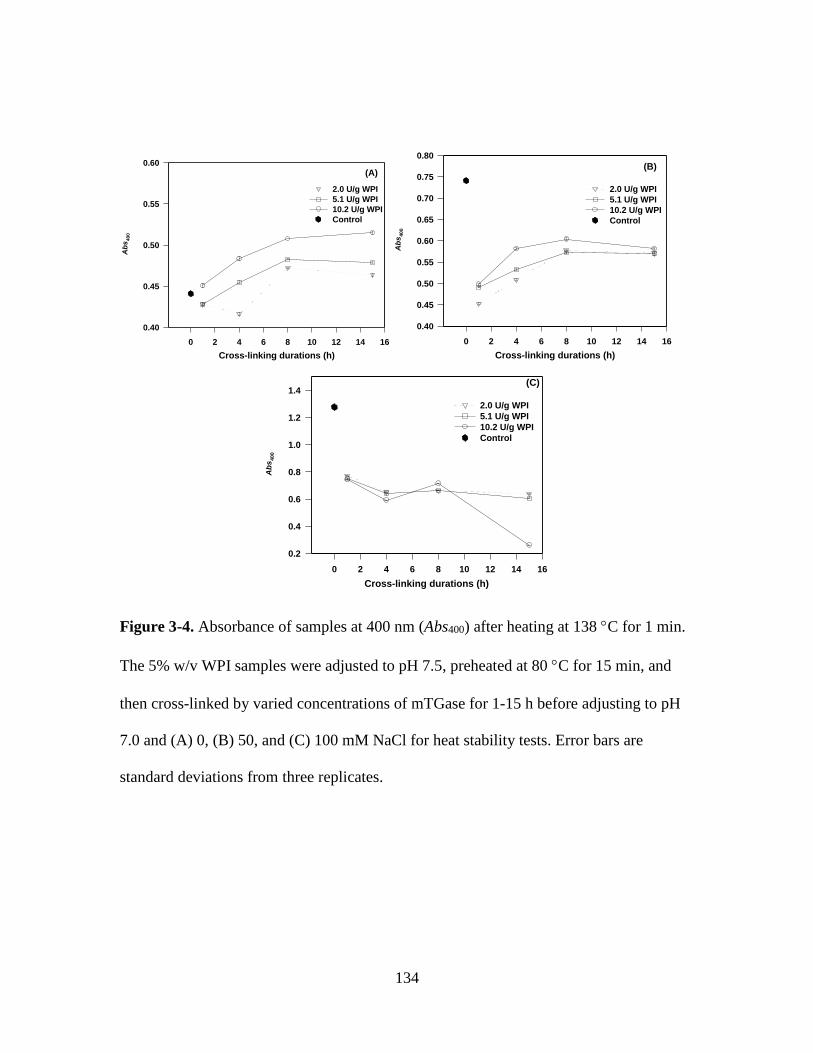
134
Cross-linking durations (h)
0 2 4 6 8 10 12 14 16
Ab
s400
0.40
0.45
0.50
0.55
0.60
2.0 U/g WPI
5.1 U/g WPI
10.2 U/g WPI
Control
(A)
Cross-linking durations (h)
0 2 4 6 8 10 12 14 16
Ab
s400
0.40
0.45
0.50
0.55
0.60
0.65
0.70
0.75
0.80
2.0 U/g WPI
5.1 U/g WPI
10.2 U/g WPI
Control
(B)
Cross-linking durations (h)
0 2 4 6 8 10 12 14 16
Ab
s4
00
0.2
0.4
0.6
0.8
1.0
1.2
1.4
2.0 U/g WPI
5.1 U/g WPI
10.2 U/g WPI
Control
(C)
Figure 3-4. Absorbance of samples at 400 nm (Abs400) after heating at 138 C for 1 min.
The 5% w/v WPI samples were adjusted to pH 7.5, preheated at 80 C for 15 min, and
then cross-linked by varied concentrations of mTGase for 1-15 h before adjusting to pH
7.0 and (A) 0, (B) 50, and (C) 100 mM NaCl for heat stability tests. Error bars are
standard deviations from three replicates.
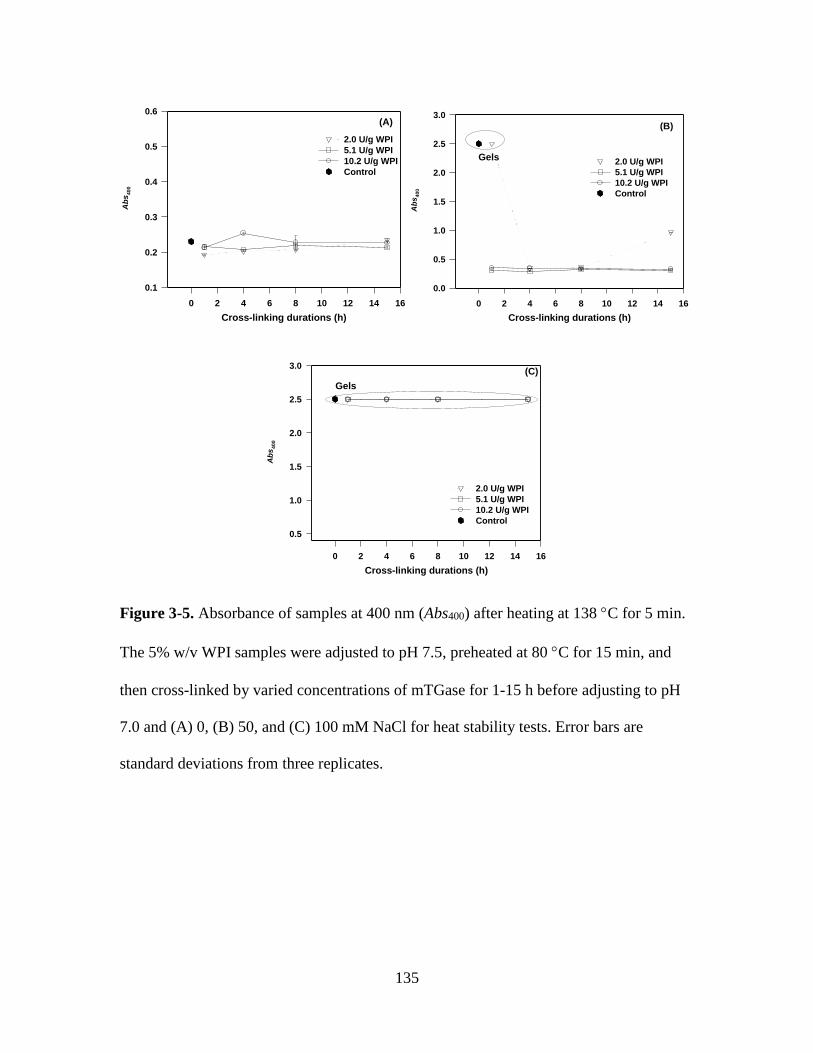
135
Cross-linking durations (h)
0 2 4 6 8 10 12 14 16
Ab
s4
00
0.1
0.2
0.3
0.4
0.5
0.6
2.0 U/g WPI
5.1 U/g WPI
10.2 U/g WPI
Control
(A)
Cross-linking durations (h)
0 2 4 6 8 10 12 14 16
Ab
s4
00
0.0
0.5
1.0
1.5
2.0
2.5
3.0
2.0 U/g WPI
5.1 U/g WPI
10.2 U/g WPI
Control
(B)
Gels
Cross-linking durations (h)
0 2 4 6 8 10 12 14 16
Ab
s4
00
0.5
1.0
1.5
2.0
2.5
3.0
2.0 U/g WPI
5.1 U/g WPI
10.2 U/g WPI
Control
(C)
Gels
Figure 3-5. Absorbance of samples at 400 nm (Abs400) after heating at 138 C for 5 min.
The 5% w/v WPI samples were adjusted to pH 7.5, preheated at 80 C for 15 min, and
then cross-linked by varied concentrations of mTGase for 1-15 h before adjusting to pH
7.0 and (A) 0, (B) 50, and (C) 100 mM NaCl for heat stability tests. Error bars are
standard deviations from three replicates.
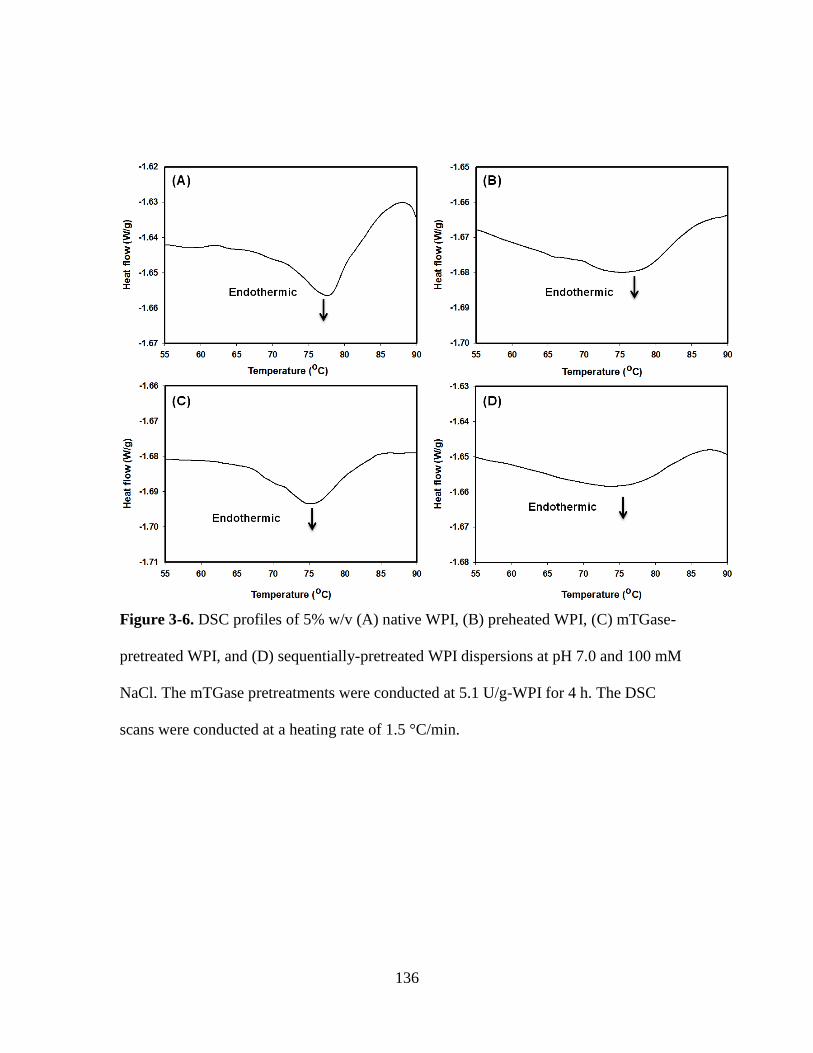
136
Figure 3-6. DSC profiles of 5% w/v (A) native WPI, (B) preheated WPI, (C) mTGase-
pretreated WPI, and (D) sequentially-pretreated WPI dispersions at pH 7.0 and 100 mM
NaCl. The mTGase pretreatments were conducted at 5.1 U/g-WPI for 4 h. The DSC
scans were conducted at a heating rate of 1.5 °C/min.
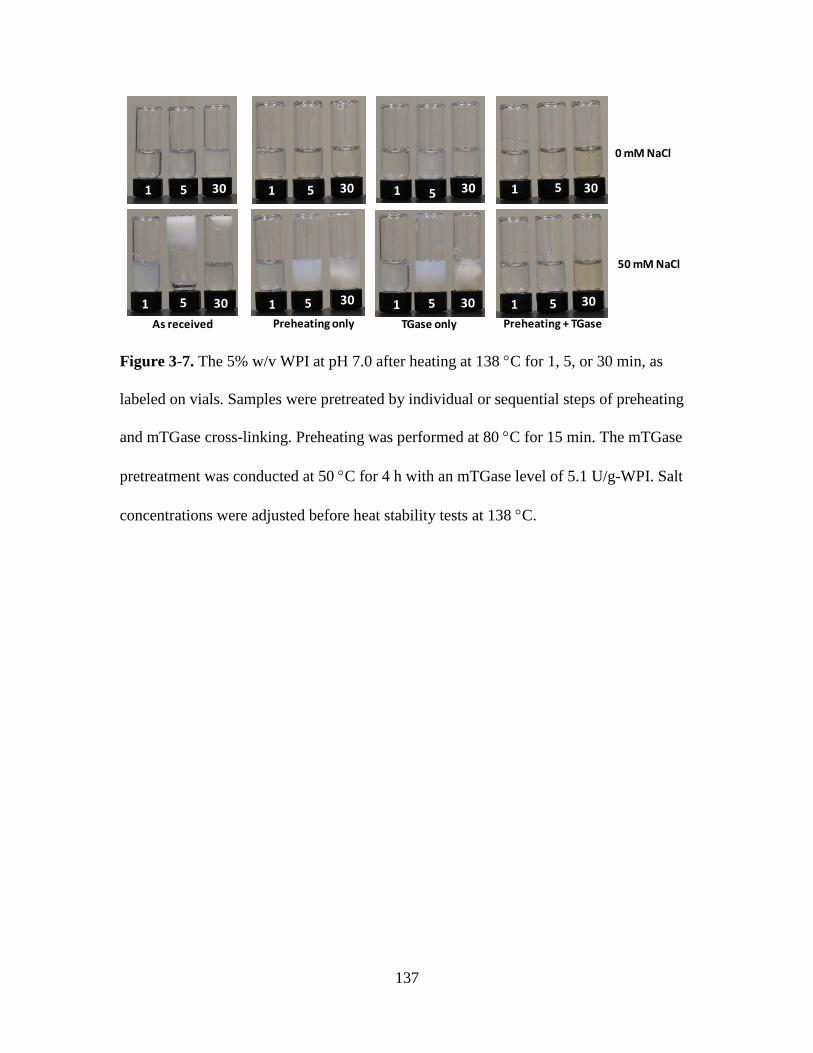
137
1 5 30
1 5 301 5 30
1 5 30
As received Preheating + TGasePreheating only TGase only
1 5 30
1 5 30
1 5 30
1 5 30
0 mM NaCl
50 mM NaCl
Figure 3-7. The 5% w/v WPI at pH 7.0 after heating at 138 C for 1, 5, or 30 min, as
labeled on vials. Samples were pretreated by individual or sequential steps of preheating
and mTGase cross-linking. Preheating was performed at 80 C for 15 min. The mTGase
pretreatment was conducted at 50 C for 4 h with an mTGase level of 5.1 U/g-WPI. Salt
concentrations were adjusted before heat stability tests at 138 C.
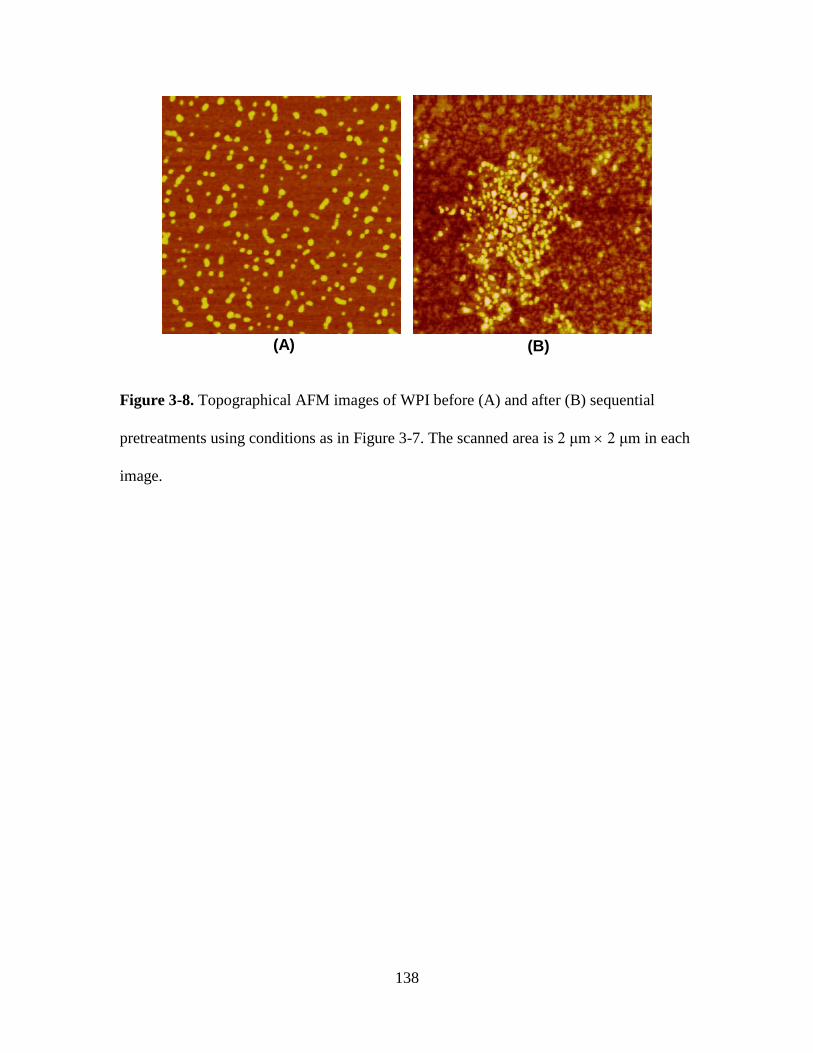
138
(A) (B)
Figure 3-8. Topographical AFM images of WPI before (A) and after (B) sequential
pretreatments using conditions as in Figure 3-7. The scanned area is 2 μm 2 μm in each
image.
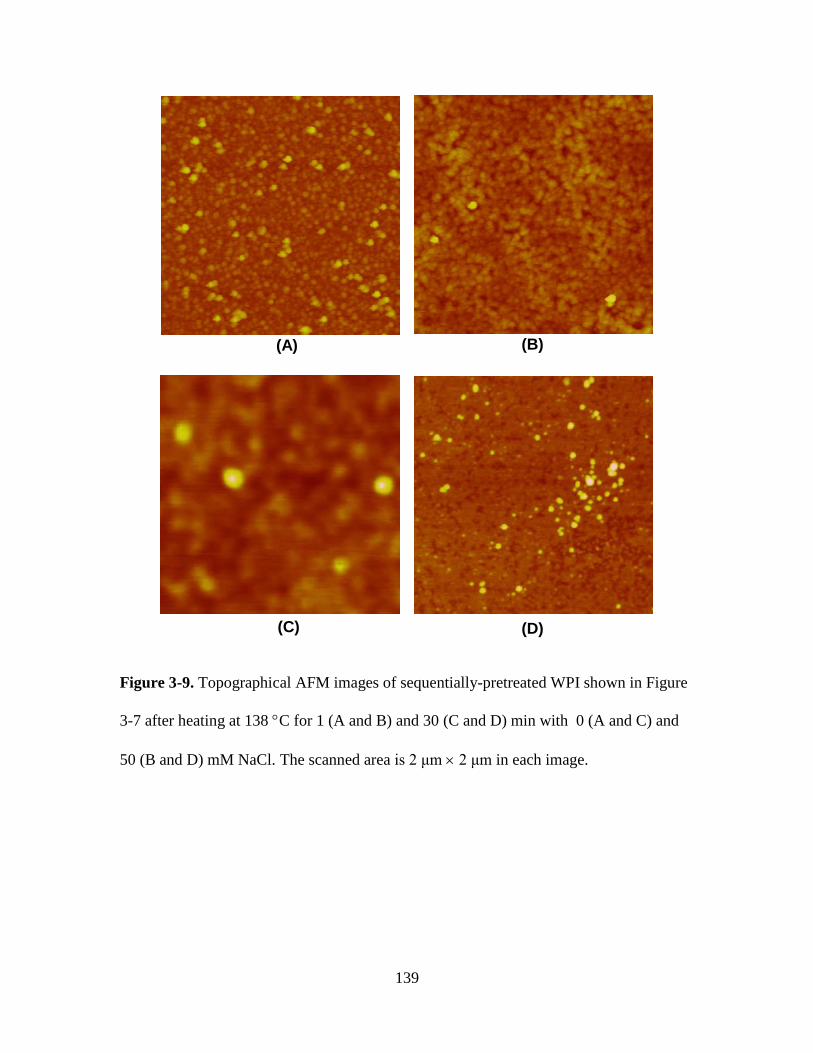
139
(A)
(C)
(B)
(D)
Figure 3-9. Topographical AFM images of sequentially-pretreated WPI shown in Figure
3-7 after heating at 138 C for 1 (A and B) and 30 (C and D) min with 0 (A and C) and
50 (B and D) mM NaCl. The scanned area is 2 μm 2 μm in each image.
140
Chapter 4. Properties of Whey Protein-
Maltodextrin Conjugates as Impacted by Powder
Acidity during the Maillard Reaction
141
4.1 Abstract
Heating the powder of whey protein isolate (WPI)-maltodextrin (MD) mixture,
the Maillard reaction, improves thermal stability of WPI, but the effects of powder
acidity have not been studied. In this work, solutions with WPI and MD were adjusted to
pH 4-7 (m-pH) to obtain spray-dried powder that was glycated at 80 °C and 65% relative
humidity for 1-4 h. The conjugates were evaluated for physicochemical properties. A
higher m-pH and a longer glycation resulted in a darker color. The m-pH 6 treatment had
the highest degree of glycation, lowest surface hydrophobicity, lowest isoelectric point,
and highest denaturation temperature, which contributed to the best heat stability
evaluated at 5% protein, pH 4-7 and 0-150 mM NaCl by heating at 138 °C for 1 min. The
results indicate that adjusting WPI-MD mixture solution to pH 6.0 to prepare powder for
glycation can reduce the color of protein ingredients while providing heat stability for
transparent beverage applications.
Keywords: whey protein, glycation, powder acidity, thermal stability, color, degree of
conjugation
142
4.2 Introduction
Whey protein isolate (WPI), containing more than 90% protein, is a common
protein ingredient used to manufacture protein beverages. Beverages formulated with
WPI are generally highly acidic to receive high clarity and heat stability, and a large
amount of sugar is used to mask acid taste, which may cause a number of health
problems such as teeth erosion and diabetes (Etzel, 2004; Mettler, Rusch, & Colombani,
2006). Low-acid beverages, with pH above 4.6, may reduce concerns about sugars.
Compared to no thermal requirements of the US Food and Drug Administration for acid
foods (pH < 4.6), the production of shelf-stable low-acid foods requires thermal
processing to ensure microbiological safety, such as ultra-high temperature (UHT)
processing of dairy products at 280 °F (138 °C) for at least 8 s (McGarrahan, 1982). This
presents a challenge for whey proteins that undergo denaturation and aggregation during
heating to cause turbidity and storage instability, and possibly gelation, especially for
high protein beverages with more than 4.2%w/v protein (Etzel, 2004).
The folded (native) state of proteins is only slightly more thermodynamically
favorable than at the unfolded (denatured) state, and protein denaturation during thermal
treatments is thus common (Chi, Krishnan, Randolph, & Carpenter, 2003). The
thermally-induced denaturation and aggregation of whey proteins are generally attributed
to several molecular forces such as van der Waals, hydrophobic, and electrostatic
interactions and intra- and inter-molecular disulfide bonds via sulfhydryl-disulfide
interchange, which can be altered by solution pH, protein concentration, ionic strength
and temperature (Baier & McClements, 2005; Bryant & McClements, 1998). At neutral
143
pH, the clarity of whey protein solution after heating can be retained by supplementing
co-solutes such as sucrose, glycerol, sorbitol, and polysaccharides, as a result of the
increased denaturation temperature (Td) of whey protein (Baier & McClements, 2001;
Chanasattru, Decker, & McClements, 2007; Chantrapornchai & McClements, 2002;
Kulmyrzaev, Bryant, & McClements, 2000). Preheating of whey proteins improves the
heat stability and sequential mild preheating and transglutaminase pretreatments can
stabilize WPI dispersions after heating at 138 C and neutral pH for 1- 30 min (Wang,
Zhong, & Hu, 2013; Zhang & Zhong, 2010; Zhong, Wang, Hu, & Ikeda, 2012). When
solution pH is around the isoelectric point (pI) of whey proteins (β-lactoglobulin (β-Lg):
5.2; α-lactalbumin: 4.5-4.8; bovine serum albumin: 4.7-5.1) (Bryant & McClements,
1998), protein aggregation can be extensive because of the weakened electrostatic
repulsion at the overall net charge being close to zero.
Glycation of proteins with reducing carbohydrates via the Maillard reaction is an
effective method to modify protein functionality and has received much attention in
recent years. The ε-amino group of the lysine residues is the primary glycation site
(Ames, 1992). Other groups such as the imidazole group of histidine, the indole group of
tryptophan, and the guanidine group of arginine residues also participate the reaction, but
with a lesser extent (Ames, 1992). The Maillard reaction can take place in solutions (Li,
Zhong, Ji, Yokoyama, Shoemaker, Zhu, et al., 2012; Zhu, Damodaran, & Lucey, 2008)
and powder (Akhtar & Dickinson, 2003). In aqueous solutions, the glycation rate is low
because water inhibits the initial Amadori reaction and subsequent reactions (Liu, Ru, &
Ding, 2012; Van Boekel, 2001). In solutions, the Maillard reaction is favored at a higher
pH from 4.0 to 12.0, generating undesired darker brown color (Ajandouz, Tchiakpe, Ore,
144
Benajiba, & Puigserver, 2001; Ajandouz & Puigserver, 1999; Damodaran, 2008;
BeMiller & Huber, 2007). Conversely, conjugates produced from powder with neutral
acidity improved the thermal stability of whey proteins (Chevalier, Chobert, Popineau,
Nicolas, & Haertlé, 2001), showing transparent dispersions after heating samples at pH
3.0-7.0 and 0-150 mM NaCl and CaCl2 (Liu & Zhong, 2012, 2013; Wang & Ismail,
2012). Besides the origin and ratio of substrates (proteins and reducing carbohydrates),
reaction temperature and duration, water activity and reaction pH affect the glycation
kinetics and thus functionality of reaction products significantly (Sanmartín, Arboleya,
Villamiel, & Moreno, 2009). A higher temperature and a longer reaction duration
increase the extent of Maillard reactions, which not only increases the degree of glycation
(Schiff base) but also generates darkened colors associated with advanced reactions that
have caused worldwide concerns about the probable carcinogenicity in humans (BeMiller
& Whistler, 1996; Mottram, Wedzicha, & Dodson, 2002). The pathway of forming
melanoidins, major pigments responsible for the brown color of Maillard-reaction
products, is favored under more alkaline conditions, as being reported for glycation in
solutions (Ajandouz, Tchiakpe, Ore, Benajiba, & Puigserver, 2001). However, impacts of
powder acidity on color formation and thermal stability of whey proteins glycated with
reducing saccharides at dry conditions have not been studied.
The major objective of this work was to characterize and understand thermal
stability and color formation of WPI-maltodextrin (MD) conjugates produced by heating
spray-dried powder with different acidity at 80 °C and 65% relative humidity for 1-4 h.
To study powder acidity, WPI and MD were dissolved in deionized water and adjusted to
pH 4-7 before spray drying. Physicochemical bases of powder acidity impacts were
145
studied for the degree of glycation, surface hydrophobicity, isoelectric point, and
denaturation temperature of conjugates. Because Maillard reactions impact nutritional
quality of proteins such as the loss of lysine and other essential amino acids and the
reduced bioavailability (Hurrell, 1990), the secondary objective was to study amino acid
compositions and in vitro digestibility of conjugates, with the digestibility evaluated for
conjugates before and after the simulated UHT processing.
4.3 Materials and methods
4.3.1 Materials
The WPI was obtained from Hilmar Ingredients (Hilmar, CA). MD with a
dextrose equivalent (DE) of 18 was acquired from Grain Processing Corporation
(Muscatine, IA). Pepsin, 1-anilino-8-naphtalene-sulphonate (ANS), and pancreatin were
purchased from Sigma-Aldrich Corp. (St. Louis, MO). Other chemicals were purchased
from Fisher Scientific (Pittsburgh, PA).
4.3.2 Production of WPI-MD conjugates
WPI and MD18 were hydrated overnight at room temperature (~21 °C) at
2.5%w/v each in deionized water. The mixture solution was adjusted to pH 4, 5, 6, and 7
using 10 N and 4 N NaOH and was spray-dried at an inlet temperature of 160 °C, an
outlet temperature of ca. 90 °C, an air flow rate of 20 m3/h, and a feeding rate of 250
mL/h (model B-290 Mini-Spray Dryer, Büchi Laboratoriums-Technik, Flawil,
Switzerland). The spray-dried powder was incubated at 80 °C and 65% relative humidity
for 1, 2 and 4 h in a humidity-controlled incubator (model IG420U Environmental
146
chamber, Yamato Scientific America Inc., Santa Clara, CA) for glycation. The powder
was then collected and stored at -20 °C in a freezer.
4.3.3 Preparation of conjugate solution and heat stability test
The conjugates were prepared at 5%w/v protein in deionized water and hydrated
overnight at ~21 C. Solutions were measured for pH before adjusting to pH 7 using 4 N
and 1N NaOH to prepare transparent solutions and filtration through a #1 filter paper
(particle retention: > 11 μm, Whatman, Clifton, NJ) to remove visible particulates such as
brush debris resulting from powder collection in sample preparation. Subsequently,
samples were adjusted to pH 4-7 using 1 N and 0.25 N HCl or NaOH, 0-100 mM NaCl,
and 0 or 5%w/w sucrose. The 1 mL solutions were contained in 4 mL glass vials and
were heated in a glycerol bath at 138 ± 1 °C for 1 min to simulate UHT processing that is
equivalent to 138 °C for at least 8 s for dairy products (McGarrahan, 1982). The 1 min
duration was used to ensure sufficient thermal treatment throughout the vials. The visual
appearance of samples was compared by photographing.
4.3.4 Color measurements
The extent of advanced Maillard reactions (brown color) was measured using the
UV/Vis spectrophotometer (ThermoScientific, Waltham, MA) at 420 nm (BeMiller &
Huber, 2007; Damodaran, 2008; Martins, Jongen, & Van Boekel, 2000). The color of
protein solutions at pH 7.0 without sucrose and NaCl was measured before and after
heating at 138 C for 1 min using a MiniScan XE Plus Hunter Colorimeter (Hunter
Associates Laboratory, Inc., Reston, VA). The parameters L, a, b were determined twice
147
each for two independent conjugate replicates and the color intensity (C*) was calculated
as follows (Medrano, Abirached, Panizzolo, Moyna, & Añón, 2009).
C* = (a2 + b2)1/2
4.3.5 Attenuated Total Fourier Transform Infrared (FTIR) Spectroscopy
The WPI-MD conjugate structure was studied using a Nicolet Nexus 670 FTIR
spectrometer (Thermo Fisher Scientific Inc., Waltham, MA). WPI and its conjugates
were prepared at 2%w/v protein in deuteroxide to reduce the strength of intra-molecular
hydrogen bonds (Yost, Tejedor-Tejedor, & Anderson, 1990). A drop of each protein
sample solution was placed on the ATR accessory, and over 64 scans at a 4 cm-1
resolution were collected and averaged to obtain the spectrum. The original spectrum was
smoothed using the OMNIC software. The FTIR spectra at the amide I and II region
(1400-1800 cm-1) were analyzed to reflect changes in secondary structures of WPI before
and after glycation.
4.3.6 Degree of glycation
The degree of glycation was measured for unreacted amines using the
2,4,6‐trinitrobenzene sulfonic acid (TNBS) method (Tainturier, Roullier, Martenot, &
Lorient, 1992), with some modifications. A fresh working solution of TNBS was
prepared prior to assays by diluting the 1% TNBS solution (Geno Technology, Inc., St
Louis, MO) in 0.1 M sodium bicarbonate aqueous solution to an overall TNBS
concentration of 0.01% w/v. Each conjugate solution was prepared at 200 μg/mL in the
0.1 M sodium bicarbonate solution at pH 8.5, followed by mixing with the TNBS
working solution at a volume ratio of 2:1. Subsequently, the mixture was incubated at 37
148
°C in a water bath for 2 h, and the reaction was terminated by adding 10%w/v sodium
dodecyl sulfate (SDS) solution and 1 N HCl to a volume ratio of mixture : SDS : HCl =
6:2:1. The final mixture solution was measured for absorbance at 335 nm using the above
UV/Vis spectrophotometer.
4.3.7 Amino acid composition
Amino acid compositions of proteins were analyzed by the W.M. Keck
Foundation Biotechnology Resource Laboratory at Yale University (New Haven, CT)
using the following procedures. “A 1-2 mg potion of protein powder was mixed with 0.3
mL of hydrolysis acid (6 N HCL, 0.2%v/v phenol, 1 nmol norvaline as internal standard)
in a rimless 10 × 75 mm Pyrex TM tube. After flame-sealing of the tube by vacuuming,
the sample was hydrolyzed at 115 °C for 16 h. After cooling, the sample was opened and
the hydrolyzate was evaporated to dryness in a heated vacuum centrifuge. The dried
sample was dissolved in 0.5 mL of 0.02 M HCl (pH 1.5) and serially diluted so that a 20
μL injection would be 0.1% of the hydrolyzate. 0.5% of each sample aliquot was placed
in the 0.3 mL limited volume insert of an 11 mm Snap-Cap glass vial after filtration
through a 0.22 μm centrifugal-filter for loading onto the Hitachi L-8900 PH amino acid
analyzer (Tokyo, Japan) equipped with a Hitachi 2622SPH ion-exchange column (4.6
mm ID × 60 mm) for amino acid composition analysis. Data was collected using
EZChrom Elite for Hitachi software. The tryptophan and cysteine were partially
destroyed due to the HCl hydrolysis, thus are not presented.”
149
4.3.8 Differential scanning Calorimetry (DSC)
The thermal denaturation properties of WPI and its conjugates were studied using
an ultrasensitive VP-DSC (MicroCal, LLC, Northampton, MA). Samples prepared at
1%w/v protein, pH 5.0 or 7.0, and 100 mM NaCl were degased at 20 °C for 10 min
before injection into the sample cell. Deionized water was used as a reference. The
temperature ramp from 25 to 105 °C was scanned at a rate of 1.0 °C/min. The
denaturation temperature (Td) and total calorimetric apparent enthalpy change (ΔH) were
determined using a two-state model supplied by MicroCal. All determinations were
performed in two replications.
4.3.9 Zeta-potential measurement
The zeta potential was measured using a DelsaTM Nano instrument (Beckman
Coulter Inc., Brea. CA). WPI and its conjugates were prepared at 2%w/v protein and
diluted to 1%w/v protein dispersions, with a pH adjustment to 3-7, followed by filtration
through a 0.45 μm PVDF syringe membrane (EMD Millipore Corp., Billerica, MA)
before measurements. For each sample, the zeta-potential – pH plot was used to
extrapolate the pH corresponding to a zeta-potential value of zero and was treated as the
pI. Two replicates were tested for three times each, and the averages from 6
measurements were reported.
4.3.10 Surface hydrophobicity
Surface hydrophobicity of WPI and its conjugates was evaluated using ANS as a
fluorescence probe according to a literature method (Alizadeh-Pasdar & Li-Chan, 2000),
with modification. The 2%w/v protein solutions at pH 5 and 7 were diluted to five
150
concentrations from 0.01 to 0.2% w/v using either a 10 mM phosphate-citrate buffer
solution (pH 5.0) or a 10 mM phosphate buffer solution (pH 7.0). The ANS solution was
prepared at 8 mM in the same buffer solutions. Fifteen μL ANS solution was added to 3
mL of each protein solution. The fluorescence intensity of samples was recorded at an
excitation wavelength of 363 nm using a RF-150 spectrofluorometer (Shimadzu Corp.,
Tokyo, Japan). The emission spectra were recorded between 400 and 600 nm. The
corresponding buffer solution was used as a blank. The initial slope of the fluorescence
intensity-protein concentration plots after linear regression analysis was used as an index
of surface hydrophobicity (S0).
4.3.11 Digestibility of WPI and its conjugates
The stimulated in vitro protein digestion was performed according to a literature
method (García‐Rico, Tejeda‐Valenzuela, Vélez, & Montoro, 2012), with some
modifications. One gram of pepsin was suspended in 10 mL of 0.1 N HCl as the
simulated gastric fluid, while the simulated intestinal fluid was prepared by dissolving
0.04 g of pancreatin and 0.25 g of bile extract in 10 mL of 0.1 M NaHCO3. WPI or
conjugate sample was suspended in 9 mL deionized water to an overall protein
concentration of 5%w/v and adjusted to pH 2.0 using 6 N and 1 N HCl. The pH value
was readjusted to pH 2.0 after 15 min of stirring if necessary. The protein solution was
mixed with 80 μL of freshly prepared pepsin solution to a level of 0.008 g pepsin per 5 g
protein. The sample was made up to 10 g with deionized water, followed by incubation in
a shaking water bath operating at 37 °C and 120 rpm. After 2-h simulated gastric
digestion, the reaction was stopped by adjusting pH to 5.0. The subsequent simulated
151
intestinal digestion was proceeded by adding 500 μL of the simulated intestinal fluid to
the sample. After incubating for 2 h in the same shaking water bath, the sample was
adjusted to pH 7.2 to stop the reaction by drop-wise addition of 0.5 M NaOH. The
digested samples were centrifuged at 14129g for 30 min (Centrifuge MiniSpin,
Eppendorf, Hamburg, Germany), and the supernatants were collected for SDS-PAGE
analysis.
To perform SDS-PAGE, a protein sample was mixed with the loading buffer to
obtain a protein concentration of 1 mg/mL, followed by heating at 95 °C for 5 min. Tris-
HCl gels (15% precast linear gradient polyacrylamide gel) from Bio-Rad Laboratories
(Hercules, CA) were used in electrophoresis at 120 V for about 80 min. Coomassie
Brilliant Blue staining was carried out according to the gel manual. The stained gels were
scanned (CanoScan 8600F, Canon U.S.A., Inc., New York, NY) and bands were
quantified using Image J software (National Institute of Health, Bethesda, MD).
4.3.12 Statistical analysis
Statistical differences were analyzed using post-hoc comparison of means
according to the least-significant-difference (LSD) mean separation method at a p level of
0.05. The SAS software (version 9.2, SAS Institute, Cary, NC) was used in analyses.
4.4 Results and discussion
4.4.1 Changes in powder acidity after glycation
Typically, WPI solutions are adjusted to neutral pH to prepare powder for
glycation (Corzo-Martínez, Moreno, Villamiel, & Harte, 2010; Jiménez-Castaño,
152
Villamiel, & López-Fandiño, 2007; Morales & Jiménez-Pérez, 2001). In this study, the
protein solution before spray-drying was adjusted to pH 4.0-7.0, referred as m-pH
hereafter, to prepare powder for glycation. After hydrating conjugates in deionized water
overnight, the solution pH was measured, presented in Figure 4-1. Glycation increased
powder acidity, more significant at a longer glycation duration and higher m-pH. The
decrease in pH during glycation of porcine plasma protein-monosaccharides (Benjakul,
Lertittikul, & Bauer, 2005), bovine serum albumin-xylose (Easa, Armstrong, Mitchell,
Hill, Harding, & Taylor, 1996) and fructose-glycine (Matmaroh, Benjakul, & Tanaka,
2006) solutions has been reported previously. The decrease in pH has been discussed due
to the formation of acids, the conversion of basic amines to other compounds, and the
condensation reaction between free amines of protein and carbonyl groups of reducing
carbohydrates (Beck, Ledl, Sengl, & Severin, 1990; Matmaroh, Benjakul, & Tanaka,
2006). The greater decrease in the solution pH for the treatment of higher m-pH indicates
a greater extent of the Maillard reaction.
4.4.2 Thermal stability and color formation
Photographs of selected samples after heating at 138 °C for 1 min are shown in
Figure 4-2. The m-pH 6.0 treatment showed the best heat stability, while the m-pH 4.0
treatment was the least stable. For the m-pH 6 treatments, the sample glycated for a
longer duration had a darker color and better thermal stability, with the 4-h treatment
being stable after heating at all solution pH (s-pH) and 0-100 mM NaCl and the 2-h
treatment, with a much lighter color, being unstable only at pH 5.0 and 0 mM NaCl.
153
Samples were compared for turbidity at 600 and 420 nm, shown in Figure 4-3 for
those glycated for 2 h and heated at s-pH 4.0-7.0 and 50 mM NaCl. The Abs600 was much
lower (not displayed) than Abs420, with similar trends. Abs420 is also commonly used as an
indicator of brown pigments formed in the final stage of Maillard reaction (Lerici,
Barbanti, Manzano, & Cherubin, 1990). Generally, Abs420 increased with an increase in
glycation time and m-pH. The m-pH 6 treatment overall had lower Abs420 than other
treatments. The addition of 5% sucrose significantly reduced the turbidity of samples
after heating. For the m-pH 6 treatment at s-pH 5.0 and 50 mM NaCl, the addition of 5%
sucrose enabled a transparent dispersion after heating, contrasting with the sample
without sucrose (Figure 4-2). Co-solutes such as sucrose, typically at higher than 10%,
have been reported to improve the thermal stability of whey proteins at neutral acidity
(Baier & McClements, 2001; Kulmyrzaev, Bryant, & McClements, 2000; McClements,
2002).
The color measurements (Table 4-1) generally agreed with visual observations,
showing greater C* at a higher m-pH and a longer glycation duration. Results in Table 4-
1 also showed no significant changes in C* before and after heating at 138 C for 1 min.
This group of studies shows that m-pH can be controlled to reduce the extent of glycation
and color formation. Co-solutes can be used to reduce the extent of glycation while
obtaining sufficient UHT heat stability, which are being studied in greater details and will
be reported elsewhere. The rest of this paper is focused on the impacts of m-pH on the
structures of glycated WPI.
154
4.4.3 Structural changes of glycated WPI analyzed by FTIR
Glycation of WPI results in an increase or decrease in contents of secondary
structures, in terms of α-helix, β-sheet, β-turn, and random coil, modifying functional
properties of WPI (Liu, Ru, & Ding, 2012). In this study, FTIR spectra in the amide I and
II region (1400-1800 cm-1, Figure 4-4) were compared for changes in secondary
structures of WPI after glycation (Liu, Ru, & Ding, 2012). The peaks located around
1644 and 1529 cm-1 are characteristics of proteins (Liu & Zhong, 2013). The peaks at
1687 and 1529 cm-1 represent β-sheet and α-helix structures (Liu, Ru, & Ding, 2012;
Surewicz, Mantsch, & Havel, 1996). After glycation, the intensity of peaks at 1687 cm-1
and 1549 cm-1 decreased, and shifts of peaks at 1644 cm-1, to 1630 cm-1, and 1529 cm-1,
to 1531 cm-1, were observed. The changes in FTIR spectra indicate secondary structure
changes of WPI after glycation, with a decrease in the peak at 1530 cm-1 (Liu, Ru, &
Ding, 2012). Previously, we showed glycation led to the decreased content of ordered
structures (β-sheet and α-helix) and the increased content of aperiodic structures (Liu &
Zhong, 2013), which can result from the reduced hydrophobicity of whey protein after
glycation (Monahan, German, & Kinsella, 1995).
4.4.4 Degree of glycation
In the present study, the degree of glycation was measured based on the reaction
of free amines with TNBS, with a higher absorbance value at 335 nm (Abs335) indicating
a greater amount of unreacted amines and thus a lower degree of glycation. Abs335
decreased with an increase of m-pH until m-pH 6, before increasing at m-pH 7 (Figure 4-
5). The degree of glycation generally agrees with heat stability results in Figure 4-2, since
155
a greater number of MD molecules attached to protein molecules provides stronger steric
hindrance against protein aggregation during heating (Liu & Zhong, 2013).
4.4.5 Amino acid composition changes after glycation
Amino acid compositions of WPI before and after glycation are listed in Table 4-
2. Lysine content decreased significantly after glycation, indicating it is the primary
amino acid in the Maillard reaction (Ames, 1992). The lysine content was lower at a
higher m-pH but was not significantly different (p > 0.05) for conjugates prepared at m-
pH 5, 6 and 7.
4.4.6 Thermal denaturation properties of glycated WPI
The DSC thermograms of samples at pH 5.0 and 7.0 with 100 mM NaCl are
shown in Figure 4-6, with the obtained Td and ΔH summarized in Table 4-3. Generally,
glycation led to an increase of Td and a decrease of ΔH, indicating the improved thermal
stability or tertiary conformational stability (Liu, Ru, & Ding, 2012). The Td at pH 5.0
was higher than at pH 7.0, as observed for β-Lg that is the most abundant whey protein
(Haug, Skar, Vegarud, Langsrud, & Draget, 2009). The impacts of m-pH on Td (Table 4-
3) show the same trend as the degree of glycation (Figure 4-5). The Td is all below the
138 C used in heat stability test (Figure 4-2), and therefore the increase of Td after
glycation only contributes partially to the improved heat stability after glycation at
various m-pH.
156
4.4.7 Surface properties of glycated WPI
Glycation of WPI alters the distribution of protein surface charges, leading to
decreases of pI and surface hydrophobicity (Achouri, Boye, Yaylayan, & Yeboah, 2005;
Pedrosa, Trisciuzzi, & Ferreira, 1997). Zeta potential profiles of conjugates are presented
in Figure 4-7, and the estimated pI (pH corresponding to zero zeta potential) is
summarized in Table 4-4. The lowest pI, around 4.07, was observed for the m-pH 6.0
treatment, indicating the most significant changes in protein structure that is in agreement
with the highest degree of glycation and best heat stability, as discussed previously. The
decrease of pI is attributed to the decreased content of basic lysine on protein surface
after glycation with MD, which is supported by the lowered magnitude of zeta-potential
of glycated WPI than WPI at pH below pI (Figure 4-7). Because the m-pH 6 treatment
was stable at pH 5.0 (with close–to-zero zeta-potential, i.e., weak electrostatic repulsion),
the improved thermal stability of glycated WPI is mainly attributed to the steric repulsion
generated by MD covalently bonded on whey proteins (Liu & Zhong, 2013).
Protein samples were further measured for surface hydrophobicity, with the
obtained S0 at pH 5 and pH 7 shown in Table 4-5. The decrease of S0 after glycation is
expected (Broersen, Voragen, Hamer, & de Jongh, 2004; Hiller & Lorenzen, 2010), and
the higher S0 at pH 5 than at pH 7 is due to reduced surface charge at acidity near pI
(Corzo-Martínez, Moreno, Olano, & Villamiel, 2008). The m-pH 6 treatment showed the
relatively lower S0 than other treatments, agreeing with the highest degree of glycation
(Figure 4-5).
157
4.4.8 In vitro digestibility
The lowered reactivity of trypsin on lysine and arginine residues (Liu & Zhong,
2013; Luz Sanz, Corzo-Martínez, Rastall, Olano, & Moreno, 2007) and conformational
changes of proteins can decrease and increase, respectively, the digestibility of WPI after
glycation (Corzo-Martínez, Soria, Belloque, Villamiel, & Moreno, 2010). In the present
study, the in vitro digestibility of WPI glycated at m-pH 4.0-7.0 was studied before and
after the simulated UHT processing (heating at 138 C for 1 min) of protein solutions at
pH 7.0, partially characterized using SDS-PAGE (Figure 4-8). The protein bands were
analyzed for distributions (Table 4-6). The increase and broadening of protein MW of
glycated WPI confirmed the glycation. After simulated gastric digestion of native WPI,
the band corresponding to β-Lg remained mostly intact, the α-lactalbumin band
disappeared, while high MW bands showed the decreased intensity. After the second step
of simulated intestinal digestion for 2 h, residual β-Lg was visible, while other proteins
became small molecular mass. For glycated WPI, the major smearing zone became
narrower only after the simulated intestinal digestion but was still wider than the WPI
(Figure 4-8), with molecular mass bigger than that of WPI (Table 4-6). This indicates that
glycated WPI can be partially digested but is less digestible than WPI, suggesting that
glycation provides a protection against proteolysis (Corzo-Martínez, Soria, Belloque,
Villamiel, & Moreno, 2010). For samples heated at 138 C for 1 min, β-Lg became
susceptible to digestion by pepsin, with only vague bands remaining. The digestibility of
proteins is significantly influenced by both the accessibility of enzymes to the reactive
sites and protein structures. The native β-Lg is resistant to pepsin hydrolysis in the gastric
158
environment due to its stable globular structure that can be thermally denatured to expose
susceptible peptide bonds for proteolysis (O’Loughlin, Murray, Kelly, FitzGerald, &
Brodkorb, 2012). After the second step digestion of heated samples, there was a vague β-
Lg band observed for WPI but no visible bands were detected for all conjugate treatments
(Figure 4-8, Table 4-6). Since UHT processing is needed to produce shelf-stable
beverages with pH greater than 4.6, the excellent digestibility and heat stability of
glycated WPI suggest the potential application in production of transparent beverages.
Sensory analysis of the eventual model beverage products however is needed for
consumer acceptance.
4.5 Conclusions
Thermal stability and color intensity of glycated WPI were observed to be
significantly affected by the acidity of spray-dried powder used in the Maillard reaction.
WPI glycated at m-pH 6 exhibited the best thermal stability, particularly at pH 5.0, due to
the highest degree of glycation, the highest increase of Td, and the lowest H. The m-pH
6 treatment also had a relatively lighter color than that at m-pH 7. With addition of co-
solutes like 5% sucrose, the powder acidity and glycation conditions can be carefully
chosen to produce whey protein ingredients with excellent digestibility and light colors to
manufacture transparent, shelf-stable beverages after UHT processing.

159
Acknowledgement
The authors acknowledge the financial support from the University of Tennessee
and Dairy Research Institute (Rosemont, IL) and thank the Bioanalytical Resources
Facility in the University of Tennessee for use of VP-DSC.
160
References
Achouri, A., Boye, J. I., Yaylayan, V. A., & Yeboah, F. K. (2005). Functional properties
of glycated soy 11S glycinin. Journal of Food Science, 70(4), C269-C274.
Ajandouz, E., Tchiakpe, L., Ore, F. D., Benajiba, A., & Puigserver, A. (2001). Effects of
pH on Caramelization and Maillard Reaction Kinetics in Fructose‐Lysine Model
Systems. Journal of Food Science, 66(7), 926-931.
Ajandouz, E. H., & Puigserver, A. (1999). Nonenzymatic browning reaction of essential
amino acids: effect of pH on caramelization and Maillard reaction kinetics.
Journal of Agricultural and Food Chemistry, 47(5), 1786-1793.
Akhtar, M., & Dickinson, E. (2003). Emulsifying properties of whey protein–dextran
conjugates at low pH and different salt concentrations. Colloids and Surfaces B:
Biointerfaces, 31(1), 125-132.
Alizadeh-Pasdar, N., & Li-Chan, E. C. Y. (2000). Comparison of protein surface
hydrophobicity measured at various pH values using three different fluorescent
probes. Journal of Agricultural and Food Chemistry, 48(2), 328-334.
Ames, J. M. (1992). The Maillard reaction. in: Biochemistry of Food Proteins. London:
Springer.
Baier, S., & McClements, D. J. (2001). Impact of preferential interactions on thermal
stability and gelation of bovine serum albumin in aqueous sucrose solutions.
Journal of Agricultural and Food Chemistry, 49(5), 2600-2608.
Baier, S. K., & McClements, D. J. (2005). Influence of cosolvent systems on the gelation
mechanism of globular protein: thermodynamic, kinetic, and structural aspects of
globular protein gelation. Comprehensive Reviews in Food Science and Food
Safety, 4(3), 43-54.
Beck, J., Ledl, F., Sengl, M., & Severin, T. (1990). Formation of acids, lactones and
esters through the Maillard reaction. Zeitschrift für Lebensmitteluntersuchung
und-Forschung A, 190(3), 212-216.
BeMiller, J. N. & Whistle, R. L. (1996). Carbohydrate. in: Food Chemistry. 3rd edition.
New York, NY: Marcel-Dekker, Inc.
BeMiller, J. N. & Huber, K. L. (2007). Carbohydrate. in: Fennema's Food Chemsitry. 4th
edition. New York, NY: Marcel-Dekker, Inc.
Benjakul, S., Lertittikul, W., & Bauer, F. (2005). Antioxidant activity of Maillard
reaction products from a porcine plasma protein–sugar model system. Food
Chemistry, 93(2), 189-196.
Broersen, K., Voragen, A. G., Hamer, R. J., & de Jongh, H. H. (2004). Glycoforms of
β‐lactoglobulin with improved thermostability and preserved structural packing.
Biotechnology and Bioengineering, 86(1), 78-87.
161
Bryant, C. M., & McClements, D. J. (1998). Molecular basis of protein functionality with
special consideration of cold-set gels derived from heat-denatured whey. Trends
in Food Science & Technology, 9(4), 143-151.
Chanasattru, W., Decker, E. A., & McClements, D. J. (2007). Modulation of thermal
stability and heat-induced gelation of [beta]-lactoglobulin by high glycerol and
sorbitol levels. Food Chemistry, 103(2), 512-520.
Chantrapornchai, W., & McClements, D. J. (2002). Influence of glycerol on optical
properties and large-strain rheology of heat-induced whey protein isolate gels.
Food Hydrocolloids, 16(5), 461-466.
Chevalier, F., Chobert, J. M., Popineau, Y., Nicolas, M. G., & Haertlé, T. (2001).
Improvement of functional properties of β-lactoglobulin glycated through the
Maillard reaction is related to the nature of the sugar. International Dairy Journal,
11(3), 145-152.
Chi, E. Y., Krishnan, S., Randolph, T. W., & Carpenter, J. F. (2003). Physical stability of
proteins in aqueous solution: mechanism and driving forces in nonnative protein
aggregation. Pharmaceutical Research, 20(9), 1325-1336.
Corzo-Martínez, M., Moreno, F. J., Olano, A., & Villamiel, M. (2008). Structural
characterization of bovine β-lactoglobulin− galactose/tagatose Maillard
complexes by electrophoretic, chromatographic, and spectroscopic methods.
Journal of Agricultural and Food Chemistry, 56(11), 4244-4252.
Corzo-Martínez, M., Moreno, F. J., Villamiel, M., & Harte, F. M. (2010).
Characterization and improvement of rheological properties of sodium caseinate
glycated with galactose, lactose and dextran. Food Hydrocolloids, 24(1), 88-97.
Corzo-Martínez, M., Soria, A. C., Belloque, J., Villamiel, M., & Moreno, F. J. (2010).
Effect of glycation on the gastrointestinal digestibility and immunoreactivity of
bovine β-lactoglobulin. International Dairy Journal, 20(11), 742-752.
Easa, A. M., Armstrong, H. J., Mitchell, J. R., Hill, S. E., Harding, S. E., & Taylor, A. J.
(1996). Maillard induced complexes of bovine serum albumin—a dilute solution
study. International Journal of Biological Macromolecules, 18(4), 297-301.
Etzel, M. R. (2004). Manufacture and use of dairy protein fractions. The Journal of
Nutrition, 134(4), 996-1002.
García‐Rico, L., Tejeda‐Valenzuela, L., Vélez, D., & Montoro, R. (2012). Content of
selenium, total and inorganic arsenic and bioaccessibility of arsenic in children
diets of México. Journal of the Science of Food and Agriculture, 92(8), 1725-
1731.
Haug, I., Skar, H., Vegarud, G., Langsrud, T., & Draget, K. (2009). Electrostatic effects
on β-lactoglobulin transitions during heat denaturation as studied by differential
scanning calorimetry. Food Hydrocolloids, 23(8), 2287-2293.
162
Hiller, B., & Lorenzen, P. C. (2010). Functional properties of milk proteins as affected by
Maillard reaction induced oligomerisation. Food Research International, 43(4),
1155-1166.
Jiménez-Castaño, L., Villamiel, M., & López-Fandiño, R. (2007). Glycosylation of
individual whey proteins by Maillard reaction using dextran of different
molecular mass. Food Hydrocolloids, 21(3), 433-443.
Hurrell, R. (1990). Influence of the Maillard reaction on the nutritional value of foods. in:
The Maillard Reaction in Food Processing, Human Nutrition and Physiology.
Birkhäuser Verlag: Springer.
Kulmyrzaev, A., Bryant, C., & McClements, D. J. (2000). Influence of sucrose on the
thermal denaturation, gelation, and emulsion stabilization of whey proteins.
Journal of Agricultural and Food Chemistry, 48(5), 1593-1597.
Lerici, C., Barbanti, D., Manzano, M., & Cherubin, S. (1990). Early indicators of
chemical changes in foods due to enzymatic or non enzymatic browning
reactions. I, Study on heat treated model systems. Lebensmittel-Wissenschaft+
Technologie, 23(4), 289-294.
Li, Y., Zhong, F., Ji, W., Yokoyama, W., Shoemaker, C. F., Zhu, S., & Xia, W. (2013).
Functional properties of Maillard reaction products of rice protein hydrolysates
with mono-, oligo-and polysaccharides. Food Hydrocolloids, 30(1), 53-60.
Liu, G., & Zhong, Q. (2012). Glycation of Whey Protein To Provide Steric Hindrance
against Thermal Aggregation. Journal of Agricultural and Food Chemistry,
60(38), 9754-9762.
Liu, G., & Zhong, Q. (2013). Thermal aggregation properties of whey protein glycated
with various saccharides. Food Hydrocolloids, 32(1), 87-96.
Liu, J., Ru, Q., & Ding, Y. (2012). Glycation a promising method for food protein
modification: Physicochemical properties and structure, a review. Food Research
International, 49(1), 170-183.
Luz Sanz, M., Corzo-Martínez, M., Rastall, R. A., Olano, A., & Moreno, F. J. (2007).
Characterization and in vitro digestibility of bovine β-lactoglobulin glycated with
galactooligosaccharides. J. of Agricultural and Food Chemistry, 55(19), 7916-
7925.
Martins, S. I., Jongen, W. M., & Van Boekel, M. A. (2000). A review of Maillard
reaction in food and implications to kinetic modelling. Trends in Food Science &
Technology, 11(9), 364-373.
Matmaroh, K., Benjakul, S., & Tanaka, M. (2006). Effect of reactant concentrations on
the Maillard reaction in a fructose–glycine model system and the inhibition of
black tiger shrimp polyphenoloxidase. Food Chemistry, 98(1), 1-8.
163
McClements, D. J. (2002). Modulation of globular protein functionality by weakly
interacting cosolvents. Critical Reviews in Food Science and Nutrition, 42(5),
417-471.
McGarrahan, E. (1982). Considerations necessary to provide for sterilized milk and milk
products in hermetically sealed, nonrefrigerated containers. Journal of Dairy
Science, 65(10), 2023-2034.
Medrano, A., Abirached, C., Panizzolo, L., Moyna, P., & Añón, M. (2009). The effect of
glycation on foam and structural properties of β-lactoglobulin. Food Chemistry,
113(1), 127-133.
Mettler, S., Rusch, C., & Colombani, P. C. (2006). Osmolality and pH of sport and other
drinks available in Switzerland. Schweizerische Zeitschrift fur Sportmedizin und
Sporttraumatologie, 54(3), 92.
Monahan, F. J., German, J. B., & Kinsella, J. E. (1995). Effect of pH and temperature on
protein unfolding and thiol/disulfide interchange reactions during heat-induced
gelation of whey proteins. Journal of Agricultural and Food Chemistry, 43(1), 46-
52.
Morales, F. J., & Jiménez-Pérez, S. (2001). Free radical scavenging capacity of Maillard
reaction products as related to colour and fluorescence. Food Chemistry, 72(1),
119-125.
Mottram, D. S., Wedzicha, B. L., & Dodson, A. T. (2002). Food chemistry: acrylamide is
formed in the Maillard reaction. Nature, 419(6906), 448-449.
O’Loughlin, I., Murray, B., Kelly, P., FitzGerald, R., & Brodkorb, A. (2012). Enzymatic
hydrolysis of heat-induced aggregates of whey protein isolate. Journal of
Agricultural and Food Chemistry, 60(19), 4895-4904.
Pedrosa, C., Trisciuzzi, C., & Ferreira, S. T. (1997). Effects of glycosylation on
functional properties of vicilin, the 7S storage globulin from pea (Pisum sativum).
Journal of Agricultural and Food Chemistry, 45(6), 2025-2030.
Sanmartín, E., Arboleya, J. C., Villamiel, M., & Moreno, F. J. (2009). Recent Advances
in the Recovery and Improvement of Functional Proteins from Fish Processing
By‐Products: Use of Protein Glycation as an Alternative Method. Comprehensive
Reviews in Food Science and Food Safety, 8(4), 332-344.
Surewicz, W., Mantsch, H., & Havel, H. (1996). Spectroscopic Methods for Determining
Protein Structure in Solution. Weinheim: Wiley-VCH.
Tainturier, G., Roullier, L., Martenot, J. P., & Lorient, D. (1992). Electroassisted
glycosylation of bovine casein: An alternative to the use of reducing chemicals in
N-alkylation of proteins. Journal of Agricultural and Food Chemistry, 40(5), 760-
763.
Van Boekel, M. (2001). Kinetic aspects of the Maillard reaction: a critical review.
Food/Nahrung, 45(3), 150-159.
164
Wang, Q., & Ismail, B. (2012). Effect of Maillard-induced glycosylation on the
nutritional quality, solubility, thermal stability and molecular Configuration of
whey protein. International Dairy Journal, 25(2), 112-122.
Wang, W., Zhong, Q., & Hu, Z. (2013). Nanoscale understanding of thermal aggregation
of whey protein pretreated by transglutaminase. Journal of Agricultural and Food
Chemistry, 61(2), 435-446.
Yost, E. C., Tejedor-Tejedor, M. I., & Anderson, M. A. (1990). In situ CIR-FTIR
characterization of salicylate complexes at the goethite/aqueous solution interface.
Environmental Science & Technology, 24(6), 822-828.
Zhang, W., & Zhong, Q. (2010). Microemulsions as nanoreactors to produce whey
protein nanoparticles with enhanced heat stability by thermal pretreatment. Food
Chemistry, 119(4), 1318-1325.
Zhong, Q., Wang, W., Hu, Z., & Ikeda, S. (2013). Sequential preheating and
transglutaminase pretreatments improve stability of whey protein isolate at pH 7.0
during thermal sterilization. Food Hydrocolloids, 31(2), 306-316.
Zhu, D., Damodaran, S., & Lucey, J. A. (2008). Formation of whey protein isolate
(WPI)− dextran conjugates in aqueous solutions. Journal of Agricultural and
Food Chemistry, 56(16), 7113-7118
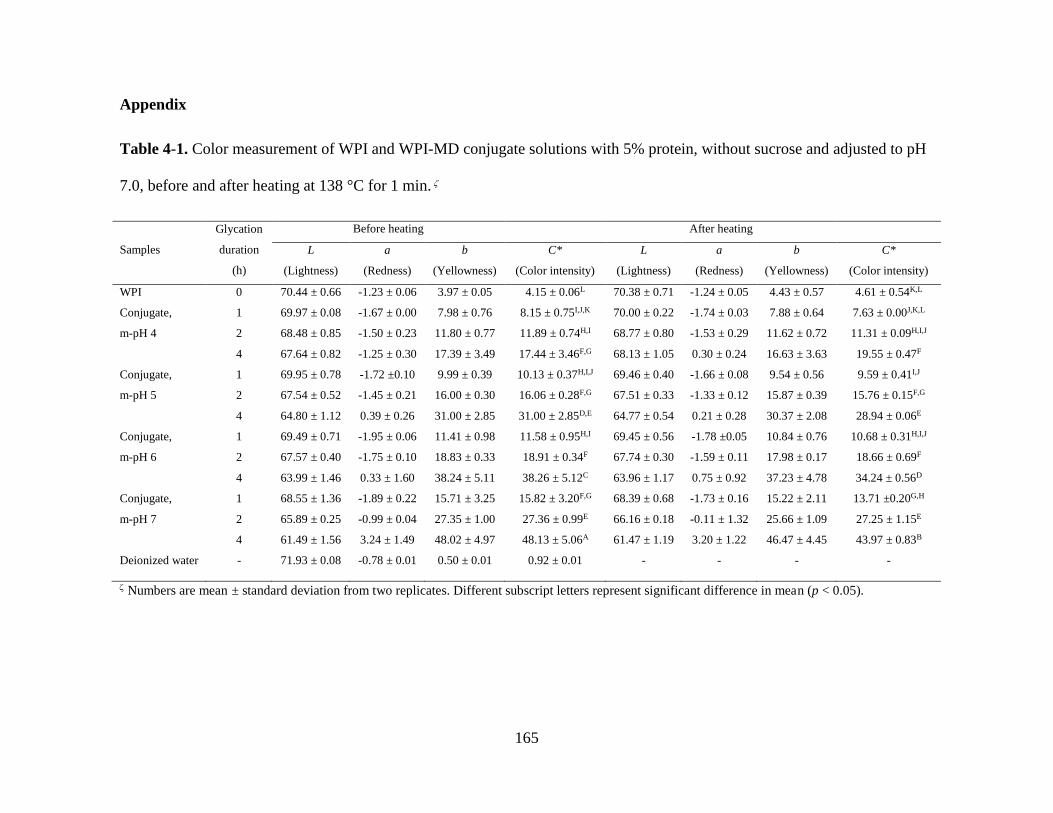
165
Appendix
Table 4-1. Color measurement of WPI and WPI-MD conjugate solutions with 5% protein, without sucrose and adjusted to pH
7.0, before and after heating at 138 °C for 1 min.
Samples
Glycation
duration
(h)
Before heating After heating
L
(Lightness)
a
(Redness)
b
(Yellowness)
C*
(Color intensity)
L
(Lightness)
a
(Redness)
b
(Yellowness)
C*
(Color intensity)
WPI 0 70.44 ± 0.66 -1.23 ± 0.06 3.97 ± 0.05 4.15 ± 0.06L 70.38 ± 0.71 -1.24 ± 0.05 4.43 ± 0.57 4.61 ± 0.54K,L
Conjugate,
m-pH 4
1 69.97 ± 0.08 -1.67 ± 0.00 7.98 ± 0.76 8.15 ± 0.75I,J,K 70.00 ± 0.22 -1.74 ± 0.03 7.88 ± 0.64 7.63 ± 0.00J,K,L
2 68.48 ± 0.85 -1.50 ± 0.23 11.80 ± 0.77 11.89 ± 0.74H,I 68.77 ± 0.80 -1.53 ± 0.29 11.62 ± 0.72 11.31 ± 0.09H,I,J
4 67.64 ± 0.82 -1.25 ± 0.30 17.39 ± 3.49 17.44 ± 3.46F,G 68.13 ± 1.05 0.30 ± 0.24 16.63 ± 3.63 19.55 ± 0.47F
Conjugate,
m-pH 5
1 69.95 ± 0.78 -1.72 ±0.10 9.99 ± 0.39 10.13 ± 0.37H,I,J 69.46 ± 0.40 -1.66 ± 0.08 9.54 ± 0.56 9.59 ± 0.41I,J
2 67.54 ± 0.52 -1.45 ± 0.21 16.00 ± 0.30 16.06 ± 0.28F,G 67.51 ± 0.33 -1.33 ± 0.12 15.87 ± 0.39 15.76 ± 0.15F,G
4 64.80 ± 1.12 0.39 ± 0.26 31.00 ± 2.85 31.00 ± 2.85D,E 64.77 ± 0.54 0.21 ± 0.28 30.37 ± 2.08 28.94 ± 0.06E
Conjugate,
m-pH 6
1 69.49 ± 0.71 -1.95 ± 0.06 11.41 ± 0.98 11.58 ± 0.95H,I 69.45 ± 0.56 -1.78 ±0.05 10.84 ± 0.76 10.68 ± 0.31H,I,J
2 67.57 ± 0.40 -1.75 ± 0.10 18.83 ± 0.33 18.91 ± 0.34F 67.74 ± 0.30 -1.59 ± 0.11 17.98 ± 0.17 18.66 ± 0.69F
4 63.99 ± 1.46 0.33 ± 1.60 38.24 ± 5.11 38.26 ± 5.12C 63.96 ± 1.17 0.75 ± 0.92 37.23 ± 4.78 34.24 ± 0.56D
Conjugate,
m-pH 7
1 68.55 ± 1.36 -1.89 ± 0.22 15.71 ± 3.25 15.82 ± 3.20F,G 68.39 ± 0.68 -1.73 ± 0.16 15.22 ± 2.11 13.71 ±0.20G,H
2 65.89 ± 0.25 -0.99 ± 0.04 27.35 ± 1.00 27.36 ± 0.99E 66.16 ± 0.18 -0.11 ± 1.32 25.66 ± 1.09 27.25 ± 1.15E
4 61.49 ± 1.56 3.24 ± 1.49 48.02 ± 4.97 48.13 ± 5.06A 61.47 ± 1.19 3.20 ± 1.22 46.47 ± 4.45 43.97 ± 0.83B
Deionized water - 71.93 ± 0.08 -0.78 ± 0.01 0.50 ± 0.01 0.92 ± 0.01 - - - -
Numbers are mean ± standard deviation from two replicates. Different subscript letters represent significant difference in mean (p < 0.05).
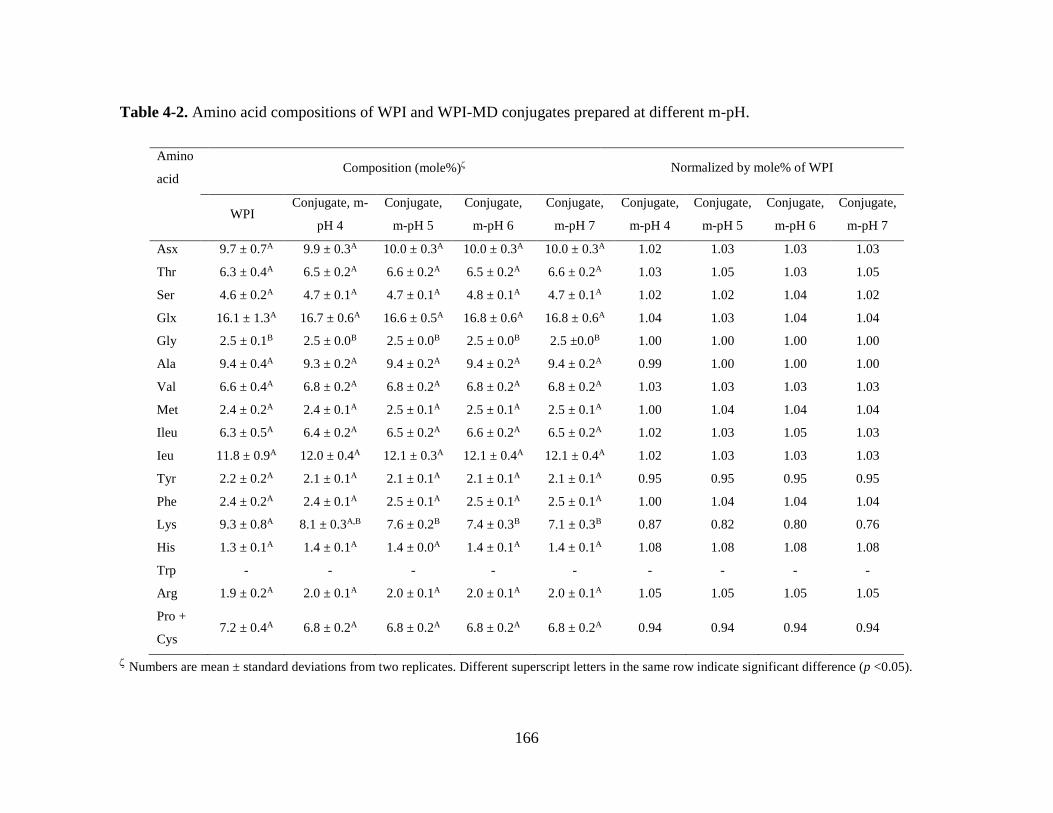
166
Table 4-2. Amino acid compositions of WPI and WPI-MD conjugates prepared at different m-pH.
Amino
acid Composition (mole%) Normalized by mole% of WPI
WPI Conjugate, m-
pH 4
Conjugate,
m-pH 5
Conjugate,
m-pH 6
Conjugate,
m-pH 7
Conjugate,
m-pH 4
Conjugate,
m-pH 5
Conjugate,
m-pH 6
Conjugate,
m-pH 7
Asx 9.7 ± 0.7A 9.9 ± 0.3A 10.0 ± 0.3A 10.0 ± 0.3A 10.0 ± 0.3A 1.02 1.03 1.03 1.03
Thr 6.3 ± 0.4A 6.5 ± 0.2A 6.6 ± 0.2A 6.5 ± 0.2A 6.6 ± 0.2A 1.03 1.05 1.03 1.05
Ser 4.6 ± 0.2A 4.7 ± 0.1A 4.7 ± 0.1A 4.8 ± 0.1A 4.7 ± 0.1A 1.02 1.02 1.04 1.02
Glx 16.1 ± 1.3A 16.7 ± 0.6A 16.6 ± 0.5A 16.8 ± 0.6A 16.8 ± 0.6A 1.04 1.03 1.04 1.04
Gly 2.5 ± 0.1B 2.5 ± 0.0B 2.5 ± 0.0B 2.5 ± 0.0B 2.5 ±0.0B 1.00 1.00 1.00 1.00
Ala 9.4 ± 0.4A 9.3 ± 0.2A 9.4 ± 0.2A 9.4 ± 0.2A 9.4 ± 0.2A 0.99 1.00 1.00 1.00
Val 6.6 ± 0.4A 6.8 ± 0.2A 6.8 ± 0.2A 6.8 ± 0.2A 6.8 ± 0.2A 1.03 1.03 1.03 1.03
Met 2.4 ± 0.2A 2.4 ± 0.1A 2.5 ± 0.1A 2.5 ± 0.1A 2.5 ± 0.1A 1.00 1.04 1.04 1.04
Ileu 6.3 ± 0.5A 6.4 ± 0.2A 6.5 ± 0.2A 6.6 ± 0.2A 6.5 ± 0.2A 1.02 1.03 1.05 1.03
Ieu 11.8 ± 0.9A 12.0 ± 0.4A 12.1 ± 0.3A 12.1 ± 0.4A 12.1 ± 0.4A 1.02 1.03 1.03 1.03
Tyr 2.2 ± 0.2A 2.1 ± 0.1A 2.1 ± 0.1A 2.1 ± 0.1A 2.1 ± 0.1A 0.95 0.95 0.95 0.95
Phe 2.4 ± 0.2A 2.4 ± 0.1A 2.5 ± 0.1A 2.5 ± 0.1A 2.5 ± 0.1A 1.00 1.04 1.04 1.04
Lys 9.3 ± 0.8A 8.1 ± 0.3A,B 7.6 ± 0.2B 7.4 ± 0.3B 7.1 ± 0.3B 0.87 0.82 0.80 0.76
His 1.3 ± 0.1A 1.4 ± 0.1A 1.4 ± 0.0A 1.4 ± 0.1A 1.4 ± 0.1A 1.08 1.08 1.08 1.08
Trp - - - - - - - - -
Arg 1.9 ± 0.2A 2.0 ± 0.1A 2.0 ± 0.1A 2.0 ± 0.1A 2.0 ± 0.1A 1.05 1.05 1.05 1.05
Pro +
Cys 7.2 ± 0.4A 6.8 ± 0.2A 6.8 ± 0.2A 6.8 ± 0.2A 6.8 ± 0.2A 0.94 0.94 0.94 0.94
Numbers are mean ± standard deviations from two replicates. Different superscript letters in the same row indicate significant difference (p <0.05).
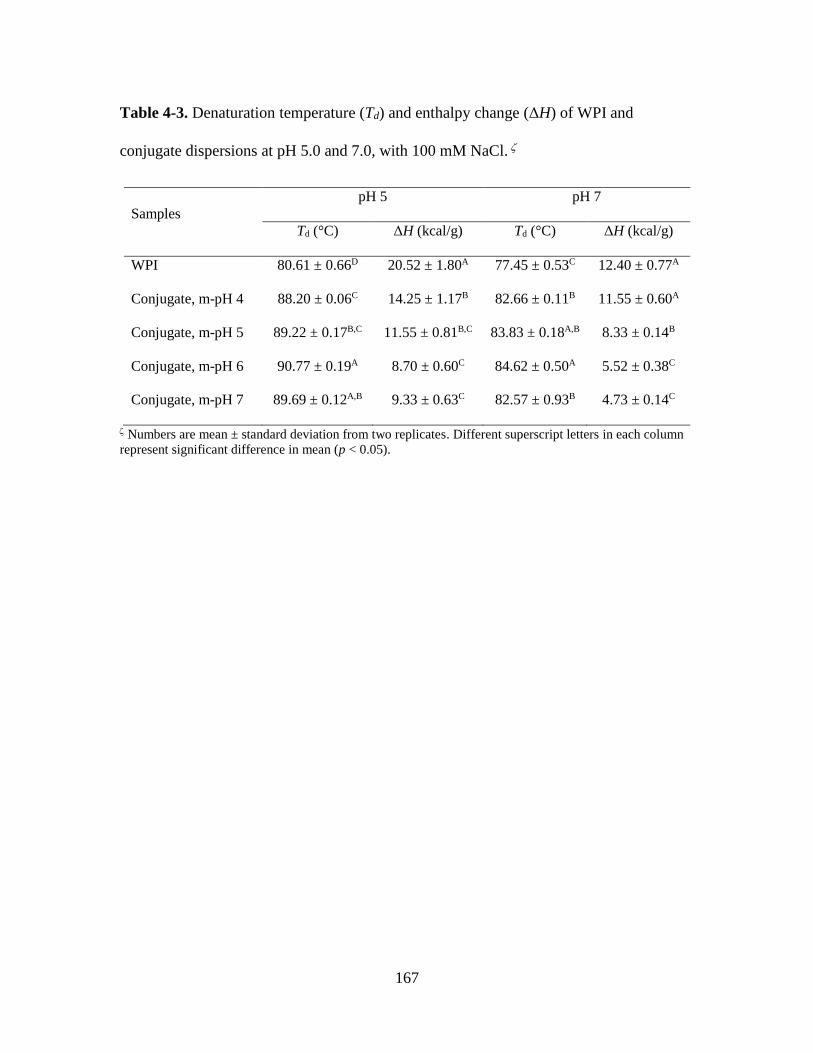
167
Table 4-3. Denaturation temperature (Td) and enthalpy change (ΔH) of WPI and
conjugate dispersions at pH 5.0 and 7.0, with 100 mM NaCl.
Samples
pH 5 pH 7
Td (°C) ΔH (kcal/g) Td (°C) ΔH (kcal/g)
WPI 80.61 ± 0.66D 20.52 ± 1.80A 77.45 ± 0.53C 12.40 ± 0.77A
Conjugate, m-pH 4 88.20 ± 0.06C 14.25 ± 1.17B 82.66 ± 0.11B 11.55 ± 0.60A
Conjugate, m-pH 5 89.22 ± 0.17B,C 11.55 ± 0.81B,C 83.83 ± 0.18A,B 8.33 ± 0.14B
Conjugate, m-pH 6 90.77 ± 0.19A 8.70 ± 0.60C 84.62 ± 0.50A 5.52 ± 0.38C
Conjugate, m-pH 7 89.69 ± 0.12A,B 9.33 ± 0.63C 82.57 ± 0.93B 4.73 ± 0.14C
Numbers are mean ± standard deviation from two replicates. Different superscript letters in each column
represent significant difference in mean (p < 0.05).
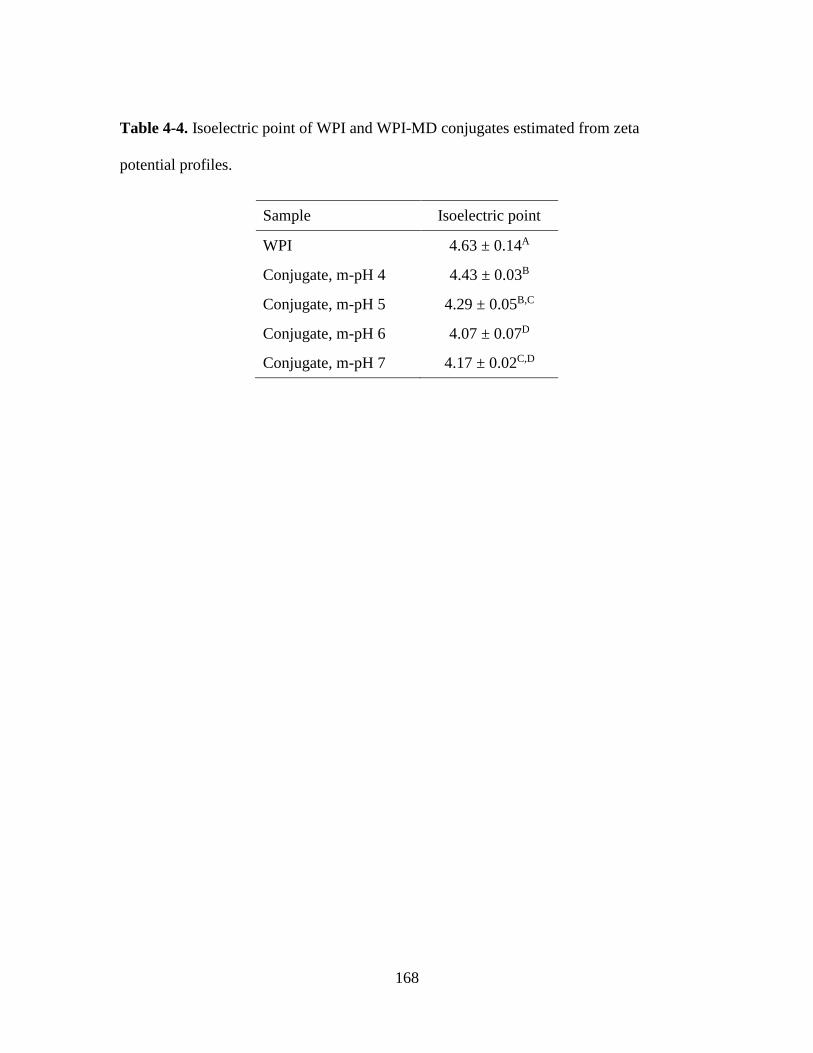
168
Table 4-4. Isoelectric point of WPI and WPI-MD conjugates estimated from zeta
potential profiles.
Sample Isoelectric point
WPI 4.63 ± 0.14A
Conjugate, m-pH 4 4.43 ± 0.03B
Conjugate, m-pH 5 4.29 ± 0.05B,C
Conjugate, m-pH 6 4.07 ± 0.07D
Conjugate, m-pH 7 4.17 ± 0.02C,D
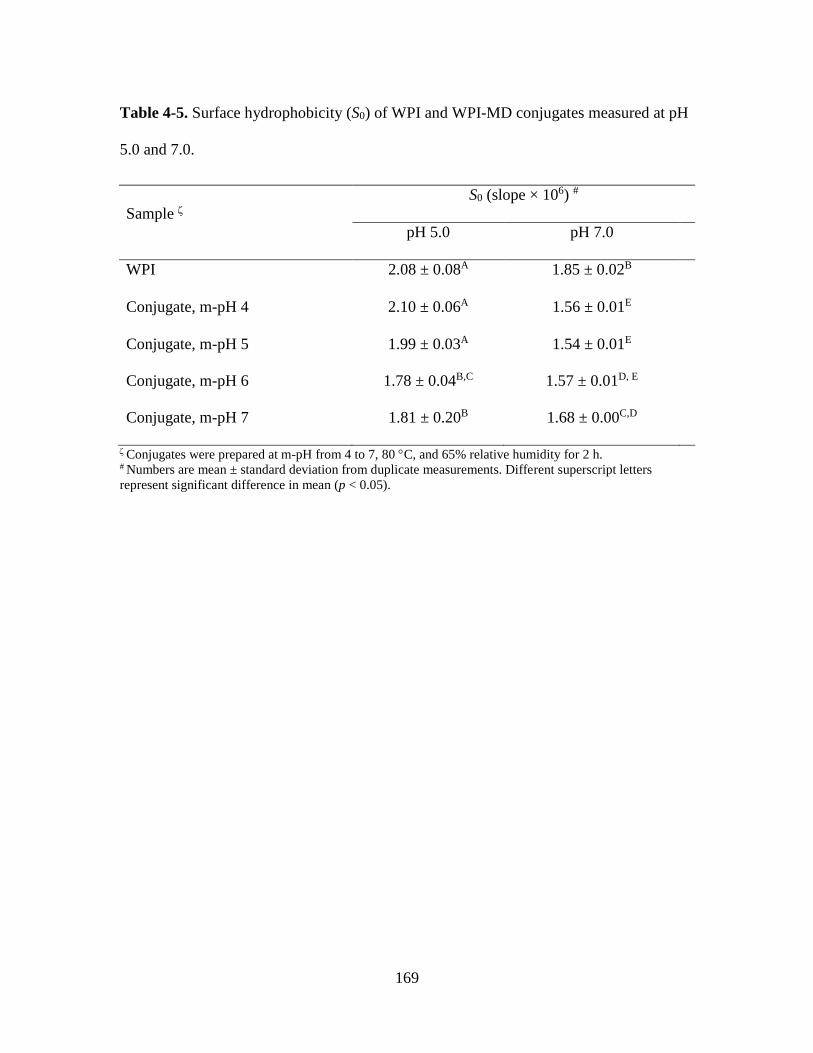
169
Table 4-5. Surface hydrophobicity (S0) of WPI and WPI-MD conjugates measured at pH
5.0 and 7.0.
Sample
S0 (slope × 106) #
pH 5.0 pH 7.0
WPI 2.08 ± 0.08A 1.85 ± 0.02B
Conjugate, m-pH 4 2.10 ± 0.06A 1.56 ± 0.01E
Conjugate, m-pH 5 1.99 ± 0.03A 1.54 ± 0.01E
Conjugate, m-pH 6 1.78 ± 0.04B,C 1.57 ± 0.01D, E
Conjugate, m-pH 7 1.81 ± 0.20B 1.68 ± 0.00C,D
Conjugates were prepared at m-pH from 4 to 7, 80 C, and 65% relative humidity for 2 h. # Numbers are mean ± standard deviation from duplicate measurements. Different superscript letters
represent significant difference in mean (p < 0.05).
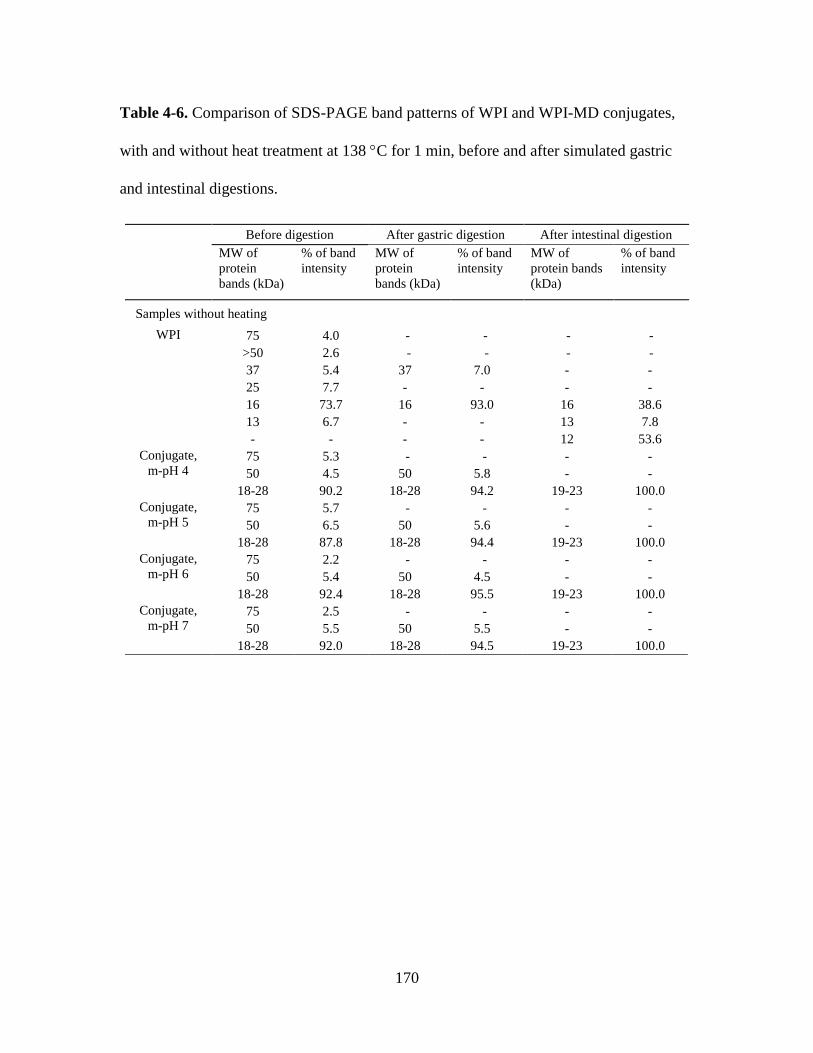
170
Table 4-6. Comparison of SDS-PAGE band patterns of WPI and WPI-MD conjugates,
with and without heat treatment at 138 C for 1 min, before and after simulated gastric
and intestinal digestions.
Before digestion After gastric digestion After intestinal digestion
MW of
protein
bands (kDa)
% of band
intensity
MW of
protein
bands (kDa)
% of band
intensity
MW of
protein bands
(kDa)
% of band
intensity
Samples without heating
WPI 75 4.0 - - - -
>50 2.6 - - - -
37 5.4 37 7.0 - -
25 7.7 - - - -
16 73.7 16 93.0 16 38.6
13 6.7 - - 13 7.8
- - - - 12 53.6
Conjugate,
m-pH 4 75 5.3 - - - -
50 4.5 50 5.8 - -
18-28 90.2 18-28 94.2 19-23 100.0
Conjugate,
m-pH 5 75 5.7 - - - -
50 6.5 50 5.6 - -
18-28 87.8 18-28 94.4 19-23 100.0
Conjugate,
m-pH 6 75 2.2 - - - -
50 5.4 50 4.5 - -
18-28 92.4 18-28 95.5 19-23 100.0
Conjugate,
m-pH 7 75 2.5 - - - -
50 5.5 50 5.5 - -
18-28 92.0 18-28 94.5 19-23 100.0
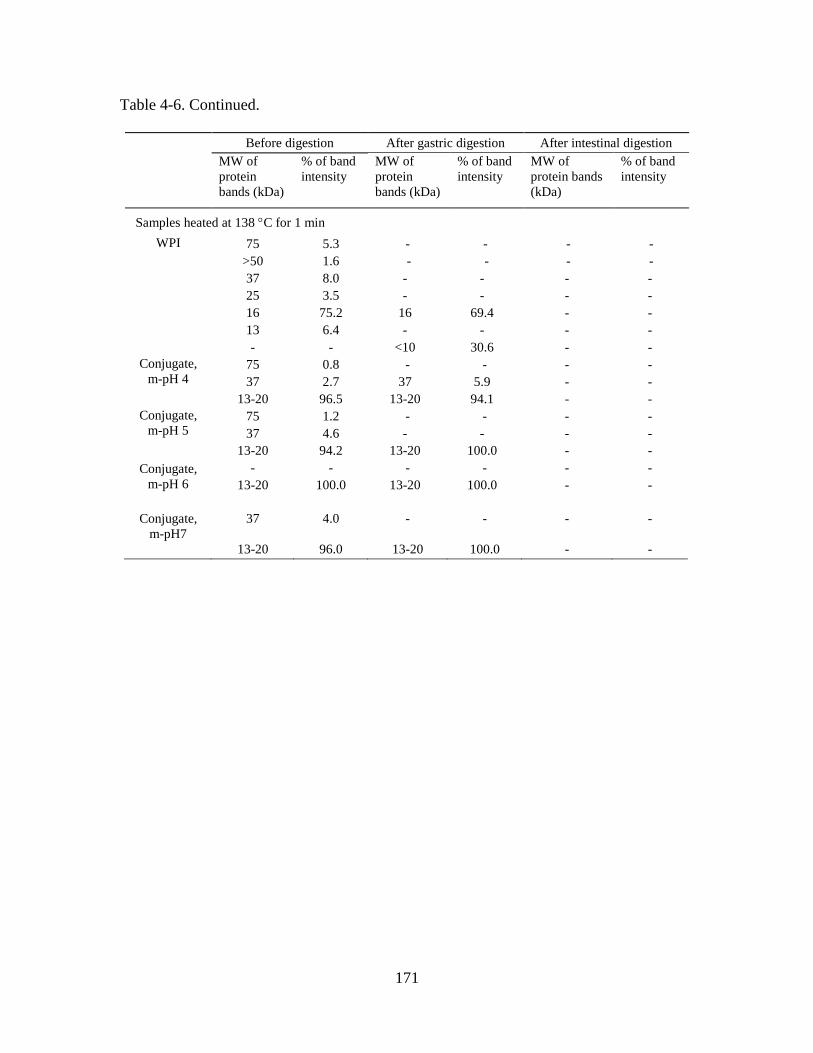
171
Table 4-6. Continued.
Before digestion After gastric digestion After intestinal digestion
MW of
protein
bands (kDa)
% of band
intensity
MW of
protein
bands (kDa)
% of band
intensity
MW of
protein bands
(kDa)
% of band
intensity
Samples heated at 138 C for 1 min
WPI 75 5.3 - - - -
>50 1.6 - - - -
37 8.0 - - - -
25 3.5 - - - -
16 75.2 16 69.4 - -
13 6.4 - - - -
- - <10 30.6 - -
Conjugate,
m-pH 4 75 0.8 - - - -
37 2.7 37 5.9 - -
13-20 96.5 13-20 94.1 - -
Conjugate,
m-pH 5 75 1.2 - - - -
37 4.6 - - - -
13-20 94.2 13-20 100.0 - -
Conjugate,
m-pH 6
- - - - - -
13-20 100.0 13-20 100.0 - -
Conjugate,
m-pH7
37 4.0 - - - -
13-20 96.0 13-20 100.0 - -
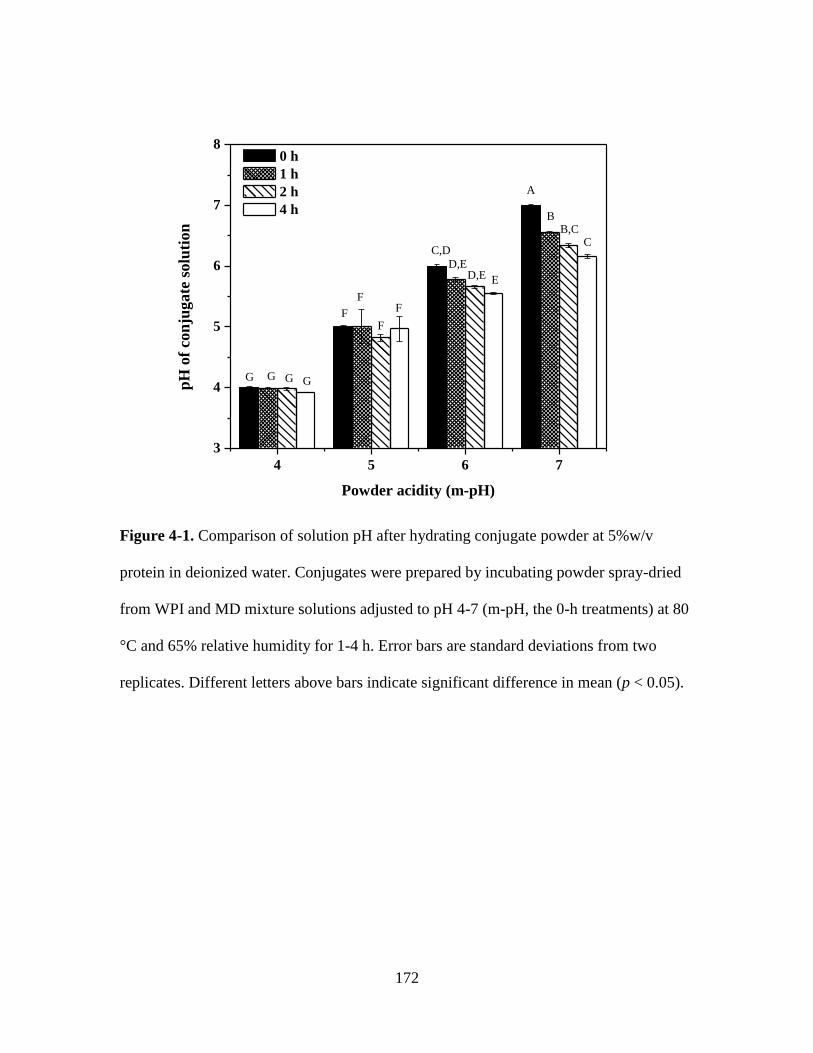
172
4 5 6 7
3
4
5
6
7
8
C
E
F
G
B,C
D,E
F
GG
D,E
F
B
A
C,D
F
pH
of
con
jugate
solu
tion
Powder acidity (m-pH)
0 h
1 h
2 h
4 h
G
Figure 4-1. Comparison of solution pH after hydrating conjugate powder at 5%w/v
protein in deionized water. Conjugates were prepared by incubating powder spray-dried
from WPI and MD mixture solutions adjusted to pH 4-7 (m-pH, the 0-h treatments) at 80
°C and 65% relative humidity for 1-4 h. Error bars are standard deviations from two
replicates. Different letters above bars indicate significant difference in mean (p < 0.05).
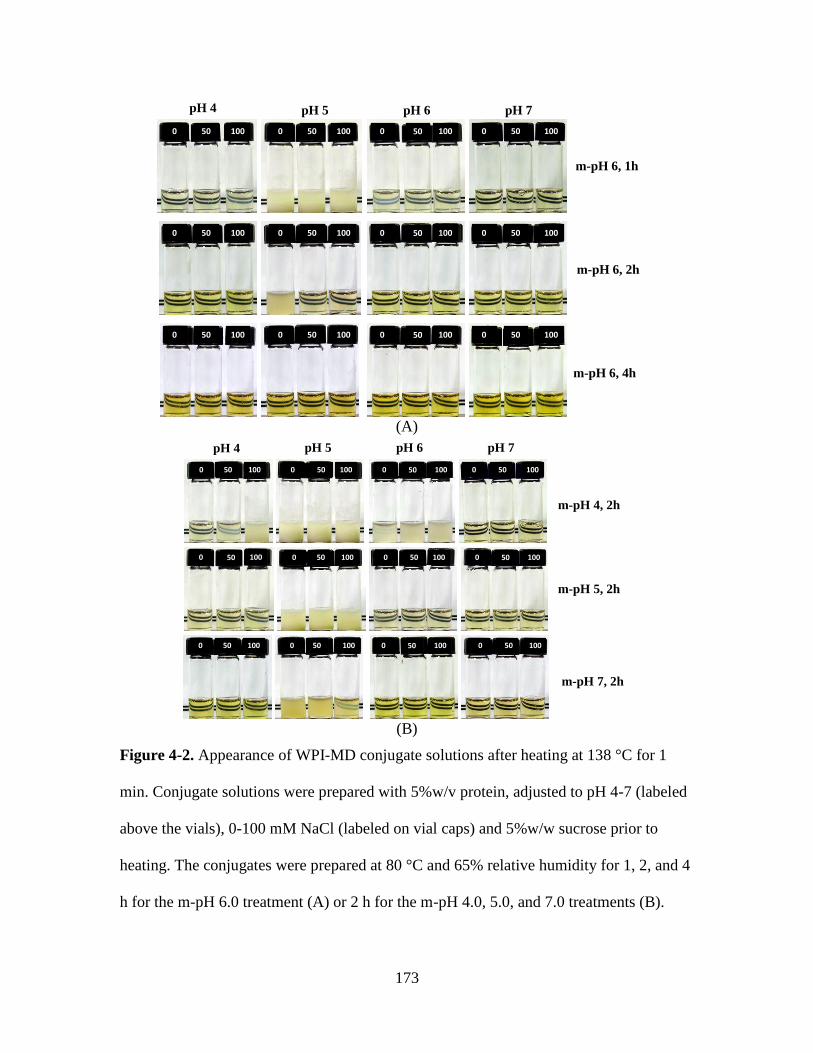
173
pH 4 pH 5 pH 6 pH 7
0 10050 0 10050 0 10050 0 10050
m-pH 6, 1h
0 10050 0 10050 0 10050 0 10050
0 10050 0 10050 0 10050 0 10050
m-pH 6, 2h
m-pH 6, 4h
(A)
0 10050 0 10050 0 10050 0 10050
0 10050 0 10050 0 10050 0 10050
0 10050 0 10050 0 10050 0 10050
m-pH 4, 2h
m-pH 5, 2h
pH 4 pH 5 pH 6 pH 7
m-pH 7, 2h
(B)
Figure 4-2. Appearance of WPI-MD conjugate solutions after heating at 138 °C for 1
min. Conjugate solutions were prepared with 5%w/v protein, adjusted to pH 4-7 (labeled
above the vials), 0-100 mM NaCl (labeled on vial caps) and 5%w/w sucrose prior to
heating. The conjugates were prepared at 80 °C and 65% relative humidity for 1, 2, and 4
h for the m-pH 6.0 treatment (A) or 2 h for the m-pH 4.0, 5.0, and 7.0 treatments (B).
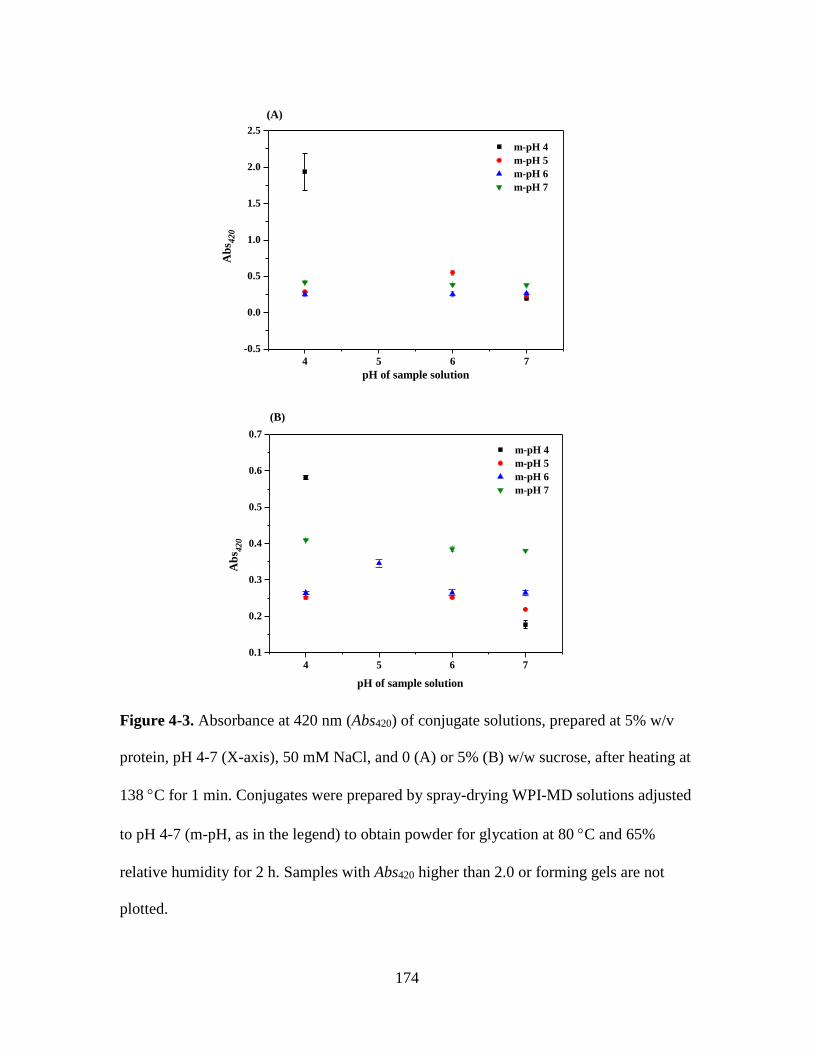
174
4 5 6 7
-0.5
0.0
0.5
1.0
1.5
2.0
2.5
Ab
s 420
pH of sample solution
m-pH 4
m-pH 5
m-pH 6
m-pH 7
(A)
4 5 6 7
0.1
0.2
0.3
0.4
0.5
0.6
0.7
(B)
Ab
s 420
pH of sample solution
m-pH 4
m-pH 5
m-pH 6
m-pH 7
Figure 4-3. Absorbance at 420 nm (Abs420) of conjugate solutions, prepared at 5% w/v
protein, pH 4-7 (X-axis), 50 mM NaCl, and 0 (A) or 5% (B) w/w sucrose, after heating at
138 C for 1 min. Conjugates were prepared by spray-drying WPI-MD solutions adjusted
to pH 4-7 (m-pH, as in the legend) to obtain powder for glycation at 80 C and 65%
relative humidity for 2 h. Samples with Abs420 higher than 2.0 or forming gels are not
plotted.
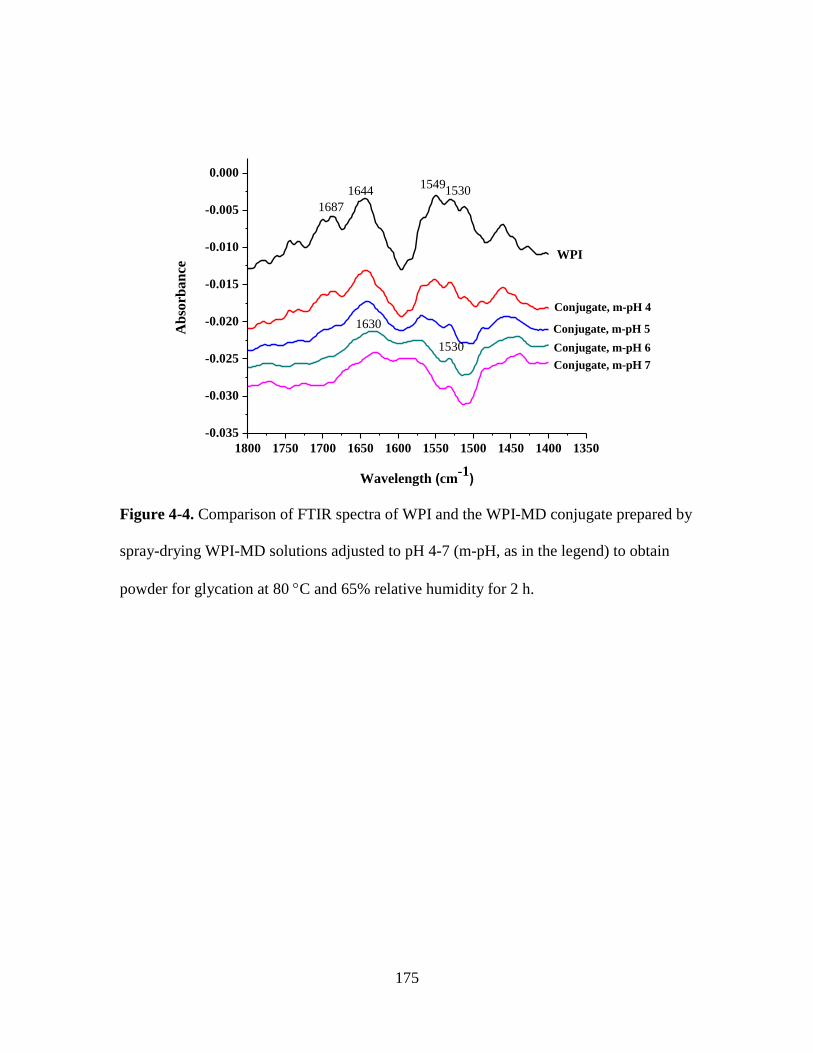
175
1800 1750 1700 1650 1600 1550 1500 1450 1400 1350
-0.035
-0.030
-0.025
-0.020
-0.015
-0.010
-0.005
0.0001549
1530
Conjugate, m-pH 7
Conjugate, m-pH 6
Conjugate, m-pH 5
Conjugate, m-pH 4
1530
1687
1630Ab
sorb
an
ce
Wavelength (cm-1)
1644
WPI
Figure 4-4. Comparison of FTIR spectra of WPI and the WPI-MD conjugate prepared by
spray-drying WPI-MD solutions adjusted to pH 4-7 (m-pH, as in the legend) to obtain
powder for glycation at 80 C and 65% relative humidity for 2 h.
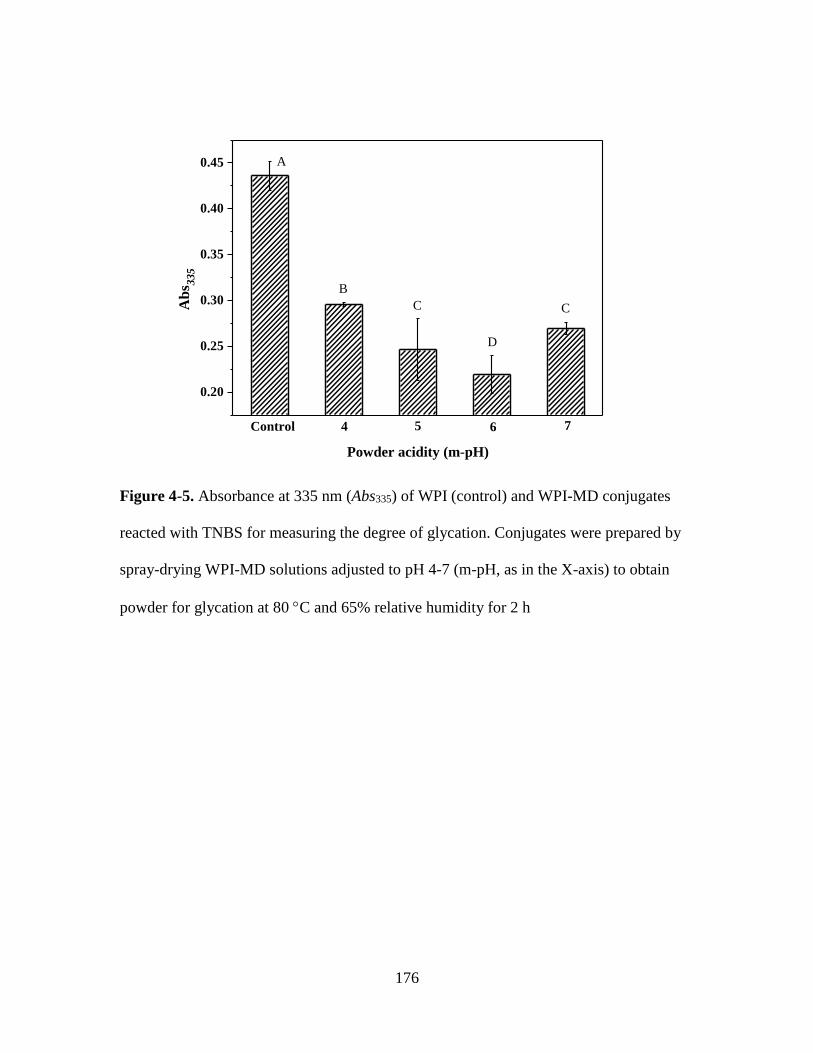
176
0.20
0.25
0.30
0.35
0.40
0.45
D
CC
B
765
Ab
s 335
Powder acidity (m-pH)
Control 4
A
Figure 4-5. Absorbance at 335 nm (Abs335) of WPI (control) and WPI-MD conjugates
reacted with TNBS for measuring the degree of glycation. Conjugates were prepared by
spray-drying WPI-MD solutions adjusted to pH 4-7 (m-pH, as in the X-axis) to obtain
powder for glycation at 80 C and 65% relative humidity for 2 h
177
Figure 4-6. Comparison of DSC thermograms of WPI solutions at pH 5 and 7 (A) and
WPI-MD conjugate solutions at pH 5 (B) and 7 (C). Conjugates were prepared by spray-
drying WPI-MD solutions adjusted to pH 4-7 (m-pH, as in the legend) to obtain powder
for glycation at 80 C and 65% relative humidity for 2 h. All samples were prepared at
1%w/v protein with 100 mM NaCl for DSC.
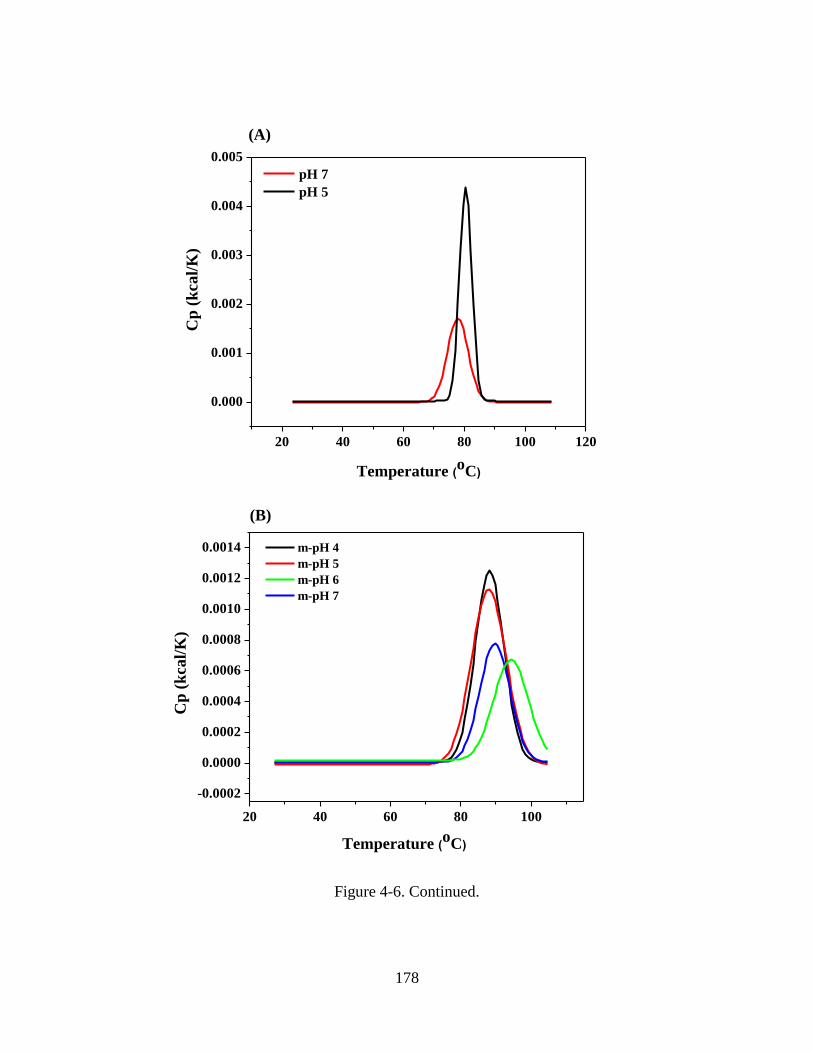
178
20 40 60 80 100 120
0.000
0.001
0.002
0.003
0.004
0.005
Cp
(k
cal/
K)
Temperature (oC)
pH 7
pH 5
(A)
20 40 60 80 100
-0.0002
0.0000
0.0002
0.0004
0.0006
0.0008
0.0010
0.0012
0.0014
Cp
(k
cal/
K)
Temperature (oC)
m-pH 4
m-pH 5
m-pH 6
m-pH 7
(B)
Figure 4-6. Continued.
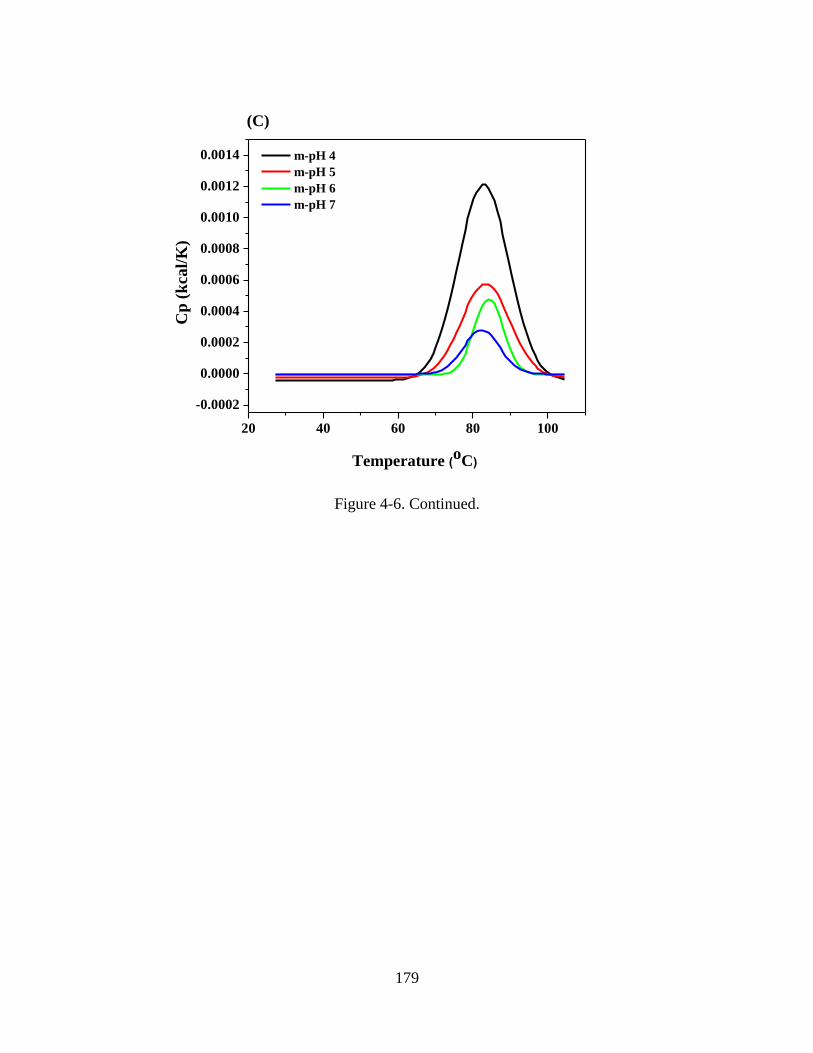
179
20 40 60 80 100
-0.0002
0.0000
0.0002
0.0004
0.0006
0.0008
0.0010
0.0012
0.0014
Cp
(k
ca
l/K
)
Temperature (oC)
m-pH 4
m-pH 5
m-pH 6
m-pH 7
(C)
Figure 4-6. Continued.
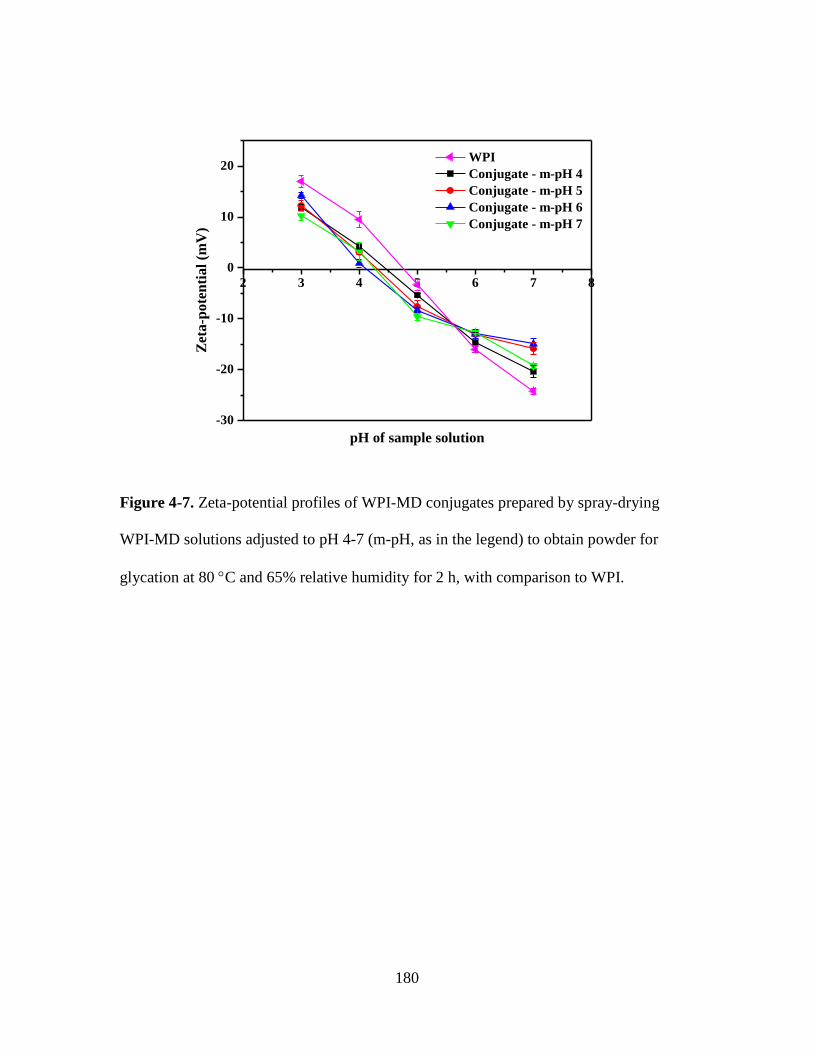
180
2 3 4 5 6 7 8
-30
-20
-10
0
10
20
Zet
a-p
ote
nti
al
(mV
)
WPI
Conjugate - m-pH 4
Conjugate - m-pH 5
Conjugate - m-pH 6
Conjugate - m-pH 7
pH of sample solution
Figure 4-7. Zeta-potential profiles of WPI-MD conjugates prepared by spray-drying
WPI-MD solutions adjusted to pH 4-7 (m-pH, as in the legend) to obtain powder for
glycation at 80 C and 65% relative humidity for 2 h, with comparison to WPI.
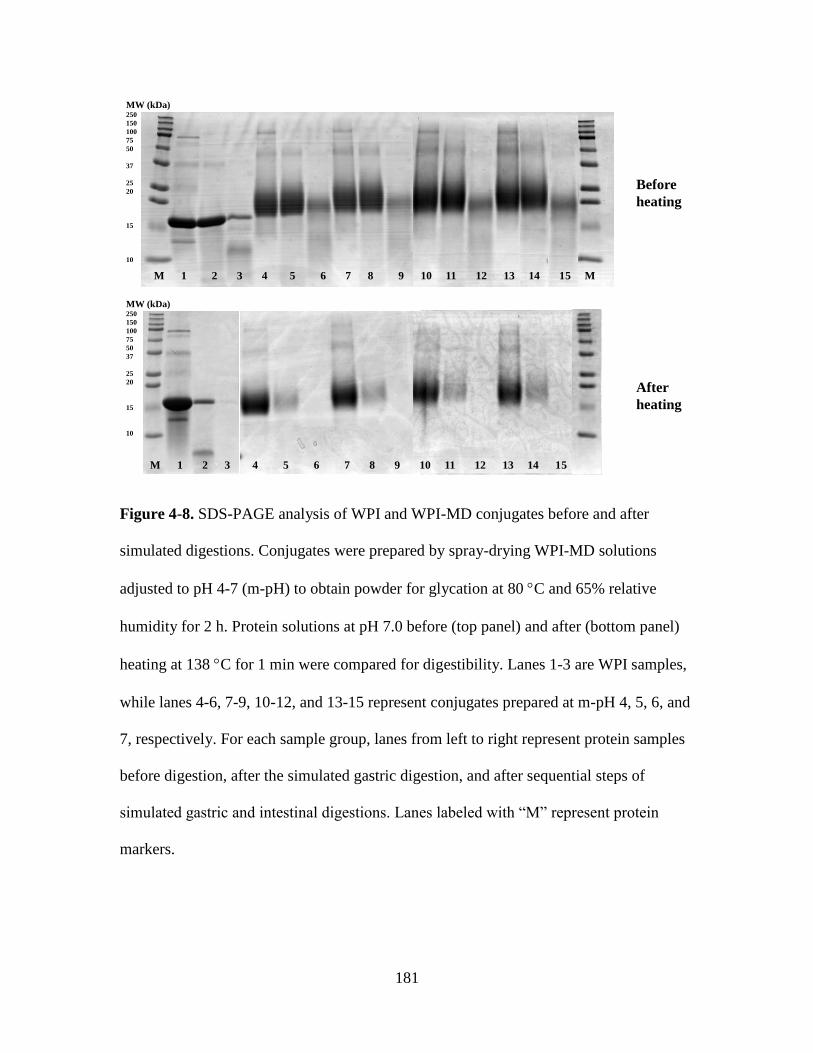
181
MW (kDa)250
150
100
75
50
37
25
20
15
10
MW (kDa)250
150
100
75
50
37
25
20
15
10
M 1 2 3 4 5 6 7 8 9 10 11 12 13 14 15 M
Before
heating
After
heating
M 1 2 3 4 5 6 7 8 9 10 11 12 13 14 15 M
Figure 4-8. SDS-PAGE analysis of WPI and WPI-MD conjugates before and after
simulated digestions. Conjugates were prepared by spray-drying WPI-MD solutions
adjusted to pH 4-7 (m-pH) to obtain powder for glycation at 80 C and 65% relative
humidity for 2 h. Protein solutions at pH 7.0 before (top panel) and after (bottom panel)
heating at 138 C for 1 min were compared for digestibility. Lanes 1-3 are WPI samples,
while lanes 4-6, 7-9, 10-12, and 13-15 represent conjugates prepared at m-pH 4, 5, 6, and
7, respectively. For each sample group, lanes from left to right represent protein samples
before digestion, after the simulated gastric digestion, and after sequential steps of
simulated gastric and intestinal digestions. Lanes labeled with “M” represent protein
markers.
182
Chapter 5. Improved Thermal Stability of Whey
Protein-Maltodextrin Conjugates at pH 5.0 by D-
Glucose, Sucrose, D-cellobiose, and Lactose
183
5.1 Abstract
Thermal aggregation of whey proteins is a challenge for applications in clear food
products with acidity around their isoelectric points (~pH 5.0). Glycating whey proteins
with sufficient maltodextrins by the Maillard reaction effectively prevents thermal
aggregation but produces undesirable color and byproducts. Co-solutes improve heat
stability of whey proteins at neutral pH but have not been studied at pH 5.0. In this work,
mono- and di-saccharides were studied for heat stability improvements of whey protein-
maltodextrin conjugates at pH 5.0. The saccharides improved heat stability of conjugates
by increasing the viscosity and denaturation properties (increased denaturation
temperature and reduced enthalpy change), corresponding to smaller aggregates. Sucrose
was more effective in improving thermal stability than D-cellobiose, lactose and D-
glucose and was interpreted by the stronger preferential interactions with conjugates.
Therefore, the saccharides can be used to stabilize conjugates during heating so that
milder conjugation conditions can be adopted to reduce the color and byproduct
formation during the Maillard reaction.
Keywords: WPI-MD conjugates, co-solute, heat stability at pH 5.0, preferential
interactions, thermal denaturation properties, atomic force microscopy
184
5.2 Introduction
Whey proteins, with β-lactoglobulin and α-lactalbumin being the most abundant,
are utilized widely in food and health-care products due to their nutritional and functional
properties. Heat treatment is used to ensure product safety and shelf life and improve
functional properties (Jelen, Rattray, & Fox, 1995). However, whey proteins can be
readily denatured and aggregate during heating, which limits their application in food
products, especially those with pH around the isoelectric point (pI). β-Lactogloblin,
which is 5.2, and 4.8-5.1 for α-Lactalbumin, and bovine serum albumin, respectively
(Bryant & McClements, 1998). The thermal stability of whey proteins is determined by
the overall impacts of attractive and repulsive forces (Bryant & McClements, 1998;
Semenova, Antipova, & Belyakova, 2002). Hydrophobic attraction is strengthened after
thermal denaturation of whey proteins because of the exposure of initially embedded
hydrophobic amino acids (Bryant & McClements, 1998). At pH around pI, electrostatic
repulsion is weakened due to the reduced net charge, and whey proteins aggregate easily
during heating (Bryant & McClements, 1998).
Glycation is an effective approach to prevent whey protein aggregation during
thermal treatment because of the introduction of steric repulsion on protein surface (Liu
& Zhong, 2012, 2013). Glycation of proteins with reducing saccharides is based on the
Maillard reaction between an available amino group and a carbonyl-containing
saccharide, with the reaction scheme and rate being dependent on temperature, duration,
acidity, water activity, protein:saccharide ratio, and intrinsic properties of proteins and
saccharides (BeMiller, 1996). In general, a higher temperature, a longer glycation
duration, and a higher pH favor the production of Maillard reaction products that have
185
been linked to undesired brown color and negative health concerns such as
carcinogenicity (Mottram, Wedzicha, & Dodson, 2002). Therefore, glycation conditions
shall be chosen based on the balance of enabling functional properties and minimizing
negative impacts due to the Maillard reaction.
Co-solutes such as sucrose, glycerol, sorbitol, and polysaccharides can increase
the denaturation temperature and improve heat stability of whey proteins at neutral pH
(Baier & McClements, 2001; Chanasattru, Decker, & McClements, 2007;
Chantrapornchai & McClements, 2002; Kulmyrzaev, Bryant, & McClements, 2000). Co-
solutes influence the conformation of proteins and thus protein interactions and
functionalities by directly binding to surface groups of proteins or indirectly altering the
structure of water around proteins (Timasheff, 1998). The improved thermal stability of
whey proteins by sucrose was proposed to be attributed by the increased viscosity of
continuous phase, causing a decrease in the frequency of protein-protein collisions, the
increased protein unfolding temperature, and the reduced extent of protein unfolding
(Kulmyrzaev, Bryant, & McClements, 2000). The latter two can be caused by the
preferential exclusion of sucrose from the vicinity immediately surrounding proteins
(Arakawa & Timasheff, 1982; Baier & McClements, 2001; Lee & Timasheff, 1981),
causing protein molecules to fold more tightly or aggregate to reduce the surface area
(Baier & McClements, 2001; Parsegian, Rand, & Rau, 1995; Timasheff, 1998). The
chemical potential () difference of protein molecules in a pure solvent and those in a co-
solute solution is the transfer free energy (Gtr – eq. 1) (McClements, 2002; Timasheff,
1993, 1998). When Gtr is negative, protein molecules prefer to be surrounded by co-
solute molecules (McClements, 2002), and it is therefore possible to change the
186
conformation, aggregation, and thermal stability of proteins (Timasheff, 1998). Gtr is
affected by the type and concentration of co-solutes.
(1)
Impacts of co-solutes on protein heat stability and interactions at acidity near pI
have not been studied. In this study, the first objective was to study the improvement of
thermal stability of whey protein isolate-maltodextrin (WPI-MD) conjugates during the
simulated ultra-high temperature (UHT) processing at pH 5.0 by D-glucose, sucrose,
lactose and D-cellobiose. This acidity, near the whey protein pI, has been observed to
require the most extensive glycation to obtain heat stability (Damodaran, 2008). UHT is
required by the US Food and Drug Administration for low acid foods (pH > 4.6) and is
equivalent to 138 C for at least 8 s for dairy products (McGarrahan, 1982). To study
conditions expected in applications, unconjugated WPI and MD were not removed, and
the added mono- and di-saccharides are referred to co-solutes hereafter. The second
objective was to understand the mechanism of thermal stability improvement of
conjugates at pH 5.0 by studying rheological and thermal denaturation properties of
conjugates based on the preferential interaction theory (Baier & McClements, 2001). The
structures after heating were characterized using atomic force microscopy (AFM) to
better understand impacts of co-solutes on protein aggregation during heating. Findings
from this work can be used to reduce the extent of Maillard reaction to achieve thermal
stability of conjugates while reducing the negative impacts due to glycation.
187
5.3 Material and Methods
5.3.1 Materials
The WPI was provided by Hilmar Ingredients (Hilmar, CA). MD with a dextrose
equivalent (DE) of 18 was obtained from Grain Processing Corp (Muscatine, IA). D-
cellobiose was purchased from Sigma-Aldrich Corp. (St. Louis, MO). Other chemicals
were purchased from Fisher Scientific (Pittsburgh, PA). Deionized water was used
throughout all experiments.
5.3.2 Preparation of glycated WPI
WPI and MD were dissolved at 2.5% w/v each in deionized water and hydrated
overnight at room temperature (21 C). The mixture solution was adjusted to pH 6.0 and
spray dried at an inlet temperature of 160 °C, an outlet temperature of ca. 90 °C, an air
flow rate of 20 m3/h, and a feed rate of 250 mL/h (model B-290 Mini-Spray Dryer, Büchi
Laboratoriums-Technik, Flawil, Switzerland). The spray-dried powder was incubated in a
humidity-controlled incubator (model IG420U Environmental chamber, Yamato
Scientific America Inc., CA) at 80 °C and 65% relative humidity for 2 h to produce the
glycated WPI. The powder was then collected and stored at -20 °C in a freezer.
5.3.3 Preparation of protein solution for thermal stability test
Glycated WPI powder was dissolved at 5%w/v protein either in deionized water
(solution A) or an aqueous solution with 0.8 M co-solutes - D-glucose, sucrose, lactose,
or D-cellobiose (Solution B). Solutions A and B were mixed at different volume ratios to
obtain a protein concentration of 5% w/v and a co-solute concentration of 0, 0.2, 0.4, 0.6
188
and 0.8 M. Protein solutions were adjusted to pH 5.0 using 1 N and 0.25 N HCl and 0-
100 mM NaCl. The final mixtures were heated at 138 ± 1 °C for 1 min in a glycerol bath.
The simulated heating duration was longer than the 8 s required for dairy products
(McGarrahan, 1982) to provide sufficient thermal treatment throughout the vials. The
visual appearance of samples after heating was photographed for comparison.
5.3.4 Turbidity measurement
Samples after heating were diluted with 10 mM phosphate citrate buffer (pH 5.0)
to a protein concentration of 1.0%w/v. Absorbance of the dispersions was determined at
600 nm using a UV/Vis spectrophotometer (ThermoScientific, Waltham, MA) and used
as an indicator of turbidity. All samples were measured in duplicate.
5.3.5 Viscosity measurement
The viscosity of protein solutions before and after heating at 138 °C for 1 min was
measured using an AR2000 rheometer (TA Instrument, New Castle, DE) and a cone and
plate geometry. The cone diameter was 40 mm and the angle was 1°. Approximately 500
μL of a sample was transferred on the Peltier plate and a shear rate ramp from 0.1 to 100
s-1 was performed at 20 °C. Each sample was measured in duplicate and the averages
were reported.
5.3.6 Differential scanning calorimetry (DSC)
A VP-DSC calorimeter (MicroCal, Northamption, MA) was used to study thermal
denaturation properties of glycated WPI as affected by co-solutes. Solutions were
prepared at 1%w/v protein, pH 5.0, and 0-0.8 M co-solutes. Approximately 1 mL of a
189
solution was injected into the sample cell and degassed for 10 min at 25 °C. Deionized
water was used as a reference. The scanning was conducted from 25 to 115 °C at a rate of
1.5 °C/min, with temperature equilibrium for 5 min both before and after scanning. The
denaturation temperature (Tm) was determined from each thermogram, and the enthalpy
change (ΔH) was calculated from the area of the endothermic peak using a two-state
model (supplied by MicroCal).
5.3.7 Water activity measurement of co-solute solutions
Water activity (aw) of co-solute solutions at room temperature (~25 °C) was
measured using an AquaLab water activity meter (Series 3TE, Decagon Devices, Inc.,
Pullman, WA). The instrument was calibrated using a 6 M NaCl solution with aw of
0.760 before measurement.
5.3.8 Morphology of aggregated particles
The aggregate structure after heat treatment was studied using a Multimode VIII
AFM (Bruker Inc., Billerica, MA). A rectangular cantilever probe (FESPA, Bruker Corp,
Santa Barbara, CA) with a length of 200-250 μm and a quoted force constant of 2.80 N/m
was used for scanning at the tapping mode. Two L of a sample solution, which was
diluted to a protein concentration of 10 ppm with deionized water previously, was spread
evenly onto a freshly cleaved mica sheet. Heights of individual particles in the
topography images were determined using section analysis provided by the NanoScope
Analysis software of AFM instrument (version 1.40, Bruker, Inc., Billerica, MA).
190
5.3.9 Statistical analysis
All results were presented as averages and standard deviations from replicates.
The analysis of the variance (ANOVA) of the data was conducted using the SAS
software (version 9.2, SAS institute, Cary, NC). Significant differences were analyzed
using the least significant difference (LSD) test with a confidence interval of 95%.
5.4 Results and discussion
5.4.1 Heat stability of conjugates as impacted by co-solutes
The appearance and absorbance at 600 nm (Abs600) of samples with 0-0.8 M co-
solutes after heating at 138 °C for 1 min and dilution to 1% w/v protein are presented in
Figures 5-1 and 5-2, respectively. In general, a decrease in turbidity after heating was
observed for samples with a higher co-solute and/or NaCl concentrations. At 0 mM NaCl,
samples with sucrose showed the sharpest decrease in Abs600 after heating, followed by
those with D-cellobiose, lactose and D-glucose (Figure 5-2A). At 50 and 100 mM NaCl,
the effects of co-solute types became less significant, especially for those between
sucrose and cellobiose, and heat stable samples were observed for treatments with 0.4 M
or higher co-solutes (Figure 5-1), showing no significant difference in Abs600 (P > 0.05).
The ability of cellobiose in stabilizing conjugates is attractive for food applications
because it is not digestible by humans (Nakamura, Oku, & Ichinose, 2004; Sheriff.,
2004), does not increase the calorie intake (Stoker, 2011), and is bland in taste (Sheriff.,
2004).
191
At pH 5.0, around the pI of whey proteins, electrostatic repulsion is expected to
be weak, and the heat-induced aggregation of WPI-MD conjugates is the balance of
hydrophobic attraction and repulsive steric interactions provided by the MD moiety on
proteins (Liu and Zhong, 2012). Before heating, hydrophobic interactions are not stronger
than steric repulsion for the WPI-MD conjugates produced at the studied glycation
conditions, as indicated by transparent samples in Figure 5-1. Thermal denaturation of
conjugates strengthens hydrophobic interactions that are a function of environmental
conditions such as pH, ionic strength, co-solutes, and temperature (Dissanayake,
Ramchandran, Donkor, & Vasiljevic, 2013; Dissanayake, Ramchandran, Piyadasa, &
Vasiljevic, 2012). The extent of aggregation also is a function of protein and co-solute
concentrations. These properties are presented below.
5.4.2 Viscosity of WPI-MD conjugate solutions with co-solutes
The rheograms of samples with 0 mM NaCl at a shear rate ramp of 0.1 – 100 s-
1were determined before heating at 138 °C for 1 min, presented in Figure 5-3. Generally,
a higher shear stress therefore apparent viscosity at a same shear rate was observed at a
higher co-solute concentration (Figure 5-3), as expected. WPI solution showed the
Newtonian behavior, while the gradual increase in co-solute concentration resulted in
shear-thinning behavior. The samples with glucose had the lowest viscosity, and those
with disaccharides did not show significant differences. This is expected because glucose
samples had lower mass concentrations than other treatments with same molar
concentrations of co-solutes. A higher viscosity at a higher co-solute concentration
generally agreed with heat stability improvements in Figures 5-1 and 5-2, except the
192
better heat stability of glucose treatments than lactose treatments at 0 mM NaCl (Figure
5-2A). Therefore, viscosity alone is insufficient to interpret the improved heat stability of
WPI-MD conjugates by co-solutes.
5.4.3 Thermal denaturation properties of WPI-MD conjugates as impacted by co-
solutes
The influences of co-solutes and their concentrations on the denaturation
properties of WPI-MD conjugates at pH 5.0 and 0 mM NaCl are summarized in Table 5-
1. The Tm shifted from ~ 81 °C of WPI to ~89 °C of WPI-MD conjugates, and ΔH
decreased from ~21 kcal/g to ~15 kcal/g after glycation. Therefore, glycation of WPI
with MD reduces the degree of protein denaturation during heating. However, glycation
at the studied conditions alone is insufficient to prevent protein aggregation during the
simulated UHT processing (Figures 5-1 and 5-2), likely because the number of MD
glycated on whey proteins did not provide sufficiently strong steric repulsion (Akhtar &
Dickinson, 2003; Liu & Zhong, 2012; Mulsow, Jacob, & Henle, 2009; Zhu, Damodaran,
& Lucey, 2010). Extensive glycation, e.g., with MD at 60 C for 72 h, was observed to
stabilize WPI after heating at 138 C for 1 min, but the sample color was dark (Liu &
Zhong, 2012).
Co-solutes further improved denaturation properties of conjugates, shown for
thermograms in Figure 5-4 and the determined Tm and ΔH in Table 5-1. Overall, Tm
increased while ΔH decreased with an increase in co-solute concentration, with the extent
varying with the co-solute type. The interactions between protein molecules and
surrounding water molecules can be altered in the presence of co-solutes, resulting in
193
significant changes in the magnitude and slope of specific heat (Figure 5-4) (Freire,
1995). The decrease of ΔH indicates a more compact conformation of protein molecules
and the contact between protein surface and water molecules becomes less favorable at a
higher co-solute concentration. When heat stability and denaturation properties are
correlated, it appears that a sufficient increase of Tm (to ~ 92 °C at 0 mM NaCl) and a
sufficient decrease of ΔH (to 7.8 kcal/g at 0 mM NaCl) by co-solutes are needed to
produce transparent samples after the simulated UHT processing. This was enabled by
supplementing no lower than 0.4 M sucrose, 0.6 M cellosbiose, or 0.8 M of other three
co-solutes (Table 5-1). It was also observed that 0.2 M cellobiose was the least effective
in increasing Tm but most effective in reducing ΔH. Proteins start unfolding when heated
to its Tm and ΔH is correlated with the content of ordered secondary structures
(Koshiyama, Hamano, & Fukushima, 1981). The ΔH is a net result of endothermic
reactions, such as disruption of hydrogen bonds (Privalov & Khechinashvili, 1974), and
exothermic reactions, such as breakup of hydrophobic interactions (Arntfield & Murray,
1981; Jackson & Brandts, 1970). D-cellobiose may be more effective than other co-
solutes in suppressing the breakage of hydrogen bonds or the breakup of hydrophobic
interactions, thus reducing conformational changes of WPI during heating.
5.4.4 Estimation of changes in preferential interactions between conjugates and co-
solutes
The increase of Tm by co-solutes has been proposed to be caused by the
preferential exclusion of co-solutes from the region surrounding proteins (Baier &
McClement, 2001; Semenova, Antipova, & Belyakova, 2002). This can be caused by
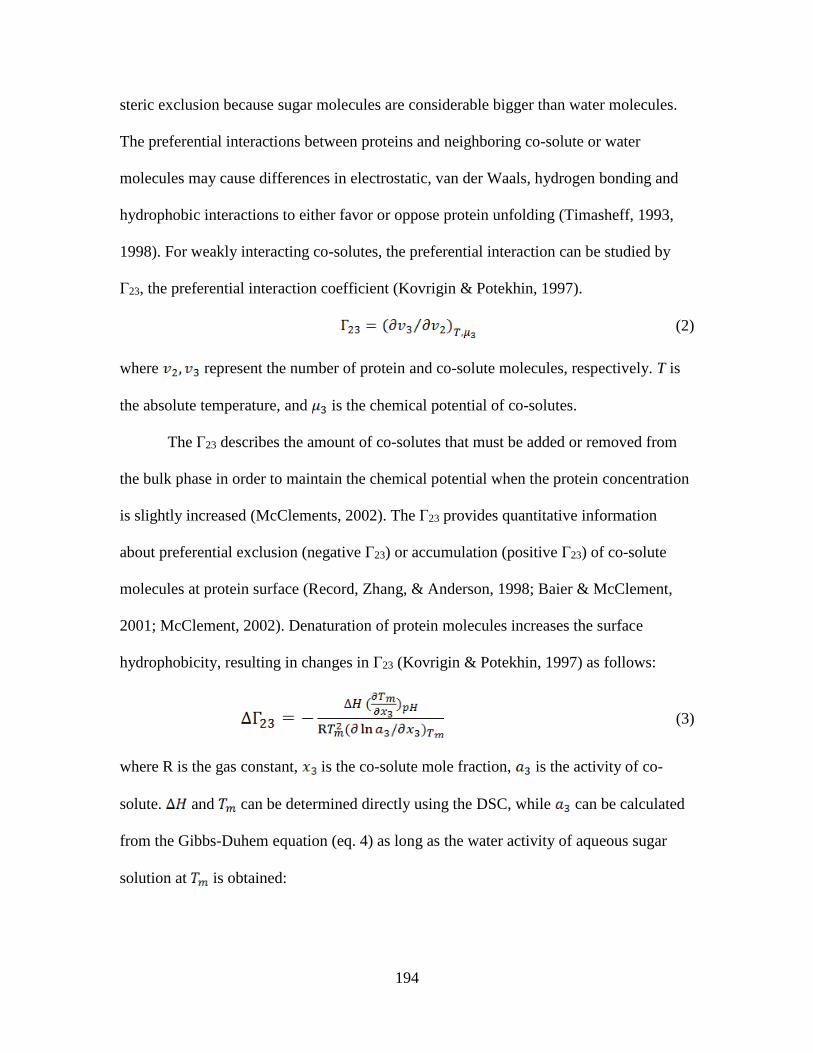
194
steric exclusion because sugar molecules are considerable bigger than water molecules.
The preferential interactions between proteins and neighboring co-solute or water
molecules may cause differences in electrostatic, van der Waals, hydrogen bonding and
hydrophobic interactions to either favor or oppose protein unfolding (Timasheff, 1993,
1998). For weakly interacting co-solutes, the preferential interaction can be studied by
Γ23, the preferential interaction coefficient (Kovrigin & Potekhin, 1997).
(2)
where represent the number of protein and co-solute molecules, respectively. T is
the absolute temperature, and is the chemical potential of co-solutes.
The Γ23 describes the amount of co-solutes that must be added or removed from
the bulk phase in order to maintain the chemical potential when the protein concentration
is slightly increased (McClements, 2002). The Γ23 provides quantitative information
about preferential exclusion (negative Γ23) or accumulation (positive Γ23) of co-solute
molecules at protein surface (Record, Zhang, & Anderson, 1998; Baier & McClement,
2001; McClement, 2002). Denaturation of protein molecules increases the surface
hydrophobicity, resulting in changes in Γ23 (Kovrigin & Potekhin, 1997) as follows:
(3)
where R is the gas constant, is the co-solute mole fraction, is the activity of co-
solute. and can be determined directly using the DSC, while can be calculated
from the Gibbs-Duhem equation (eq. 4) as long as the water activity of aqueous sugar
solution at is obtained:
195
(4)
where is the activity coefficient ( ), and subscript 1 represents water.
Although a higher activity coefficient is expected at a higher temperature
(Gharsallaoui, Rogé, Génotelle, & Mathlouthi, 2008), the effect of temperature on water
activity was found almost negligible for dilute solutions but significant for very
concentrated solutions, e.g., >80% w/w sucrose (Starzak & Mathlouthi, 2006). It was also
observed that the activity coefficient of sucrose in aqueous solutions with <50% w/w
sucrose is similar between 0 and 80 C (Gharsallaoui, Rogé, Génotelle, & Mathlouthi,
2008). Because the maximum co-solute concentration is 0.8 M (higher mass
concentrations for disaccharides, equivalent to 21.5% w/w), the temperature effects on
water activity are treated to be negligible in the present study.
The Γ23 values at various molar concentrations of co-solutes are shown in Figure
5-5. Generally, Γ23 became more negative as the co-solute concentration increased,
suggesting the preference of the native state over the denatured state of proteins. A series
of studies revealed that co-solutes are preferentially excluded from the vicinity of a
globular protein at relatively low temperatures but accumulate at higher temperatures
(Xie & Timasheff, 1997). The developed thermodynamic model suggests the
accumulation of co-solutes on protein surface is not thermodynamically favored because
this creates a gradient of co-solute concentration between the region next to the protein
surface and the bulk phase. The accumulation of co-solutes on protein surface also
reduces the contact between protein and water. The Γ23 is a result of combined effects
due to changes in the exposure of ionic, polar and nonpolar groups of proteins to nearby
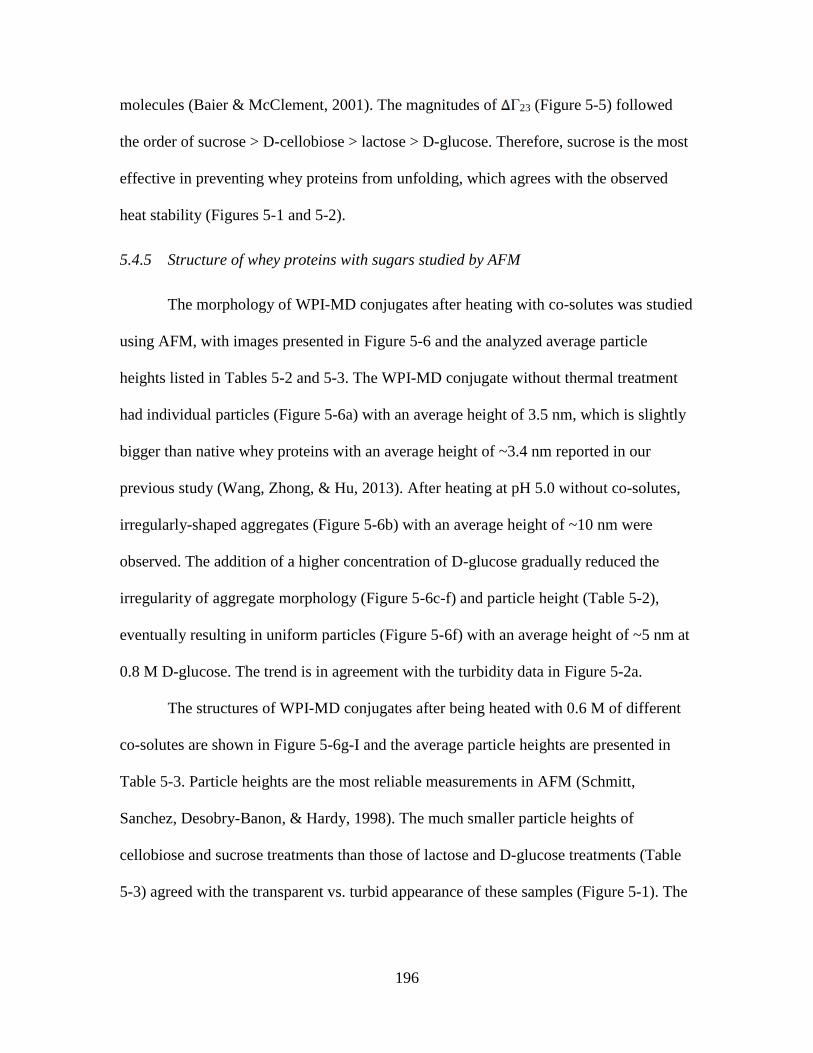
196
molecules (Baier & McClement, 2001). The magnitudes of Γ23 (Figure 5-5) followed
the order of sucrose > D-cellobiose > lactose > D-glucose. Therefore, sucrose is the most
effective in preventing whey proteins from unfolding, which agrees with the observed
heat stability (Figures 5-1 and 5-2).
5.4.5 Structure of whey proteins with sugars studied by AFM
The morphology of WPI-MD conjugates after heating with co-solutes was studied
using AFM, with images presented in Figure 5-6 and the analyzed average particle
heights listed in Tables 5-2 and 5-3. The WPI-MD conjugate without thermal treatment
had individual particles (Figure 5-6a) with an average height of 3.5 nm, which is slightly
bigger than native whey proteins with an average height of ~3.4 nm reported in our
previous study (Wang, Zhong, & Hu, 2013). After heating at pH 5.0 without co-solutes,
irregularly-shaped aggregates (Figure 5-6b) with an average height of ~10 nm were
observed. The addition of a higher concentration of D-glucose gradually reduced the
irregularity of aggregate morphology (Figure 5-6c-f) and particle height (Table 5-2),
eventually resulting in uniform particles (Figure 5-6f) with an average height of ~5 nm at
0.8 M D-glucose. The trend is in agreement with the turbidity data in Figure 5-2a.
The structures of WPI-MD conjugates after being heated with 0.6 M of different
co-solutes are shown in Figure 5-6g-I and the average particle heights are presented in
Table 5-3. Particle heights are the most reliable measurements in AFM (Schmitt,
Sanchez, Desobry-Banon, & Hardy, 1998). The much smaller particle heights of
cellobiose and sucrose treatments than those of lactose and D-glucose treatments (Table
5-3) agreed with the transparent vs. turbid appearance of these samples (Figure 5-1). The
197
AFM analysis showed that the thermal aggregation of WPI-MD conjugates occurred in
all treatments, was less significant at a higher co-solute concentration, and was a function
of co-solute structure. The AFM results indirectly suggest differences in the interactions
between co-solutes and conjugates, as revealed by above analyses.
5.5 Conclusions
The current study showed that heat stability of WPI-MD conjugates at pH 5.0 can
be improved by supplementing a sufficient quantity of mono- or disaccharides. Sucrose
was the most effective stabilizer, followed by D-cellobiose, lactose and D-glucose. In
addition to the reduced collision frequency between conjugate molecules due to the
increased viscosity, co-solutes impacted the denaturation of conjugates differently. The
differences in heat stability improvements by co-solutes were correlated with preferential
interaction coefficients analyzed based on thermal denaturation properties of conjugates
and activity of co-solutes. Findings from this study can be used to prepare clear
beverages at around pH 5.0 that would otherwise require extensively-reacted Maillard-
type products.
Acknowledgements
The authors acknowledge the financial support from the University of Tennessee
and Dairy Research Institute (Rosemont, IL). Thanks are due to the Bioanalytical
Resources Facility at the University of Tennessee for use of VP-DSC. We also appreciate
Dr. Yue Zhang for her useful suggestions and discussions.
198
References
Akhtar, M., & Dickinson, E. (2003). Emulsifying properties of whey protein–dextran
conjugates at low pH and different salt concentrations. Colloids and Surfaces B:
Biointerfaces, 31(1), 125-132.
Arakawa, T., & Timasheff, S. N. (1982). Stabilization of protein structure by sugars.
Biochemistry, 21(25), 6536-6544.
Arntfield, S., & Murray, E. (1981). The influence of processing parameters on food
protein functionality I. Differential scanning calorimetry as an indicator of protein
denaturation. Canadian Institute of Food Science and Technology Journal, 14(4),
289-294.
Baier, S., & McClements, D. J. (2001). Impact of preferential interactions on thermal
stability and gelation of bovine serum albumin in aqueous sucrose solutions.
Journal of Agricultural and Food Chemistry, 49(5), 2600-2608.
BeMiller, J. N. W. (1996). Carbohydrate. in: Food Chemistry. 3rd. In): New York, NY:
Marcel-Dekker, Inc.
Bryant, C. M., & McClements, D. J. (1998). Molecular basis of protein functionality with
special consideration of cold-set gels derived from heat-denatured whey. Trends
in Food Science & Technology, 9(4), 143-151.
Chanasattru, W., Decker, E. A., & McClements, D. J. (2007). Modulation of thermal
stability and heat-induced gelation of [beta]-lactoglobulin by high glycerol and
sorbitol levels. Food Chemistry, 103(2), 512-520.
Chantrapornchai, W., & McClements, D. J. (2002). Influence of glycerol on optical
properties and large-strain rheology of heat-induced whey protein isolate gels.
Food Hydrocolloids, 16(5), 461-466.
Damodaran, S. (2008). Amino acids, peptides, and proteins. In: Fennema's Food
Chemistry: CRC Press/Taylor & Francis.
Dissanayake, M., Ramchandran, L., Donkor, O., & Vasiljevic, T. (2013). Denaturation of
whey proteins as a function of heat, pH and protein concentration. International
Dairy Journal, 31(2), 93-99.
Dissanayake, M., Ramchandran, L., Piyadasa, C., & Vasiljevic, T. (2012). Influence of
heat and pH on structure and conformation of whey proteins. International Dairy
Journal, 28(2), 56-61.
Freire, E. (1995). Thermodynamics of partly folded intermediates in proteins. Annual
Review of Biophysics and Biomolecular Structure, 24(1), 141-165.
Gharsallaoui, A., Rogé, B., Génotelle, J., & Mathlouthi, M. (2008). Relationships
between hydration number, water activity and density of aqueous sugar solutions.
Food Chemistry, 106(4), 1443-1453.
Jackson, W. M., & Brandts, J. F. (1970). Thermodynamics of protein denaturation.
Calorimetric study of the reversible denaturation of chymotrypsinogen and
conclusions regarding the accuracy of the two-state approximation. Biochemistry,
9(11), 2294-2301.
Jelen, P., Rattray, W., & Fox, P. (1995). Thermal denaturation of whey proteins. Heat-
induced Changes in Milk.(Ed. 2), 66-85.
199
Koshiyama, I., Hamano, M., & Fukushima, D. (1981). A heat denaturation study of the
11S globulin in soybean seeds. Food Chemistry, 6(4), 309-322.
Kovrigin, E. L., & Potekhin, S. A. (1997). Preferential solvation changes upon lysozyme
heat denaturation in mixed solvents. Biochemistry, 36(30), 9195-9199.
Kulmyrzaev, A., Bryant, C., & McClements, D. J. (2000). Influence of sucrose on the
thermal denaturation, gelation, and emulsion stabilization of whey proteins.
Journal of Agricultural and Food Chemistry, 48(5), 1593-1597.
Lee, J. C., & Timasheff, S. N. (1981). The stabilization of proteins by sucrose. Journal of
Biological Chemistry, 256(14), 7193-7201.
Liu, G., & Zhong, Q. (2012). Glycation of whey protein to provide steric hindrance
against thermal aggregation. Journal of Agricultural and Food Chemistry, 60(38),
9754-9762.
Liu, G., & Zhong, Q. (2013). Thermal aggregation properties of whey protein glycated
with various saccharides. Food Hydrocolloids, 32(1), 87-96.
McClements, D. J. (2002). Modulation of globular protein functionality by weakly
interacting cosolvents. Critical Reviews in Food Science and Nutrition, 42(5),
417-471.
McGarrahan, E. (1982). Considerations necessary to provide for sterilized milk and milk
products in hermetically sealed, nonrefrigerated containers. Journal of Dairy
Science, 65(10), 2023-2034.
Mottram, D. S., Wedzicha, B. L., & Dodson, A. T. (2002). Food chemistry: acrylamide is
formed in the Maillard reaction. Nature, 419(6906), 448-449.
Mulsow, B. B., Jacob, M., & Henle, T. (2009). Studies on the impact of glycation on the
denaturation of whey proteins. European Food Research and Technology, 228(4),
643-649.
Nakamura, S., Oku, T., & Ichinose, M. (2004). Bioavailability of cellobiose by tolerance
test and breath hydrogen excretion in humans. Nutrition, 20(11), 979-983.
Parsegian, V. A., Rand, R. P., & Rau, D. C. (1995). Macromolecules and water: Probing
with osmotic stress. Methods in Enzymology, 259, 43-94.
Privalov, P., & Khechinashvili, N. (1974). A thermodynamic approach to the problem of
stabilization of globular protein structure: a calorimetric study. Journal of
Molecular Biology, 86(3), 665-684.
Record, M. T., Zhang, W., & Anderson, C. F. (1998). Analysis of effects of salts and
uncharged solutes on protein and nucleic acid equilibria and processes: a practical
guide to recognizing and interpreting polyelectrolyte effects, Hofmeister effects,
and osmotic effects of salts. Advances in Protein Chemistry, 51, 281-353.
Schmitt, C., Sanchez, C., Desobry-Banon, S., & Hardy, J. (1998). Structure and
technofunctional properties of protein-polysaccharide complexes: a review.
Critical Reviews in Food Science and Nutrition, 38(8), 689-753.
Semenova, M. G., Antipova, A. S., & Belyakova, L. E. (2002). Food protein interactions
in sugar solutions. Current Opinion in Colloid & Interface Science, 7(5), 438-444.
Sheriff., D. (2004). Introduction to Carbohydate. In: Sheriff DS, editor. Medical
Biochemistry. 1st ed. Jaypee Brothers Medical Publishers. New Delhi (IN), 65.
Starzak, M., & Mathlouthi, M. (2006). Temperature dependence of water activity in
aqueous solutions of sucrose. Food Chemistry, 96(3), 346-370.
200
Stoker, H. S. (2011). Organic and biological chemistry: Cengage Learning.
Timasheff, S. N. (1993). The control of protein stability and association by weak
interactions with water: how do solvents affect these processes? Annual Review of
Biophysics and Biomolecular Structure, 22(1), 67-97.
Timasheff, S. N. (1998). Control of protein stability and reactions by weakly interacting
cosolvents: the simplicity of the complicated. Advances in Protein Chemistry, 51,
355-432.
Wang, W., Zhong, Q., & Hu, Z. (2013). Nanoscale understanding of thermal aggregation
of whey protein pretreated by transglutaminase. Journal of Agricultural and Food
Chemistry, 61(2), 435-446.
Xie, G., & Timasheff, S. N. (1997). Mechanism of the stabilization of ribonuclease A by
sorbitol: preferential hydration is greater for the denatured than for the native
protein. Protein Science, 6(1), 211-221.
Zhu, D., Damodaran, S., & Lucey, J. A. (2010). Physicochemical and emulsifying
properties of whey protein isolate (WPI)− dextran conjugates produced in
aqueous solution. Journal of Agricultural and Food Chemistry, 58(5), 2988-2994.
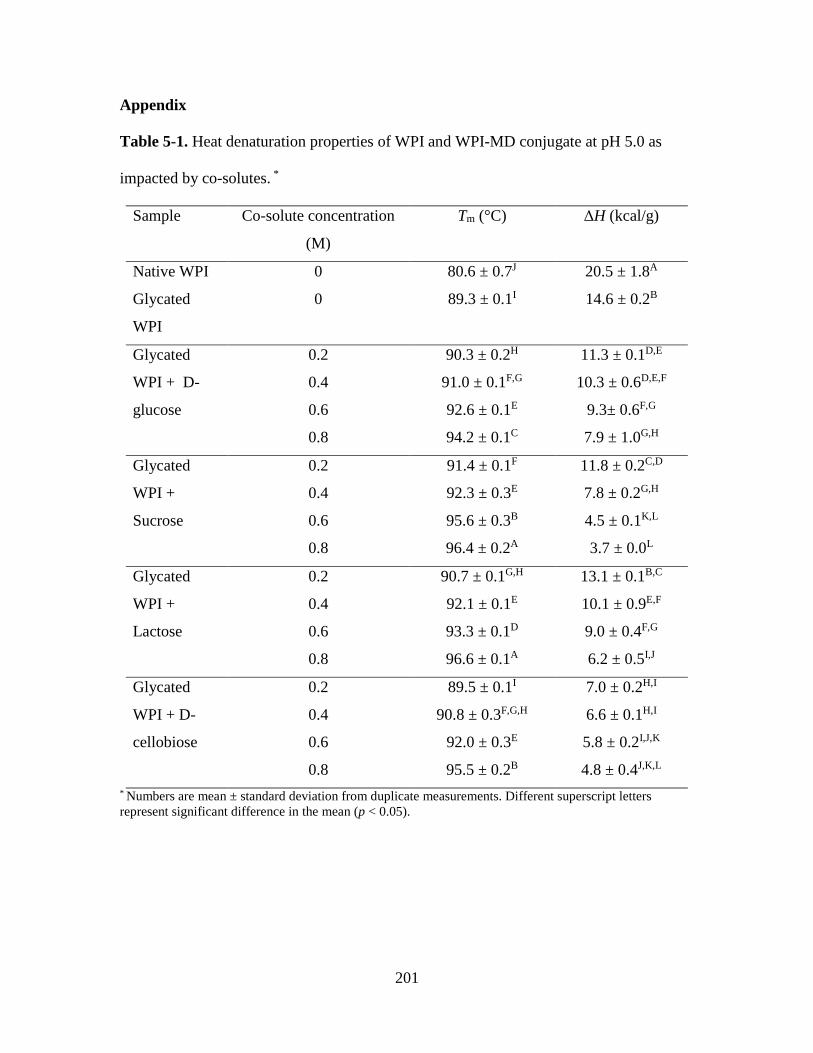
201
Appendix
Table 5-1. Heat denaturation properties of WPI and WPI-MD conjugate at pH 5.0 as
impacted by co-solutes. *
Sample Co-solute concentration
(M)
Tm (°C) ΔH (kcal/g)
Native WPI 0 80.6 ± 0.7J 20.5 ± 1.8A
Glycated
WPI
0 89.3 ± 0.1I 14.6 ± 0.2B
Glycated
WPI + D-
glucose
0.2 90.3 ± 0.2H 11.3 ± 0.1D,E
0.4 91.0 ± 0.1F,G 10.3 ± 0.6D,E,F
0.6 92.6 ± 0.1E 9.3± 0.6F,G
0.8 94.2 ± 0.1C 7.9 ± 1.0G,H
Glycated
WPI +
Sucrose
0.2 91.4 ± 0.1F 11.8 ± 0.2C,D
0.4 92.3 ± 0.3E 7.8 ± 0.2G,H
0.6 95.6 ± 0.3B 4.5 ± 0.1K,L
0.8 96.4 ± 0.2A 3.7 ± 0.0L
Glycated
WPI +
Lactose
0.2 90.7 ± 0.1G,H 13.1 ± 0.1B,C
0.4 92.1 ± 0.1E 10.1 ± 0.9E,F
0.6 93.3 ± 0.1D 9.0 ± 0.4F,G
0.8 96.6 ± 0.1A 6.2 ± 0.5I,J
Glycated
WPI + D-
cellobiose
0.2 89.5 ± 0.1I 7.0 ± 0.2H,I
0.4 90.8 ± 0.3F,G,H 6.6 ± 0.1H,I
0.6 92.0 ± 0.3E 5.8 ± 0.2I,J,K
0.8 95.5 ± 0.2B 4.8 ± 0.4J,K,L
* Numbers are mean ± standard deviation from duplicate measurements. Different superscript letters
represent significant difference in the mean (p < 0.05).
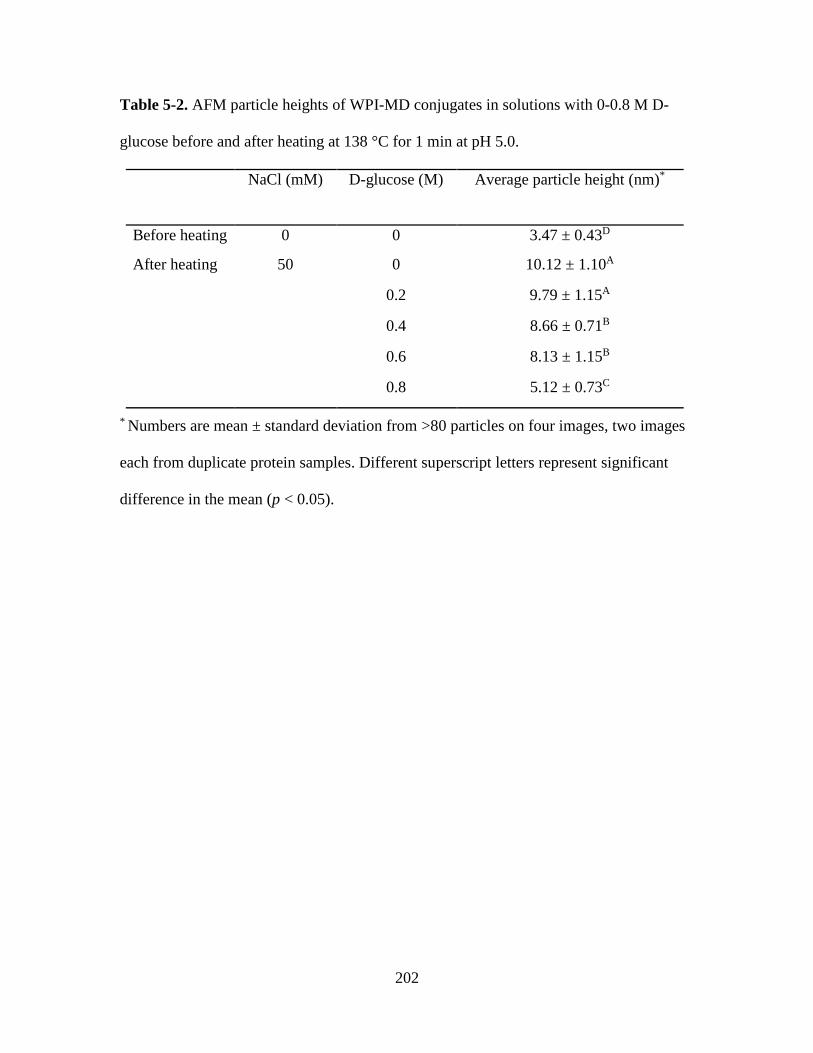
202
Table 5-2. AFM particle heights of WPI-MD conjugates in solutions with 0-0.8 M D-
glucose before and after heating at 138 °C for 1 min at pH 5.0.
NaCl (mM) D-glucose (M) Average particle height (nm)*
Before heating 0 0 3.47 ± 0.43D
After heating 50 0 10.12 ± 1.10A
0.2 9.79 ± 1.15A
0.4 8.66 ± 0.71B
0.6 8.13 ± 1.15B
0.8 5.12 ± 0.73C
* Numbers are mean ± standard deviation from >80 particles on four images, two images
each from duplicate protein samples. Different superscript letters represent significant
difference in the mean (p < 0.05).
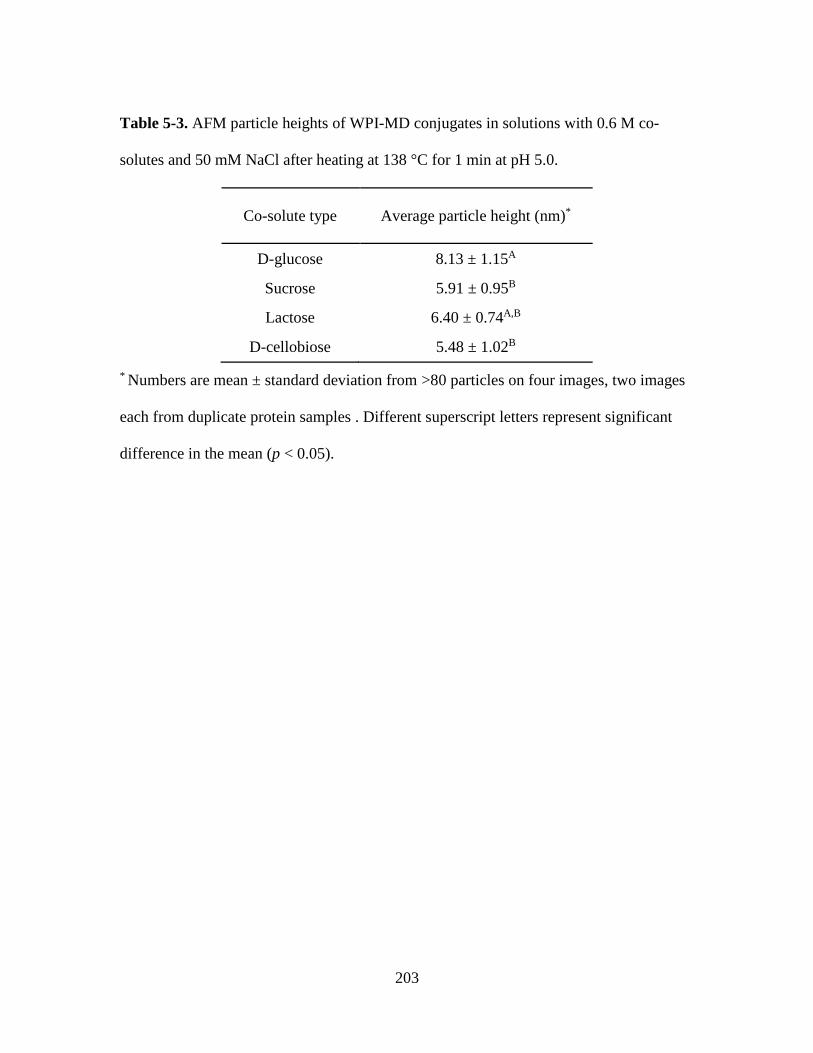
203
Table 5-3. AFM particle heights of WPI-MD conjugates in solutions with 0.6 M co-
solutes and 50 mM NaCl after heating at 138 °C for 1 min at pH 5.0.
Co-solute type Average particle height (nm)*
D-glucose 8.13 ± 1.15A
Sucrose 5.91 ± 0.95B
Lactose 6.40 ± 0.74A,B
D-cellobiose 5.48 ± 1.02B
* Numbers are mean ± standard deviation from >80 particles on four images, two images
each from duplicate protein samples . Different superscript letters represent significant
difference in the mean (p < 0.05).
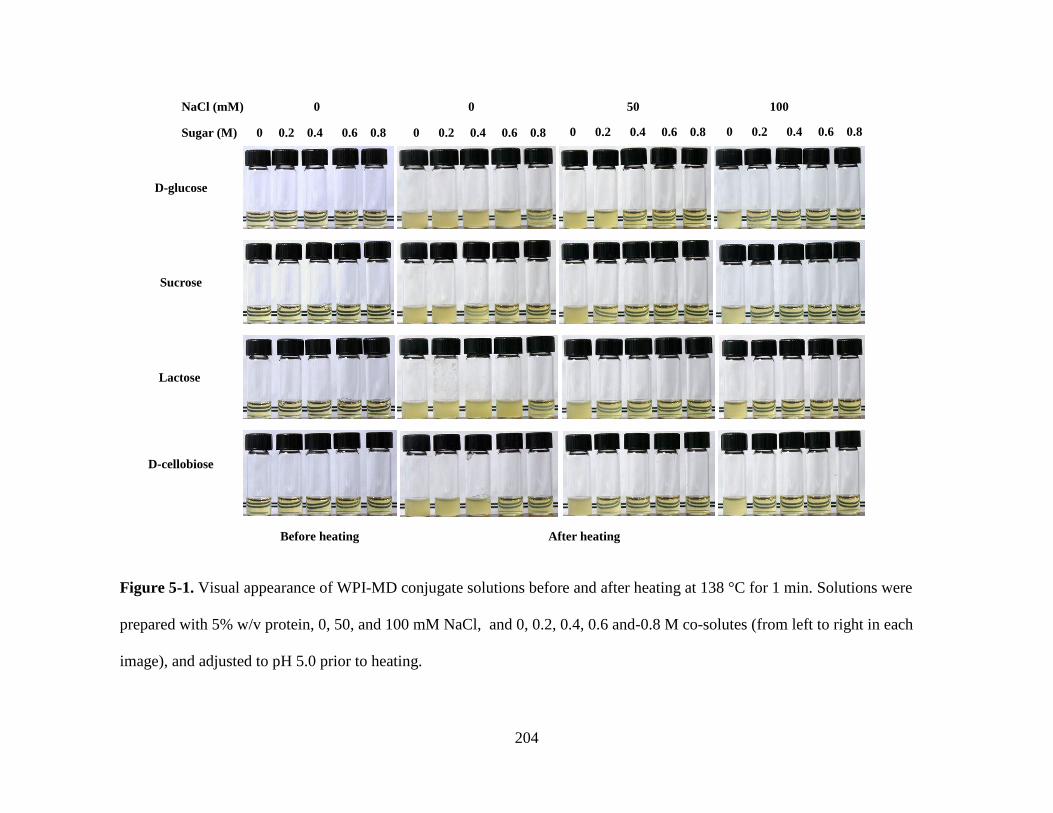
204
NaCl (mM) 0 50 100
D-glucose
Sucrose
Lactose
D-cellobiose
Sugar (M) 0 0.2 0.4 0.6 0.8 0 0.2 0.4 0.6 0.8 0 0.2 0.4 0.6 0.8 0 0.2 0.4 0.6 0.8
Before heating After heating
0
Figure 5-1. Visual appearance of WPI-MD conjugate solutions before and after heating at 138 °C for 1 min. Solutions were
prepared with 5% w/v protein, 0, 50, and 100 mM NaCl, and 0, 0.2, 0.4, 0.6 and-0.8 M co-solutes (from left to right in each
image), and adjusted to pH 5.0 prior to heating.
205
Figure 5-2. Absorbance at 600 nm (Abs600) of WPI-MD conjugate solutions after heating
at 138 C for 1 min. Solutions were prepared at 5% w/v protein, pH 5.0, 0-0.8 M co-
solutes and (A) 0, (B) 50, and (C) 100 mM NaCl after heating and diluted 5 times using
10 mM phosphate citrate buffer (pH 5.0). Error bars are standard deviations from two
replicates.
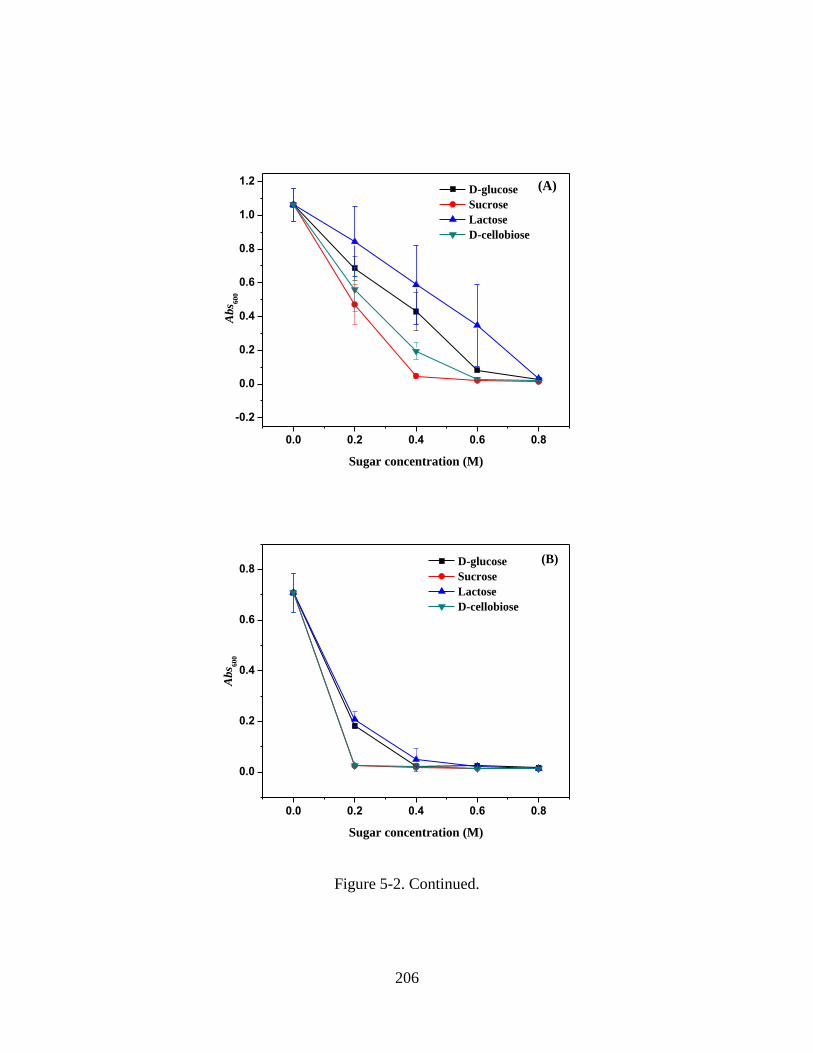
206
0.0 0.2 0.4 0.6 0.8
-0.2
0.0
0.2
0.4
0.6
0.8
1.0
1.2 (A)
Abs 6
00
Sugar concentration (M)
D-glucose
Sucrose
Lactose
D-cellobiose
0.0 0.2 0.4 0.6 0.8
0.0
0.2
0.4
0.6
0.8(B)
Abs 6
00
Sugar concentration (M)
D-glucose
Sucrose
Lactose
D-cellobiose
Figure 5-2. Continued.
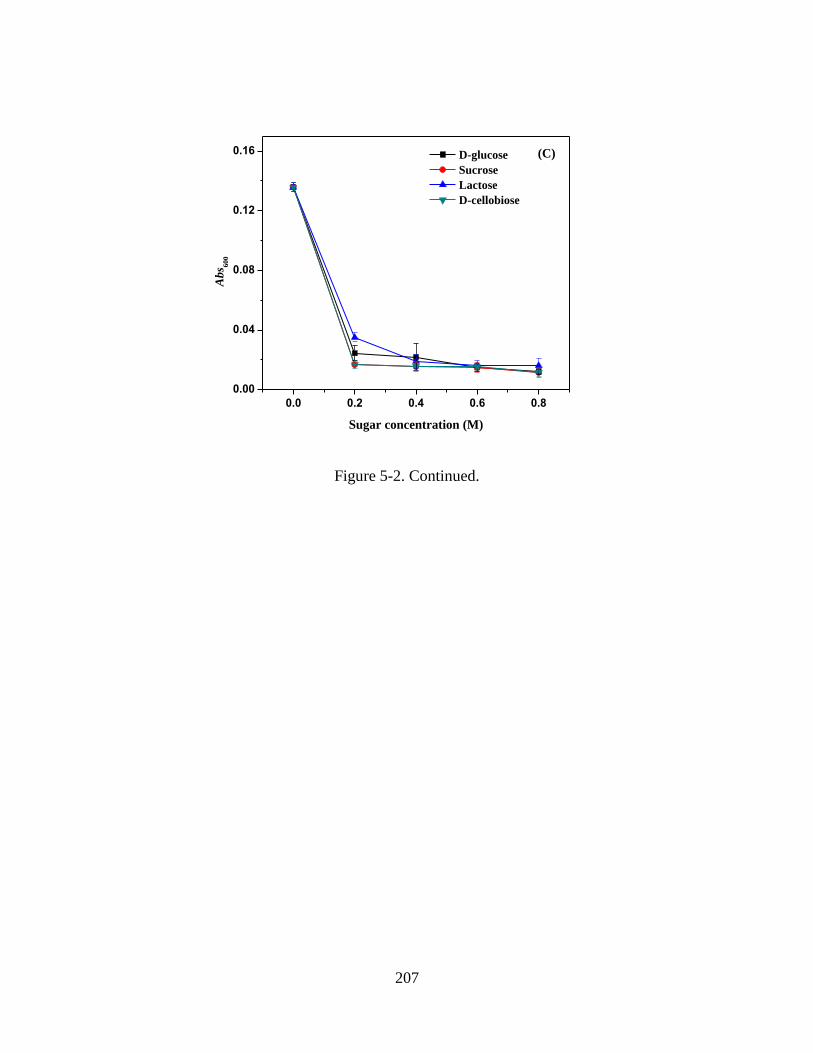
207
0.0 0.2 0.4 0.6 0.8
0.00
0.04
0.08
0.12
0.16 (C)
Abs 6
00
Sugar concentration (M)
D-glucose
Sucrose
Lactose
D-cellobiose
Figure 5-2. Continued.
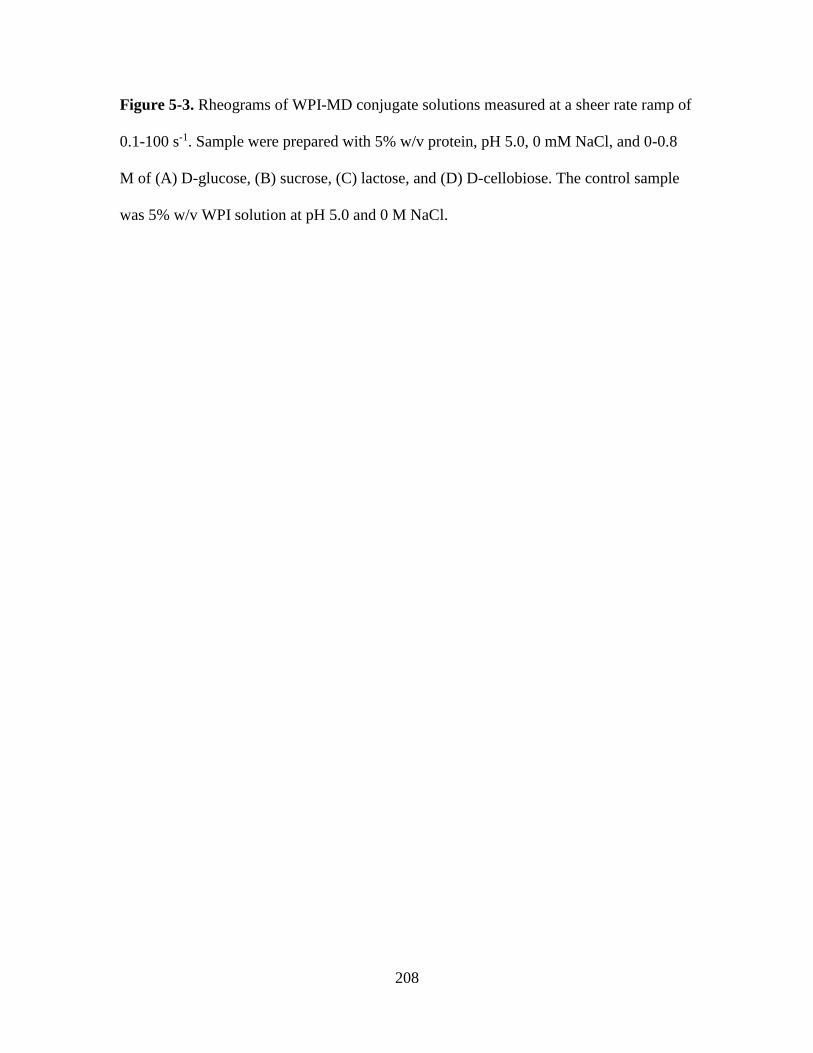
208
Figure 5-3. Rheograms of WPI-MD conjugate solutions measured at a sheer rate ramp of
0.1-100 s-1. Sample were prepared with 5% w/v protein, pH 5.0, 0 mM NaCl, and 0-0.8
M of (A) D-glucose, (B) sucrose, (C) lactose, and (D) D-cellobiose. The control sample
was 5% w/v WPI solution at pH 5.0 and 0 M NaCl.
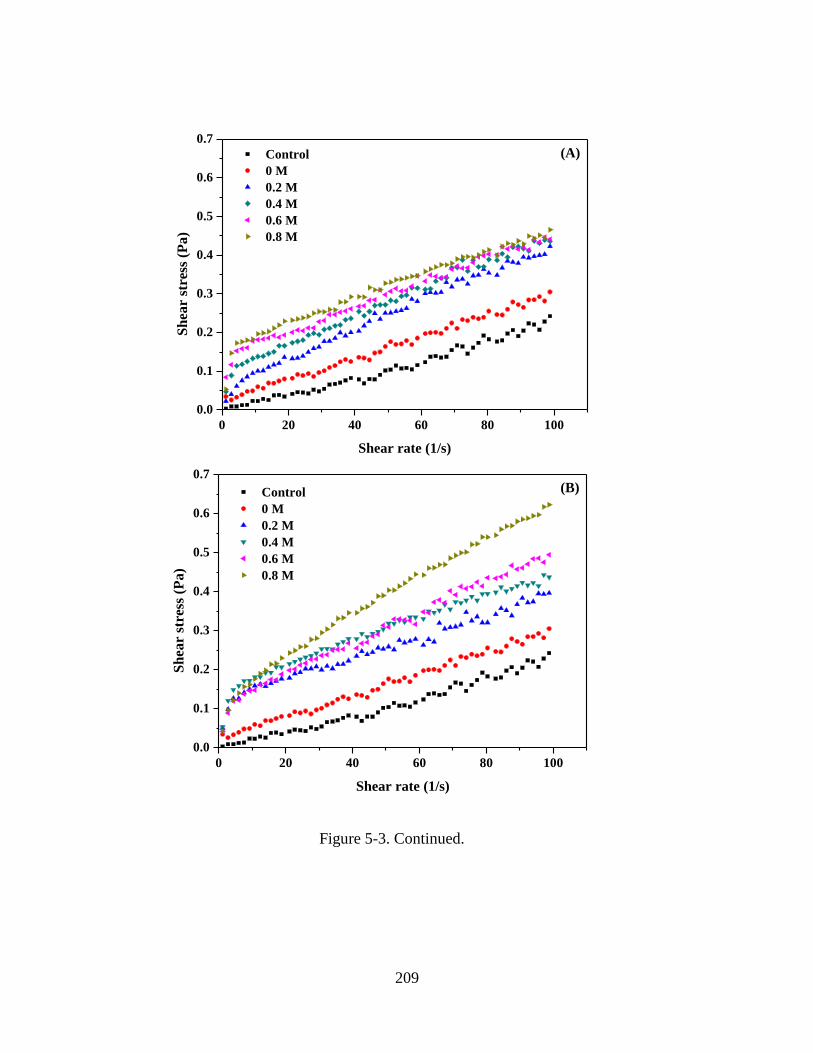
209
0 20 40 60 80 100
0.0
0.1
0.2
0.3
0.4
0.5
0.6
0.7
Control
0 M
0.2 M
0.4 M
0.6 M
0.8 M
Sh
ear
stre
ss (
Pa
)
Shear rate (1/s)
(A)
0 20 40 60 80 100
0.0
0.1
0.2
0.3
0.4
0.5
0.6
0.7
Control
0 M
0.2 M
0.4 M
0.6 M
0.8 M
(B)
Sh
ear
stre
ss (
Pa
)
Shear rate (1/s)
Figure 5-3. Continued.
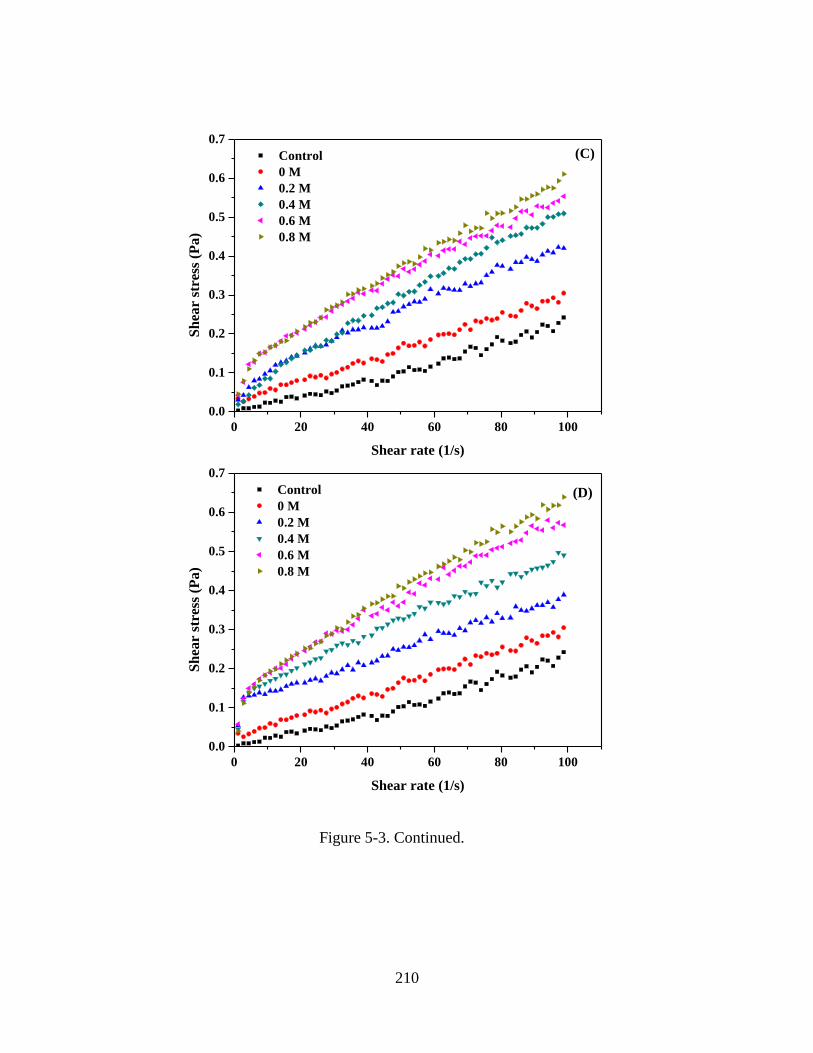
210
0 20 40 60 80 100
0.0
0.1
0.2
0.3
0.4
0.5
0.6
0.7
(C) Control
0 M
0.2 M
0.4 M
0.6 M
0.8 M
Sh
ear
stre
ss (
Pa)
Shear rate (1/s)
0 20 40 60 80 100
0.0
0.1
0.2
0.3
0.4
0.5
0.6
0.7
(D) Control
0 M
0.2 M
0.4 M
0.6 M
0.8 M
Sh
ear
stre
ss (
Pa
)
Shear rate (1/s)
Figure 5-3. Continued.
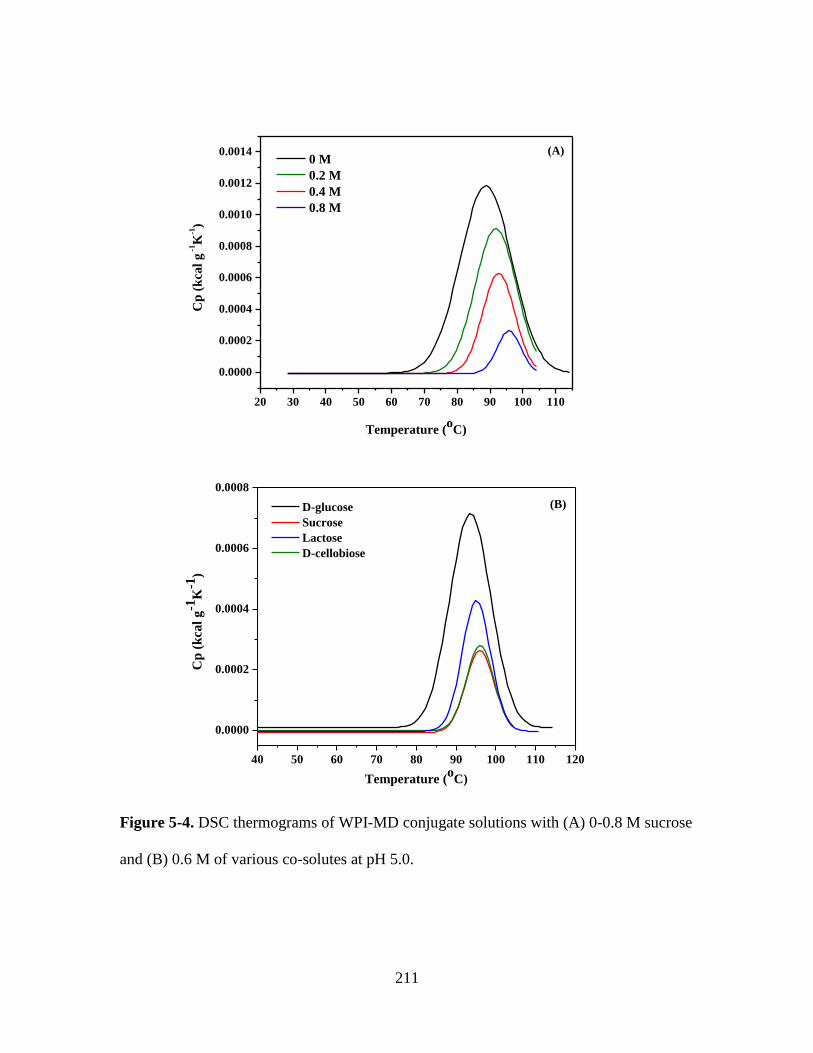
211
20 30 40 50 60 70 80 90 100 110
0.0000
0.0002
0.0004
0.0006
0.0008
0.0010
0.0012
0.0014 0 M
0.2 M
0.4 M
0.8 M
Cp
(k
cal
g -
1K
-1)
Temperature (oC)
(A)
40 50 60 70 80 90 100 110 120
0.0000
0.0002
0.0004
0.0006
0.0008
D-glucose
Sucrose
Lactose
D-cellobiose
Cp
(k
cal
g-1
K-1
)
Temperature (oC)
(B)
Figure 5-4. DSC thermograms of WPI-MD conjugate solutions with (A) 0-0.8 M sucrose
and (B) 0.6 M of various co-solutes at pH 5.0.
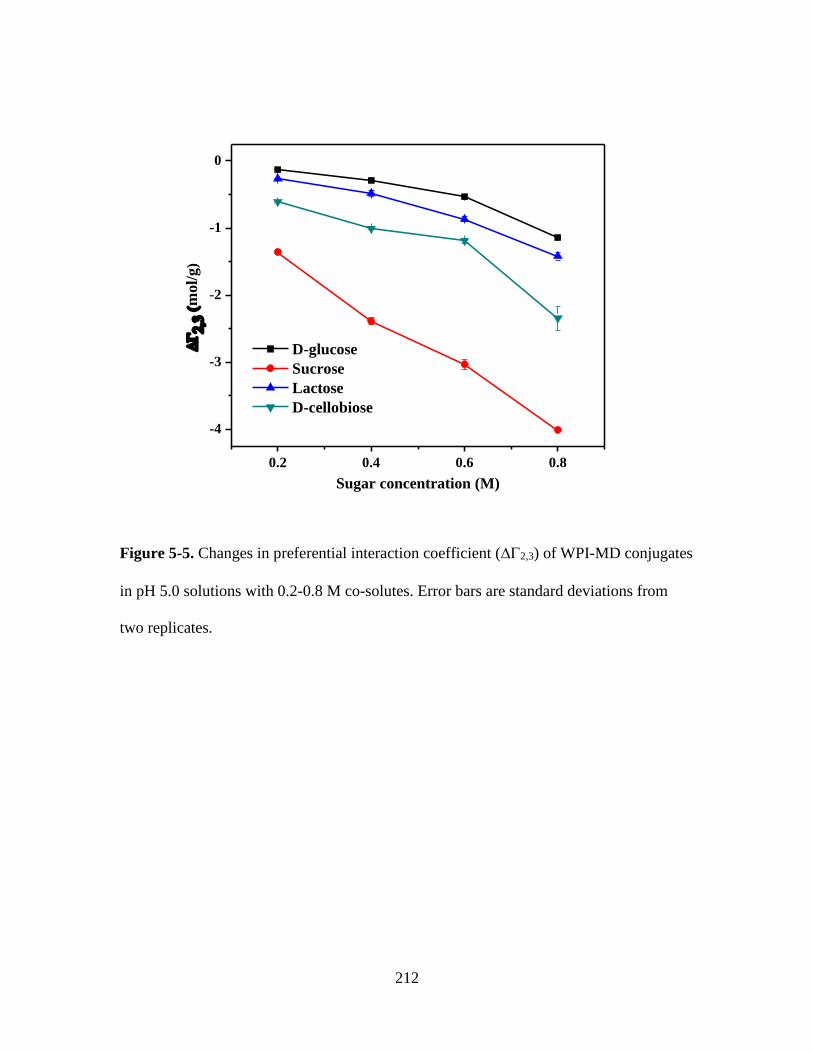
212
0.2 0.4 0.6 0.8
-4
-3
-2
-1
0
mol/
g)
Sugar concentration (M)
D-glucose
Sucrose
Lactose
D-cellobiose
Figure 5-5. Changes in preferential interaction coefficient (2,3) of WPI-MD conjugates
in pH 5.0 solutions with 0.2-0.8 M co-solutes. Error bars are standard deviations from
two replicates.
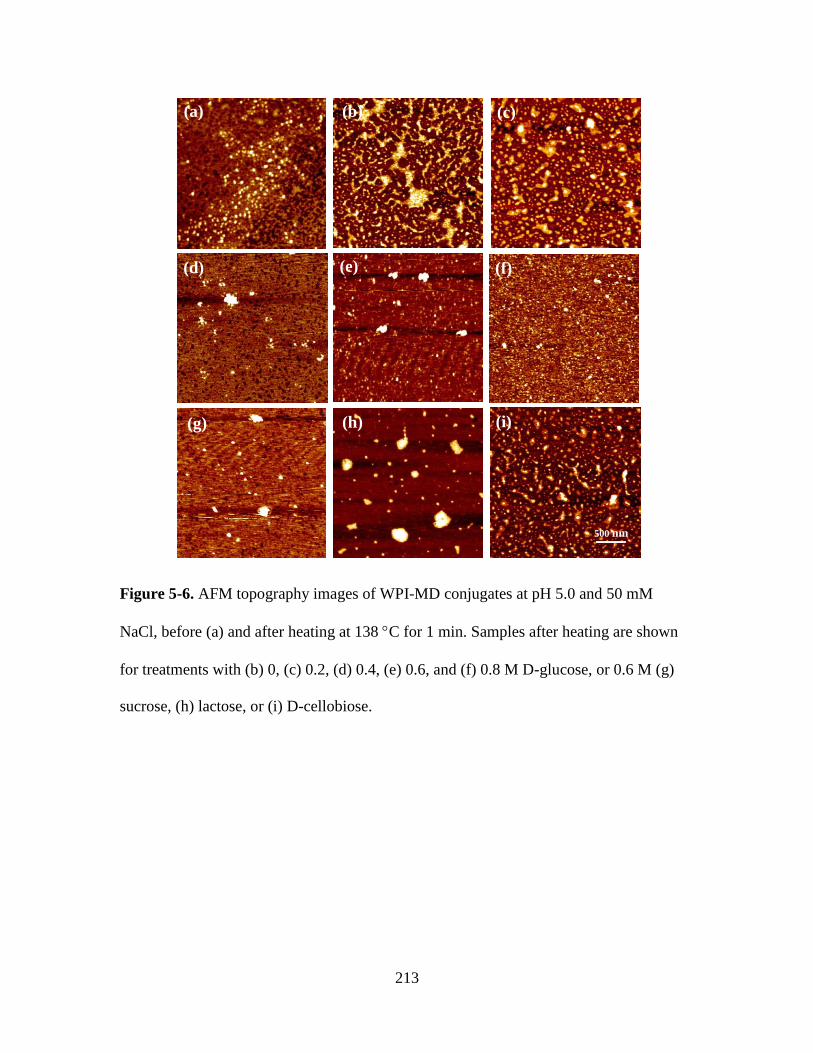
213
500 nm
(b) (c)
(d) (e) (f)
(g) (h) (i)
(a)
Figure 5-6. AFM topography images of WPI-MD conjugates at pH 5.0 and 50 mM
NaCl, before (a) and after heating at 138 C for 1 min. Samples after heating are shown
for treatments with (b) 0, (c) 0.2, (d) 0.4, (e) 0.6, and (f) 0.8 M D-glucose, or 0.6 M (g)
sucrose, (h) lactose, or (i) D-cellobiose.

214
Chapter 6. Concluding Remarks and Future
Work
215
Conclusions
Heat stability of whey proteins can be improved by a number of ways, depending
on the desired pH conditions. The combination of preheating and enzymatic cross-linking
(sequential pretreatment) can stabilize whey proteins at neutral pH by suppressing both
heat- and salt-induced aggregations. Preheating treatment at neutral pH and temperature
above denaturation temperate of whey proteins resulted in partial unfolding of the
structure. Embedded reactive sites of whey proteins for enzymatic cross-linking were
exposed after preheating and became more accessible. This sequential pretreatment
increased the degree of enzymatic cross-linking and facilitated the whey protein
stabilization during heating at 80 °C in the presence of 0-100 mM NaCl. Heating whey
proteins at 138 °C caused turbidity, precipitation and gelation at a shorter time than at 80
C. The sequentially-pretreated whey proteins exhibited good resistance against
aggregation during heating at 138 C for up to 30 min, showing smaller particle
dimension at a longer heating time which can be caused by the dissociation of cross-
linked whey proteins and reformation of nanoscale particles.
Glycating whey proteins with reducing saccharides such as MD can improve heat
stability at pH ranging from 4 to 7. Glycation can be conducted using conditions based on
the solution chemistry of target beverages. Heat stability of conjugates can be further
controlled by studying the acidity of spray-dried mixture powder of WPI and MD. WPI
glycated with MD at m-pH 6 showed an improvement in heat stability after heating at
138 °C and had a lighter color when compared to that glycated at m-pH 7. This was
attributed to a higher degree of glycation at m-pH 6 than at m-pH 7 and the color
216
formation can be suppressed at more acidic conditions. Supplementing co-solutes with
and without calories further improved the heat stability of WPI-MD conjugates at pH 4-7,
which enables the glycation at milder conditions to reduce the undesired brown color and
possibly other glycation byproducts while achieving heat stability. Co-solutes stabilized
WPI-MD conjugates by excluded volume and preferential interactions, in addition to the
increased viscosity reducing the frequency of collision and the increased denaturation
temperature at a higher co-solute concentration. The strengthened preferential
interactions by co-solutes prevented the transfer of whey protein molecules from the
solvent to co-solute, forming a region that whey protein molecules cannot get close to
aggregate.
Physicochemical properties of whey proteins presented in this dissertation provide
scientific bases heat stability improvement by TGase cross-linking and glycation with
reducing saccharides. The information will be useful to future studies illustrating
molecular and sub-molecular phenomena related to whey protein heat stability
improvement. These conditions can be further optimized to prepare ingredients for the
production of high quality, nutritious, and shelf-stable whey protein-based Ready-to-
drink beverages during thermal processes.
217
Future work
Extending form the present work, the impacts of nanoparticle size and shape
formed s at different treatments on heat stability of whey proteins can be further studied.
Other microscopy techniques, such as TEM, can be applied to study additional structure
information of particles after different treatments. Whey protein nanoparticles with
improved heat stability can be fabricated via controlling the environmental factors such
as pH, ionic strength, heating conditions and the presence of co-solutes for other
applications such as emulsification. Furthermore, interactions between whey proteins and
surfactants such as cationic lauric arginate can be studied for whey proteins preheated at
various pH conditions, temperatures for different durations, to study the possibility of
surfactants improving heat stability. In addition, emulsifying properties antioxidant
properties, and byproducts of whey proteins after various pretreatments and glycations.
can be characterized. In order to test the pratical application, in vitro digestibility of
TGase cross-linked or glycated whey proteins and shelf stability of model beverages also
require future work.
218
VITA
Wan Wang entered College of Food Science and Technology, Huazhong
Agricultural University in 2003 to pursue a Bachelor degree of Food Science and
Engineering. After graduating from the university, she continued her study for a Master
of Science degree, focusing on the Food Science and Nutrition at the University of Leeds,
UK. Her thesis project of Master’s study is a combination of food chemistry and sensory
evaluation. In January 2011, she began her doctoral program in the Department of Food
Science and Technology at the University of Tennessee, Knoxville, working with Dr.
Qixin Zhong in the Food Physics and Nanotechnology Lab. She mainly focused on the
physicochemical properties of whey proteins, conformational changes and interactions of
whey proteins with other biopolymers, in order to enhance the thermal stability of whey
proteins, therefore broaden the applications of whey proteins as a widely used source in
protein beverages.