Embed Size (px)
Citation preview
Transglutaminase 2 Contributes to Apoptosis Inductionin Jurkat T Cells by Modulating Ca2+ Homeostasis viaCross-Linking RAP1GDS1Yu-Fan Hsieh1, Guang-Yaw Liu1, Yi-Ju Lee1, Jiann-Jou Yang2, Katalin Sandor3, Zsolt Sarang3,
Angela Bononi4, Paolo Pinton4, Laszlo Tretter5, Zsuzsa Szondy3*., Gregory J. Tsay1,6*.
1 Institute of Microbiology and Immunology, Chung Shan Medical University, Taichung, Taiwan, 2 Department of Biomedical Sciences, Chung Shan Medical University,
Taichung, Taiwan, 3 Department of Biochemistry and Molecular Biology, Research Center of Molecular Medicine, University of Debrecen, Debrecen, Hungary,
4 Department of Experimental and Diagnostic Medicine, Section of General Pathology, Interdisciplinary Center for the Study of Inflammation (ICSI), Laboratory for
Technologies of Advanced Therapies (LTTA), University of Ferrara, Ferrara, Italy, 5 Department of Medical Biochemistry, Semmelweis University, Neurobiochemical Group
of Hungarian Academy of Sciences, Budapest, Hungary, 6 Department of Internal Medicine, Chung Shan Medical University Hospital, Taichung, Taiwan
Abstract
Background: Transglutaminase 2 (TG2) is a protein cross-linking enzyme known to be associated with the in vivo apoptosisprogram of T cells. However, its role in the T cell apoptosis program was not investigated yet.
Results: Here we report that timed overexpression of both the wild type (wt) and the cross-linking mutant of TG2 inducedapoptosis in Jurkat T cells, the wt being more effective. Part of TG2 colocalised with mitochondria. WtTG2-inducedapoptosis was characterized by enhanced mitochondrial Ca2+ uptake. Ca2+-activated wtTG2 cross-linked RAP1, GTP-GDPdissociation stimulator 1, an unusual guanine exchange factor acting on various small GTPases, to induce a yetuncharacterized signaling pathway that was able to promote the Ca2+ release from the endoplasmic reticulum via bothIns3P and ryanodine sensitive receptors leading to a consequently enhanced mitochondrial Ca2+uptake.
Conclusions: Our data indicate that TG2 might act as a Ca2+ sensor to amplify endoplasmic reticulum-derived Ca2+ signalsto enhance mitochondria Ca2+ uptake. Since enhanced mitochondrial Ca2+ levels were previously shown to sensitizemitochondria for various apoptotic signals, our data demonstrate a novel mechanism through which TG2 can contribute tothe induction of apoptosis in certain cell types. Since, as compared to knock out cells, physiological levels of TG2 affectedCa2+ signals in mouse embryonic fibroblasts similar to Jurkat cells, our data might indicate a more general role of TG2 in theregulation of mitochondrial Ca2+ homeostasis.
Citation: Hsieh Y-F, Liu G-Y, Lee Y-J, Yang J-J, Sandor K, et al. (2013) Transglutaminase 2 Contributes to Apoptosis Induction in Jurkat T Cells by Modulating Ca2+
Homeostasis via Cross-Linking RAP1GDS1. PLoS ONE 8(12): e81516. doi:10.1371/journal.pone.0081516
Editor: Boris Zhivotovsky, Karolinska Institutet, Sweden
Received July 25, 2013; Accepted October 23, 2013; Published December 11, 2013
Copyright: � 2013 Hsieh et al. This is an open-access article distributed under the terms of the Creative Commons Attribution License, which permitsunrestricted use, distribution, and reproduction in any medium, provided the original author and source are credited.
Funding: This study was supported by National Science Council (NSC) (NSC 95-2745-B-040-007, NSC 96-2314-B-040-013-MY3, NSC97-29111-I-040-001, NSC 96-2911-I-040-002, NSC98-2811-B-040-004, NS99-2314-B-040-006-MY3, NSC99-2911-I-040-001, NSC 99-2811-B-040-005) and Chung Shan Medical University Hospitalgrand (CSH-2010-D-2002 and CSH-2012-D-001), Hungarian National Research Fund (OTKA K 77587, 83865, 104228, NK105046), TAMOP 4.2.2.A-11/1/KONV-2012-0023 ‘‘VED-ELEM’’ project (implemented through the New Hungary Development Plan co-financed by the European Social Fund and the European RegionalDevelopment Fund), a Hungarian Taiwanese bilateral agreement, the Italian Association for Cancer Research (AIRC), Telethon (GGP09128 and GGP11139B), localfunds from the University of Ferrara, the Italian Ministry of Education, University and Research (COFIN, FIRB and Futuro in Ricerca), and Italian Ministry of Health toPP. The funders had no role in study design, data collection and analysis, decision to publish, or preparation of the manuscript.
Competing Interests: The authors declare that they have no competing interest.
* E-mail: [email protected] (ZS); [email protected] (GJT)
. These authors contributed equally to this work.
Introduction
Transglutaminases are a family of thiol- and Ca2+-dependent
acyl transferases that catalyze the formation of a covalent bond
between the c-carboxamide groups of peptide-bound glutamine
residues and various primary amines including the e–amino group
of lysine in certain proteins [1]. The reaction results in post-
translational modification of proteins by establishing e–(c–
glutamyl)lysine cross-linkages and/or covalent incorporation of
polyamines and histamine into proteins. Transglutaminase 2
(TG2) is a very unique member of the transglutaminase family,
because besides being a transglutaminase it also possesses GTPase,
protein disulphide isomerase and protein kinase enzymatic
activities [2]. In addition, TG2 can also function in various
biological settings as a protein/protein interaction partner. For
example, the protein also possesses a BH3 domain, thus it is
believed to contribute to the initiation of apoptosis by interacting
with members of the Bcl-2 family [3].
Apoptosis, the dominant cell death form of mammalians, is
characterized morphologically by membrane blebbing, chromatin
condensation, DNA fragmentation, and formation of apoptotic
bodies, which are engulfed by neighboring cells [4]. Studies at the
molecular mechanism have suggested that mitochondria play the
central role in the initiation of the intrinsic pathway of apoptosis by
PLOS ONE | www.plosone.org 1 December 2013 | Volume 8 | Issue 12 | e81516
responding to numerous apoptosis-inducing signals with release of
various pro-apoptotic factors [5]. Both mitochondria and endo-
plasmic reticulum (ER) are stores for intracellular calcium (Ca2+),
and are closely associated via 5 to 20% of the mitochondrial
membrane surface being attached to ER membrane domains
named mitochondria-associated membranes (MAMs) [6]. Apop-
tosis-related studies have demonstrated that fine tuning of the
mitochondrial Ca2+ homeostasis by pro- and anti-apoptotic
proteins plays a determinant role in the regulation of apoptosis
[7], and increased mitochondrial Ca2+ uptake facilitates the
initiation of the apoptotic process [8,9]. The source of Ca2+ is the
ER, which, upon the administration of the apoptosis-inducing
stimuli, releases it directly into the mitochondria via the inositol-
1,4,5-trisphosphate receptor (InsP3R) type III located in the
MAMs [10,11].
TG2 expression has been known for a long time to be associated
with the in vivo apoptosis program [12]. While in certain cancer cell
types overexpression of TG2 increases survival [13], in many other
cells, including T cells, the protein seems to act as a pro-apoptotic
molecule. TG2 is not expressed by living thymocytes. However,
the protein is strongly induced in thymocytes following exposure to
various apoptotic signals in vivo, and it appears in the initiation
phase of apoptosis [14]. Isolated thymocytes exposed to pro-
apoptotic signals also die, but do not upregulate TG2 implying
that the apoptosis initiation does not require TG2. Upregulation of
TG2 in vivo is mediated by co-signals provided by the surrounding
engulfing macrophages [15]. In addition to dying thymocytes,
TG2 also appears in the dying T lymphocytes of HIV-infected
individuals [16]. While TG2 was shown to promote apoptosis by
expressing its BH3 domain [3], by cross-linking the retinoblastoma
protein [17] as well as by phosphorylating P53 [18], so far the role
of TG2 in the T cell apoptosis program has not yet been
investigated in details. Here we report that timed overexpression of
both the wild type (wt) and the cross-linking mutant of TG2
(TG2X) induced apoptosis in Jurkat T cells, the wt being more
effective. Part of TG2 colocalised with mitochondria containing
increased amount of calcium. Overexpressed wtTG2 cross-linked
RAP1, GTP-GDP dissociation stimulator 1 (RAP1GDS1), an
unusual guanine exchange factor acting on various small GTPases
[19], which appeared in the ER to induce a yet uncharacterized
signaling pathway that was able to promote the Ca2+ release from
the ER via both Ins3P and ryanodine sensitive receptors leading to
an enhanced mitochondrial Ca2+ uptake. Our data indicate that
TG2 might act as a Ca2+ sensor in the mitochondria to amplify
ER-derived Ca2+ signals, and demonstrate a novel mechanism
through which TG2 can contribute to the induction of apoptosis in
T cells.
Results
Generation of Jurkat T cells with inducible expression ofTG2
In order to investigative the effect of TG2 overexpression in T
cells, Jurkat cells were transfected with the wild-type (wtTG2)
and a cross-linking mutant of TG2 created by replacement of
the catalytic Cys277 by Ser [20]. The wtTG2 or mutant TG2-
overexpression was driven by a Jurkat (JK)-tetracycline (Tet)-on
inducible promoter. Western blot (Figure 1A) analysis showed a
similar degree of increase in protein expression of TG2 in JK-
Tet-On wtTG2 and mutant TG2 cells upon 50 mM Doxycycline
(Dox) treatment. However as expected, the TG2 transamidase
activity increased notably only in in JK-Tet-On wtTG2 cells
(Figure 1B).
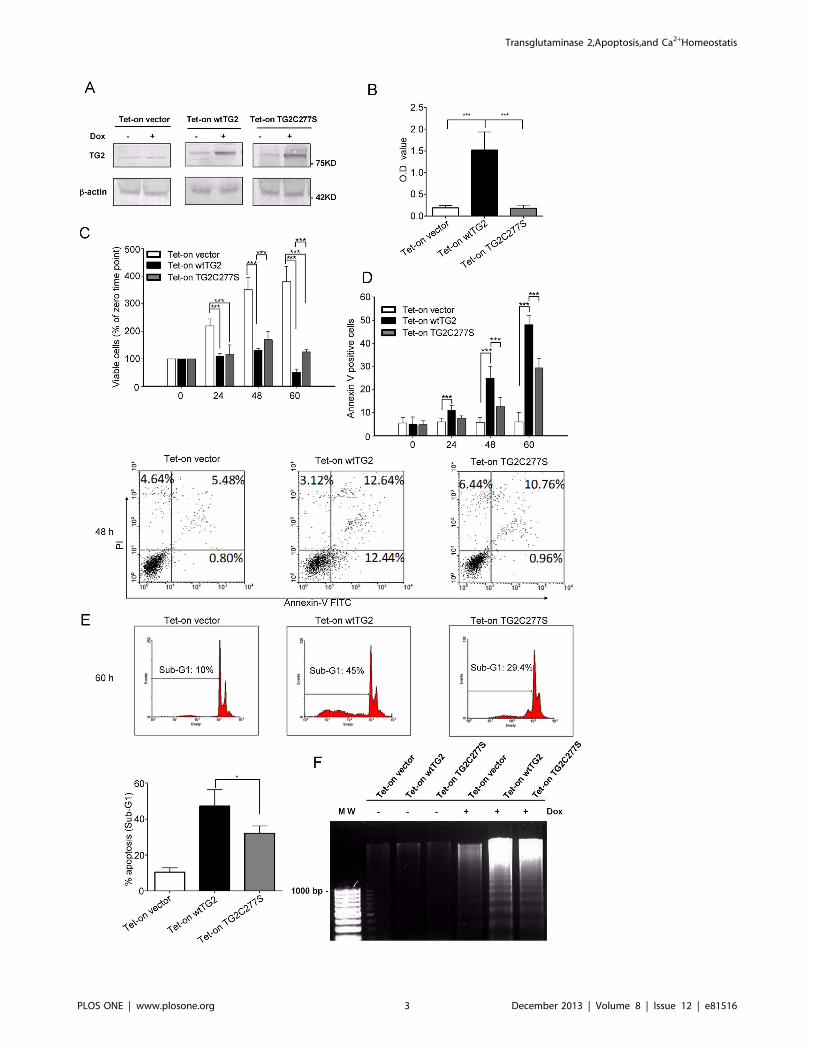
Overexpression of both wild type and cross-linkingmutant of TG2 induces apoptosis in Jurkat T cells
Following exposure to Dox, there was a marked decrease in the
doubling time of Jurkat T cells expressing either the wt or the
cross-linking mutant TG2, as compared to the vector expressing
line. In accordance, a significantly lower viable cell number could
be detected at 24, 48 and 60 h by using the MTT assay
(Figure 1C). The decreased amount of viable cells was a
consequence of cell death induction by overexpressed TG2 in
Jurkat T cells, as the percentage of Annexin V positive cells was
significantly increased with time (Figure 1D). The death induced
seem to be apoptosis, as DNA histograms demonstrated increased
number of cells expressing degraded DNA (Figure 1E). In
addition, we could detect DNA ladder formation characteristic
for apoptotic cells (Figure 1F) [21]. However, the rate of apoptosis
was faster in Jurkat T cells over-expressing wtTG2 than its cross-
linking mutant indicating that both the cross-linking and the other
biological activities of this multifunctional protein contribute to the
apoptosis induction in these cells.
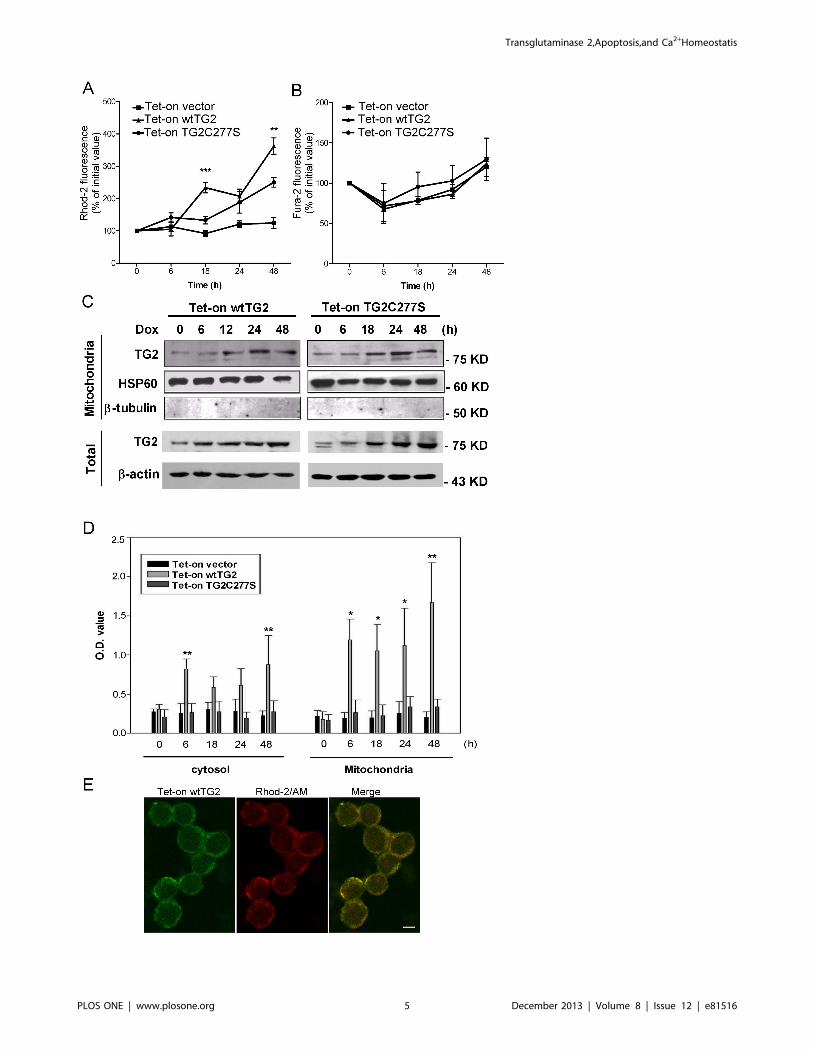
Overexpressed TG2 appears in the mitochondria andenhances intra-mitochondrial Ca2+ concentration
Ca2+ is known to accumulate preferentially in the mitochondria
in Jurkat T cells [22]. Enhanced apoptosis of wtTG2 expressing
Jurkat T cells was indeed accompanied by an enhanced intra-
mitochondrial Ca2+ concentration detected by following changes
in the intra-mitochondrial Ca2+ concentration as a function of
time with the help of the Ca2+-sensitive fluorescent indicator
Rhod-2 (Figure 2A). Following Dox addition mitochondrial Ca2+
concentration increased in TG2X expressing cells as well, but a
more significant increase was found in wtTG2 expressing cells.
The enhanced mitochondrial Ca2+ concentration does not seem to
be the result of an enhanced cytosolic Ca2+ concentration and a
consequently enhanced Ca2+ uptake, since the cytosolic Ca2+
concentration detected by Fura-2-AM did not change dramatically
during the same time in any of the cell lines following Dox
exposure (Figure 2B). These data indicate that crosslinking activity
of TG2 might promote mitochondrial calcium uptake during
apoptosis.
Previous studies have shown that TG2 can be localized in
various organelles in the cell including mitochondria [3]. To test
whether TG2 is also expressed in the mitochondria of T cells
subcellular fractionation was performed. Following Dox exposure
expression of both the basal and the induced TG2 could be
detected in the mitochondrial fractions of Tet-On wtTG2 and
Tet-On TG2C277S cells by Western blot analysis (Figure 2C).
Transglutaminase enzyme activity increased also rapidly in the
mitochondrial fraction of wtTG2 cells, while it was not signifi-
cantly induced in the control or in the TG2C277S cells
(Figure 2D). In addition, detected by confocal microscopy, in
wtTG2 overexpessing cells TG2 co-localized with the mitochon-
drial Ca2+ indicator Rhod-2/AM (Figure 2E).
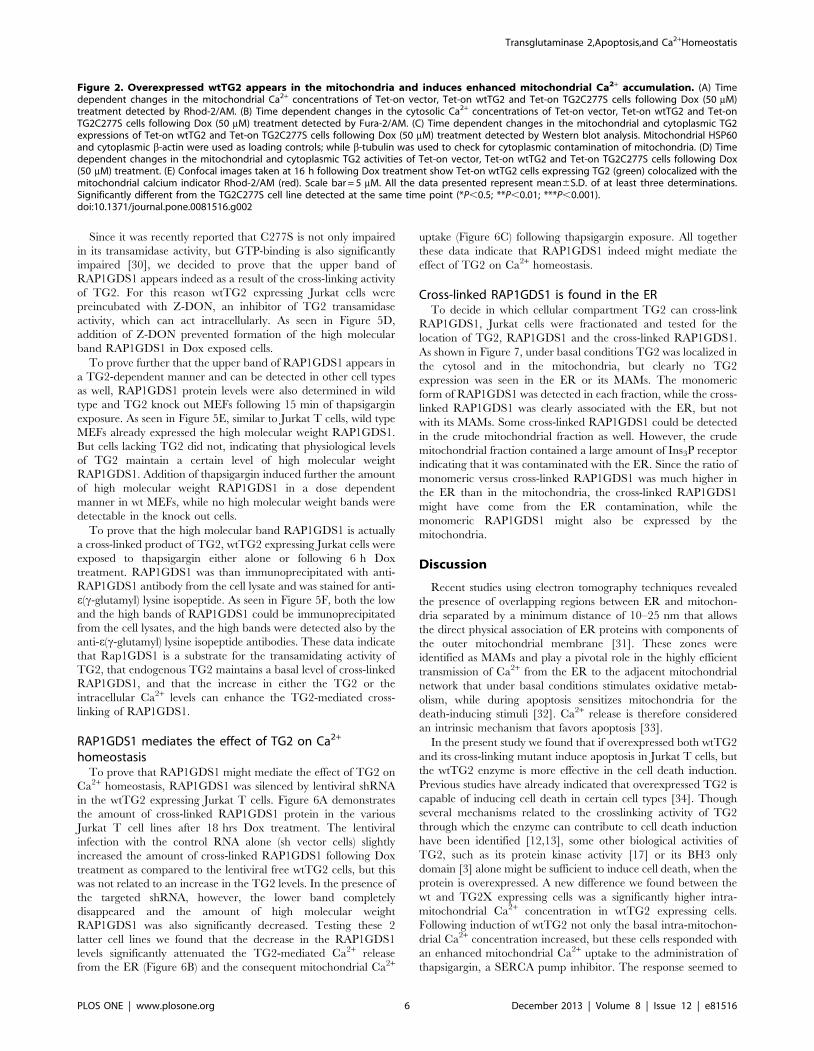
Transglutaminase 2 enhances mitochondrial Ca2+ uptakeindirectly by promoting Ca2+ release from the ER
The cross-linking activity of TG2 is activated by elevations in
intracellular Ca2+ concentrations. To confirm further that the
transamidation activity of TG2 indeed influences intra-mitochon-
drial Ca2+ homeostasis, all the three types of transfected Jurkat
cells treated with Dox for 18 hours were exposed to thapsigargin,
an irreversible SERCA pump inhibitor [23], with the aim of
promoting Ca2+ release from the ER and subsequently activate
TG2 cross-linking activity. Following thapsigargin exposure, intra-
Transglutaminase 2,Apoptosis,and Ca2+Homeostatis
PLOS ONE | www.plosone.org 2 December 2013 | Volume 8 | Issue 12 | e81516
Transglutaminase 2,Apoptosis,and Ca2+Homeostatis
PLOS ONE | www.plosone.org 3 December 2013 | Volume 8 | Issue 12 | e81516
mitochondrial Ca2+ was immediately elevated in all the three cell
lines, but it reached significantly higher levels in the wtTG2
expressing cells than in the others (Figure 3A).
The enhanced mitochondrial Ca2+ concentration achieved by
the overexpression of TG2 can be the result either of an enhanced
mitochondrial Ca2+ uptake, or of an enhanced Ca2+ release from
the ER. To test this latter alternative, Ca2+ release from the ER
was also determined following thapsigargin exposure by detecting
changes in the high Ca2+ concentration of the ER by using the low
affinity Ca2+ fluorescent dye Mag-Fura 2-AM (Kd<50 mM) [24].
As shown in Figure 3B, wtTG2 cells released Ca2+ faster from the
ER in the presence of thapsigargin, than TG2C277S or vector
cells did, indicating that TG2 might act primarily on the ER.
Interestingly, a similar difference in the thapsigargin-induced
Ca2+ release from the ER and in the increase of the intra-
mitochondrial Ca2+ concentration was found, when mouse
embryonic fibroblasts (MEFs) isolated from wild type and TG2
knock out mice were exposed to thapsigargin (Figure 3C and D). A
similar difference in the mitochondrial Ca2+ uptake was found
also, when these cells were stimulated with adenosine 59-
triphosphate (ATP), the P2Y receptor agonist that causes release
of Ca2+ from the ER via Ins3P receptors [25] (Figure 3E).These
data indicate that TG2 might affect intra-mitochondrial Ca2+
homeostasis not only when it is overexpressed, but also at
physiological levels, and not only when thapsigargin is added,
but also after applying a physiological stimulus.
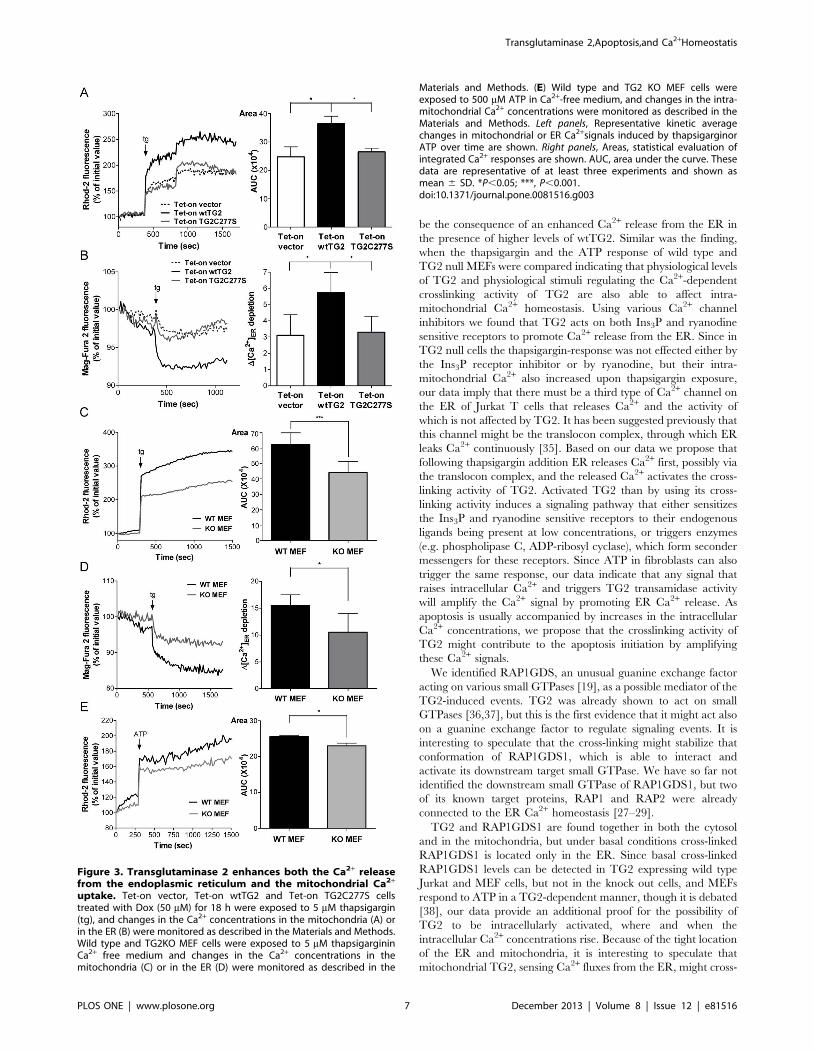
Under resting conditions the net release of Ca2+ from the ER
and the consequent mitochondrial Ca2+ uptake and intra-
mitochondrial Ca2+ concentration result from a balance between
the activity of the SERCA pumps, which import Ca2+ into the ER,
and the total release of Ca2+ from the ER. Addition of thapsigargin
artificially shifts this balance towards to the total ER Ca2+ release
which results in a consequently enhanced mitochondrial Ca2+
uptake. ER expresses Ins3P and ryanodine sensitive receptors to
release Ca2+ for signaling purposes [24]. To identify which of these
Ca2+ channels might be affected by the transamidating activity of
TG2, thapsigargin-induced mitochondrial Ca2+ concentration
changes were detected in the presence of TMB-8, an antagonist
of the Ins3P receptor [26], and/or ryanodine, respectively. Pre-
treatment of wtTG2 cells with either TMB-8 (Figure 4A) or
ryanodine (Figure 4B) for 30 min resulted in suppression of
thapsigargin-induced elevation in the intra-mitochondrial Ca2+
concentration. When both inhibitors were applied together, the
difference in the thapsigargin-induced mitochondrial Ca2+ uptake
between wtTG2 and TG2X expressing cells completely disap-
peared (Figure 4C). These observations were confirmed by using
wild type and TG2 knock out MEFs. While both TMB-8 and
ryanodine were capable of inhibiting the thapsigargin-induced
increase in the intra-mitochondrial Ca2+ concentration in wild
type MEFs (Figure 4D and E), none of them had an effect when
the thapsigargin response was investigated in the knock out cells
(Figure 4D and E). Application of both inhibitors to wtTG2 cells
completely abolished the observed difference in the thapsigargin
response of wild type and TG2 knock out MEFs (Figure 4F).
Theoretically TG2 could act via enhancing Ca2+ levels in the ER
and thus promoting Ca2+ release via all Ca2+ channels of the ER
in a Ca2+ concentration dependent manner. However, no decrease
in the ER Ca2+ concentration was found in the knock out
fibroblasts in the absence of TG2 (Figure 4G) indicating that TG2
acts primarily on Ins3P and ryanodine sensitive receptors to
promote Ca2+ release from the ER.
Overexpressed TG2 cross-links RAP1GDS1To determine which protein mediates the effect of TG2 on the
Ca2+ homeostasis, JK-Tet-On wtTG2 and TG2C277S cells were
exposed to Dox for 18 hrs and their protein expression levels were
compared after two-dimensional gel electrophoresis. Several spots,
the level of which were either increased or decreased in the wtTG2
expressing cells as compared to the TG2C277S cells, were selected
and their identity was determined by LC/MS-MS (Table I). From
the 19 identified proteins we selected RAP1GDS1, an unusual
guanine exchange factor acting on numerous small GTPases [19],
as the candidate for further studies, because two small GTPases
(RAP1 and RAP2) reported to be regulated by it, have already
been linked to the regulation of ER Ca2+ homeostasis [27–29].
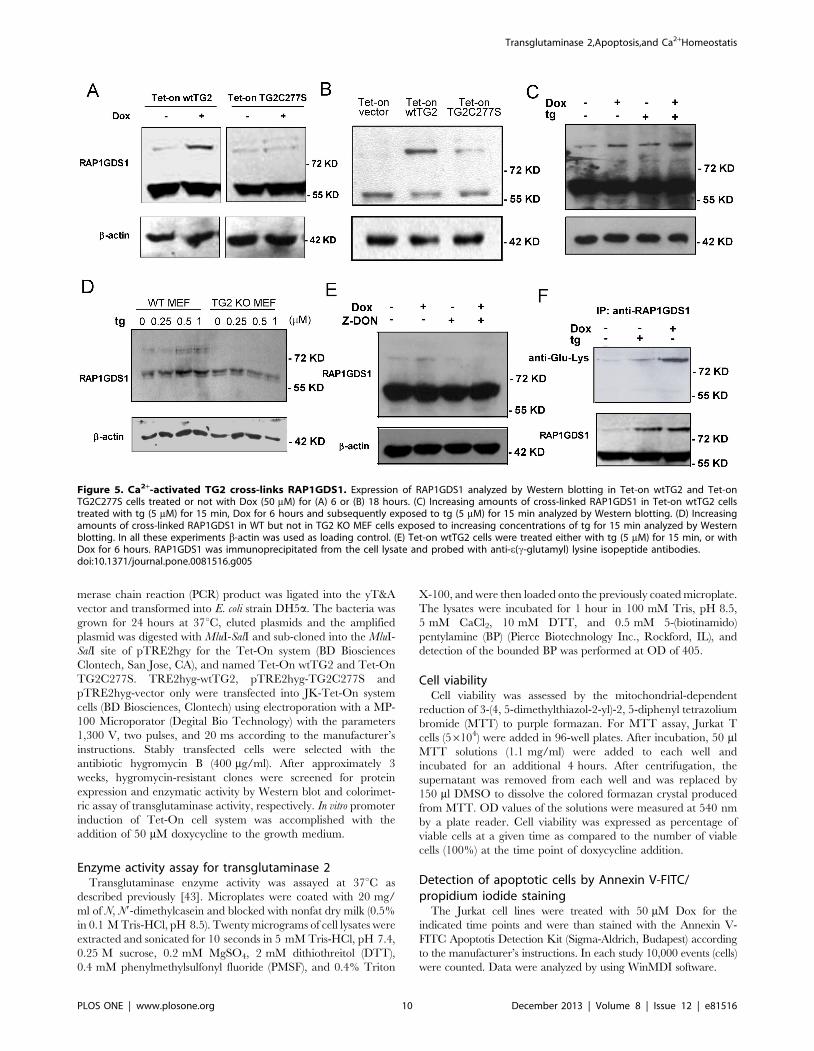
To prove that RAP1GDS1 is indeed a TG2 substrate, the time-
dependent expression of the protein was followed by Western blot
analysis in both the wtTG2 and in the TG2C277S cells following
Dox exposure. As shown in Figure 5A, RAP1GDS1 appeared in
two bands in Jurkat cells, with one band appearing at 57 kD and
another one close to 100 kD molecular weight. In non-treated cells
the upper band was very faint, but the intensity of it significantly
increased by 6 hr in the wtTG2 overexpressing cells, when TG2
was already induced in these cells following Dox exposure. No
similar increase in the intensity of the upper band was detected at
this early time point in the cross-linking mutant TG2 expressing
cells (Figure 5A). Tested however at 18 hr following Dox
treatment, the upper band became stronger in the TG2X
expressing cells as well (Figure 5B) indicating that the endoge-
nously expressed TG2 can also initiate the formation of high
molecular weightRAP1GDS1, when apoptosis is detectable in the
cell line. In addition, formation of the higher amount of high
molecular weight RAP1GDS1 was accompanied with the
disappearance of the low molecular weight RAP1GDS1 indicating
a possible conversion of low molecular weight RAP1GDS1 to the
higher molecular weight one. Addition of thapsigargin was capable
of further inducing the intensity of the upper band within 15 min
tested in the wtTG2 expressing cells exposed to Dox for 6 h
indicating that the upper band formation is fast and Ca2+-
dependent (Figure 5C).
Figure 1. Timed overexpression of wtTG2 or of its cross-linking mutant induces apoptosis in Jurkat T cells. (A) Tet-on vector, Tet-onwtTG2 and Tet-on TG2C277S cells were treated with 50 mM doxycycline (Dox). The expression level of TG2 protein was detected by Western blotanalysis after 18 h of Dox treatment. b-actin was used as a loading control. (B) The transglutaminase enzyme activity in the various types of Jurkatcells was determined after 6 h of Dox treatment. (C) Induced overexpression of wtTG2 or TG2C277S decreased the cell viability in a time dependentmanner. Number of viable cells was determined at the indicated time points following Dox treatment. Significantly different from the viable cellnumber of the indicated cell line at the same time point (***P,0.001). (D) Induced overexpression of wtTG2 or TG2C277S increased the percentage ofAnnexin V positive cells. Number of Annexin V and/or propidium iodide positive cells was determined at the indicated time points following Doxtreatment. Significantly different from the % of Annexin V positive cells of the indicated cell line at the same time point (**P,0.01; ***P,0.001). Flowcytometric data demonstrate results detected after 48 h of Dox treatment. (E) DNA histogram of propidium iodide stained Tet-on vector, Tet-onwtTG2 and Tet-on TG2C277S cells treated with Dox for 60 hours. Cells exhibiting sub-G1 levels of DNA were considered apoptotic and their amountwas calculated as percentage of the total cell number. *Data represent at least three independent experiments and are shown as mean 6 SD(P,0.05). (F) Electrophoretic analysis of internucleosomal DNA fragmentation in Tet-on vector, Tet-on wtTG2 and Tet-on TG2C277S cells treated withor without Dox (50 mM) for 60 hours. MW, standard. The results are representative of one of three independent experiments.doi:10.1371/journal.pone.0081516.g001
Transglutaminase 2,Apoptosis,and Ca2+Homeostatis
PLOS ONE | www.plosone.org 4 December 2013 | Volume 8 | Issue 12 | e81516
Transglutaminase 2,Apoptosis,and Ca2+Homeostatis
PLOS ONE | www.plosone.org 5 December 2013 | Volume 8 | Issue 12 | e81516
Since it was recently reported that C277S is not only impaired
in its transamidase activity, but GTP-binding is also significantly
impaired [30], we decided to prove that the upper band of
RAP1GDS1 appears indeed as a result of the cross-linking activity
of TG2. For this reason wtTG2 expressing Jurkat cells were
preincubated with Z-DON, an inhibitor of TG2 transamidase
activity, which can act intracellularly. As seen in Figure 5D,
addition of Z-DON prevented formation of the high molecular
band RAP1GDS1 in Dox exposed cells.
To prove further that the upper band of RAP1GDS1 appears in
a TG2-dependent manner and can be detected in other cell types
as well, RAP1GDS1 protein levels were also determined in wild
type and TG2 knock out MEFs following 15 min of thapsigargin
exposure. As seen in Figure 5E, similar to Jurkat T cells, wild type
MEFs already expressed the high molecular weight RAP1GDS1.
But cells lacking TG2 did not, indicating that physiological levels
of TG2 maintain a certain level of high molecular weight
RAP1GDS1. Addition of thapsigargin induced further the amount
of high molecular weight RAP1GDS1 in a dose dependent
manner in wt MEFs, while no high molecular weight bands were
detectable in the knock out cells.
To prove that the high molecular band RAP1GDS1 is actually
a cross-linked product of TG2, wtTG2 expressing Jurkat cells were
exposed to thapsigargin either alone or following 6 h Dox
treatment. RAP1GDS1 was than immunoprecipitated with anti-
RAP1GDS1 antibody from the cell lysate and was stained for anti-
e(c-glutamyl) lysine isopeptide. As seen in Figure 5F, both the low
and the high bands of RAP1GDS1 could be immunoprecipitated
from the cell lysates, and the high bands were detected also by the
anti-e(c-glutamyl) lysine isopeptide antibodies. These data indicate
that Rap1GDS1 is a substrate for the transamidating activity of
TG2, that endogenous TG2 maintains a basal level of cross-linked
RAP1GDS1, and that the increase in either the TG2 or the
intracellular Ca2+ levels can enhance the TG2-mediated cross-
linking of RAP1GDS1.
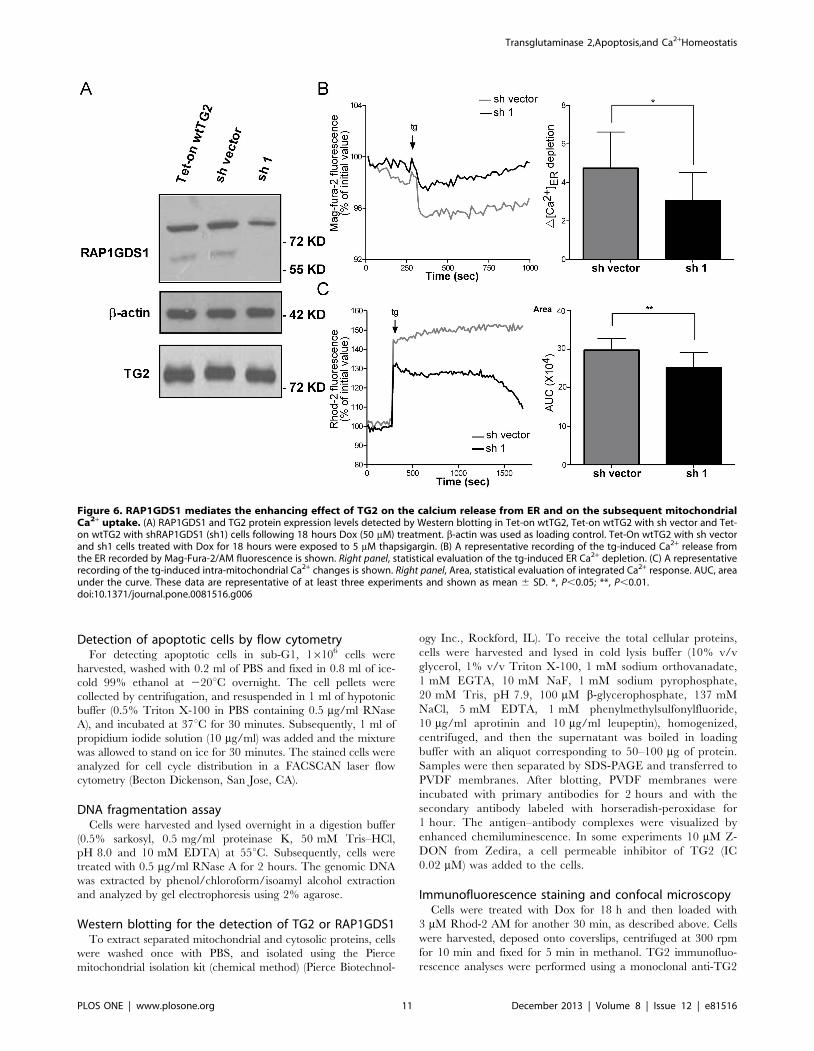
RAP1GDS1 mediates the effect of TG2 on Ca2+
homeostasisTo prove that RAP1GDS1 might mediate the effect of TG2 on
Ca2+ homeostasis, RAP1GDS1 was silenced by lentiviral shRNA
in the wtTG2 expressing Jurkat T cells. Figure 6A demonstrates
the amount of cross-linked RAP1GDS1 protein in the various
Jurkat T cell lines after 18 hrs Dox treatment. The lentiviral
infection with the control RNA alone (sh vector cells) slightly
increased the amount of cross-linked RAP1GDS1 following Dox
treatment as compared to the lentiviral free wtTG2 cells, but this
was not related to an increase in the TG2 levels. In the presence of
the targeted shRNA, however, the lower band completely
disappeared and the amount of high molecular weight
RAP1GDS1 was also significantly decreased. Testing these 2
latter cell lines we found that the decrease in the RAP1GDS1
levels significantly attenuated the TG2-mediated Ca2+ release
from the ER (Figure 6B) and the consequent mitochondrial Ca2+
uptake (Figure 6C) following thapsigargin exposure. All together
these data indicate that RAP1GDS1 indeed might mediate the
effect of TG2 on Ca2+ homeostasis.
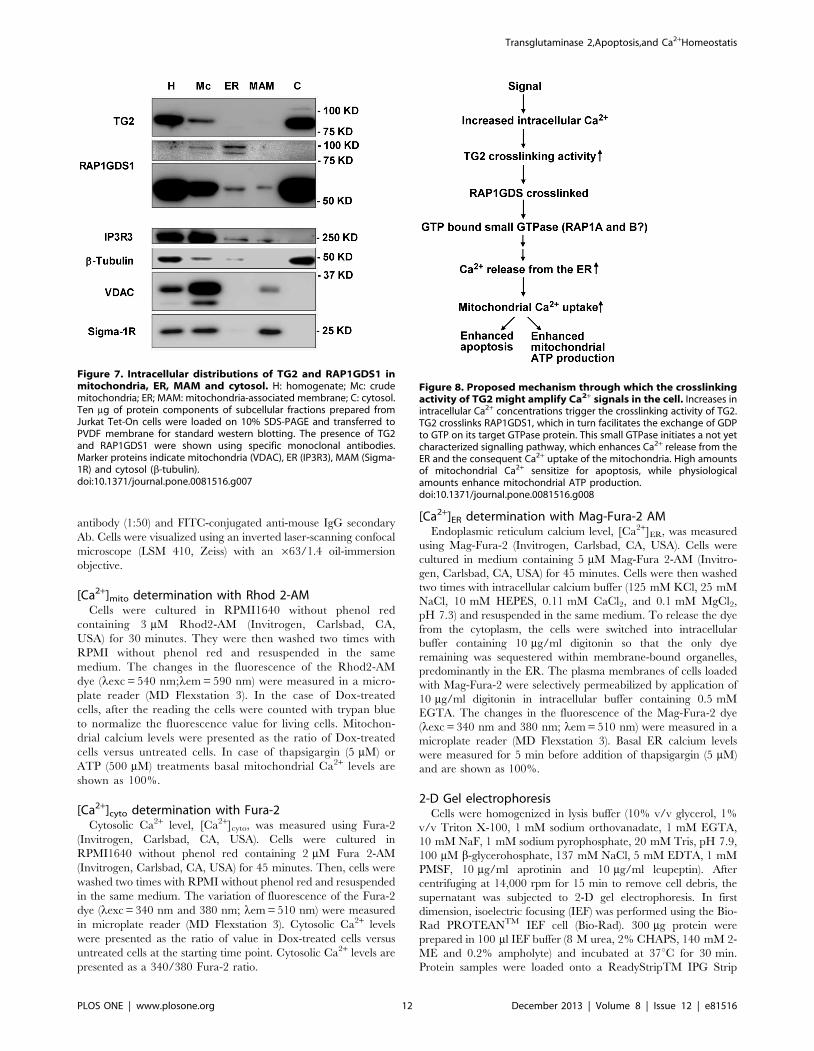
Cross-linked RAP1GDS1 is found in the ERTo decide in which cellular compartment TG2 can cross-link
RAP1GDS1, Jurkat cells were fractionated and tested for the
location of TG2, RAP1GDS1 and the cross-linked RAP1GDS1.
As shown in Figure 7, under basal conditions TG2 was localized in
the cytosol and in the mitochondria, but clearly no TG2
expression was seen in the ER or its MAMs. The monomeric
form of RAP1GDS1 was detected in each fraction, while the cross-
linked RAP1GDS1 was clearly associated with the ER, but not
with its MAMs. Some cross-linked RAP1GDS1 could be detected
in the crude mitochondrial fraction as well. However, the crude
mitochondrial fraction contained a large amount of Ins3P receptor
indicating that it was contaminated with the ER. Since the ratio of
monomeric versus cross-linked RAP1GDS1 was much higher in
the ER than in the mitochondria, the cross-linked RAP1GDS1
might have come from the ER contamination, while the
monomeric RAP1GDS1 might also be expressed by the
mitochondria.
Discussion
Recent studies using electron tomography techniques revealed
the presence of overlapping regions between ER and mitochon-
dria separated by a minimum distance of 10–25 nm that allows
the direct physical association of ER proteins with components of
the outer mitochondrial membrane [31]. These zones were
identified as MAMs and play a pivotal role in the highly efficient
transmission of Ca2+ from the ER to the adjacent mitochondrial
network that under basal conditions stimulates oxidative metab-
olism, while during apoptosis sensitizes mitochondria for the
death-inducing stimuli [32]. Ca2+ release is therefore considered
an intrinsic mechanism that favors apoptosis [33].
In the present study we found that if overexpressed both wtTG2
and its cross-linking mutant induce apoptosis in Jurkat T cells, but
the wtTG2 enzyme is more effective in the cell death induction.
Previous studies have already indicated that overexpressed TG2 is
capable of inducing cell death in certain cell types [34]. Though
several mechanisms related to the crosslinking activity of TG2
through which the enzyme can contribute to cell death induction
have been identified [12,13], some other biological activities of
TG2, such as its protein kinase activity [17] or its BH3 only
domain [3] alone might be sufficient to induce cell death, when the
protein is overexpressed. A new difference we found between the
wt and TG2X expressing cells was a significantly higher intra-
mitochondrial Ca2+ concentration in wtTG2 expressing cells.
Following induction of wtTG2 not only the basal intra-mitochon-
drial Ca2+ concentration increased, but these cells responded with
an enhanced mitochondrial Ca2+ uptake to the administration of
thapsigargin, a SERCA pump inhibitor. The response seemed to
Figure 2. Overexpressed wtTG2 appears in the mitochondria and induces enhanced mitochondrial Ca2+ accumulation. (A) Timedependent changes in the mitochondrial Ca2+ concentrations of Tet-on vector, Tet-on wtTG2 and Tet-on TG2C277S cells following Dox (50 mM)treatment detected by Rhod-2/AM. (B) Time dependent changes in the cytosolic Ca2+ concentrations of Tet-on vector, Tet-on wtTG2 and Tet-onTG2C277S cells following Dox (50 mM) treatment detected by Fura-2/AM. (C) Time dependent changes in the mitochondrial and cytoplasmic TG2expressions of Tet-on wtTG2 and Tet-on TG2C277S cells following Dox (50 mM) treatment detected by Western blot analysis. Mitochondrial HSP60and cytoplasmic b-actin were used as loading controls; while b-tubulin was used to check for cytoplasmic contamination of mitochondria. (D) Timedependent changes in the mitochondrial and cytoplasmic TG2 activities of Tet-on vector, Tet-on wtTG2 and Tet-on TG2C277S cells following Dox(50 mM) treatment. (E) Confocal images taken at 16 h following Dox treatment show Tet-on wtTG2 cells expressing TG2 (green) colocalized with themitochondrial calcium indicator Rhod-2/AM (red). Scale bar = 5 mM. All the data presented represent mean6S.D. of at least three determinations.Significantly different from the TG2C277S cell line detected at the same time point (*P,0.5; **P,0.01; ***P,0.001).doi:10.1371/journal.pone.0081516.g002
Transglutaminase 2,Apoptosis,and Ca2+Homeostatis
PLOS ONE | www.plosone.org 6 December 2013 | Volume 8 | Issue 12 | e81516
be the consequence of an enhanced Ca2+ release from the ER in
the presence of higher levels of wtTG2. Similar was the finding,
when the thapsigargin and the ATP response of wild type and
TG2 null MEFs were compared indicating that physiological levels
of TG2 and physiological stimuli regulating the Ca2+-dependent
crosslinking activity of TG2 are also able to affect intra-
mitochondrial Ca2+ homeostasis. Using various Ca2+ channel
inhibitors we found that TG2 acts on both Ins3P and ryanodine
sensitive receptors to promote Ca2+ release from the ER. Since in
TG2 null cells the thapsigargin-response was not effected either by
the Ins3P receptor inhibitor or by ryanodine, but their intra-
mitochondrial Ca2+ also increased upon thapsigargin exposure,
our data imply that there must be a third type of Ca2+ channel on
the ER of Jurkat T cells that releases Ca2+ and the activity of
which is not affected by TG2. It has been suggested previously that
this channel might be the translocon complex, through which ER
leaks Ca2+ continuously [35]. Based on our data we propose that
following thapsigargin addition ER releases Ca2+ first, possibly via
the translocon complex, and the released Ca2+ activates the cross-
linking activity of TG2. Activated TG2 than by using its cross-
linking activity induces a signaling pathway that either sensitizes
the Ins3P and ryanodine sensitive receptors to their endogenous
ligands being present at low concentrations, or triggers enzymes
(e.g. phospholipase C, ADP-ribosyl cyclase), which form seconder
messengers for these receptors. Since ATP in fibroblasts can also
trigger the same response, our data indicate that any signal that
raises intracellular Ca2+ and triggers TG2 transamidase activity
will amplify the Ca2+ signal by promoting ER Ca2+ release. As
apoptosis is usually accompanied by increases in the intracellular
Ca2+ concentrations, we propose that the crosslinking activity of
TG2 might contribute to the apoptosis initiation by amplifying
these Ca2+ signals.
We identified RAP1GDS, an unusual guanine exchange factor
acting on various small GTPases [19], as a possible mediator of the
TG2-induced events. TG2 was already shown to act on small
GTPases [36,37], but this is the first evidence that it might act also
on a guanine exchange factor to regulate signaling events. It is
interesting to speculate that the cross-linking might stabilize that
conformation of RAP1GDS1, which is able to interact and
activate its downstream target small GTPase. We have so far not
identified the downstream small GTPase of RAP1GDS1, but two
of its known target proteins, RAP1 and RAP2 were already
connected to the ER Ca2+ homeostasis [27–29].
TG2 and RAP1GDS1 are found together in both the cytosol
and in the mitochondria, but under basal conditions cross-linked
RAP1GDS1 is located only in the ER. Since basal cross-linked
RAP1GDS1 levels can be detected in TG2 expressing wild type
Jurkat and MEF cells, but not in the knock out cells, and MEFs
respond to ATP in a TG2-dependent manner, though it is debated
[38], our data provide an additional proof for the possibility of
TG2 to be intracellularly activated, where and when the
intracellular Ca2+ concentrations rise. Because of the tight location
of the ER and mitochondria, it is interesting to speculate that
mitochondrial TG2, sensing Ca2+ fluxes from the ER, might cross-
Figure 3. Transglutaminase 2 enhances both the Ca2+ releasefrom the endoplasmic reticulum and the mitochondrial Ca2+
uptake. Tet-on vector, Tet-on wtTG2 and Tet-on TG2C277S cellstreated with Dox (50 mM) for 18 h were exposed to 5 mM thapsigargin(tg), and changes in the Ca2+ concentrations in the mitochondria (A) orin the ER (B) were monitored as described in the Materials and Methods.Wild type and TG2KO MEF cells were exposed to 5 mM thapsigargininCa2+ free medium and changes in the Ca2+ concentrations in themitochondria (C) or in the ER (D) were monitored as described in the
Materials and Methods. (E) Wild type and TG2 KO MEF cells wereexposed to 500 mM ATP in Ca2+-free medium, and changes in the intra-mitochondrial Ca2+ concentrations were monitored as described in theMaterials and Methods. Left panels, Representative kinetic averagechanges in mitochondrial or ER Ca2+signals induced by thapsigarginorATP over time are shown. Right panels, Areas, statistical evaluation ofintegrated Ca2+ responses are shown. AUC, area under the curve. Thesedata are representative of at least three experiments and shown asmean 6 SD. *P,0.05; ***, P,0.001.doi:10.1371/journal.pone.0081516.g003
Transglutaminase 2,Apoptosis,and Ca2+Homeostatis
PLOS ONE | www.plosone.org 7 December 2013 | Volume 8 | Issue 12 | e81516
Transglutaminase 2,Apoptosis,and Ca2+Homeostatis
PLOS ONE | www.plosone.org 8 December 2013 | Volume 8 | Issue 12 | e81516
link RAP1GDS1 located in the ER membranes which, in turn,
triggers a signaling pathway that forms an amplifying loop for the
ER-derived Ca2+ signals.
Conclusions
In the present paper we have demonstrated the TG2, if
overexpressed, can induce apoptosis in T cells and both its
crosslinking and crosslinking-unrelated activities contribute to the
phenomenon. We identified a new signaling pathway related to
the calcium regulated crosslinking activity of TG2 that involves the
unusual guanine exchange factor RAP1GDS1, and promotes the
Ca2+ release from the ER via both the Ins3P receptor and
ryanodine sensitive channels leading to an enhanced mitochon-
drial Ca2+ uptake (Figure 8). Since enhanced mitochondrial Ca2+
concentrations were shown to sensitize mitochondria for the action
of pro-apoptotic factors [8,9], this signaling pathway might
contribute to the initiation of the apoptotic process. Since under
basal conditions mitochondrial Ca2+ uptake regulates the rate of
mitochondrial ATP synthesis [33], we propose that the loss of this
amplifying loop might contribute to the impairment of ATP
synthesis in the heart of TG2 null mice [39], or to the development
of MODY type of diabetes mellitus [40], which is believed to be
the result of an impaired ATP synthesis in the pancreatic b-cells
[41]. Studies are in process to investigate these possibilities.
Methods
Cell cultureThe Jurkat (JK), JK-Tet-On Vector, JK-Tet-On wtTG2 and
JK-Tet-On TG2C277S cells were grown in 90% RPMI 1640 and
10% fetal bovine serum (FBS) obtained from Gibco BRL (Grand
Island, NY) at a temperature of 37uC under a humidified and 5%
CO2 atmosphere. Wild type (WT) and TG2 knock out (KO)
mouse embryonal fibroblasts (MEF) derived from wild-type and
TG2 knock out mice were kindly provided by Professor Mauro
Piacentini, University Tor Vergata [42]. MEFs were cultured in
90% DMEM and 10% fetal FBS at a temperature of 37uC under a
humidified and 5% CO2 atmosphere.
Human wtTG2 and TG2C277S gene sub-cloning and celltransfection
The entire coding sequence of human wild type (wtTG2) and
mutant TG2 (TG2C277S), a variant containing a point mutation
in the active site (TGCRAGC, Cys277RSer), cDNA were kindly
provided by Professor Peter Davies, Houston, TX. Briefly, wtTG2
and TG2C277S cDNA was amplified using a sense primer
consisting of a 59MluI site (underlined) and a 21-nt sequence:
ACGCGTATGGCCGAGGAGCTGGTCTTA, an anti-sense
primer consisting of a 59SalI site (underlined) and a 18-nt
sequence: GTCGACTTAGGCGGGGCCAATGAT. The poly-
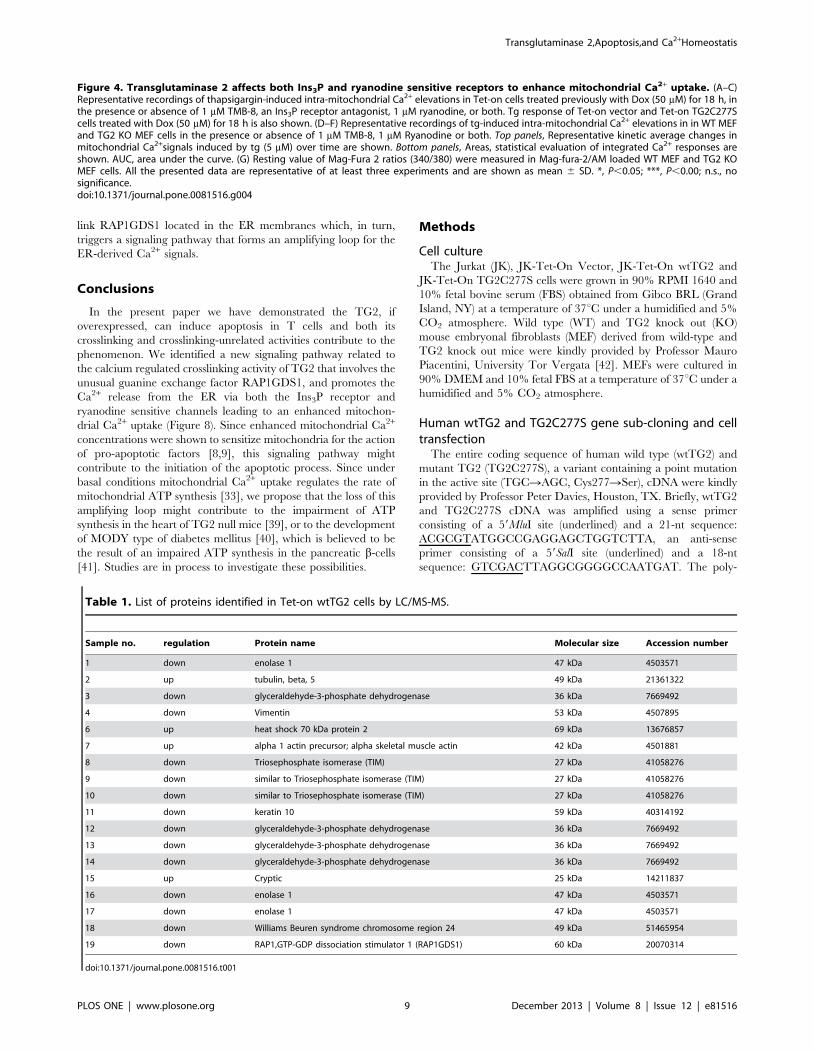
Figure 4. Transglutaminase 2 affects both Ins3P and ryanodine sensitive receptors to enhance mitochondrial Ca2+ uptake. (A–C)Representative recordings of thapsigargin-induced intra-mitochondrial Ca2+ elevations in Tet-on cells treated previously with Dox (50 mM) for 18 h, inthe presence or absence of 1 mM TMB-8, an Ins3P receptor antagonist, 1 mM ryanodine, or both. Tg response of Tet-on vector and Tet-on TG2C277Scells treated with Dox (50 mM) for 18 h is also shown. (D–F) Representative recordings of tg-induced intra-mitochondrial Ca2+ elevations in in WT MEFand TG2 KO MEF cells in the presence or absence of 1 mM TMB-8, 1 mM Ryanodine or both. Top panels, Representative kinetic average changes inmitochondrial Ca2+signals induced by tg (5 mM) over time are shown. Bottom panels, Areas, statistical evaluation of integrated Ca2+ responses areshown. AUC, area under the curve. (G) Resting value of Mag-Fura 2 ratios (340/380) were measured in Mag-fura-2/AM loaded WT MEF and TG2 KOMEF cells. All the presented data are representative of at least three experiments and are shown as mean 6 SD. *, P,0.05; ***, P,0.00; n.s., nosignificance.doi:10.1371/journal.pone.0081516.g004
Table 1. List of proteins identified in Tet-on wtTG2 cells by LC/MS-MS.
Sample no. regulation Protein name Molecular size Accession number
1 down enolase 1 47 kDa 4503571
2 up tubulin, beta, 5 49 kDa 21361322
3 down glyceraldehyde-3-phosphate dehydrogenase 36 kDa 7669492
4 down Vimentin 53 kDa 4507895
6 up heat shock 70 kDa protein 2 69 kDa 13676857
7 up alpha 1 actin precursor; alpha skeletal muscle actin 42 kDa 4501881
8 down Triosephosphate isomerase (TIM) 27 kDa 41058276
9 down similar to Triosephosphate isomerase (TIM) 27 kDa 41058276
10 down similar to Triosephosphate isomerase (TIM) 27 kDa 41058276
11 down keratin 10 59 kDa 40314192
12 down glyceraldehyde-3-phosphate dehydrogenase 36 kDa 7669492
13 down glyceraldehyde-3-phosphate dehydrogenase 36 kDa 7669492
14 down glyceraldehyde-3-phosphate dehydrogenase 36 kDa 7669492
15 up Cryptic 25 kDa 14211837
16 down enolase 1 47 kDa 4503571
17 down enolase 1 47 kDa 4503571
18 down Williams Beuren syndrome chromosome region 24 49 kDa 51465954
19 down RAP1,GTP-GDP dissociation stimulator 1 (RAP1GDS1) 60 kDa 20070314
doi:10.1371/journal.pone.0081516.t001
Transglutaminase 2,Apoptosis,and Ca2+Homeostatis
PLOS ONE | www.plosone.org 9 December 2013 | Volume 8 | Issue 12 | e81516
merase chain reaction (PCR) product was ligated into the yT&A
vector and transformed into E. coli strain DH5a. The bacteria was
grown for 24 hours at 37uC, eluted plasmids and the amplified
plasmid was digested with MluI-SalI and sub-cloned into the MluI-
SalI site of pTRE2hgy for the Tet-On system (BD Biosciences
Clontech, San Jose, CA), and named Tet-On wtTG2 and Tet-On
TG2C277S. TRE2hyg-wtTG2, pTRE2hyg-TG2C277S and
pTRE2hyg-vector only were transfected into JK-Tet-On system
cells (BD Biosciences, Clontech) using electroporation with a MP-
100 Microporator (Degital Bio Technology) with the parameters
1,300 V, two pulses, and 20 ms according to the manufacturer’s
instructions. Stably transfected cells were selected with the
antibiotic hygromycin B (400 mg/ml). After approximately 3
weeks, hygromycin-resistant clones were screened for protein
expression and enzymatic activity by Western blot and colorimet-
ric assay of transglutaminase activity, respectively. In vitro promoter
induction of Tet-On cell system was accomplished with the
addition of 50 mM doxycycline to the growth medium.
Enzyme activity assay for transglutaminase 2Transglutaminase enzyme activity was assayed at 37uC as
described previously [43]. Microplates were coated with 20 mg/
ml of N, N9-dimethylcasein and blocked with nonfat dry milk (0.5%
in 0.1 M Tris-HCl, pH 8.5). Twenty micrograms of cell lysates were
extracted and sonicated for 10 seconds in 5 mM Tris-HCl, pH 7.4,
0.25 M sucrose, 0.2 mM MgSO4, 2 mM dithiothreitol (DTT),
0.4 mM phenylmethylsulfonyl fluoride (PMSF), and 0.4% Triton
X-100, and were then loaded onto the previously coated microplate.
The lysates were incubated for 1 hour in 100 mM Tris, pH 8.5,
5 mM CaCl2, 10 mM DTT, and 0.5 mM 5-(biotinamido)
pentylamine (BP) (Pierce Biotechnology Inc., Rockford, IL), and
detection of the bounded BP was performed at OD of 405.
Cell viabilityCell viability was assessed by the mitochondrial-dependent
reduction of 3-(4, 5-dimethylthiazol-2-yl)-2, 5-diphenyl tetrazolium
bromide (MTT) to purple formazan. For MTT assay, Jurkat T
cells (56104) were added in 96-well plates. After incubation, 50 ml
MTT solutions (1.1 mg/ml) were added to each well and
incubated for an additional 4 hours. After centrifugation, the
supernatant was removed from each well and was replaced by
150 ml DMSO to dissolve the colored formazan crystal produced
from MTT. OD values of the solutions were measured at 540 nm
by a plate reader. Cell viability was expressed as percentage of
viable cells at a given time as compared to the number of viable
cells (100%) at the time point of doxycycline addition.
Detection of apoptotic cells by Annexin V-FITC/propidium iodide staining
The Jurkat cell lines were treated with 50 mM Dox for the
indicated time points and were than stained with the Annexin V-
FITC Apoptotis Detection Kit (Sigma-Aldrich, Budapest) according
to the manufacturer’s instructions. In each study 10,000 events (cells)
were counted. Data were analyzed by using WinMDI software.
Figure 5. Ca2+-activated TG2 cross-links RAP1GDS1. Expression of RAP1GDS1 analyzed by Western blotting in Tet-on wtTG2 and Tet-onTG2C277S cells treated or not with Dox (50 mM) for (A) 6 or (B) 18 hours. (C) Increasing amounts of cross-linked RAP1GDS1 in Tet-on wtTG2 cellstreated with tg (5 mM) for 15 min, Dox for 6 hours and subsequently exposed to tg (5 mM) for 15 min analyzed by Western blotting. (D) Increasingamounts of cross-linked RAP1GDS1 in WT but not in TG2 KO MEF cells exposed to increasing concentrations of tg for 15 min analyzed by Westernblotting. In all these experiments b-actin was used as loading control. (E) Tet-on wtTG2 cells were treated either with tg (5 mM) for 15 min, or withDox for 6 hours. RAP1GDS1 was immunoprecipitated from the cell lysate and probed with anti-e(c-glutamyl) lysine isopeptide antibodies.doi:10.1371/journal.pone.0081516.g005
Transglutaminase 2,Apoptosis,and Ca2+Homeostatis
PLOS ONE | www.plosone.org 10 December 2013 | Volume 8 | Issue 12 | e81516
Detection of apoptotic cells by flow cytometryFor detecting apoptotic cells in sub-G1, 16106 cells were
harvested, washed with 0.2 ml of PBS and fixed in 0.8 ml of ice-
cold 99% ethanol at 220uC overnight. The cell pellets were
collected by centrifugation, and resuspended in 1 ml of hypotonic
buffer (0.5% Triton X-100 in PBS containing 0.5 mg/ml RNase
A), and incubated at 37uC for 30 minutes. Subsequently, 1 ml of
propidium iodide solution (10 mg/ml) was added and the mixture
was allowed to stand on ice for 30 minutes. The stained cells were
analyzed for cell cycle distribution in a FACSCAN laser flow
cytometry (Becton Dickenson, San Jose, CA).
DNA fragmentation assayCells were harvested and lysed overnight in a digestion buffer
(0.5% sarkosyl, 0.5 mg/ml proteinase K, 50 mM Tris–HCl,
pH 8.0 and 10 mM EDTA) at 55uC. Subsequently, cells were
treated with 0.5 mg/ml RNase A for 2 hours. The genomic DNA
was extracted by phenol/chloroform/isoamyl alcohol extraction
and analyzed by gel electrophoresis using 2% agarose.
Western blotting for the detection of TG2 or RAP1GDS1To extract separated mitochondrial and cytosolic proteins, cells
were washed once with PBS, and isolated using the Pierce
mitochondrial isolation kit (chemical method) (Pierce Biotechnol-
ogy Inc., Rockford, IL). To receive the total cellular proteins,
cells were harvested and lysed in cold lysis buffer (10% v/v
glycerol, 1% v/v Triton X-100, 1 mM sodium orthovanadate,
1 mM EGTA, 10 mM NaF, 1 mM sodium pyrophosphate,
20 mM Tris, pH 7.9, 100 mM b-glycerophosphate, 137 mM
NaCl, 5 mM EDTA, 1 mM phenylmethylsulfonylfluoride,
10 mg/ml aprotinin and 10 mg/ml leupeptin), homogenized,
centrifuged, and then the supernatant was boiled in loading
buffer with an aliquot corresponding to 50–100 mg of protein.
Samples were then separated by SDS-PAGE and transferred to
PVDF membranes. After blotting, PVDF membranes were
incubated with primary antibodies for 2 hours and with the
secondary antibody labeled with horseradish-peroxidase for
1 hour. The antigen–antibody complexes were visualized by
enhanced chemiluminescence. In some experiments 10 mM Z-
DON from Zedira, a cell permeable inhibitor of TG2 (IC
0.02 mM) was added to the cells.
Immunofluorescence staining and confocal microscopyCells were treated with Dox for 18 h and then loaded with
3 mM Rhod-2 AM for another 30 min, as described above. Cells
were harvested, deposed onto coverslips, centrifuged at 300 rpm
for 10 min and fixed for 5 min in methanol. TG2 immunofluo-
rescence analyses were performed using a monoclonal anti-TG2
Figure 6. RAP1GDS1 mediates the enhancing effect of TG2 on the calcium release from ER and on the subsequent mitochondrialCa2+ uptake. (A) RAP1GDS1 and TG2 protein expression levels detected by Western blotting in Tet-on wtTG2, Tet-on wtTG2 with sh vector and Tet-on wtTG2 with shRAP1GDS1 (sh1) cells following 18 hours Dox (50 mM) treatment. b-actin was used as loading control. Tet-On wtTG2 with sh vectorand sh1 cells treated with Dox for 18 hours were exposed to 5 mM thapsigargin. (B) A representative recording of the tg-induced Ca2+ release fromthe ER recorded by Mag-Fura-2/AM fluorescence is shown. Right panel, statistical evaluation of the tg-induced ER Ca2+ depletion. (C) A representativerecording of the tg-induced intra-mitochondrial Ca2+ changes is shown. Right panel, Area, statistical evaluation of integrated Ca2+ response. AUC, areaunder the curve. These data are representative of at least three experiments and shown as mean 6 SD. *, P,0.05; **, P,0.01.doi:10.1371/journal.pone.0081516.g006
Transglutaminase 2,Apoptosis,and Ca2+Homeostatis
PLOS ONE | www.plosone.org 11 December 2013 | Volume 8 | Issue 12 | e81516
antibody (1:50) and FITC-conjugated anti-mouse IgG secondary
Ab. Cells were visualized using an inverted laser-scanning confocal
microscope (LSM 410, Zeiss) with an 663/1.4 oil-immersion
objective.
[Ca2+]mito determination with Rhod 2-AMCells were cultured in RPMI1640 without phenol red
containing 3 mM Rhod2-AM (Invitrogen, Carlsbad, CA,
USA) for 30 minutes. They were then washed two times with
RPMI without phenol red and resuspended in the same
medium. The changes in the fluorescence of the Rhod2-AM
dye (lexc = 540 nm;lem = 590 nm) were measured in a micro-
plate reader (MD Flexstation 3). In the case of Dox-treated
cells, after the reading the cells were counted with trypan blue
to normalize the fluorescence value for living cells. Mitochon-
drial calcium levels were presented as the ratio of Dox-treated
cells versus untreated cells. In case of thapsigargin (5 mM) or
ATP (500 mM) treatments basal mitochondrial Ca2+ levels are
shown as 100%.
[Ca2+]cyto determination with Fura-2Cytosolic Ca2+ level, [Ca2+]cyto, was measured using Fura-2
(Invitrogen, Carlsbad, CA, USA). Cells were cultured in
RPMI1640 without phenol red containing 2 mM Fura 2-AM
(Invitrogen, Carlsbad, CA, USA) for 45 minutes. Then, cells were
washed two times with RPMI without phenol red and resuspended
in the same medium. The variation of fluorescence of the Fura-2
dye (lexc = 340 nm and 380 nm; lem = 510 nm) were measured
in microplate reader (MD Flexstation 3). Cytosolic Ca2+ levels
were presented as the ratio of value in Dox-treated cells versus
untreated cells at the starting time point. Cytosolic Ca2+ levels are
presented as a 340/380 Fura-2 ratio.
[Ca2+]ER determination with Mag-Fura-2 AMEndoplasmic reticulum calcium level, [Ca2+]ER, was measured
using Mag-Fura-2 (Invitrogen, Carlsbad, CA, USA). Cells were
cultured in medium containing 5 mM Mag-Fura 2-AM (Invitro-
gen, Carlsbad, CA, USA) for 45 minutes. Cells were then washed
two times with intracellular calcium buffer (125 mM KCl, 25 mM
NaCl, 10 mM HEPES, 0.11 mM CaCl2, and 0.1 mM MgCl2,
pH 7.3) and resuspended in the same medium. To release the dye
from the cytoplasm, the cells were switched into intracellular
buffer containing 10 mg/ml digitonin so that the only dye
remaining was sequestered within membrane-bound organelles,
predominantly in the ER. The plasma membranes of cells loaded
with Mag-Fura-2 were selectively permeabilized by application of
10 mg/ml digitonin in intracellular buffer containing 0.5 mM
EGTA. The changes in the fluorescence of the Mag-Fura-2 dye
(lexc = 340 nm and 380 nm; lem = 510 nm) were measured in a
microplate reader (MD Flexstation 3). Basal ER calcium levels
were measured for 5 min before addition of thapsigargin (5 mM)
and are shown as 100%.
2-D Gel electrophoresisCells were homogenized in lysis buffer (10% v/v glycerol, 1%
v/v Triton X-100, 1 mM sodium orthovanadate, 1 mM EGTA,
10 mM NaF, 1 mM sodium pyrophosphate, 20 mM Tris, pH 7.9,
100 mM b-glycerohosphate, 137 mM NaCl, 5 mM EDTA, 1 mM
PMSF, 10 mg/ml aprotinin and 10 mg/ml leupeptin). After
centrifuging at 14,000 rpm for 15 min to remove cell debris, the
supernatant was subjected to 2-D gel electrophoresis. In first
dimension, isoelectric focusing (IEF) was performed using the Bio-
Rad PROTEANTM IEF cell (Bio-Rad). 300 mg protein were
prepared in 100 ml IEF buffer (8 M urea, 2% CHAPS, 140 mM 2-
ME and 0.2% ampholyte) and incubated at 37uC for 30 min.
Protein samples were loaded onto a ReadyStripTM IPG Strip
Figure 7. Intracellular distributions of TG2 and RAP1GDS1 inmitochondria, ER, MAM and cytosol. H: homogenate; Mc: crudemitochondria; ER; MAM: mitochondria-associated membrane; C: cytosol.Ten mg of protein components of subcellular fractions prepared fromJurkat Tet-On cells were loaded on 10% SDS-PAGE and transferred toPVDF membrane for standard western blotting. The presence of TG2and RAP1GDS1 were shown using specific monoclonal antibodies.Marker proteins indicate mitochondria (VDAC), ER (IP3R3), MAM (Sigma-1R) and cytosol (b-tubulin).doi:10.1371/journal.pone.0081516.g007
Figure 8. Proposed mechanism through which the crosslinkingactivity of TG2 might amplify Ca2+ signals in the cell. Increases inintracellular Ca2+ concentrations trigger the crosslinking activity of TG2.TG2 crosslinks RAP1GDS1, which in turn facilitates the exchange of GDPto GTP on its target GTPase protein. This small GTPase initiates a not yetcharacterized signalling pathway, which enhances Ca2+ release from theER and the consequent Ca2+ uptake of the mitochondria. High amountsof mitochondrial Ca2+ sensitize for apoptosis, while physiologicalamounts enhance mitochondrial ATP production.doi:10.1371/journal.pone.0081516.g008
Transglutaminase 2,Apoptosis,and Ca2+Homeostatis
PLOS ONE | www.plosone.org 12 December 2013 | Volume 8 | Issue 12 | e81516
(pH 3–10, 7 cm;Bio-Rad) by passive re-hydration for 16 hours.
Prior to the second dimension, the focused strips were equilibrated
in equilibration buffer I (6 M urea, 0.375 M Tris-HCl, pH 8.8,
2% SDS, 20% glycerol and 2% DTT) for 15 min. Then, the
focused strips were equilibrated in equilibration buffer II (6 M
urea, 0.375 M Tris-HCl, pH 8.8, 2% SDS, 20% glycerol and
2.5% iodoactamide) for 15 min. Finally, the equilibrated strips
were positioned and separated on 12.5% polyacrylamide gel.
Protein spots on the gel were detected by Coomassie Brilliant Blue
R-250 (CBR) staining. Protein spots analysis and identification
were carried out by using LC-MS/MS by the Instrument Center
of Chung Shan Medical University.
Immunoprecipitation of RAP1GDS116107 Tet-On wt TG2 Jurkat cells without treatment,
exposed to thapsigargin for 15 min or to doxocycline treatment
for 6 hours were harvested, and whole cell lysates were prepared
in RIPA buffer containing 50 mM Tris–HCl, pH 8.0, 137 mM
NaCl, 10% glycerol, 1% Nonidet P-40 (NP-40), 1 mM sodium
vanadate, 10 mM sodium pyrophosphate, 50 mM sodium
fluoride, 1 mM phenylmethylsulfonil fluoride, 10 mg/ml leu-
peptin, and 2 mg/ml aprotinin. Cell lysates were centrifuged,
precleared with protein A from Santa Cruz (20 ml) and the
isotype control antibody (1 mg), and following centrifugation
RAP1GDS1 was immunoprecipitated by anti-RAP1GDS1
antibodies (Antibodies online) and protein A sepharose (Santa
Cruz) as it is described in the Santa Cruz immunoprecipitation
protocol. Following Western blot analysis immunoprecipitated
RAP1GDS1 was tested with both anti-RAP1GDS1 and anti-
e(c-glutamyl) lysine isopeptide antibodies.
RNA interferenceRNAi was based on lentiviral delivery of shRNA. Lentiviral
particles were produced in HEK293T cells by co-transfection of
lentiviral vector containing the short hairpin RNA (shRNA)
against Rap1GDS1 (Sigma Aldrich) with lentiviral packaging
plasmids pMD2G, pRRE and pRSV/REV (Sigma Aldrich) using
Lipofectamin2000 (Invitrogen) according to the provider’s instruc-
tions. Empty vector (Sigma Aldrich) was used as a negative
control. Supernatant of the HEK293T cells was harvested at 48
and 54 h after transfection, which was purified by filtration
(Millipore) and concentrated on column (Millipore). The virus titer
has been determined by HIV-1 p24 Antigen ELISA kit
(Zeptometrix).
Transduction of Jurkat cellsJK-Tet-On wtTG2 cells were plated onto 6 well plates (56104
cells/well, in serum free RPMI media). Virus containing
HEK293T cell supernatants were added to the cells. On the
following day cells were cultured in RPMI medium supplemented
with 20% FBS. After two days of incubation cells were selected in
the presence of 5 mg/ml Puromycin. The amount of Puromycin
was determined by kill curve of Jurkat cells. Cells carrying the
constructs were validated with Western blot analysis.
Subcellular Fractionation of JK-Tet-On wtTG2 cellsSubcellular fractionation was performed as previously described
[44]. All fractionation steps were carried out at 4uC. Briefly, cells
(109) were harvested, washed by centrifugation at 200 g for 5 min
with PBS, resuspended in homogenization buffer (225 mM
mannitol, 75 mM sucrose, 30 mM Tris-HCl, pH 7.4, 0.1 mM
EGTA, and 1 mM PMSF) and gently disrupted by Dounce
homogenisation. The homogenate was centrifuged twice at 600 g
for 5 min to remove nuclei and unbroken cells, and then the
supernatant was centrifuged at 10,300 g for 10 min to pellet
crude mitochondria. The resultant supernatant was centrifuged
at 15,000 g for 30 min, and then to pellet the ER fraction the
supernatant was centrifuged at 100,000 g for 90 min (70-Ti
rotor, Beckman). The crude mitochondrial fraction, resus-
pended in isolation buffer (250 mM mannitol, 5 mM HEPES,
pH 7.4 and 0.5 mM EGTA), was subjected to Percoll gradient
centrifugation (Percoll medium: 225 mM mannitol, 25 mM
HEPES pH 7.4, 1 mM EGTA and 30% vol/vol Percoll) in a
10-ml polycarbonate ultracentrifuge tube. After centrifugation
at 95,000 g for 30 min (SW40 rotor), the mitochondria-
associated membrane fraction containing the structural contacts
between mitochondria and ER, was retrieved as a diffuse white
band located approximately 1/3 down the tube. MAMs were
diluted in isolation buffer and centrifuged at 6,300 g for 10 min.
To pellet the MAMs fraction, the supernatant was centrifuged at
100,000 g for 90 min (70-Ti rotor, Beckman). To check the
quality of the preparation 10 mg of proteins, quantified using the
Bradford assay (Bio-Rad Laboratories), were separated by SDS-
PAGE and transferred to PVDF membrane for standard
western blotting.We used different markers for the fractions
obtained:b-tubulin as a general cytosolic marker, type 3 IP3R
(IP3R3) as a marker for ER, Sigma-1 receptor (Sigma-1R) as a
MAMs marker, voltage-dependent anion channel (VDAC) as a
mitochondrial marker. The close apposition between ER and
mitochondrial membranes at MAMs explained the presence of
both VDAC in these microdomains.
AntibodiesAntibodies were purchased from the following sources and used
at the indicated dilutions: RAP1GDS1 (1:500) from Santa Cruz,
TG2 (1:500) from Thermo Scientific, anti-e(c-glutamyl) lysine
isopeptide (1:500) from Covalab, b–tubulin (1:3000), Hsp60
(1:1000) and Sigma-1R (1:1000) from Sigma-Aldrich; IP3R3
(1:300) from BD Biosciences; VDAC (1:5000) from Abcam; b-
actin (1:1000) from Merck Millipore. Isotype matched, horseradish
peroxidase conjugated secondary antibodies (Santa Cruz) were
used, followed by detection by chemiluminescence (SuperSignal
West Pico Chemiluminscent Substrate).
Statistical analysisStatistical analyses for detection of significant differences
between the control and experimental groups were carried out
by using the one-way analysis of Variance (one-way ANOVA) with
the help of Prism 5.0 (GraphPad Software). A P-value of ,0.05
was considered to be significant.
Acknowledgments
We thank Dr. Shao-Hsuan Kao, ProfessorAndras Spat, Ya-Fan Liao,
Meng-Chic Chen, Ming-Shiou Jan, Yuan-yen Chang and Edit Komoczy
for technical assistance and expert experience consult.
Author Contributions
Conceived and designed the experiments: ZS GJT. Performed the majority
of the experiments and interpreted the data: YFH. Designed the sub-
cloning of Jurkat cells and performed the apoptosis related experiments:
GYL YJL. Carried out the proteome analysis: JJY. Performed the
knockdown experiments: KS. Performed the immunoprecipitation exper-
iments and designed the figure: ZS. Identified the intracellular localization
of TG2 and RAP1GDS1: AB PP. Demonstrated that TG2 has no direct
role in the mitochondrial Ca2+ uptake: LT. Designed and analyzed the
research: GJT ZS. Analyzed the data: ZS GJT. Wrote the manuscript:
YFH ZS GJT.
Transglutaminase 2,Apoptosis,and Ca2+Homeostatis
PLOS ONE | www.plosone.org 13 December 2013 | Volume 8 | Issue 12 | e81516
References
1. Folk JE, Chung SI (1985) Transglutaminases. Methods Enzymol 113: 358–375.
2. Fesus L, Piacentini M (2002) Transglutaminase 2: an enigmatic enzyme withdiverse functions. Trends Biochem Sci 27: 534–539.
3. Rodolfo C, Mormone E, Matarrese P, Ciccosanti F, Farrace MG, et al. (2004)Tissue transglutaminase is a multifunctional BH3-only protein. J Biol Chem 279:
54783–54792.
4. Kerr JF, Wyllie AH, Currie AR (1972) Apoptosis: a basic biologicalphenomenon with wide-ranging implications in tissue kinetics. Br J Cancer
26: 239–257.5. Vaux DL (2011) Apoptogenic factors released from mitochondria. Biochem
Biophys Acta 1813: 546–550.
6. Rizzuto R, Pinton P, Carrington W, Fay FS, Fogarty KE, et al. (1998) Closecontacts with the endoplasmic reticulum as determinants of mitochondrial Ca2+responses. Science 280: 1763–1766.
7. Pinton P, Giorgi C, Siviero R, Zecchini E, Rizzuto R (2008) Calcium and
apoptosis: ER-mitochondria Ca2+ transfer in the control of apoptosis. Oncogene27: 6407–6418.
8. Szalai G, Krishnamurthy R, Hajnoczky G (1999) Apoptosis driven by IP(3)-
linked mitochondrial calcium signals. EMBO J 18: 6349–6361.9. Pinton P, Ferrari D, Rapizzi E, Di Virgilio F, Pozzan T, et al. (2001) The Ca2+
concentration of the endoplasmic reticulum is a key determinant of ceramide-induced apoptosis: significance for the molecular mechanism of Bcl-2 action.
EMBO J 20: 2690–2701.
10. Mendes CC, Gomes DA, Thompson M, Souto NC, Goes TS, et al. (2005) Thetype III inositol 1,4,5-trisphosphate receptor preferentially transmits apoptotic
Ca2+ signals into mitochondria. J Biol Chem 280: 40892–40900.11. Khan AA, Soloski MJ, Sharp AH, Schilling G, Sabatini DM, et al. (1996)
Lymphocyte apoptosis: mediation by increased type 3 inositol 1,4,5-trispho-sphate receptor. Science 273: 503–507.
12. Fesus L, Szondy Z (2005) Transglutaminase 2 in the balance of cell death and
survival. FEBS Lett 579: 3297–3302.13. Chhabra A, Verma A, Mehta K (2009) Tissue transglutaminase promotes or
suppresses tumors depending on cell context. Anticancer Res 29: 1909–1919.14. Szondy Z, Molnar P, Nemes Z, Boyiadzis M, Kedei N, et al. (1997) Differential
expression of tissue transglutaminase during in vivo apoptosis of thymocytes
induced via distinct signalling pathways. FEBS Lett 404: 307–313.15. Garabuczi E, Kiss B, Felszeghy S, Tsay GJ, Fesus L, et al. (2013) Retinoids
produced by macrophages engulfing apoptotic cells contribute to the appearanceof transglutaminase 2 in apoptotic thymocytes. Amino Acids 44: 235–244.
16. Amendola A, Gougeon ML, Poccia F, Bondurand A, Fesus L, et al. (1996)Induction of ‘‘tissue’’ transglutaminase in HIV pathogenesis: evidence for high
rate of apoptosis of CD4+ T lymphocytes and accessory cells in lymphoid tissues.
Proc Natl Acad Sci USA 93: 11057–11062.17. Oliverio S, Amendola A, Di Sano F, Farrace MG, Fesus L, et al. (1997) Tissue
transglutaminase-dependent posttranslational modification of the retinoblastomagene product in promonocytic cells undergoing apoptosis. Mol Cell Biol 17:
6040–6048.
18. Mishra S, Murphy LJ (2006) The p53 oncoprotein is a substrate for tissuetransglutaminase kinase activity. Biochem Biophys Res Commun 339: 726–730.
19. Hutchinson JP, Rittinger K, Eccleston JF (2000) Purification and characteriza-tion of guanine nucleotide dissociation stimulator protein. Methods Enzymol
325: 71–82.20. Lee KN, Arnold SA, Birckbichler PJ, Patterson MK, Fraij BM, et al. (1993) Site-
directed mutagenesis of human tissue transglutaminase: Cys-277 is essential for
transglutaminase activity but not for GTPase activity. Biochim Biophys Acta1202: 1–6.
21. Wyllie AH (1980) Glucocorticoid-induced thymocyte apoptosis is associated withendogenous endonuclease activation. Nature 284: 555–556.
22. Hoth M, Fanger CM, Lewis RS (1997) Mitochondrial regulation of store-
operated calcium signaling in T lymphocytes. J Cell Biol 137: 633–648.23. Rogers TB, Inesi G, Wade R, Lederer WJ (1995) Use of thapsigargin to study
Ca2+ homeostasis in cardiac cells. Biosci Rep 15: 341–349.
24. Taylor CW, Dale P (2012) Intracellular Ca(2+) channels - a growing community.
Mol Cell Endocrinol 353: 21–28.25. Boyer JL, Downes CP, Harden TK (1989) Kinetics of activation of
phospholipase C by P2Y purinergic receptor agonists and guanine nucleotides.J Biol Chem 264:884–890.
26. Palade P, Dettbarn C, Alderson B, Volpe P (1989) Pharmacologic differentiation
between inositol-1,4,5-trisphosphate-induced Ca2+ release and Ca2+- orcaffeine-induced Ca2+ release from intracellular membrane systems. Mol
Pharmacol 36: 673–680.27. Magnier C, Bredoux R, Kovacs T, Quarck R, Papp B, et al. (1994) Correlated
expression of the 97 kDa sarcoendoplasmic reticulum Ca(2+)-ATPase and
Rap1B in platelets and various cell lines. Biochem J 297: 343–350.28. Holz GG (2004) Epac: A new cAMP-binding protein in support of glucagon-like
peptide-1 receptor-mediated signal transduction in the pancreatic b-Cell.Diabetes 53: 5–13.
29. Schmidt M, Evellin S, Weernink PA, von Dorp F, Rehmann H, et al. (2001) Anew phospholipase-C-calcium signalling pathway mediated by cyclic AMP and a
Rap GTPase. Nat Cell Biol 3: 1020–1024.
30. Begg GE, Carrington L, Stokes PH, Matthews JM, Wouters MA, et al. (2006)Mechanism of allosteric regulation of transglutaminase 2 by GTP. Proc Natl
Acad Sci USA 103: 19683–19688.31. Csordas G, Renken C, Varnai P, Walter L, Weaver D, et al. (2006) Structural
and functional features and significance of the physical linkage between ER and
mitochondria. J Cell Biol 174: 915–921.32. Patergnani S, Suski JM, Agnoletto C, Bononi A, Bonora M, et al. (2011)
Calcium signaling around Mitochondria Associated Membranes (MAMs). CellCommun Signal 9: 19.
33. Joseph SK, Hajnoczky G (2007) IP3 receptors in cell survival and apoptosis:Ca2+ release and beyond. Apoptosis 12: 951–968.
34. Melino G, Annicchiarico-Petruzzelli M, Piredda L, Candi E, Gentile V, et al.
(1994) Tissue transglutaminase and apoptosis: sense and antisense transfectionstudies with human neuroblastoma cells. Mol Cell Biol 14: 6584–6596.
35. Flourakis M, Van Coppenolle F, Lehen’kyi V, Beck B, Skryma R, et al. (2006)Passive calcium leak via translocon is a first step for iPLA2-pathway regulated
store operated channels activation. FASEB J 20: E409–416.
36. Singh US, Pan J, Kao YL, Joshi S, Young KL, et al. (2003) Tissuetransglutaminase mediates activation of RhoA and MAP kinase pathways
during retinoic acid-induced neuronal differentiation of SH-SY5Y cells. J BiolChem 278: 391–399.
37. Yi SJ, Groffen J, Heisterkamp N (2009) Transglutaminase 2 regulates theGTPase-activating activity of Bcr. J Biol Chem 284: 35645–35651.
38. Kiraly R, Demeny M, Fesus L (2011) Protein transamidation by transgluta-
minase 2 in cells: a disputed Ca2+-dependent action of a multifunctional protein.FEBS J 278:4717–4739.
39. Szondy Z, Mastroberardino PG, Varadi J, Farrace MG, Nagy N, et al. (2006)Tissue transglutaminase (TG2) protects cardiomyocytes against ischemia/
reperfusion injury by regulating ATP synthesis. Cell Death Differ 13: 1827–
1829.40. Bernassola F, Federici M, Corazzari M, Terrinoni A, Hribal ML, et al. (2002)
Role of transglutaminase 2 in glucose tolerance: knockout mice studies and aputative mutation in a MODY patient. FASEB J 16: 1371–1378.
41. Maechler P, Wollheim CB (2001) Mitochondrial function in normal and diabeticbeta-cells. Nature 414: 807–812.
42. D’Eletto M, Farrace MG, Falasca L, Reali V, Oliverio S, et al. (2009)
Transglutaminase 2 is involved in autophagosome maturation. Autophagy 8:1145–1154.
43. Smaili SS, Hsu YT, Carvalho AC, Rosenstock TR, Sharpe JC, et al. (2003)Mitochondria, calcium and pro-apoptotic proteins as mediators in cell death
signaling. Braz J Med Biol Res 36: 183–190.
44. Wieckowski MR, Giorgi C, Lebiedzinska M, Duszynski J, Pinton P (2009)Isolation of mitochondria-associated membranes and mitochondria from animal
tissues and cells. Naure Protoc 4: 1582–1590.
Transglutaminase 2,Apoptosis,and Ca2+Homeostatis
PLOS ONE | www.plosone.org 14 December 2013 | Volume 8 | Issue 12 | e81516