Embed Size (px)
Citation preview
SEMIANNUAL REPORTUSAA PRECIOUS METALS AND MINERALS FUNDFUND SHARES (USAGX) ■ INSTITUTIONAL SHARES (UIPMX)■ ADVISER SHARES (UPMMX)
NOVEMBER 30, 2017
TABLE OF CONTENTS
This report is for the information of the shareholders and others who have received a copy of thecurrently effective prospectus of the Fund, managed by USAA Asset Management Company. It maybe used as sales literature only when preceded or accompanied by a current prospectus, whichprovides further details about the Fund.
©2018, USAA. All rights reserved.
Fund Objective 1
Investment Overview 2
Financial Information
Portfolio of Investments 4
Notes to Portfolio of Investments 8
Financial Statements 10
Notes to Financial Statements 13
Expense Example 31
Fund Objective | 1
FUND OBJECTIVE
The USAA Precious Metals and Minerals Fund (the Fund) seekslong-term capital appreciation and to protect the purchasing power ofyour capital against inflation.
Types of Investments
The Fund normally invests at least 80% of its assets in equity securities ofdomestic and foreign companies (including those located in emerging markets)principally engaged in the exploration, mining, or processing of gold andother precious metals and minerals, such as platinum, silver, and diamonds.This 80% policy may be changed upon at least 60 days’ written notice toshareholders.
IRA DISTRIBUTION WITHHOLDING DISCLOSUREWe generally must withhold federal income tax at a rate of 10% of the taxable portionof your distribution and, if you live in a state that requires state income tax withholding,at your state’s tax rate. However, you may elect not to have withholding apply or to haveincome tax withheld at a higher rate. Any withholding election that you make will applyto any subsequent distribution unless and until you change or revoke the election. If youwish to make a withholding election or change or revoke a prior withholding election,call (800) 531-USAA (8722) or (210) 531-8722.If you do not have a withholding election in place by the date of a distribution, federalincome tax will be withheld from the taxable portion of your distribution at a rateof 10%. If you must pay estimated taxes, you may be subject to estimated tax penaltiesif your estimated tax payments are not sufficient and sufficient tax is not withheldfrom your distribution.For more specific information, please consult your tax adviser.
2 | USAA Precious Metals and Minerals Fund
INVESTMENT OVERVIEW
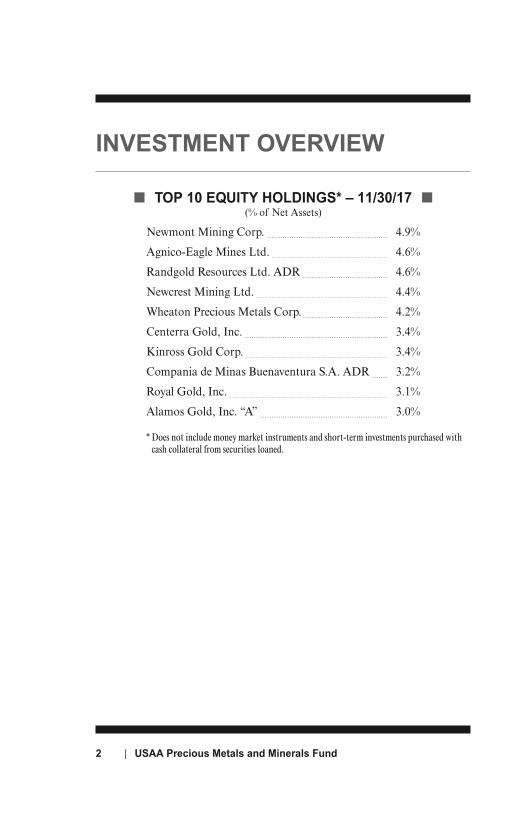
■ TOP 10 EQUITY HOLDINGS* – 11/30/17 ■(% of Net Assets)
Newmont Mining Corp. - - - - - - - - - - - - - - - - - - - - - - - - - - - - - - - - - - - - - - - - - - - - - - - - - - - - - -
4.9%
Agnico-Eagle Mines Ltd. - - - - - - - - - - - - - - - - - - - - - - - - - - - - - - - - - - - - - - - - - - - - - - - - - - - -
4.6%
Randgold Resources Ltd. ADR - - - - - - - - - - - - - - - - - - - - - - - - - - - - - - - - - - - - - -
4.6%
Newcrest Mining Ltd. - - - - - - - - - - - - - - - - - - - - - - - - - - - - - - - - - - - - - - - - - - - - - - - - - - - - - - - - - - -
4.4%
Wheaton Precious Metals Corp. - - - - - - - - - - - - - - - - - - - - - - - - - - - - - - - - - - - - - -
4.2%
Centerra Gold, Inc. - - - - - - - - - - - - - - - - - - - - - - - - - - - - - - - - - - - - - - - - - - - - - - - - - - - - - - - - - - - - - - - -
3.4%
Kinross Gold Corp. - - - - - - - - - - - - - - - - - - - - - - - - - - - - - - - - - - - - - - - - - - - - - - - - - - - - - - - - - - - - - - - -
3.4%
Compania de Minas Buenaventura S.A. ADR - - - - - - -
3.2%
Royal Gold, Inc. - - - - - - - - - - - - - - - - - - - - - - - - - - - - - - - - - - - - - - - - - - - - - - - - - - - - - - - - - - - - - - - - - - - - - - -
3.1%
Alamos Gold, Inc. “A” - - - - - - - - - - - - - - - - - - - - - - - - - - - - - - - - - - - - - - - - - - - - - - - - - - - - - - - - -
3.0%
* Does not include money market instruments and short-term investments purchased withcash collateral from securities loaned.
Investment Overview | 3
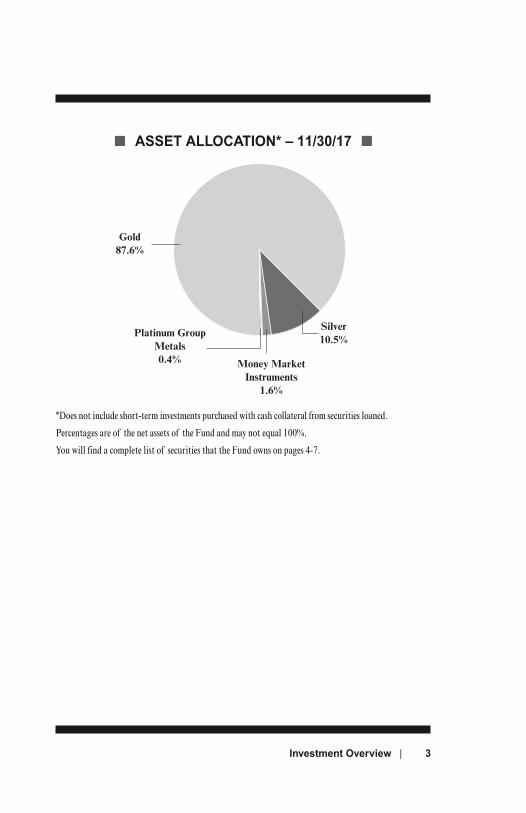
■ ASSET ALLOCATION* – 11/30/17 ■
Money MarketInstruments
1.6%
Gold87.6%
Silver10.5%
Platinum GroupMetals0.4%
*Does not include short-term investments purchased with cash collateral from securities loaned.
Percentages are of the net assets of the Fund and may not equal 100%.
You will find a complete list of securities that the Fund owns on pages 4-7.
4 | USAA Precious Metals and Minerals Fund
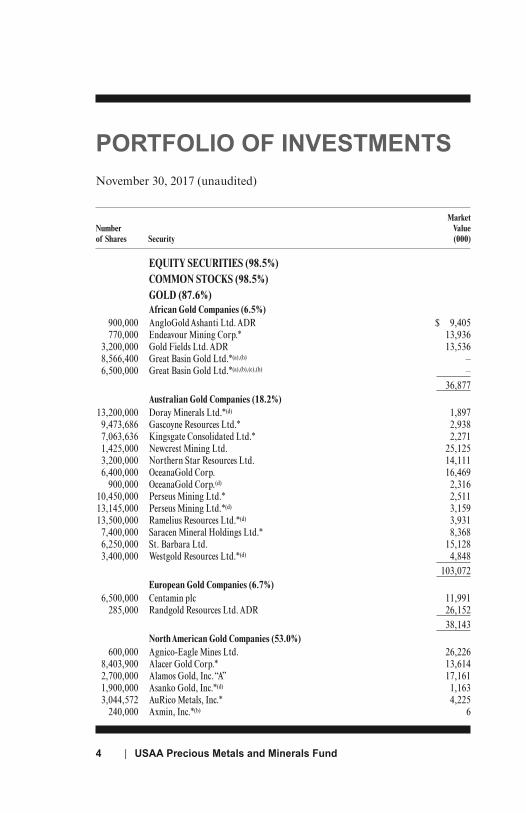
PORTFOLIO OF INVESTMENTSNovember 30, 2017 (unaudited)
MarketNumber Valueof Shares Security (000)
EQUITY SECURITIES (98.5%)COMMON STOCKS (98.5%)GOLD (87.6%)African Gold Companies (6.5%)
900,000 AngloGold Ashanti Ltd. ADR $ 9,405 770,000 Endeavour Mining Corp.* 13,936 3,200,000 Gold Fields Ltd. ADR 13,536 8,566,400 Great Basin Gold Ltd.*(a),(h) – 6,500,000 Great Basin Gold Ltd.*(a),(b),(c),(h) – 36,877
Australian Gold Companies (18.2%)13,200,000 Doray Minerals Ltd.*(d) 1,897 9,473,686 Gascoyne Resources Ltd.* 2,938 7,063,636 Kingsgate Consolidated Ltd.* 2,271 1,425,000 Newcrest Mining Ltd. 25,125 3,200,000 Northern Star Resources Ltd. 14,111 6,400,000 OceanaGold Corp. 16,469 900,000 OceanaGold Corp.(d) 2,31610,450,000 Perseus Mining Ltd.* 2,51113,145,000 Perseus Mining Ltd.*(d) 3,15913,500,000 Ramelius Resources Ltd.*(d) 3,931 7,400,000 Saracen Mineral Holdings Ltd.* 8,368 6,250,000 St. Barbara Ltd. 15,128 3,400,000 Westgold Resources Ltd.*(d) 4,848 103,072
European Gold Companies (6.7%) 6,500,000 Centamin plc 11,991 285,000 Randgold Resources Ltd. ADR 26,152 38,143
North American Gold Companies (53.0%) 600,000 Agnico-Eagle Mines Ltd. 26,226 8,403,900 Alacer Gold Corp.* 13,614 2,700,000 Alamos Gold, Inc.“A” 17,161 1,900,000 Asanko Gold, Inc.*(d) 1,163 3,044,572 AuRico Metals, Inc.* 4,225 240,000 Axmin, Inc.*(b) 6
Portfolio of Investments | 5
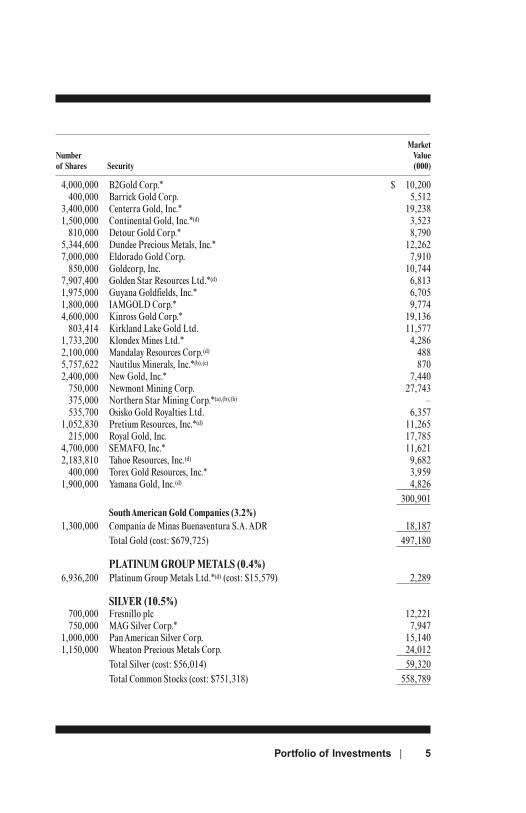
MarketNumber Valueof Shares Security (000)
4,000,000 B2Gold Corp.* $ 10,200 400,000 Barrick Gold Corp. 5,512 3,400,000 Centerra Gold, Inc.* 19,238 1,500,000 Continental Gold, Inc.*(d) 3,523 810,000 Detour Gold Corp.* 8,790 5,344,600 Dundee Precious Metals, Inc.* 12,262 7,000,000 Eldorado Gold Corp. 7,910 850,000 Goldcorp, Inc. 10,744 7,907,400 Golden Star Resources Ltd.*(d) 6,813 1,975,000 Guyana Goldfields, Inc.* 6,705 1,800,000 IAMGOLD Corp.* 9,774 4,600,000 Kinross Gold Corp.* 19,136 803,414 Kirkland Lake Gold Ltd. 11,577 1,733,200 Klondex Mines Ltd.* 4,286 2,100,000 Mandalay Resources Corp.(d) 488 5,757,622 Nautilus Minerals, Inc.*(b),(c) 870 2,400,000 New Gold, Inc.* 7,440 750,000 Newmont Mining Corp. 27,743 375,000 Northern Star Mining Corp.*(a),(b),(h) – 535,700 Osisko Gold Royalties Ltd. 6,357 1,052,830 Pretium Resources, Inc.*(d) 11,265 215,000 Royal Gold, Inc. 17,785 4,700,000 SEMAFO, Inc.* 11,621 2,183,810 Tahoe Resources, Inc.(d) 9,682 400,000 Torex Gold Resources, Inc.* 3,959 1,900,000 Yamana Gold, Inc.(d) 4,826 300,901
South American Gold Companies (3.2%) 1,300,000 Compania de Minas Buenaventura S.A. ADR 18,187 Total Gold (cost: $679,725) 497,180
PLATINUM GROUP METALS (0.4%) 6,936,200 Platinum Group Metals Ltd.*(d) (cost: $15,579) 2,289
SILVER (10.5%) 700,000 Fresnillo plc 12,221 750,000 MAG Silver Corp.* 7,947 1,000,000 Pan American Silver Corp. 15,140 1,150,000 Wheaton Precious Metals Corp. 24,012 Total Silver (cost: $56,014) 59,320 Total Common Stocks (cost: $751,318) 558,789
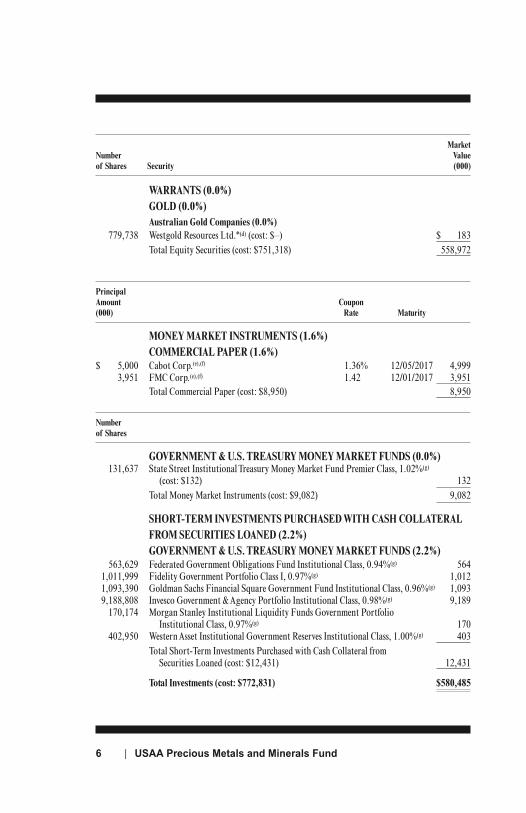
WARRANTS (0.0%)GOLD (0.0%)Australian Gold Companies (0.0%)
779,738 Westgold Resources Ltd.*(d) (cost: $–) $ 183 Total Equity Securities (cost: $751,318) 558,972
Principal Amount Coupon (000) Rate Maturity
MONEY MARKET INSTRUMENTS (1.6%)COMMERCIAL PAPER (1.6%)
$ 5,000 Cabot Corp.(e),(f) 1.36% 12/05/2017 4,999 3,951 FMC Corp.(e),(f) 1.42 12/01/2017 3,951 Total Commercial Paper (cost: $8,950) 8,950
Number of Shares
GOVERNMENT & U.S. TREASURY MONEY MARKET FUNDS (0.0%) 131,637 State Street Institutional Treasury Money Market Fund Premier Class, 1.02%(g)
(cost: $132) 132 Total Money Market Instruments (cost: $9,082) 9,082
SHORT-TERM INVESTMENTS PURCHASED WITH CASH COLLATERALFROM SECURITIES LOANED (2.2%)GOVERNMENT & U.S. TREASURY MONEY MARKET FUNDS (2.2%)
563,629 Federated Government Obligations Fund Institutional Class, 0.94%(g) 564 1,011,999 Fidelity Government Portfolio Class I, 0.97%(g) 1,012 1,093,390 Goldman Sachs Financial Square Government Fund Institutional Class, 0.96%(g) 1,093 9,188,808 Invesco Government & Agency Portfolio Institutional Class, 0.98%(g) 9,189 170,174 Morgan Stanley Institutional Liquidity Funds Government Portfolio Institutional Class, 0.97%(g) 170 402,950 Western Asset Institutional Government Reserves Institutional Class, 1.00%(g) 403 Total Short-Term Investments Purchased with Cash Collateral from Securities Loaned (cost: $12,431) 12,431
Total Investments (cost: $772,831) $580,485
MarketNumber Valueof Shares Security (000)
6 | USAA Precious Metals and Minerals Fund
Portfolio of Investments | 7
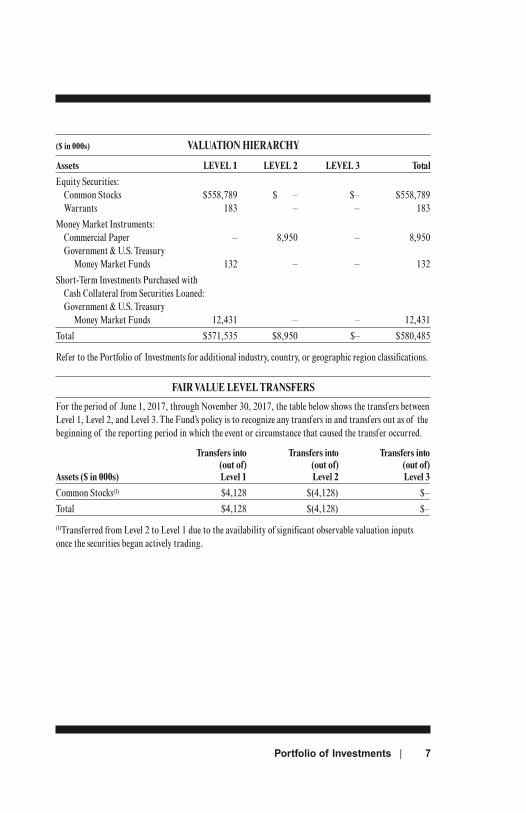
($ in 000s) VALUATION HIERARCHY
Assets LEVEL 1 LEVEL 2 LEVEL 3 Total
Equity Securities: Common Stocks $558,789 $ – $– $558,789 Warrants 183 – – 183
Money Market Instruments: Commercial Paper – 8,950 – 8,950 Government & U.S. Treasury Money Market Funds 132 – – 132
Short-Term Investments Purchased with Cash Collateral from Securities Loaned: Government & U.S. Treasury Money Market Funds 12,431 – – 12,431
Total $571,535 $8,950 $– $580,485
Refer to the Portfolio of Investments for additional industry, country, or geographic region classifications.
FAIR VALUE LEVEL TRANSFERS
For the period of June 1, 2017, through November 30, 2017, the table below shows the transfers betweenLevel 1, Level 2, and Level 3. The Fund’s policy is to recognize any transfers in and transfers out as of thebeginning of the reporting period in which the event or circumstance that caused the transfer occurred.
Transfers into Transfers into Transfers into (out of) (out of) (out of) Assets ($ in 000s) Level 1 Level 2 Level 3
Common Stocks(I) $4,128 $(4,128) $–
Total $4,128 $(4,128) $–
(I)Transferred from Level 2 to Level 1 due to the availability of significant observable valuation inputsonce the securities began actively trading.
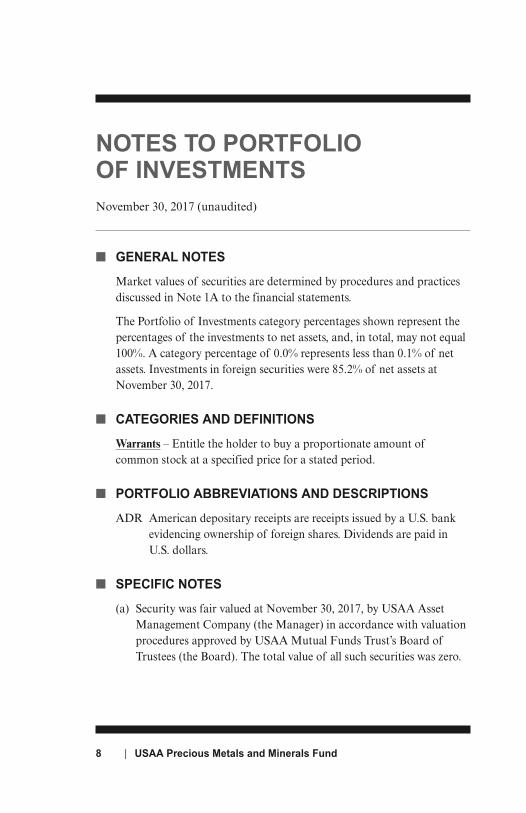
NOTES TO PORTFOLIOOF INVESTMENTSNovember 30, 2017 (unaudited)
8 | USAA Precious Metals and Minerals Fund
■ GENERAL NOTES
Market values of securities are determined by procedures and practicesdiscussed in Note 1A to the financial statements.
The Portfolio of Investments category percentages shown represent thepercentages of the investments to net assets, and, in total, may not equal100%. A category percentage of 0.0% represents less than 0.1% of netassets. Investments in foreign securities were 85.2% of net assets atNovember 30, 2017.
■ CATEGORIES AND DEFINITIONS
Warrants – Entitle the holder to buy a proportionate amount ofcommon stock at a specified price for a stated period.
■ PORTFOLIO ABBREVIATIONS AND DESCRIPTIONS
ADR American depositary receipts are receipts issued by a U.S. bankevidencing ownership of foreign shares. Dividends are paid inU.S. dollars.
■ SPECIFIC NOTES
(a) Security was fair valued at November 30, 2017, by USAA AssetManagement Company (the Manager) in accordance with valuationprocedures approved by USAA Mutual Funds Trust’s Board ofTrustees (the Board). The total value of all such securities was zero.
Notes to Portfolio of Investments | 9
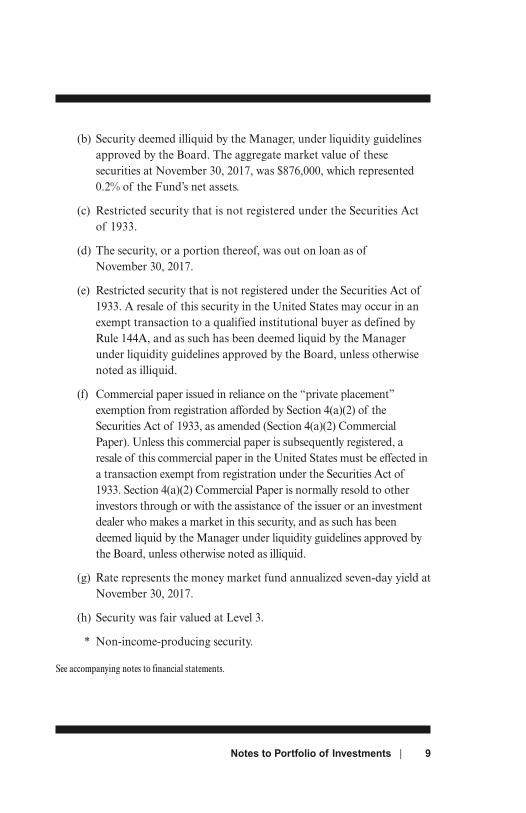
(b) Security deemed illiquid by the Manager, under liquidity guidelinesapproved by the Board. The aggregate market value of thesesecurities at November 30, 2017, was $876,000, which represented0.2% of the Fund’s net assets.
(c) Restricted security that is not registered under the Securities Actof 1933.
(d) The security, or a portion thereof, was out on loan as ofNovember 30, 2017.
(e) Restricted security that is not registered under the Securities Act of1933. A resale of this security in the United States may occur in anexempt transaction to a qualified institutional buyer as defined byRule 144A, and as such has been deemed liquid by the Managerunder liquidity guidelines approved by the Board, unless otherwisenoted as illiquid.
(f) Commercial paper issued in reliance on the “private placement”exemption from registration afforded by Section 4(a)(2) of theSecurities Act of 1933, as amended (Section 4(a)(2) CommercialPaper). Unless this commercial paper is subsequently registered, aresale of this commercial paper in the United States must be effected ina transaction exempt from registration under the Securities Act of1933. Section 4(a)(2) Commercial Paper is normally resold to otherinvestors through or with the assistance of the issuer or an investmentdealer who makes a market in this security, and as such has beendeemed liquid by the Manager under liquidity guidelines approved bythe Board, unless otherwise noted as illiquid.
(g) Rate represents the money market fund annualized seven-day yield atNovember 30, 2017.
(h) Security was fair valued at Level 3.
* Non-income-producing security.
See accompanying notes to financial statements.
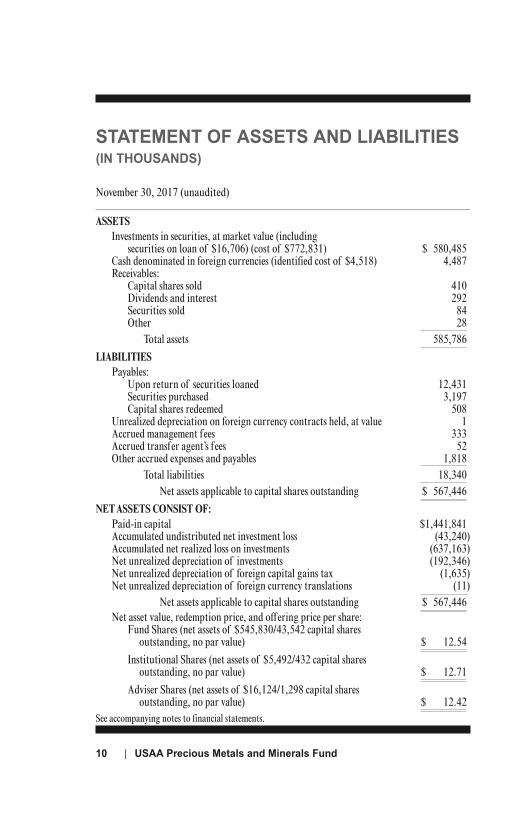
STATEMENT OF ASSETS AND LIABILITIES(IN THOUSANDS)
November 30, 2017 (unaudited)
10 | USAA Precious Metals and Minerals Fund
ASSETSInvestments in securities, at market value (including
securities on loan of $16,706) (cost of $772,831) $ 580,485Cash denominated in foreign currencies (identified cost of $4,518) 4,487Receivables: Capital shares sold 410 Dividends and interest 292 Securities sold 84 Other 28 Total assets 585,786
LIABILITIESPayables: Upon return of securities loaned 12,431 Securities purchased 3,197 Capital shares redeemed 508Unrealized depreciation on foreign currency contracts held, at value 1Accrued management fees 333Accrued transfer agent’s f ees 52Other accrued expenses and payables 1,818 Total liabilities 18,340 Net assets applicable to capital shares outstanding $ 567,446
NET ASSETS CONSIST OF:Paid-in capital $1,441,841Accumulated undistributed net investment loss (43,240)Accumulated net realized loss on investments (637,163)Net unrealized depreciation of investments (192,346)Net unrealized depreciation of foreign capital gains tax (1,635)Net unrealized depreciation of foreign currency translations (11) Net assets applicable to capital shares outstanding $ 567,446Net asset value, redemption price, and offering price per share: Fund Shares (net assets of $545,830/43,542 capital shares outstanding, no par value) $ 12.54
Institutional Shares (net assets of $5,492/432 capital shares outstanding, no par value) $ 12.71
Adviser Shares (net assets of $16,124/1,298 capital shares outstanding, no par value) $ 12.42
See accompanying notes to financial statements.
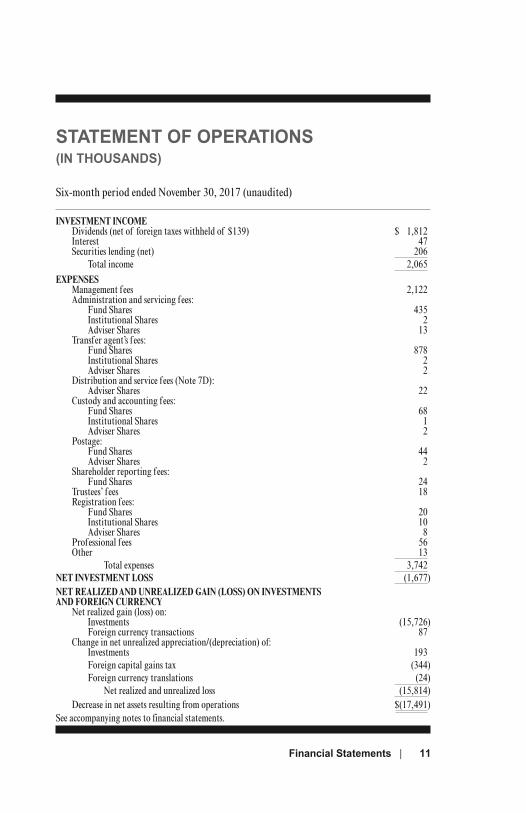
STATEMENT OF OPERATIONS(IN THOUSANDS)
Six-month period ended November 30, 2017 (unaudited)
Financial Statements | 11
INVESTMENT INCOMEDividends (net of foreign taxes withheld of $139) $ 1,812Interest 47Securities lending (net) 206
Total income 2,065EXPENSES
Management fees 2,122Administration and servicing fees: Fund Shares 435 Institutional Shares 2 Adviser Shares 13Transfer agent’s f ees: Fund Shares 878 Institutional Shares 2 Adviser Shares 2Distribution and service fees (Note 7D): Adviser Shares 22Custody and accounting fees: Fund Shares 68 Institutional Shares 1 Adviser Shares 2Postage: Fund Shares 44 Adviser Shares 2Shareholder reporting fees: Fund Shares 24Trustees’ fees 18Registration fees: Fund Shares 20 Institutional Shares 10 Adviser Shares 8Professional f ees 56Other 13
Total expenses 3,742NET INVESTMENT LOSS (1,677)NET REALIZED AND UNREALIZED GAIN (LOSS) ON INVESTMENTS AND FOREIGN CURRENCY
Net realized gain (loss) on: Investments (15,726) Foreign currency transactions 87Change in net unrealized appreciation/(depreciation) of: Investments 193
Foreign capital gains tax (344) Foreign currency translations (24) Net realized and unrealized loss (15,814)
Decrease in net assets resulting from operations $(17,491)See accompanying notes to financial statements.
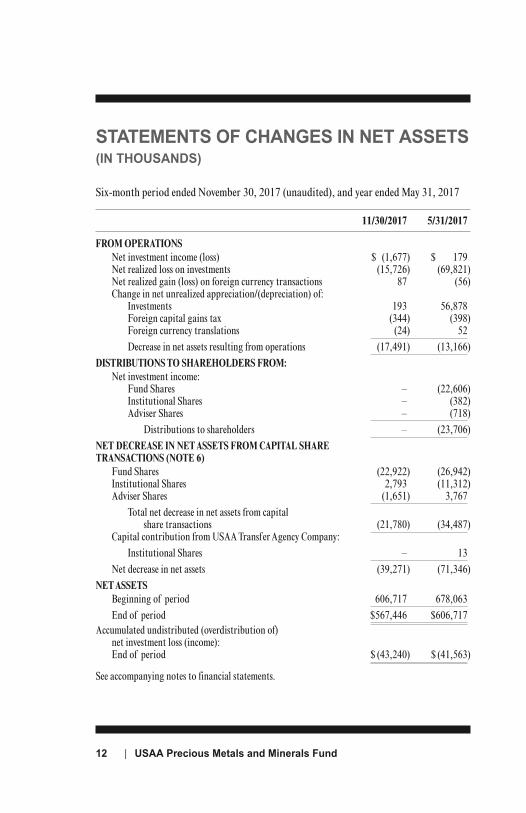
STATEMENTS OF CHANGES IN NET ASSETS(IN THOUSANDS)
Six-month period ended November 30, 2017 (unaudited), and year ended May 31, 2017
12 | USAA Precious Metals and Minerals Fund
11/30/2017 5/31/2017
FROM OPERATIONSNet investment income (loss) $ (1,677) $ 179Net realized loss on investments (15,726) (69,821)Net realized gain (loss) on foreign currency transactions 87 (56)Change in net unrealized appreciation/(depreciation) of: Investments 193 56,878 Foreign capital gains tax (344) (398) Foreign currency translations (24) 52 Decrease in net assets resulting from operations (17,491) (13,166)
DISTRIBUTIONS TO SHAREHOLDERS FROM:Net investment income: Fund Shares – (22,606) Institutional Shares – (382) Adviser Shares – (718) Distributions to shareholders – (23,706)
NET DECREASE IN NET ASSETS FROM CAPITAL SHARE TRANSACTIONS (NOTE 6)
Fund Shares (22,922) (26,942)Institutional Shares 2,793 (11,312)Adviser Shares (1,651) 3,767 Total net decrease in net assets from capital share transactions (21,780) (34,487)Capital contribution from USAA Transfer Agency Company: Institutional Shares – 13Net decrease in net assets (39,271) (71,346)
NET ASSETSBeginning of period 606,717 678,063End of period $567,446 $606,717
Accumulated undistributed (overdistribution of)net investment loss (income):End of period $ (43,240) $ (41,563)
See accompanying notes to financial statements.
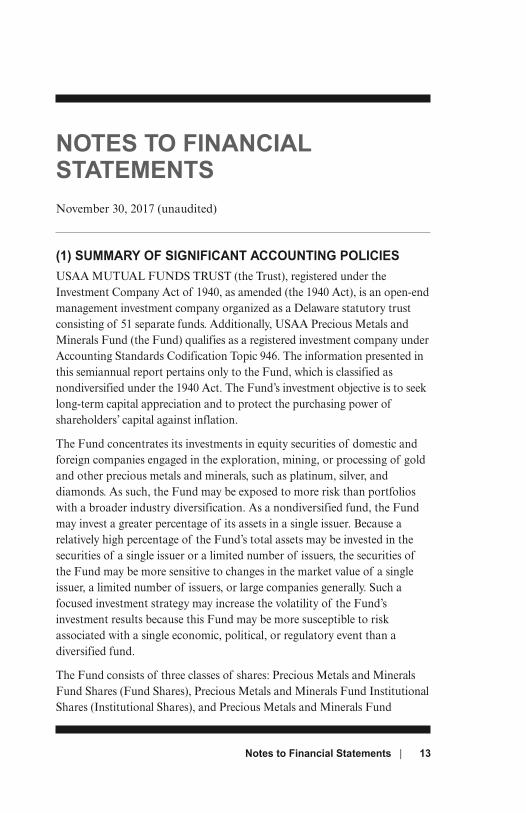
NOTES TO FINANCIAL STATEMENTSNovember 30, 2017 (unaudited)
Notes to Financial Statements | 13
(1) SUMMARY OF SIGNIFICANT ACCOUNTING POLICIESUSAA MUTUAL FUNDS TRUST (the Trust), registered under theInvestment Company Act of 1940, as amended (the 1940 Act), is an open-endmanagement investment company organized as a Delaware statutory trustconsisting of 51 separate funds. Additionally, USAA Precious Metals andMinerals Fund (the Fund) qualifies as a registered investment company underAccounting Standards Codification Topic 946. The information presented inthis semiannual report pertains only to the Fund, which is classified asnondiversified under the 1940 Act. The Fund’s investment objective is to seeklong-term capital appreciation and to protect the purchasing power ofshareholders’ capital against inflation.
The Fund concentrates its investments in equity securities of domestic andforeign companies engaged in the exploration, mining, or processing of goldand other precious metals and minerals, such as platinum, silver, anddiamonds. As such, the Fund may be exposed to more risk than portfolioswith a broader industry diversification. As a nondiversified fund, the Fundmay invest a greater percentage of its assets in a single issuer. Because arelatively high percentage of the Fund’s total assets may be invested in thesecurities of a single issuer or a limited number of issuers, the securities ofthe Fund may be more sensitive to changes in the market value of a singleissuer, a limited number of issuers, or large companies generally. Such afocused investment strategy may increase the volatility of the Fund’sinvestment results because this Fund may be more susceptible to riskassociated with a single economic, political, or regulatory event than adiversified fund.
The Fund consists of three classes of shares: Precious Metals and MineralsFund Shares (Fund Shares), Precious Metals and Minerals Fund InstitutionalShares (Institutional Shares), and Precious Metals and Minerals Fund
Adviser Shares (Adviser Shares). Each class of shares has equal rights toassets and earnings, except that each class bears certain class-related expensesspecific to the particular class. These expenses include administration andservicing fees, transfer agent fees, postage, shareholder reporting fees,distribution and service (12b-1) fees, and certain registration and custodianfees. Expenses not attributable to a specific class, income, and realized gainsor losses on investments are allocated to each class of shares based on eachclass’ relative net assets. Each class has exclusive voting rights on mattersrelated solely to that class and separate voting rights on matters that relate toall classes. The Institutional Shares are available for investment through aUSAA discretionary managed account program and certain advisoryprograms sponsored by financial intermediaries, such as brokerage firms,investment advisors, financial planners, third-party administrators, andinsurance companies. Institutional Shares also are available to institutionalinvestors, which include retirement plans, endowments, foundations, andbank trusts, as well as other persons or legal entities that the Fund mayapprove from time to time, or for purchase by a USAA fund participating ina fund-of-funds investment strategy (USAA fund-of-funds). The AdviserShares permit investors to purchase shares through financial intermediaries,including banks, broker-dealers, insurance companies, investment advisers,plan sponsors, and financial professionals that provide variousadministrative and distribution services.
A. Security valuation – The Trust’s Board of Trustees (the Board) hasestablished the Valuation Committee (the Committee), and subject toBoard oversight, the Committee administers and oversees the Fund’svaluation policies and procedures, which are approved by the Board.Among other things, these policies and procedures allow the Fund toutilize independent pricing services, quotations from securities dealers,and a wide variety of sources and information to establish and adjust thefair value of securities as events occur and circumstances warrant.
The Committee reports to the Board on a quarterly basis and makesrecommendations to the Board as to pricing methodologies and servicesused by the Fund and presents additional information to the Boardregarding application of the pricing and fair valuation policies andprocedures during the preceding quarter.
14 | USAA Precious Metals and Minerals Fund
The Committee meets as often as necessary to make pricing and fairvalue determinations. In addition, the Committee holds regular monthlymeetings to review prior actions taken by the Committee and USAAAsset Management Company (the Manager), an affiliate of the Fund.Among other things, these monthly meetings include a review andanalysis of backtesting reports, pricing service quotation comparisons,illiquid securities and fair value determinations, pricing movements, anddaily stale price monitoring.
The value of each security is determined (as of the close of trading onthe New York Stock Exchange (NYSE) on each business day the NYSEis open) as set forth below:
1. Equity securities, including exchange-traded funds (ETFs), except asotherwise noted, traded primarily on a domestic securities exchange orthe over-the-counter markets, are valued at the last sales price or officialclosing price on the exchange or primary market on which they trade.Securities traded primarily on foreign securities exchanges or marketsare valued at the last quoted sale price, or the most recently determinedofficial closing price calculated according to local market convention,available at the time the Fund is valued. If no last sale or official closingprice is reported or available, the average of the bid and ask pricesgenerally is used. Actively traded equity securities listed on a domesticexchange generally are categorized in Level 1 of the fair value hierarchy.Certain preferred and equity securities traded in inactive marketsgenerally are categorized in Level 2 of the fair value hierarchy.
2. Equity securities trading in various foreign markets may take placeon days when the NYSE is closed. Further, when the NYSE is open,the foreign markets may be closed. Therefore, the calculation of theFund’s net asset value (NAV) may not take place at the same time theprices of certain foreign securities held by the Fund are determined.In many cases, events affecting the values of foreign securities thatoccur between the time of their last quoted sale or official closingprice and the close of normal trading on the NYSE on a day theFund’s NAV is calculated will not need to be reflected in the value ofthe Fund’s foreign securities. However, the Manager will monitor for
Notes to Financial Statements | 15
events that would materially affect the value of the Fund’s foreignsecurities and the Committee will consider such available informationthat it deems relevant and will determine a fair value for the affectedforeign securities in accordance with valuation procedures. In addition,information from an external vendor or other sources may be used toadjust the foreign market closing prices of foreign equity securitiesto reflect what the Committee believes to be the fair value of thesecurities as of the close of the NYSE. Fair valuation of affectedforeign equity securities may occur frequently based on an assessmentthat events which occur on a fairly regular basis (such as U.S. marketmovements) are significant. Such securities are categorized in Level 2of the fair value hierarchy.
3. Investments in open-end investment companies, commingled, orother funds, other than ETFs, are valued at their NAV at the end ofeach business day and are categorized in Level 1 of the fair valuehierarchy.
4. Short-term debt securities with original or remaining maturities of60 days or less may be valued at amortized cost, provided thatamortized cost represents the fair value of such securities.
5. Repurchase agreements are valued at cost.
6. In the event that price quotations or valuations are not readilyavailable, are not reflective of market value, or a significant event hasbeen recognized in relation to a security or class of securities, thesecurities are valued in good faith by the Committee in accordancewith valuation procedures approved by the Board. The effect of fairvalue pricing is that securities may not be priced on the basis ofquotations from the primary market in which they are traded andthe actual price realized from the sale of a security may differmaterially from the fair value price. Valuing these securities at fairvalue is intended to cause the Fund’s NAV to be more reliable than itotherwise would be.
Fair value methods used by the Manager include, but are not limited to,obtaining market quotations from secondary pricing services, broker-dealers, other pricing services, or widely used quotation systems. General
16 | USAA Precious Metals and Minerals Fund
factors considered in determining the fair value of securities includefundamental analytical data, the nature and duration of any restrictionson disposition of the securities, evaluation of credit quality, and anevaluation of the forces that influenced the market in which the securitiesare purchased and sold.
B. Fair value measurements – Fair value is defined as the price that wouldbe received to sell an asset or paid to transfer a liability in an orderlytransaction between market participants at the measurement date. Thethree-level valuation hierarchy disclosed in the Portfolio of Investmentsis based upon the transparency of inputs to the valuation of an asset orliability as of the measurement date. The three levels are defined asfollows:
Level 1 – inputs to the valuation methodology are quoted prices(unadjusted) in active markets for identical securities.
Level 2 – inputs to the valuation methodology are other significantobservable inputs, including quoted prices for similar securities, inputsthat are observable for the securities, either directly or indirectly, andmarket-corroborated inputs such as market indexes.
Level 3 – inputs to the valuation methodology are unobservable andsignificant to the fair value measurement, including the Manager’s ownassumptions in determining the fair value.
The inputs or methodologies used for valuing securities are notnecessarily an indication of the risks associated with investing in thosesecurities.
C. Federal taxes – The Fund’s policy is to comply with the requirements ofthe Internal Revenue Code of 1986, as amended, applicable to regulatedinvestment companies and to distribute substantially all of its taxableincome and net capital gains, if any, to its shareholders. Therefore, nofederal income tax provision is required.
For the six-month period ended November 30, 2017, the Fund did notincur any income tax, interest, or penalties, and has recorded no liabilityfor net unrecognized tax benefits relating to uncertain income tax
Notes to Financial Statements | 17
positions. On an ongoing basis, the Manager will monitor the Fund’s taxbasis to determine if adjustments to this conclusion are necessary. Thestatute of limitations on the Fund’s tax return filings generally remainopen for the three preceding fiscal reporting year ends and remainsubject to examination by the Internal Revenue Service and state taxingauthorities.
D. Foreign taxation – Foreign income and capital gains on some foreignsecurities may be subject to foreign taxes, which are reflected as areduction to such income and realized gains. The Fund records a liabilitybased on unrealized gains to provide for potential foreign taxes payableupon the sale of these securities. Foreign taxes have been provided for inaccordance with the Fund’s understanding of the applicable countries’prevailing tax rules and rates.
E. Investments in securities – Securities transactions are accounted for onthe date the securities are purchased or sold (trade date). Gains or lossesfrom sales of investment securities are computed on the identified costbasis. Dividend income, less foreign taxes, if any, is recorded on the ex-dividend date. If the ex-dividend date has passed, certain dividends fromforeign securities are recorded upon notification. Interest income isrecorded daily on the accrual basis. Premiums and discounts on short-term securities are amortized on a straight-line basis over the life of therespective securities.
F. Foreign currency translations – The Fund’s assets may be invested in thesecurities of foreign issuers and may be traded in foreign currency. Sincethe Fund’s accounting records are maintained in U.S. dollars, foreigncurrency amounts are translated into U.S. dollars on the following bases:
1. Purchases and sales of securities, income, and expenses at theexchange rate obtained from an independent pricing service on therespective dates of such transactions.
2. Market value of securities, other assets, and liabilities at the exchangerate obtained from an independent pricing service on a daily basis.
The Fund does not isolate that portion of the results of operationsresulting from changes in foreign exchange rates on investments from the
18 | USAA Precious Metals and Minerals Fund
fluctuations arising from changes in market prices of securities held.Such fluctuations are included with the net realized and unrealized gainor loss from investments.
Separately, net realized foreign currency gains/losses may arise from salesof foreign currency, currency gains/losses realized between the trade andsettlement dates on security transactions, and from the differencebetween amounts of dividends, interest, and foreign withholding taxesrecorded on the Fund’s books and the U.S. dollar equivalent of theamounts received. At the end of the Fund’s fiscal year, net realizedforeign currency gains/losses are reclassified from accumulated netrealized gains/losses to accumulated undistributed net investment incomeon the Statement of Assets and Liabilities, as such amounts are treatedas ordinary income/loss for federal income tax purposes. Net unrealizedforeign currency exchange gains/losses arise from changes in the value ofassets and liabilities, other than investments in securities, resulting fromchanges in the exchange rate.
G. Expenses paid indirectly – Through arrangements with the Fund’scustodian and other banks utilized by the Fund for cash managementpurposes, realized credits, if any, generated from cash balances in theFund’s bank accounts may be used to directly reduce the Fund’sexpenses. For the six-month period ended November 30, 2017, therewere no custodian and other bank credits.
H. Redemption fees – Adviser Shares held in the Fund less than 60 days aresubject to a redemption fee equal to 1.00% of the proceeds of theredeemed or exchanged shares. All redemption fees paid will beaccounted for by the Fund as an addition to paid in capital. EffectiveOctober 1, 2017, the Adviser Shares no longer charge redemption fees.For the six-month period ended November 30, 2017, the Adviser Sharescharged redemption fees of less than $500.
I. Indemnifications– Under the Trust’s organizational documents, itsofficers and trustees are indemnified against certain liabilities arising outof the performance of their duties to the Trust. In addition, in the normalcourse of business, the Trust enters into contracts that contain a variety
Notes to Financial Statements | 19
of representations and warranties that provide general indemnifications.The Trust’s maximum exposure under these arrangements is unknown,as this would involve future claims that may be made against the Trustthat have not yet occurred. However, the Trust expects the risk of loss tobe remote.
J. Use of estimates – The preparation of financial statements in conformitywith U.S. generally accepted accounting principles requires managementto make estimates and assumptions that may affect the reported amountsin the financial statements.
(2) LINE OF CREDITThe Fund participates, along with other funds of the Trust and USAA ETFTrust (together, the Trusts), in a joint, short-term, revolving, committed loanagreement of $500 million with USAA Capital Corporation (CAPCO), anaffiliate of the Manager. The purpose of the agreement is to providetemporary or emergency cash needs, including redemption requests thatmight otherwise require the untimely disposition of securities. Subject toavailability (including usage of the facility by other funds of the Trusts), theFund may borrow from CAPCO an amount up to 5% of the Fund’s totalassets at an interest rate based on the London Interbank Offered Rate(LIBOR), plus 100.0 basis points.
The Trusts are also assessed facility fees by CAPCO in the amount of 13.0basis points of the amount of the committed loan agreement. Prior toSeptember 30, 2017, the maximum annual facility fee was 12.0 basis pointsof the amount of the committed loan agreement. The facility fees areallocated among the funds of the Trusts based on their respective average netassets for the period.
The Trusts may request an optional increase of the committed loanagreement from $500 million up to $750 million. If the Trusts increase thecommitted loan agreement, the assessed facility fee on the amount of theadditional commitment will be 14.0 basis points.
For the six-month period ended November 30, 2017, the Fund paid CAPCOfacility fees of $2,000, which represents 0.8% of the total fees paid to
20 | USAA Precious Metals and Minerals Fund
CAPCO by the funds of the Trusts. The Fund had no borrowings under thisagreement during the six-month period ended November 30, 2017.
(3) DISTRIBUTIONSThe tax basis of distributions and any accumulated undistributed netinvestment income will be determined as of the Fund’s tax year-end ofMay 31, 2018, in accordance with applicable federal tax law.
Distributions of net investment income and realized gains from securitytransactions not offset by capital losses are made annually in the succeedingfiscal year or as otherwise required to avoid the payment of federal income tax.
At May 31, 2017, the Fund had net capital loss carryforwards of$621,463,000, for federal income tax purposes as shown in the table below. Itis unlikely that the Board will authorize a distribution of capital gainsrealized in the future until the capital loss carryforwards have been used.Late year losses incurred after October 31, and within the taxable year aredeemed to arise on the first day of the Fund’s next taxable year. For theyear ended May 31, 2017, the Fund deferred to June 1, 2017, late yearlosses of $7,687,000.
Capital Loss Carryforwards Tax Character (No Expiration) Balance Short-Term $ 15,006,000 Long-Term 606,457,000 Total $621,463,000
(4) INVESTMENT TRANSACTIONSCost of purchases and proceeds from sales/maturities of securities, excludingshort-term securities, for the six-month period ended November 30, 2017,were $22,913,000 and $44,184,000, respectively.
As of November 30, 2017, the cost of securities, including short-termsecurities, for federal income tax purposes, was approximately the same asthe cost reported in the financial statements.
Notes to Financial Statements | 21
Gross unrealized appreciation and depreciation of investments as ofNovember 30, 2017, were $125,276,000 and $317,622,000, respectively,resulting in net unrealized depreciation of $192,346,000.
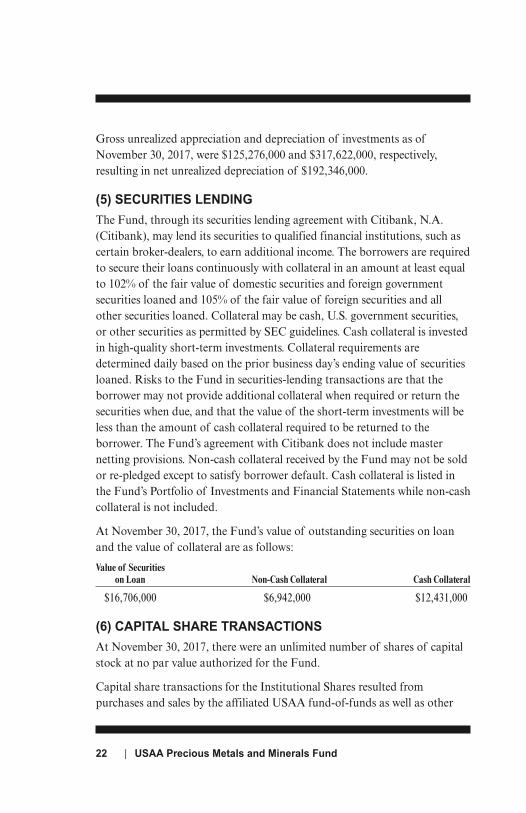
(5) SECURITIES LENDINGThe Fund, through its securities lending agreement with Citibank, N.A.(Citibank), may lend its securities to qualified financial institutions, such ascertain broker-dealers, to earn additional income. The borrowers are requiredto secure their loans continuously with collateral in an amount at least equalto 102% of the fair value of domestic securities and foreign governmentsecurities loaned and 105% of the fair value of foreign securities and allother securities loaned. Collateral may be cash, U.S. government securities,or other securities as permitted by SEC guidelines. Cash collateral is investedin high-quality short-term investments. Collateral requirements aredetermined daily based on the prior business day’s ending value of securitiesloaned. Risks to the Fund in securities-lending transactions are that theborrower may not provide additional collateral when required or return thesecurities when due, and that the value of the short-term investments will beless than the amount of cash collateral required to be returned to theborrower. The Fund’s agreement with Citibank does not include masternetting provisions. Non-cash collateral received by the Fund may not be soldor re-pledged except to satisfy borrower default. Cash collateral is listed inthe Fund’s Portfolio of Investments and Financial Statements while non-cashcollateral is not included.
At November 30, 2017, the Fund’s value of outstanding securities on loanand the value of collateral are as follows:
Value of Securities on Loan Non-Cash Collateral Cash Collateral
$16,706,000 $6,942,000 $12,431,000
(6) CAPITAL SHARE TRANSACTIONSAt November 30, 2017, there were an unlimited number of shares of capitalstock at no par value authorized for the Fund.
Capital share transactions for the Institutional Shares resulted frompurchases and sales by the affiliated USAA fund-of-funds as well as other
22 | USAA Precious Metals and Minerals Fund
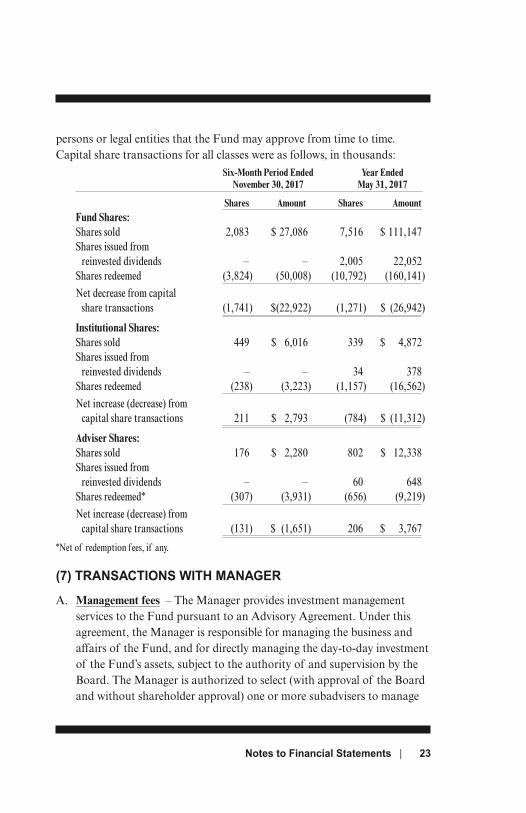
persons or legal entities that the Fund may approve from time to time.Capital share transactions for all classes were as follows, in thousands:
Six-Month Period Ended Year Ended November 30, 2017 May 31, 2017
Shares Amount Shares AmountFund Shares:Shares sold 2,083 $ 27,086 7,516 $ 111,147Shares issued from
reinvested dividends – – 2,005 22,052Shares redeemed (3,824) (50,008) (10,792) (160,141)Net decrease from capital
share transactions (1,741) $(22,922) (1,271) $ (26,942)
Institutional Shares:Shares sold 449 $ 6,016 339 $ 4,872Shares issued from
reinvested dividends – – 34 378Shares redeemed (238) (3,223) (1,157) (16,562)Net increase (decrease) from
capital share transactions 211 $ 2,793 (784) $ (11,312)
Adviser Shares:Shares sold 176 $ 2,280 802 $ 12,338Shares issued from
reinvested dividends – – 60 648Shares redeemed* (307) (3,931) (656) (9,219)Net increase (decrease) from
capital share transactions (131) $ (1,651) 206 $ 3,767
*Net of redemption fees, if any.
(7) TRANSACTIONS WITH MANAGER
A. Management fees – The Manager provides investment managementservices to the Fund pursuant to an Advisory Agreement. Under thisagreement, the Manager is responsible for managing the business andaffairs of the Fund, and for directly managing the day-to-day investmentof the Fund’s assets, subject to the authority of and supervision by theBoard. The Manager is authorized to select (with approval of the Boardand without shareholder approval) one or more subadvisers to manage
Notes to Financial Statements | 23
the day-to-day investment of all or a portion of the Fund’s assets. Forthe six-month period ended November 30, 2017, the Fund had nosubadviser(s).
The investment management fee for the Fund is comprised of a base feeand a performance adjustment. The Fund’s base fee is accrued daily andpaid monthly at an annualized rate of 0.75% of the Fund’s average netassets.
The performance adjustment is calculated separately for each share classon a monthly basis by comparing each class’ performance over theperformance period to that of the Lipper Precious Metals Equity FundsIndex. The Lipper Precious Metals Equity Funds Index tracks the totalreturn performance of funds within the Lipper Precious Metals EquityFunds category.
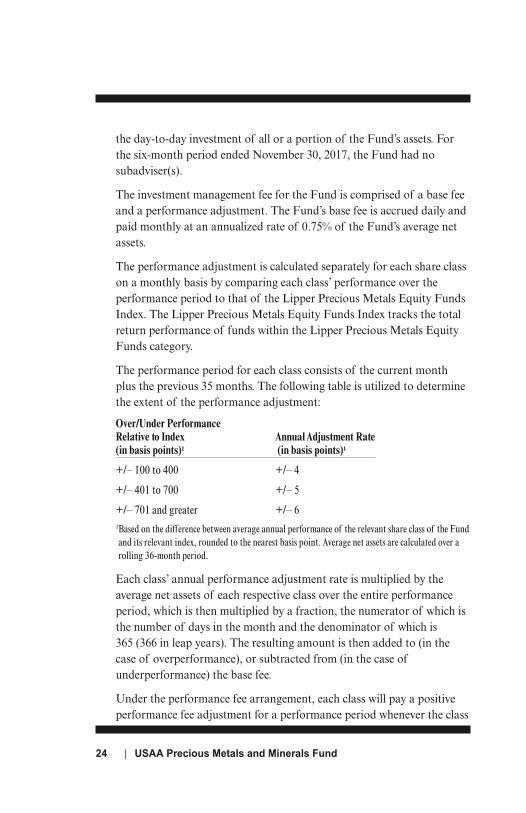
The performance period for each class consists of the current monthplus the previous 35 months. The following table is utilized to determinethe extent of the performance adjustment:
Over/Under Performance Relative to Index Annual Adjustment Rate(in basis points)1 (in basis points)1
+/– 100 to 400 +/– 4
+/– 401 to 700 +/– 5
+/– 701 and greater +/– 61Based on the difference between average annual performance of the relevant share class of the Fundand its relevant index, rounded to the nearest basis point. Average net assets are calculated over arolling 36-month period.
Each class’ annual performance adjustment rate is multiplied by theaverage net assets of each respective class over the entire performanceperiod, which is then multiplied by a fraction, the numerator of which isthe number of days in the month and the denominator of which is 365 (366 in leap years). The resulting amount is then added to (in thecase of overperformance), or subtracted from (in the case ofunderperformance) the base fee.
Under the performance fee arrangement, each class will pay a positiveperformance fee adjustment for a performance period whenever the class
24 | USAA Precious Metals and Minerals Fund
outperforms the Lipper Precious Metals Equity Funds Index over thatperiod, even if the class had overall negative returns during theperformance period.
For the six-month period ended November 30, 2017, the Fund incurredtotal management fees, paid or payable to the Manager, of $2,122,000,which included a performance adjustment for the Fund Shares,Institutional Shares, and Adviser Shares of $(119,000), $(15,000), and$(3,000), respectively. For the Fund Shares, Institutional Shares, andAdviser Shares, the performance adjustments were (0.04)%, (0.60)%, and(0.04)%, respectively.
B. Administration and servicing fees – The Manager provides certainadministration and servicing functions for the Fund. For such services,the Manager receives a fee accrued daily and paid monthly at anannualized rate of 0.15% of average net assets of the Fund Shares andAdviser Shares, and 0.10% of average net assets of the InstitutionalShares. For the six-month period ended November 30, 2017, the FundShares, Institutional Shares, and Adviser Shares incurred administrationand servicing fees, paid or payable to the Manager, of $435,000, $2,000,and $13,000, respectively.
In addition to the services provided under its Administration andServicing Agreement with the Fund, the Manager also provides certaincompliance and legal services for the benefit of the Fund. The Board hasapproved the reimbursement of a portion of these expenses incurred bythe Manager. For the six-month period ended November 30, 2017, theFund reimbursed the Manager $7,000 for these compliance and legalservices. These expenses are included in the professional fees on theFund’s Statement of Operations.
C. Transfer agent’s fees – USAA Transfer Agency Company, d/b/a USAAShareholder Account Services (SAS), an affiliate of the Manager,provides transfer agent services to the Fund Shares and Adviser Sharesbased on an annual charge of $23 per shareholder account plus out-of-pocket expenses. SAS pays a portion of these fees to certain intermediariesfor the administration and servicing of accounts that are held with suchintermediaries. Transfer agent’s fees for Institutional Shares are paid
Notes to Financial Statements | 25
monthly based on a fee accrued daily at an annualized rate of 0.10% ofthe Institutional Shares’ average net assets, plus out-of-pocket expenses.For the six-month period ended November 30, 2017, the Fund Shares,Institutional Shares, and Adviser Shares incurred transfer agent’s fees,paid or payable to SAS, of $878,000, $2,000, and $2,000, respectively.
D. Distribution and service (12b-1) fees – The Fund has adopted a planpursuant to Rule 12b-1 under the 1940 Act with respect to the AdviserShares. Under the plan, the Adviser Shares pay fees to USAAInvestment Management Company (IMCO), the distributor, fordistribution and shareholder services. IMCO pays all or a portion ofsuch fees to intermediaries that make the Adviser Shares available forinvestment by their customers. The fee is accrued daily and paid monthlyat an annual rate of 0.25% of the Adviser Shares’ average net assets.Adviser Shares are offered and sold without imposition of an initial salescharge or a contingent deferred sales charge. For the six-month periodended November 30, 2017, the Adviser Shares incurred distribution andservice (12b-1) fees of $22,000.
E. Underwriting services – IMCO provides exclusive underwriting anddistribution of the Fund’s shares on a continuing best-efforts basis andreceives no fee or other compensation for these services, but may receive12b-1 fees as described above, with respect to Adviser Shares.
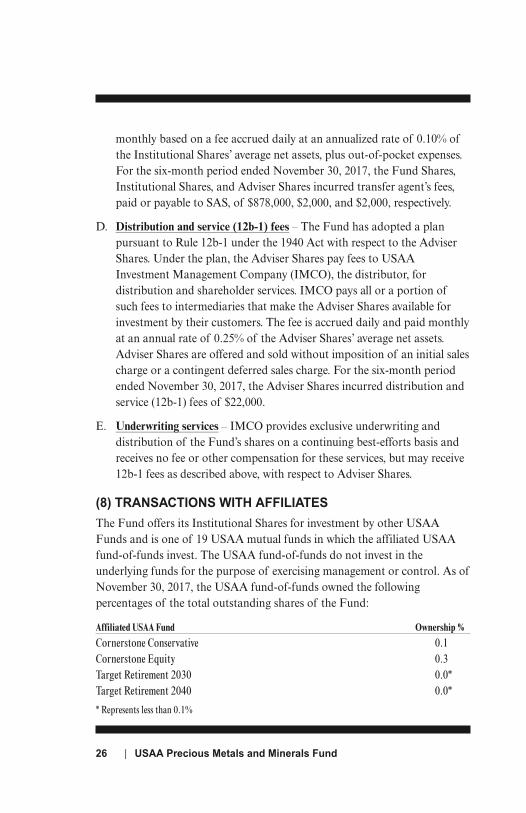
(8) TRANSACTIONS WITH AFFILIATESThe Fund offers its Institutional Shares for investment by other USAAFunds and is one of 19 USAA mutual funds in which the affiliated USAAfund-of-funds invest. The USAA fund-of-funds do not invest in theunderlying funds for the purpose of exercising management or control. As of November 30, 2017, the USAA fund-of-funds owned the followingpercentages of the total outstanding shares of the Fund:
Affiliated USAA Fund Ownership %
Cornerstone Conservative 0.1Cornerstone Equity 0.3Target Retirement 2030 0.0*Target Retirement 2040 0.0*
* Represents less than 0.1%
26 | USAA Precious Metals and Minerals Fund
The Manager is indirectly wholly owned by United Services AutomobileAssociation (USAA), a large, diversified financial services institution. AtNovember 30, 2017, USAA and its affiliates owned 130,000 Adviser Shares,which represents 10.0% of the Adviser Shares outstanding and 0.3% of theFund’s total outstanding shares.
Certain trustees and officers of the Fund are also directors, officers, and/oremployees of the Manager. None of the affiliated trustees or Fund officersreceived any compensation from the Fund.
(9) UPCOMING REGULATORY MATTERSIn October 2016, the U.S. Securities and Exchange Commission (SEC) issuedFinal Rule Release No. 33-10231, Investment Company ReportingModernization. In part, the rules require the filing of new forms N-PORTand N-CEN, and amend Regulation S-X to require standardized, enhanceddisclosure about derivatives in investment company financial statements, aswell as other amendments.
In October 2016, the SEC issued Final Rule Release No. 33-10233,Investment Company Liquidity Risk Management Programs. This rulerequires funds to establish a liquidity risk management program andenhances disclosures regarding funds’ liquidity. In October 2016, the SEC issued Final Rule Release No. 33-10234,Investment Company Swing Pricing. This rule permits certain funds to useswing pricing during periods of heavy redemptions and requires certaindisclosures regarding the use of swing pricing in forms filed with the SEC.
The Manager continues to evaluate the impact these rules and amendmentswill have on the financial statements and other disclosures. The compliancedate for new forms N-PORT and N-CEN is June 1, 2018 (with filing ofForm N-PORT beginning April 30, 2019), with other staggered compliancedates extending through April 30, 2019. The Fund is expected to complywith the June 1, 2018 compliance date for new forms N-PORT and N-CEN.
Notes to Financial Statements | 27
28 | USAA Precious Metals and Minerals Fund
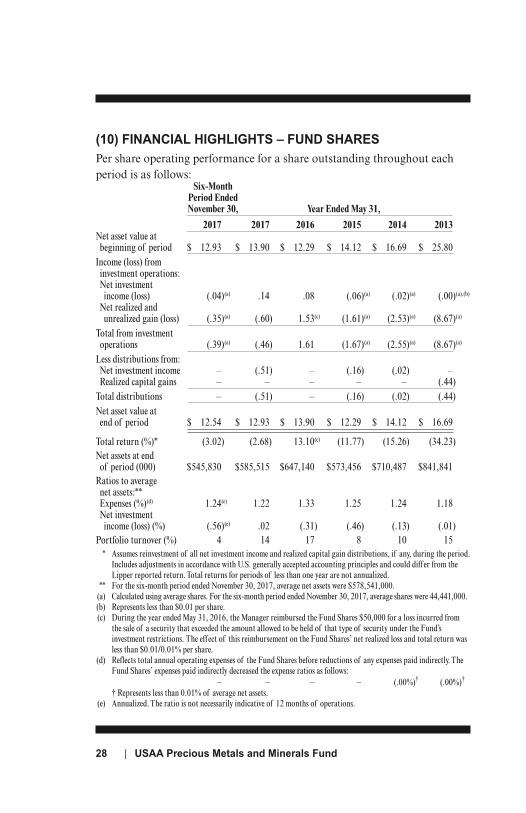
(10) FINANCIAL HIGHLIGHTS – FUND SHARESPer share operating performance for a share outstanding throughout eachperiod is as follows:
Six-MonthPeriod EndedNovember 30, Year Ended May 31,
2017 2017 2016 2015 2014 2013Net asset value at
beginning of period $ 12.93 $ 13.90 $ 12.29 $ 14.12 $ 16.69 $ 25.80Income (loss) from
investment operations: Net investment
income (loss) (.04)(a) .14 .08 (.06)(a) (.02)(a) (.00)(a),(b)
Net realized and unrealized gain (loss) (.35)(a) (.60) 1.53(c) (1.61)(a) (2.53)(a) (8.67)(a)
Total from investmentoperations (.39)(a) (.46) 1.61 (1.67)(a) (2.55)(a) (8.67)(a)
Less distributions from: Net investment income – (.51) – (.16) (.02) – Realized capital gains – – – – – (.44)Total distributions – (.51) – (.16) (.02) (.44)Net asset value at
end of period $ 12.54 $ 12.93 $ 13.90 $ 12.29 $ 14.12 $ 16.69
Total return (%)* (3.02) (2.68) 13.10(c) (11.77) (15.26) (34.23)Net assets at end
of period (000) $545,830 $585,515 $647,140 $573,456 $710,487 $841,841Ratios to average
net assets:** Expenses (%)(d) 1.24(e) 1.22 1.33 1.25 1.24 1.18 Net investment
income (loss) (%) (.56)(e) .02 (.31) (.46) (.13) (.01)Portfolio turnover (%) 4 14 17 8 10 15 * Assumes reinvestment of all net investment income and realized capital gain distributions, if any, during the period.
Includes adjustments in accordance with U.S. generally accepted accounting principles and could differ from theLipper reported return. Total returns for periods of less than one year are not annualized.
** For the six-month period ended November 30, 2017, average net assets were $578,541,000.(a) Calculated using average shares. For the six-month period ended November 30, 2017, average shares were 44,441,000.(b) Represents less than $0.01 per share.(c) During the year ended May 31, 2016, the Manager reimbursed the Fund Shares $50,000 for a loss incurred from
the sale of a security that exceeded the amount allowed to be held of that type of security under the Fund’sinvestment restrictions. The effect of this reimbursement on the Fund Shares’ net realized loss and total return wasless than $0.01/0.01% per share.
(d) Reflects total annual operating expenses of the Fund Shares before reductions of any expenses paid indirectly. TheFund Shares’ expenses paid indirectly decreased the expense ratios as follows:
– – – – (.00%)† (.00%)†
† Represents less than 0.01% of average net assets.(e) Annualized. The ratio is not necessarily indicative of 12 months of operations.
Notes to Financial Statements | 29
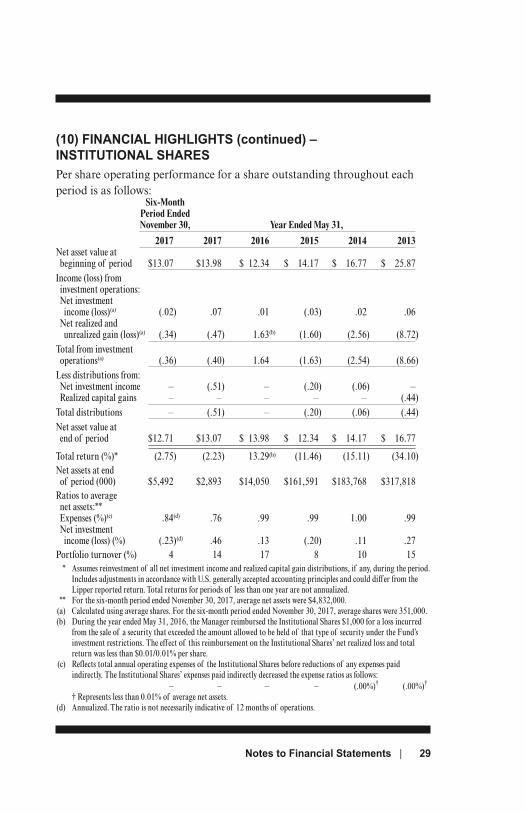
(10) FINANCIAL HIGHLIGHTS (continued) –INSTITUTIONAL SHARESPer share operating performance for a share outstanding throughout eachperiod is as follows:
Six-MonthPeriod EndedNovember 30, Year Ended May 31,
2017 2017 2016 2015 2014 2013Net asset value at
beginning of period $13.07 $13.98 $ 12.34 $ 14.17 $ 16.77 $ 25.87 Income (loss) from
investment operations: Net investment
income (loss)(a) (.02) .07 .01 (.03) .02 .06 Net realized and
unrealized gain (loss)(a) (.34) (.47) 1.63(b) (1.60) (2.56) (8.72) Total from investment
operations(a) (.36) (.40) 1.64 (1.63) (2.54) (8.66) Less distributions from: Net investment income – (.51) – (.20) (.06) – Realized capital gains – – – – – (.44) Total distributions – (.51) – (.20) (.06) (.44) Net asset value at
end of period $12.71 $13.07 $ 13.98 $ 12.34 $ 14.17 $ 16.77
Total return (%)* (2.75) (2.23) 13.29(b) (11.46) (15.11) (34.10)Net assets at end
of period (000) $5,492 $2,893 $14,050 $161,591 $183,768 $317,818Ratios to average
net assets:** Expenses (%)(c) .84(d) .76 .99 .99 1.00 .99 Net investment
income (loss) (%) (.23)(d) .46 .13 (.20) .11 .27Portfolio turnover (%) 4 14 17 8 10 15 * Assumes reinvestment of all net investment income and realized capital gain distributions, if any, during the period.
Includes adjustments in accordance with U.S. generally accepted accounting principles and could differ from theLipper reported return. Total returns for periods of less than one year are not annualized.
** For the six-month period ended November 30, 2017, average net assets were $4,832,000.(a) Calculated using average shares. For the six-month period ended November 30, 2017, average shares were 351,000.(b) During the year ended May 31, 2016, the Manager reimbursed the Institutional Shares $1,000 for a loss incurred
from the sale of a security that exceeded the amount allowed to be held of that type of security under the Fund’sinvestment restrictions. The effect of this reimbursement on the Institutional Shares’ net realized loss and totalreturn was less than $0.01/0.01% per share.
(c) Reflects total annual operating expenses of the Institutional Shares before reductions of any expenses paidindirectly. The Institutional Shares’ expenses paid indirectly decreased the expense ratios as follows:
– – – – (.00%)† (.00%)†
† Represents less than 0.01% of average net assets.(d) Annualized. The ratio is not necessarily indicative of 12 months of operations.
30 | USAA Precious Metals and Minerals Fund
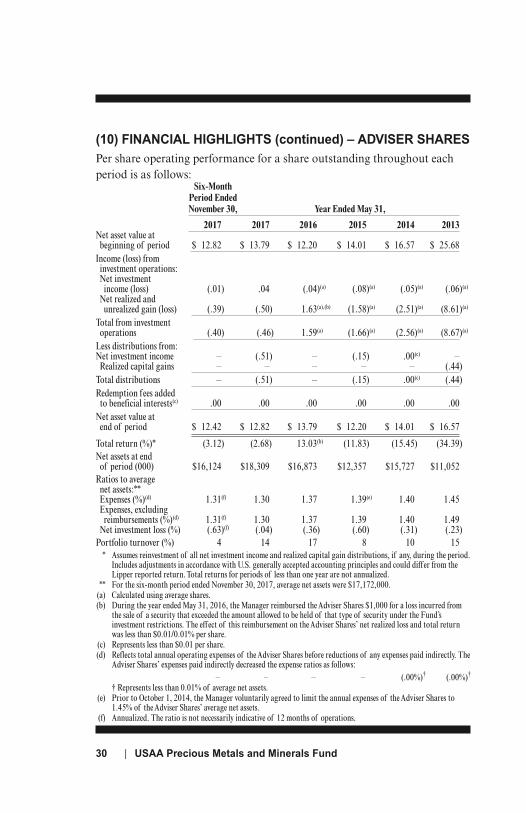
(10) FINANCIAL HIGHLIGHTS (continued) – ADVISER SHARESPer share operating performance for a share outstanding throughout eachperiod is as follows:
Six-MonthPeriod EndedNovember 30, Year Ended May 31,
2017 2017 2016 2015 2014 2013Net asset value at
beginning of period $ 12.82 $ 13.79 $ 12.20 $ 14.01 $ 16.57 $ 25.68 Income (loss) from
investment operations: Net investment
income (loss) (.01) .04 (.04)(a) (.08)(a) (.05)(a) (.06)(a)
Net realized and unrealized gain (loss) (.39) (.50) 1.63(a),(b) (1.58)(a) (2.51)(a) (8.61)(a)
Total from investment
operations (.40) (.46) 1.59(a) (1.66)(a) (2.56)(a) (8.67)(a)
Less distributions from:Net investment income – (.51) – (.15) .00(c) – Realized capital gains – – – – – (.44) Total distributions – (.51) – (.15) .00(c) (.44) Redemption fees added
to beneficial interests(c) .00 .00 .00 .00 .00 .00 Net asset value at
end of period $ 12.42 $ 12.82 $ 13.79 $ 12.20 $ 14.01 $ 16.57 Total return (%)* (3.12) (2.68) 13.03(b) (11.83) (15.45) (34.39)Net assets at end
of period (000) $16,124 $18,309 $16,873 $12,357 $15,727 $11,052Ratios to average
net assets:** Expenses (%)(d) 1.31(f) 1.30 1.37 1.39(e) 1.40 1.45 Expenses, excluding
reimbursements (%)(d) 1.31(f) 1.30 1.37 1.39 1.40 1.49 Net investment loss (%) (.63)(f) (.04) (.36) (.60) (.31) (.23)Portfolio turnover (%) 4 14 17 8 10 15 * Assumes reinvestment of all net investment income and realized capital gain distributions, if any, during the period.
Includes adjustments in accordance with U.S. generally accepted accounting principles and could differ from theLipper reported return. Total returns for periods of less than one year are not annualized.
** For the six-month period ended November 30, 2017, average net assets were $17,172,000.(a) Calculated using average shares.(b) During the year ended May 31, 2016, the Manager reimbursed the Adviser Shares $1,000 for a loss incurred from
the sale of a security that exceeded the amount allowed to be held of that type of security under the Fund’sinvestment restrictions. The effect of this reimbursement on the Adviser Shares’ net realized loss and total returnwas less than $0.01/0.01% per share.
(c) Represents less than $0.01 per share.(d) Reflects total annual operating expenses of the Adviser Shares before reductions of any expenses paid indirectly. The
Adviser Shares’ expenses paid indirectly decreased the expense ratios as follows: – – – – (.00%)† (.00%)†
† Represents less than 0.01% of average net assets.(e) Prior to October 1, 2014, the Manager voluntarily agreed to limit the annual expenses of the Adviser Shares to
1.45% of the Adviser Shares’ average net assets. (f) Annualized. The ratio is not necessarily indicative of 12 months of operations.
EXPENSE EXAMPLENovember 30, 2017 (unaudited)
Expense Example | 31
EXAMPLEAs a shareholder of the Fund, you incur two types of costs: direct costs, suchas wire fees, redemption fees, and low balance fees; and indirect costs,including management fees, transfer agency fees, distribution and service(12b-1) fees, and other Fund operating expenses. This example is intended tohelp you understand your indirect costs, also referred to as “ongoing costs”(in dollars), of investing in the Fund and to compare these costs with theongoing costs of investing in other mutual funds.
The example is based on an investment of $1,000 invested at the beginningof the period and held for the entire six-month period of June 1, 2017,through November 30, 2017.
ACTUAL EXPENSESThe line labeled “actual” under each share class in the table providesinformation about actual account values and actual expenses. You may usethe information in this line, together with the amount you invested at thebeginning of the period, to estimate the expenses that you paid over theperiod. Simply divide your account value by $1,000 (for example, an $8,600account value divided by $1,000 = 8.6), then multiply the result by thenumber for your share class in the “actual” line under the heading “ExpensesPaid During Period” to estimate the expenses you paid on your accountduring this period.
HYPOTHETICAL EXAMPLE FOR COMPARISON PURPOSESThe line labeled “hypothetical” under each share class in the table providesinformation about hypothetical account values and hypothetical expensesbased on the Fund’s actual expense ratios for each class and an assumed rateof return of 5% per year before expenses, which is not the Fund’s actualreturn. The hypothetical account values and expenses may not be used to
32 | USAA Precious Metals and Minerals Fund
estimate the actual ending account balance or expenses you paid for theperiod. You may use this information to compare the ongoing costs ofinvesting in the Fund and other funds. To do so, compare this 5% hypotheticalexample with the 5% hypothetical examples that appear in the shareholderreports of other funds.
Please note that the expenses shown in the table are meant to highlight yourongoing costs only and do not reflect any direct costs, such as wire fees,redemption fees, or low balance fees. Therefore, the line labeled “hypothetical”is useful in comparing ongoing costs only, and will not help you determinethe relative total costs of owning different funds. In addition, if these directcosts were included, your costs would have been higher.
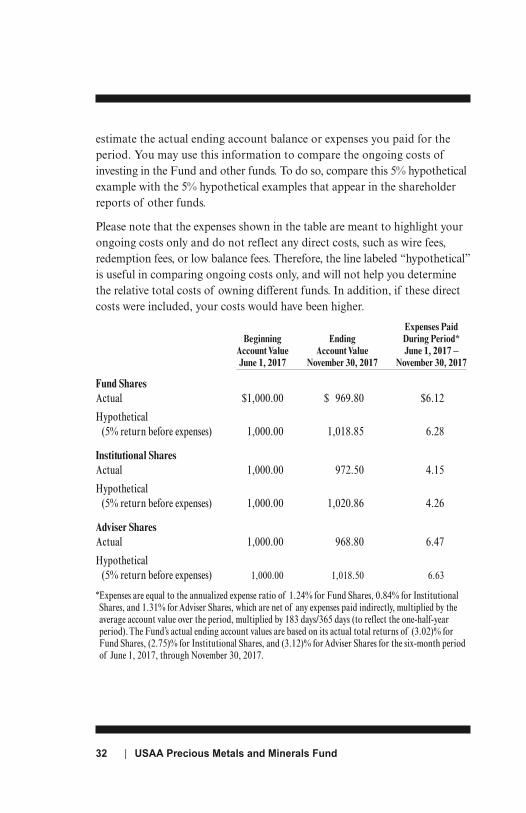
Expenses Paid Beginning Ending During Period* Account Value Account Value June 1, 2017 – June 1, 2017 November 30, 2017 November 30, 2017
Fund SharesActual $1,000.00 $ 969.80 $6.12
Hypothetical(5% return before expenses) 1,000.00 1,018.85 6.28
Institutional SharesActual 1,000.00 972.50 4.15
Hypothetical(5% return before expenses) 1,000.00 1,020.86 4.26
Adviser SharesActual 1,000.00 968.80 6.47
Hypothetical(5% return before expenses) 1,000.00 1,018.50 6.63
*Expenses are equal to the annualized expense ratio of 1.24% for Fund Shares, 0.84% for InstitutionalShares, and 1.31% for Adviser Shares, which are net of any expenses paid indirectly, multiplied by theaverage account value over the period, multiplied by 183 days/365 days (to reflect the one-half-yearperiod). The Fund’s actual ending account values are based on its actual total returns of (3.02)% forFund Shares, (2.75)% for Institutional Shares, and (3.12)% for Adviser Shares for the six-month periodof June 1, 2017, through November 30, 2017.
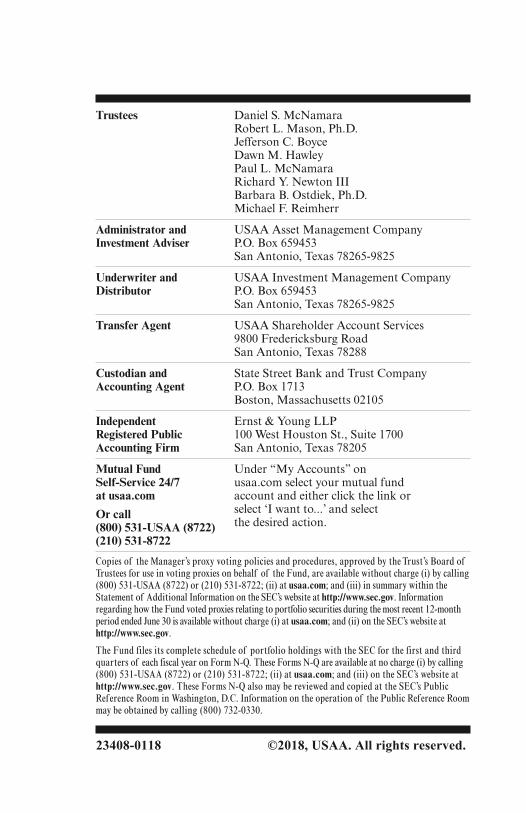
Trustees Daniel S. McNamaraRobert L. Mason, Ph.D.Jefferson C. BoyceDawn M. HawleyPaul L. McNamaraRichard Y. Newton IIIBarbara B. Ostdiek, Ph.D. Michael F. Reimherr
Administrator and USAA Asset Management CompanyInvestment Adviser P.O. Box 659453
San Antonio, Texas 78265-9825
Underwriter and USAA Investment Management CompanyDistributor P.O. Box 659453
San Antonio, Texas 78265-9825
Transfer Agent USAA Shareholder Account Services9800 Fredericksburg RoadSan Antonio, Texas 78288
Custodian and State Street Bank and Trust CompanyAccounting Agent P.O. Box 1713
Boston, Massachusetts 02105
Independent Ernst & Young LLPRegistered Public 100 West Houston St., Suite 1700Accounting Firm San Antonio, Texas 78205
Mutual Fund Under “My Accounts” onSelf-Service 24/7 usaa.com select your mutual fundat usaa.com account and either click the link orOr call select ‘I want to...’ and select(800) 531-USAA (8722) the desired action.(210) 531-8722
Copies of the Manager’s proxy voting policies and procedures, approved by the Trust’s Board ofTrustees for use in voting proxies on behalf of the Fund, are available without charge (i) by calling(800) 531-USAA (8722) or (210) 531-8722; (ii) at usaa.com; and (iii) in summary within theStatement of Additional Information on the SEC’s website at http://www.sec.gov. Informationregarding how the Fund voted proxies relating to portfolio securities during the most recent 12-monthperiod ended June 30 is available without charge (i) at usaa.com; and (ii) on the SEC’s website athttp://www.sec.gov.
The Fund files its complete schedule of portfolio holdings with the SEC for the first and thirdquarters of each fiscal year on Form N-Q. These Forms N-Q are available at no charge (i) by calling(800) 531-USAA (8722) or (210) 531-8722; (ii) at usaa.com; and (iii) on the SEC’s website athttp://www.sec.gov. These Forms N-Q also may be reviewed and copied at the SEC’s PublicRef erence Room in Washington, D.C. Information on the operation of the Public Ref erence Roommay be obtained by calling (800) 732-0330.
23408-0118 ©2018, USAA. All rights reserved.