Embed Size (px)
Citation preview
ANNUAL REPORTUSAA S&P 500 INDEX FUNDMEMBER SHARES ■ REWARD SHARES
DECEMBER 31, 2018
Beginning on January 1, 2021, as permitted by regulations adopted by the Securitiesand Exchange Commission, paper copies of the Fund’s shareholder reports like thisone will no longer be sent by mail, unless you specifically request paper copies of thereports from the Fund or from your financial intermediary, such as a broker-dealer orbank. Instead, the reports will be made available on usaa.com, and you will be notifiedby mail each time a report is posted and provided with a website link to access the report.
If you already elected to receive shareholder reports electronically, you will not beaffected by this change and you need not take any action. You may elect to receiveshareholder reports and other communications from the Fund or your financialintermediary electronically by notifying your financial intermediary directly, or if you area direct investor, by calling (800) 531-USAA (8722) or logging on to usaa.com.
You may elect to receive all future reports in paper free of charge. You can inform theFund or your financial intermediary that you wish to continue receiving paper copies ofyour shareholder reports by notifying your financial intermediary directly, or if you are adirect investor, by calling (800) 531-USAA (8722) or logging on to usaa.com. Yourelection to receive reports in paper will apply to all funds held with the USAA family offunds or your financial intermediary.

PRESIDENT’S MESSAGE
February 2019
Volatility returned to the financial markets in a big way during 2018.Ultimately, 2018 turned out to be one of the most volatile years since the2008 financial crisis, with nearly all equity markets recording negativereturns. The turmoil began in early February 2018 when a surge in U.S.inflation suggested that the Federal Reserve (Fed) might increase its pace ofinterest rate increases. Global stocks broadly declined in response. Althoughemerging-markets stocks continued to trend down, developed-markets equitiesgenerally rebounded, and in spite of ongoing volatility, global equities postednew gains into the summer and early fall 2018. Market conditions grew morechallenging in October 2018, as investors became concerned that the U.S.economic expansion might be losing steam. In this environment, worries aboutcontinued Fed interest rate increases, the U.S.-China trade dispute, andcorporate earnings weakness drove a worldwide sell-off, led by U.S. stocks,which continued through the end of 2018.
Investors, who traditionally seek safe haven in fixed income securities duringvolatile times, found little relief in bonds during 2018. For most of 2018,longer-term yields climbed (and bond prices fell), as the Fed maintained itscommitment to raising short-term interest rates. The situation improved slightlyin November and December 2018 due to changing market expectations aboutthe pace of Fed interest rate increases during 2019. In December 2018, Fedpolicymakers altered their forecast, decreasing the number of their projected2019 interest rate increases from three to two. By year end 2018, longer-termyields had dropped from their period highs, which suggested that investorsthought that the Fed might raise interest rates a single time or even remainon hold throughout 2019. The yield on the bellwether 10-year U.S. Treasurynote started in January 2018 at 2.46%, reached 3.24% — its high of thereporting period — on November 8, 2018, and ended December 2018 at 2.69%.
PRESIDENT’S MESSAGE
“Long-term investors should make decisionsbased on their long-term objectives, time horizon,and risk tolerance. They should never make hastyportfolio decisions based on market turmoil.”

Of course, it is difficult to predict what the Fed will do in 2019 or what theeconomic data will look like. At USAA Investments, we believe the U.S.economy will continue expanding, though at a slower pace than in 2018. Wesee little chance of a recession in the next 12 months. As for stocks, we hadsaid for some time that valuations were stretched. After the recent sell-off,valuations appear more reasonable. Market declines can present attractiveopportunities to discerning investors; the new year may be a good time toadd holdings that support your long-term investment plan.
In the coming months, shareholders can expect to hear a lot of media “noise”about the markets, Fed monetary policy, economic growth, and trade. Theexaggerated language, such as that employed during the sell-off (the steep dropon December 24, 2018, and the historic one-day rally on December 26, 2018 areprime examples), are designed to provoke an emotional reaction. We believethat shareholders should focus on information that can provide the perspectivethey need to manage their investments. Long-term investors should makedecisions based on their long-term objectives, time horizon, and risk tolerance.They should never make hasty portfolio decisions based on market turmoil.One way to avoid the temptation to time the market is dollar-cost averaging,which is the strategy of investing a set amount on a regular basis.
Diversification is another good investment strategy, that can potentially protecta portfolio from market turbulence or shifts in performance leadership. Theprimary goal of diversification, after all, is long-term risk management. If youare uneasy about market risk in general or you want to evaluate currentportfolio risk, please call USAA to speak with an advisor. They can help youreview your investment plan and make sure you are properly diversified.
At USAA Investments, we are committed to helping you meet your financialobjectives. Rest assured we will continue to monitor the financial markets,economic conditions, Fed monetary policy, and shifts in interest rates, as wellas other matters that could potentially affect your investments.
On behalf of everyone here, thank you for the opportunity to help you withyour investment needs.Sincerely,
Brooks EnglehardtPresidentUSAA Investments
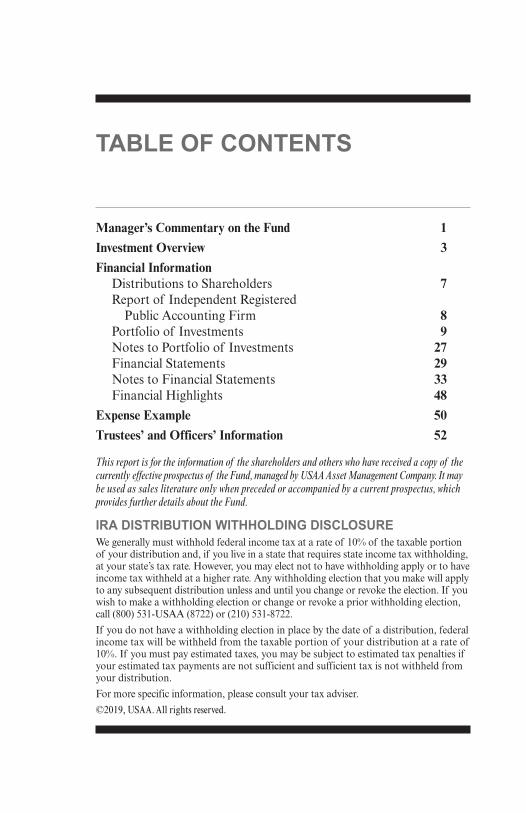
TABLE OF CONTENTS
Manager’s Commentary on the Fund 1
Investment Overview 3
Financial Information
Distributions to Shareholders 7Report of Independent Registered
Public Accounting Firm 8Portfolio of Investments 9Notes to Portfolio of Investments 27
Financial Statements 29
Notes to Financial Statements 33
Financial Highlights 48
Expense Example 50
Trustees’ and Officers’ Information 52
This report is for the information of the shareholders and others who have received a copy of thecurrently effective prospectus of the Fund, managed by USAA Asset Management Company. It maybe used as sales literature only when preceded or accompanied by a current prospectus, whichprovides further details about the Fund.
IRA DISTRIBUTION WITHHOLDING DISCLOSUREWe generally must withhold federal income tax at a rate of 10% of the taxable portionof your distribution and, if you live in a state that requires state income tax withholding,at your state’s tax rate. However, you may elect not to have withholding apply or to haveincome tax withheld at a higher rate. Any withholding election that you make will applyto any subsequent distribution unless and until you change or revoke the election. If youwish to make a withholding election or change or revoke a prior withholding election,call (800) 531-USAA (8722) or (210) 531-8722.If you do not have a withholding election in place by the date of a distribution, federalincome tax will be withheld from the taxable portion of your distribution at a rate of10%. If you must pay estimated taxes, you may be subject to estimated tax penalties ifyour estimated tax payments are not sufficient and sufficient tax is not withheld fromyour distribution.For more specific information, please consult your tax adviser.©2019, USAA. All rights reserved.

Manager’s Commentary on the Fund | 1
■ What were the market conditions during the reporting period?
U.S. equities started off strong in 2018, extending the exuberance from thelate 2017 tax reforms. Markets climbed to new highs in early 2018 beforevolatility came back into the markets due to continued trade warspeculation. Investors pulled back after disappointing jobs numbers inearly 2018, leading to the first quarter of 2018 seeing the first negativereturn since 2015.
Throughout the rest of 2018, talk of tariffs and trade wars with America’smain trading partners, China and Europe, dominated the headlines,leading to speculation of a global growth slowdown. Despite the globalgrowth concerns, corporate earnings remained strong throughout thesecond and third quarters of 2018, leading to market advances, while oiltook a volatile path throughout 2018.
Accompanying the strength in economic data and corporate earnings, theFederal Reserve (the Fed) continued with four quarterly interest rateincreases throughout 2018. In the third quarter of 2018, the U.S. marketshit new all-time highs with yields edging higher and sustained strength ofthe U.S. Dollar, but in September 2018 continuing geopolitical issuesstarted to weigh on markets, leading to a significant decline in equitiesover the fourth quarter of 2018.
With the Fed’s continued interest rate increases, the short end of the yieldcurve increased, while the long end remained relatively unchanged throughthe first part of the year. The economic turmoil in the fourth quarter of2018 inverted the medium term of the yield curve, while investors
MANAGER’S COMMENTARYON THE FUND
Brent ReederNorthern Trust Investments, Inc.

2 | USAA S&P 500 Index Fund
interpreted the final Fed minutes as a decrease in the number ofinterest rate increases for 2019. On the trade war front, despite initialpositive reports coming out of the G-20 summit, investors questionedwhether additional progress would be made before the March 1, 2019deadline for a full trade agreement between China and the U.S.
■ How did the USAA S&P 500 Index Fund (the Fund) perform
during the reporting period?
The Fund closely tracked its benchmark, the broad-based S&P 500® Index(the Index), during the reporting period. The USAA S&P 500 Index FundMember Shares and Reward Shares returned –4.65% and –4.53%,respectively, during the reporting period versus the Index, whichreturned –4.38%. The Index emphasizes large U.S. company stocks and isnot available for direct investment.
■ Please describe sector performance during the reporting period.
In 2018, the Index returned –4.38%. Large cap U.S. equities outperformeddeveloped equities outside of the United States.
Health Care and Utilities were the strongest performing sectors withinthe Index, returning 6.03% and 4.11%, respectively. The Energy andMaterials sectors exhibited the worst performance, returning –18.33%and –15.34%, respectively.
Thank you for the opportunity to help you with your investment needs.
Past performance is no guarantee of future results. • Investing in securities products involves risk,including possible loss of principal.
Refer to page 3 for the benchmark definition.
Investment Overview | 3
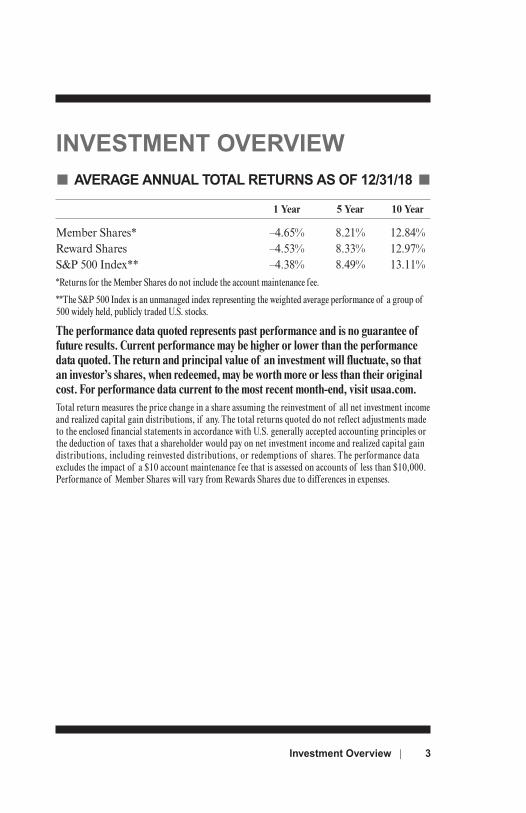
INVESTMENT OVERVIEW■ AVERAGE ANNUAL TOTAL RETURNS AS OF 12/31/18 ■
1 Year 5 Year 10 Year
Member Shares* –4.65% 8.21% 12.84%Reward Shares –4.53% 8.33% 12.97%S&P 500 Index** –4.38% 8.49% 13.11%*Returns for the Member Shares do not include the account maintenance fee.
**The S&P 500 Index is an unmanaged index representing the weighted average performance of a group of500 widely held, publicly traded U.S. stocks.
The performance data quoted represents past performance and is no guarantee offuture results. Current performance may be higher or lower than the performancedata quoted. The return and principal value of an investment will fluctuate, so thatan investor’s shares, when redeemed, may be worth more or less than their originalcost. For performance data current to the most recent month-end, visit usaa.com.Total return measures the price change in a share assuming the reinvestment of all net investment incomeand realized capital gain distributions, if any. The total returns quoted do not reflect adjustments madeto the enclosed financial statements in accordance with U.S. generally accepted accounting principles orthe deduction of taxes that a shareholder would pay on net investment income and realized capital gaindistributions, including reinvested distributions, or redemptions of shares. The performance dataexcludes the impact of a $10 account maintenance f ee that is assessed on accounts of less than $10,000.Performance of Member Shares will vary from Rewards Shares due to diff erences in expenses.
4 | USAA S&P 500 Index Fund
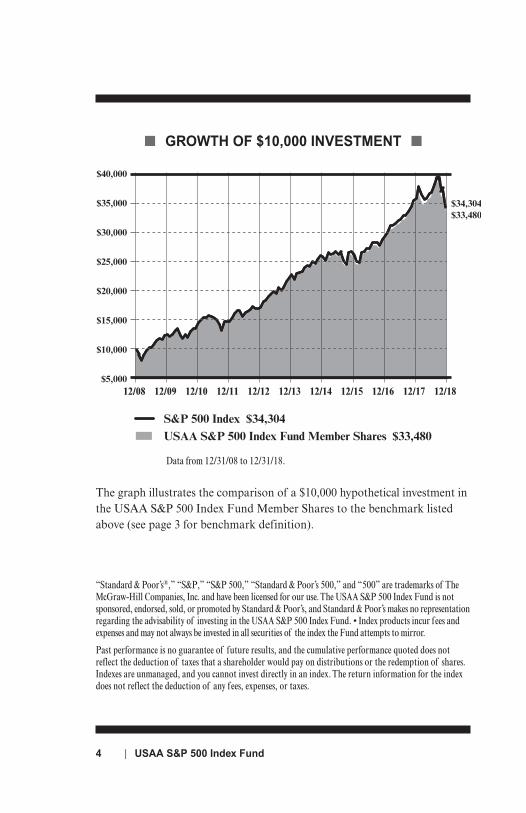
■ GROWTH OF $10,000 INVESTMENT ■
“Standard & Poor’s®,” “S&P,” “S&P 500,” “Standard & Poor’s 500,” and “500” are trademarks of TheMcGraw-Hill Companies, Inc. and have been licensed for our use. The USAA S&P 500 Index Fund is notsponsored, endorsed, sold, or promoted by Standard & Poor’s, and Standard & Poor’s makes no representationregarding the advisability of investing in the USAA S&P 500 Index Fund. • Index products incur fees andexpenses and may not always be invested in all securities of the index the Fund attempts to mirror.
Past performance is no guarantee of future results, and the cumulative performance quoted does notreflect the deduction of taxes that a shareholder would pay on distributions or the redemption of shares.Indexes are unmanaged, and you cannot invest directly in an index. The return information for the indexdoes not reflect the deduction of any fees, expenses, or taxes.
12/08 12/09 12/10 12/11 12/12 12/13 12/14 12/15 12/16 12/17 12/18
S&P 500 Index $34,304USAA S&P 500 Index Fund Member Shares $33,480
$33,480$34,304
$5,000
$10,000
$15,000
$25,000
$20,000
$30,000
$35,000
$40,000
Data from 12/31/08 to 12/31/18.
The graph illustrates the comparison of a $10,000 hypothetical investment inthe USAA S&P 500 Index Fund Member Shares to the benchmark listedabove (see page 3 for benchmark definition).

Investment Overview | 5
■ GROWTH OF $10,000 INVESTMENT ■
“Standard & Poor’s®,” “S&P,” “S&P 500,” “Standard & Poor’s 500,” and “500” are trademarks of TheMcGraw-Hill Companies, Inc. and have been licensed for our use. The USAA S&P 500 Index Fund is notsponsored, endorsed, sold, or promoted by Standard & Poor’s, and Standard & Poor’s makes no representationregarding the advisability of investing in the USAA S&P 500 Index Fund. • Index products incur fees andexpenses and may not always be invested in all securities of the index the Fund attempts to mirror.
Past performance is no guarantee of future results, and the cumulative performance quoted does notreflect the deduction of taxes that a shareholder would pay on distributions or the redemption of shares.Indexes are unmanaged, and you cannot invest directly in an index. The return information for the indexdoes not reflect the deduction of any fees, expenses, or taxes.
12/08 12/09 12/10 12/11 12/12 12/13 12/14 12/15
$33,874$34,304
12/16 12/18 12/17
S&P 500 Index $34,304USAA S&P 500 Index Fund Reward Shares $33,874
$5,000
$10,000
$15,000
$25,000
$20,000
$30,000
$35,000
$40,000
Data from 12/31/08 to 12/31/18.
The graph illustrates how a $10,000 hypothetical investment in the USAAS&P 500 Index Fund Reward Shares closely tracks the S&P 500 Index (see page 3 for the benchmark definition).

6 | USAA S&P 500 Index Fund
■ TOP 10 HOLDINGS* – 12/31/18 ■(% of Net Assets)
Microsoft Corp. - - - - - - - - - - - - - - - - - - - - - - - - - - - - - - - - - - - - - - - - - - - - - - - - - - - - - - - - - - - - - - - - - - - - - - - -
3.7%Apple, Inc.
- - - - - - - - - - - - - - - - - - - - - - - - - - - - - - - - - - - - - - - - - - - - - - - - - - - - - - - - - - - - - - - - - - - - - - - - - - - - - - - - - - -3.3%
Amazon.com, Inc. - - - - - - - - - - - - - - - - - - - - - - - - - - - - - - - - - - - - - - - - - - - - - - - - - - - - - - - - - - - - - - - - - - -
2.9%Berkshire Hathaway, Inc. “B”
- - - - - - - - - - - - - - - - - - - - - - - - - - - - - - - - - - - - - - - - - -1.8%
Johnson & Johnson - - - - - - - - - - - - - - - - - - - - - - - - - - - - - - - - - - - - - - - - - - - - - - - - - - - - - - - - - - - - - - - -
1.6%JPMorgan Chase & Co.
- - - - - - - - - - - - - - - - - - - - - - - - - - - - - - - - - - - - - - - - - - - - - - - - - - - - - - -1.5%
Alphabet, Inc. “C” - - - - - - - - - - - - - - - - - - - - - - - - - - - - - - - - - - - - - - - - - - - - - - - - - - - - - - - - - - - - - - - - - -
1.5%Facebook, Inc. “A”
- - - - - - - - - - - - - - - - - - - - - - - - - - - - - - - - - - - - - - - - - - - - - - - - - - - - - - - - - - - - - - - - -1.5%
Alphabet, Inc. “A” - - - - - - - - - - - - - - - - - - - - - - - - - - - - - - - - - - - - - - - - - - - - - - - - - - - - - - - - - - - - - - - - - - -
1.5%Exxon Mobil Corp.
- - - - - - - - - - - - - - - - - - - - - - - - - - - - - - - - - - - - - - - - - - - - - - - - - - - - - - - - - - - - - - - -1.3%
■ SECTOR ALLOCATION* – 12/31/18 ■(% of Net Assets)
Consumer,
Non-cyclical
22.9%
Consumer,
Cyclical
8.2%
Financial
17.6%
Technology
15.5%
Industrial
8.9%
Communications
14.3%
Energy
5.2%Basic Materials
2.2%Utilities
3.3%
* Does not include futures, money market instruments and short-term investments purchased with cashcollateral from securities loaned.
Percentages are of the net assets of the Fund and may not equal 100%.
Refer to the Portfolio of Investments for a complete list of securities.
The Portfolio of Investments uses the Bloomberg Industry Classification System (BICS), which may differfrom the Fund’s compliance classification.

DISTRIBUTIONS TO SHAREHOLDERS
Distributions to Shareholders | 7
The following federal tax information related to the Fund’s fiscal year endedDecember 31, 2018, is provided for information purposes only and shouldnot be used for reporting to federal or state revenue agencies. Federal taxinformation for the calendar year will be reported to you on Form 1099-DIVin January 2019.
With respect to distributions paid, the Fund designates the followingamounts (or, if subsequently determined to be different, the maximumamount allowable) for the fiscal year ended December 31, 2018:
Dividend Received Qualified Dividend Long-Term Qualified Deduction (corporate Income (non-corporate Capital Gain Interest
shareholders)(1) shareholders)(1) Distributions(2) Income100% 100% $68,420,000 $1,380,000
(1) Presented as a percentage of net investment income and short-term capital gain distributions paid, if any.(2) Pursuant to Section 852 of the Internal Revenue Code.

8 | USAA S&P 500 Index Fund
REPORT OF INDEPENDENT REGISTEREDPUBLIC ACCOUNTING FIRM
To the Shareholders and the Board of Trustees of USAA S&P 500 Index Fund:Opinion on the Financial StatementsWe have audited the accompanying statement of assets and liabilities of USAA S&P 500 Index Fund(the “Fund”) (one of the portfolios constituting the USAA Mutual Funds Trust (the “Trust”)),including the portfolio of investments, as of December 31, 2018, and the related statement ofoperations for the year then ended, the statements of changes in net assets for each of the two yearsin the period then ended, the financial highlights for each of the five years in the period then endedand the related notes (collectively referred to as the “financial statements”). In our opinion, thefinancial statements present fairly, in all material respects, the financial position of the Fund (oneof the portfolios constituting the USAA Mutual Funds Trust) at December 31, 2018, the results ofits operations for the year then ended, the changes in its net assets for each of the two years in theperiod then ended and its financial highlights for each of the five years in the period then ended, inconformity with U.S. generally accepted accounting principles.Basis for OpinionThese financial statements are the responsibility of the Trust’s management. Our responsibility is toexpress an opinion on the Fund’s financial statements based on our audits. We are a public accountingfirm registered with the Public Company Accounting Oversight Board (United States) (“PCAOB”)and are required to be independent with respect to the Trust in accordance with the U.S. federalsecurities laws and the applicable rules and regulations of the Securities and Exchange Commissionand the PCAOB.We conducted our audits in accordance with the standards of the PCAOB. Those standards requirethat we plan and perform the audit to obtain reasonable assurance about whether the financialstatements are free of material misstatement, whether due to error or fraud. The Trust is not requiredto have, nor were we engaged to perform, an audit of the Trust’s internal control over financialreporting. As part of our audits we are required to obtain an understanding of internal control overfinancial reporting, but not for the purpose of expressing an opinion on the effectiveness of theTrust’s internal control over financial reporting. Accordingly, we express no such opinion.Our audits included performing procedures to assess the risks of material misstatement of thefinancial statements, whether due to error or fraud, and performing procedures that respond tothose risks. Such procedures included examining, on a test basis, evidence regarding the amountsand disclosures in the financial statements. Our procedures included confirmation of securitiesowned as of December 31, 2018, by correspondence with the custodian and brokers or by otherappropriate auditing procedures where replies from brokers were not received. Our audits alsoincluded evaluating the accounting principles used and significant estimates made by management,as well as evaluating the overall presentation of the financial statements. We believe that our auditsprovide a reasonable basis for our opinion.
We have served as the auditor of one or more USAA investment companies since 2002.San Antonio, TexasFebruary 22, 2019

Portfolio of Investments | 9
PORTFOLIO OF INVESTMENTSDecember 31, 2018
MarketNumber Valueof Shares Security (000)
COMMON STOCKS (98.1%)Basic Materials (2.2%)Chemicals (1.9%)
67,173 Air Products & Chemicals, Inc. $ 10,75132,495 Albemarle Corp. 2,50440,926 Celanese Corp. 3,68270,227 CF Industries Holdings, Inc. 3,056
701,860 DowDuPont, Inc. 37,53543,058 Eastman Chemical Co. 3,14841,063 FMC Corp. 3,03731,114 International Flavors & Fragrances, Inc. 4,178
168,610 Linde plc 26,31096,243 LyondellBasell Industries N.V. “A” 8,003
108,856 Mosaic Co. 3,18073,303 PPG Industries, Inc. 7,49425,209 Sherwin-Williams Co. 9,919
122,797Forest Products & Paper (0.1%)
124,140 International Paper Co. 5,010
Iron/Steel (0.1%)95,716 Nucor Corp. 4,959
Mining (0.1%)444,659 Freeport-McMoRan, Inc. 4,585163,030 Newmont Mining Corp. 5,649
10,234Total Basic Materials 143,000
Communications (14.3%)Advertising (0.1%)
117,581 Interpublic Group of Companies, Inc. 2,42668,766 Omnicom Group, Inc. 5,036
7,462Internet (8.7%)
91,476 Alphabet, Inc. “A”(a) 95,58994,135 Alphabet, Inc. “C”(a) 97,487

125,673 Amazon.com, Inc.(a) $ 188,75714,174 Booking Holdings, Inc.(a) 24,414
276,858 eBay, Inc.(a) 7,77136,237 Expedia Group, Inc. 4,08218,435 F5 Networks, Inc.(a) 2,987
735,086 Facebook, Inc. “A”(a) 96,363133,428 Netflix, Inc.(a) 35,713195,448 Symantec Corp. 3,693
31,473 TripAdvisor, Inc.(a) 1,698221,273 Twitter, Inc.(a) 6,359
32,429 VeriSign, Inc.(a) 4,809569,722
Media (2.3%)103,269 CBS Corp. “B’’ 4,515
53,926 Charter Communications, Inc. “A”(a) 15,3671,389,075 Comcast Corp. “A” 47,298
47,336 Discovery Communications, Inc. “A”(a) 1,171109,936 Discovery Communications, Inc. “C”(a) 2,537
70,118 DISH Network Corp. “A”(a) 1,751118,610 News Corp. “A” 1,346
39,368 News Corp. “B” 455323,415 Twenty-First Century Fox, Inc. “A” 15,563148,714 Twenty-First Century Fox, Inc. “B” 7,106108,103 Viacom, Inc. “B” 2,778455,466 Walt Disney Co. 49,942
149,829Telecommunications (3.2%)
15,927 Arista Networks, Inc.(a) 3,3562,226,731 AT&T, Inc.(b) 63,551
291,998 CenturyLink, Inc. 4,4241,375,794 Cisco Systems, Inc. 59,613
105,692 Juniper Networks, Inc. 2,84450,075 Motorola Solutions, Inc. 5,760
1,264,253 Verizon Communications, Inc.(b) 71,076210,624
Total Communications 937,637
Consumer, Cyclical (8.2%)Airlines (0.4%)
37,686 Alaska Air Group, Inc. 2,293125,793 American Airlines Group, Inc. 4,039190,681 Delta Air Lines, Inc. 9,515
MarketNumber Valueof Shares Security (000)
10 | USAA S&P 500 Index Fund

Portfolio of Investments | 11
154,660 Southwest Airlines Co. $ 7,18970,229 United Continental Holdings, Inc.(a) 5,880
28,916Apparel (0.7%)
111,546 Hanesbrands, Inc. 1,39845,745 Michael Kors Holdings Ltd.(a) 1,735
389,277 NIKE, Inc. “B” 28,86123,303 PVH Corp. 2,16616,677 Ralph Lauren Corp. 1,72558,072 Under Armour, Inc. “A”(a),(c) 1,02658,544 Under Armour, Inc. “C”(a) 94799,335 V.F. Corp. 7,086
44,944Auto Manufacturers (0.4%)
1,196,762 Ford Motor Co. 9,155401,615 General Motors Co. 13,434107,015 PACCAR, Inc. 6,115
28,704Auto Parts & Equipment (0.1%)
80,700 Aptiv plc 4,96964,061 BorgWarner, Inc. 2,22570,736 Goodyear Tire & Rubber Co. 1,444
8,638Distribution/Wholesale (0.2%)
62,779 Copart, Inc.(a) 2,99987,814 Fastenal Co. 4,59297,684 LKQ Corp.(a) 2,31813,986 W.W. Grainger, Inc. 3,949
13,858Home Builders (0.1%)
104,942 D.R. Horton, Inc. 3,63789,501 Lennar Corp. “A” 3,50479,516 PulteGroup, Inc. 2,067
9,208Home Furnishings (0.1%)
39,706 Leggett & Platt, Inc. 1,42319,440 Whirlpool Corp. 2,078
3,501Housewares (0.0%)
130,853 Newell Brands, Inc. 2,433
MarketNumber Valueof Shares Security (000)

Leisure Time (0.2%)122,315 Carnival Corp. $ 6,030
49,483 Harley-Davidson, Inc. 1,68867,723 Norwegian Cruise Line Holdings Ltd.(a) 2,87152,377 Royal Caribbean Cruises Ltd. 5,122
15,711Lodging (0.4%)
90,935 Hilton Worldwide Holdings, Inc. 6,52986,620 Marriott International, Inc. “A” 9,404
153,185 MGM Resorts International 3,71629,795 Wynn Resorts Ltd. 2,947
22,596Retail (5.5%)
22,308 Advance Auto Parts, Inc. 3,5137,715 AutoZone, Inc.(a) 6,468
71,609 Best Buy Co., Inc. 3,79253,226 CarMax, Inc.(a) 3,339
7,482 Chipotle Mexican Grill, Inc.(a) 3,231134,080 Costco Wholesale Corp. 27,313
38,070 Darden Restaurants, Inc. 3,80280,374 Dollar General Corp. 8,68773,004 Dollar Tree, Inc.(a) 6,59435,148 Foot Locker, Inc. 1,87065,551 Gap, Inc. 1,68944,875 Genuine Parts Co. 4,309
345,579 Home Depot, Inc. 59,37750,715 Kohl’s Corp. 3,36469,750 L Brands, Inc. 1,790
245,667 Lowe’s Companies, Inc. 22,69094,018 Macy’s, Inc. 2,800
235,876 McDonald’s Corp. 41,88435,189 Nordstrom, Inc. 1,64024,531 O’Reilly Automotive, Inc.(a) 8,447
114,143 Ross Stores, Inc. 9,497379,581 Starbucks Corp. 24,445
88,357 Tapestry, Inc. 2,982159,569 Target Corp. 10,546
33,253 Tiffany & Co. 2,677378,624 TJX Companies, Inc. 16,940
37,344 Tractor Supply Co. 3,11617,283 Ulta Beauty, Inc.(a) 4,231
245,964 Walgreens Boots Alliance, Inc. 16,807
MarketNumber Valueof Shares Security (000)
12 | USAA S&P 500 Index Fund

Portfolio of Investments | 13
435,572 Walmart, Inc.(b) $ 40,57395,546 Yum! Brands, Inc. 8,783
357,196Textiles (0.0%)
19,146 Mohawk Industries, Inc.(a) 2,239
Toys/Games/Hobbies (0.1%)35,683 Hasbro, Inc. 2,899
103,669 Mattel, Inc.(a),(c) 1,0363,935
Total Consumer, Cyclical 541,879
Consumer, Non-cyclical (22.9%)Agriculture (1.0%)
574,925 Altria Group, Inc. 28,395171,002 Archer-Daniels-Midland Co. 7,006475,642 Philip Morris International, Inc. 31,754
67,155Beverages (1.9%)
51,303 Brown-Forman Corp. “B” 2,4411,172,202 Coca-Cola Co. 55,504
50,719 Constellation Brands, Inc. “A” 8,15757,255 Molson Coors Brewing Co. “B” 3,215
121,891 Monster Beverage Corp.(a) 5,999431,898 PepsiCo, Inc. 47,716
123,032Biotechnology (2.1%)
68,248 Alexion Pharmaceuticals, Inc.(a) 6,645194,960 Amgen, Inc. 37,953
61,644 Biogen, Inc.(a) 18,550214,246 Celgene Corp.(a) 13,731395,813 Gilead Sciences, Inc.(b) 24,758
44,978 Illumina, Inc.(a) 13,49054,027 Incyte Corp.(a) 3,43523,745 Regeneron Pharmaceuticals, Inc.(a) 8,86978,183 Vertex Pharmaceuticals, Inc.(a) 12,956
140,387Commercial Services (2.0%)
133,984 Automatic Data Processing, Inc. 17,56826,519 Cintas Corp. 4,45577,793 Ecolab, Inc. 11,46336,892 Equifax, Inc. 3,436
MarketNumber Valueof Shares Security (000)
27,142 FleetCor Technologies, Inc.(a) $ 5,04127,838 Gartner, Inc.(a) 3,55948,444 Global Payments, Inc. 4,99663,034 H&R Block, Inc. 1,599
110,146 IHS Markit Ltd.(a),(i) 5,28451,041 Moody’s Corp. 7,148
108,605 Nielsen Holdings plc 2,534360,433 PayPal Holdings, Inc.(a) 30,309
44,615 Quanta Services, Inc. 1,34336,999 Robert Half International, Inc. 2,11644,830 Rollins, Inc. 1,61876,831 S&P Global, Inc. 13,05651,272 Total System Services, Inc. 4,16824,804 United Rentals, Inc.(a) 2,54350,393 Verisk Analytics, Inc.(a) 5,495
135,699 Western Union Co. 2,315130,046
Cosmetics/Personal Care (1.5%)265,410 Colgate-Palmolive Co. 15,797139,811 Coty, Inc. “A” 917
67,278 Estee Lauder Companies, Inc. “A” 8,753762,361 Procter & Gamble Co.(b) 70,077
95,544Food (1.3%)
58,959 Campbell Soup Co. 1,945148,612 Conagra Brands, Inc. 3,174182,357 General Mills, Inc. 7,101
42,937 Hershey Co. 4,60283,689 Hormel Foods Corp. 3,57234,807 J.M. Smucker Co. 3,25477,802 Kellogg Co. 4,436
190,274 Kraft Heinz Co. 8,189244,136 Kroger Co. 6,714
44,575 Lamb Weston Holdings, Inc. 3,27937,302 McCormick & Co., Inc. 5,194
444,917 Mondelez International, Inc. “A” 17,810146,216 Sysco Corp. 9,162
90,284 Tyson Foods, Inc. “A” 4,82183,253
Healthcare-Products (3.8%)537,320 Abbott Laboratories 38,864
13,795 ABIOMED, Inc.(a) 4,484
MarketNumber Valueof Shares Security (000)
14 | USAA S&P 500 Index Fund

Portfolio of Investments | 15
22,256 Align Technology, Inc.(a) $ 4,661151,362 Baxter International, Inc. 9,963
82,056 Becton, Dickinson & Co. 18,489423,341 Boston Scientific Corp.(a) 14,961
15,117 Cooper Companies, Inc. 3,847188,665 Danaher Corp. 19,455
68,058 Dentsply Sirona, Inc. 2,53264,044 Edwards Lifesciences Corp.(a) 9,81046,396 Henry Schein, Inc.(a) 3,64382,381 Hologic, Inc.(a) 3,38626,473 IDEXX Laboratories, Inc.(a) 4,92534,938 Intuitive Surgical, Inc.(a) 16,732
410,865 Medtronic plc 37,37243,576 ResMed, Inc. 4,96295,006 Stryker Corp. 14,892
123,176 Thermo Fisher Scientific, Inc. 27,56627,883 Varian Medical Systems, Inc.(a) 3,15962,453 Zimmer Biomet Holdings, Inc. 6,478
250,181Healthcare-Services (2.2%)
79,164 Anthem, Inc. 20,79162,800 Centene Corp.(a) 7,24138,791 DaVita, Inc.(a) 1,99682,207 HCA Healthcare, Inc. 10,23142,007 Humana, Inc. 12,03448,470 Iqvia Holdings, Inc.(a) 5,63130,818 Laboratory Corp. of America Holdings(a) 3,89441,760 Quest Diagnostics, Inc. 3,477
294,322 UnitedHealth Group, Inc. 73,32126,202 Universal Health Services, Inc. “B” 3,05415,256 WellCare Health Plans, Inc.(a) 3,602
145,272Household Products/Wares (0.4%)
26,613 Avery Dennison Corp. 2,39175,310 Church & Dwight Co., Inc. 4,95239,061 Clorox Co. 6,021
105,882 Kimberly-Clark Corp. 12,06425,428
Pharmaceuticals (6.7%)460,231 AbbVie, Inc. 42,429
97,145 Allergan plc 12,98447,951 AmerisourceBergen Corp. 3,567
499,385 Bristol-Myers Squibb Co. 25,958
MarketNumber Valueof Shares Security (000)

91,075 Cardinal Health, Inc. $ 4,062116,222 Cigna Corp. 22,073395,632 CVS Health Corp. 25,922288,461 Eli Lilly & Co. 33,381820,609 Johnson & Johnson 105,899
59,748 McKesson Corp. 6,600795,640 Merck & Co., Inc. 60,795157,983 Mylan N.V.(a) 4,329
52,502 Nektar Therapeutics(a) 1,72638,068 Perrigo Co. plc 1,475
1,768,607 Pfizer, Inc.(b) 77,200147,007 Zoetis, Inc. 12,575
440,975Total Consumer, Non-cyclical 1,501,273
Energy (5.2%)Oil & Gas (4.4%)
154,329 Anadarko Petroleum Corp. 6,766115,527 Apache Corp. 3,033131,978 Cabot Oil & Gas Corp. 2,950584,683 Chevron Corp. 63,608
29,335 Cimarex Energy Co. 1,80861,400 Concho Resources, Inc.(a) 6,311
352,338 ConocoPhillips 21,968142,534 Devon Energy Corp. 3,213
47,201 Diamondback Energy, Inc. 4,375177,469 EOG Resources, Inc. 15,477
1,295,493 Exxon Mobil Corp. 88,34033,001 Helmerich & Payne, Inc. 1,58275,985 Hess Corp. 3,07748,605 HollyFrontier Corp. 2,485
254,418 Marathon Oil Corp. 3,648211,401 Marathon Petroleum Corp. 12,475
59,982 Newfield Exploration Co.(a) 879147,588 Noble Energy, Inc. 2,769231,051 Occidental Petroleum Corp. 14,182130,028 Phillips 66 11,202
52,289 Pioneer Natural Resources Co. 6,877129,817 Valero Energy Corp. 9,732
286,757Oil & Gas Services (0.5%)
157,173 Baker Hughes, a GE Co. 3,379268,117 Halliburton Co. 7,127
MarketNumber Valueof Shares Security (000)
16 | USAA S&P 500 Index Fund

Portfolio of Investments | 17
116,828 National Oilwell Varco, Inc. $ 3,002423,934 Schlumberger Ltd. 15,296130,847 TechnipFMC plc 2,562
31,366Pipelines (0.3%)
580,811 Kinder Morgan, Inc. 8,933125,550 ONEOK, Inc. 6,773370,435 Williams Companies, Inc. 8,168
23,874Total Energy 341,997
Financial (17.6%)Banks (6.4%)
2,792,761 Bank of America Corp.(b) 68,814278,308 Bank of New York Mellon Corp. 13,100235,629 BB&T Corp. 10,207747,246 Citigroup, Inc. 38,902143,147 Citizens Financial Group, Inc. 4,256
49,225 Comerica, Inc. 3,381200,659 Fifth Third Bancorp 4,721
50,110 First Republic Bank 4,354105,830 Goldman Sachs Group, Inc. 17,679325,033 Huntington Bancshares, Inc. 3,874
1,017,546 JPMorgan Chase & Co.(b) 99,333316,583 KeyCorp 4,679
42,973 M&T Bank Corp. 6,151399,888 Morgan Stanley 15,856
67,978 Northern Trust Corp.(d) 5,682141,039 PNC Financial Services Group, Inc. 16,489317,760 Regions Financial Corp. 4,252116,214 State Street Corp. 7,330137,499 SunTrust Banks, Inc. 6,935
16,277 SVB Financial Group(a) 3,091464,936 U.S. Bancorp 21,248
1,296,303 Wells Fargo & Co. 59,73458,390 Zions Bancorp 2,379
422,447Diversified Financial Services (4.0%)
16,050 Affiliated Managers Group, Inc. 1,56414,225 Alliance Data Systems Corp. 2,135
214,359 American Express Co. 20,43342,624 Ameriprise Financial, Inc. 4,449
MarketNumber Valueof Shares Security (000)

37,153 BlackRock, Inc. $ 14,594144,880 Capital One Financial Corp. 10,951
34,338 CBOE Holdings, Inc. 3,359367,723 Charles Schwab Corp. 15,271109,476 CME Group, Inc. 20,595102,783 Discover Financial Services 6,062
77,622 E*trade Financial Corp. 3,40690,889 Franklin Resources, Inc. 2,696
174,430 Intercontinental Exchange, Inc. 13,140127,042 Invesco Ltd. 2,127
85,869 Jefferies Financial Group, Inc. 1,491278,044 Mastercard, Inc. “A” 52,453
35,051 NASDAQ, Inc. 2,85939,445 Raymond James Financial, Inc. 2,935
202,256 Synchrony Financial 4,74573,573 T. Rowe Price Group, Inc. 6,792
537,737 Visa, Inc. “A” 70,949263,006
Insurance (4.2%)232,958 AFLAC, Inc. 10,614105,502 Allstate Corp. 8,718271,236 American International Group, Inc. 10,689
73,600 Aon plc 10,69856,301 Arthur J. Gallagher & Co. 4,14915,859 Assurant, Inc. 1,418
595,231 Berkshire Hathaway, Inc. “B”(a) 121,53436,279 Brighthouse Financial, Inc.(a) 1,106
141,174 Chubb Ltd. 18,23746,331 Cincinnati Financial Corp. 3,58712,372 Everest Re Group Ltd. 2,694
109,934 Hartford Financial Services Group, Inc. 4,88765,108 Lincoln National Corp. 3,34184,198 Loews Corp. 3,833
154,191 Marsh & McLennan Companies, Inc. 12,297301,943 MetLife, Inc. 12,398
80,402 Principal Financial Group, Inc. 3,551178,456 Progressive Corp. 10,766126,350 Prudential Financial, Inc. 10,304
31,350 Torchmark Corp. 2,33781,123 Travelers Companies, Inc. 9,71466,790 Unum Group 1,96239,670 Willis Towers Watson plc 6,024
274,858
MarketNumber Valueof Shares Security (000)
18 | USAA S&P 500 Index Fund

Portfolio of Investments | 19
Real Estate (0.1%)97,336 CBRE Group, Inc. “A”(a) $ 3,897
REITS (2.9%)32,875 Alexandria Real Estate Equities, Inc. 3,789
134,785 American Tower Corp. 21,32247,304 Apartment Investment & Management Co. “A” 2,07642,292 AvalonBay Communities, Inc. 7,36147,253 Boston Properties, Inc. 5,318
126,937 Crown Castle International Corp. 13,78962,947 Digital Realty Trust, Inc. 6,707
109,773 Duke Realty Corp. 2,84324,595 Equinix, Inc. 8,671
112,633 Equity Residential 7,43520,296 Essex Property Trust, Inc. 4,97738,619 Extra Space Storage, Inc. 3,49422,625 Federal Realty Investment Trust 2,671
146,164 HCP, Inc. 4,082227,894 Host Hotels & Resorts, Inc. 3,799
87,570 Iron Mountain, Inc. 2,838128,612 Kimco Realty Corp. 1,884
32,545 Macerich Co. 1,40934,863 Mid-America Apartment Communities, Inc. 3,336
192,766 ProLogis, Inc. 11,31945,899 Public Storage 9,29090,315 Realty Income Corp. 5,69351,960 Regency Centers Corp. 3,04934,674 SBA Communications Corp.(a) 5,61394,635 Simon Property Group, Inc. 15,89826,179 SL Green Realty Corp. 2,07084,476 UDR, Inc. 3,347
109,017 Ventas, Inc. 6,38752,740 Vornado Realty Trust 3,272
114,933 Welltower, Inc. 7,978228,998 Weyerhaeuser Co. 5,006
186,723Savings & Loans (0.0%)
116,176 People’s United Financial, Inc. 1,677Total Financial 1,152,608
Industrial (8.9%)Aerospace/Defense (2.4%)
131,616 Arconic, Inc. 2,219161,597 Boeing Co. 52,115
MarketNumber Valueof Shares Security (000)
85,189 General Dynamics Corp. $ 13,39335,878 Harris Corp. 4,83124,019 L3 Technologies, Inc. 4,17175,716 Lockheed Martin Corp. 19,82553,163 Northrop Grumman Corp. 13,02086,999 Raytheon Co. 13,34114,853 TransDigm Group, Inc.(a) 5,051
248,339 United Technologies Corp. 26,443154,409
Building Materials (0.3%)43,128 Fortune Brands Home & Security, Inc. 1,638
283,395 Johnson Controls International plc 8,40319,184 Martin Marietta Materials, Inc. 3,29793,484 Masco Corp. 2,73440,479 Vulcan Materials Co. 3,999
20,071Electrical Components & Equipment (0.2%)
71,223 AMETEK, Inc. 4,822191,512 Emerson Electric Co. 11,443
16,265Electronics (1.3%)
97,364 Agilent Technologies, Inc. 6,56829,082 Allegion plc 2,31892,253 Amphenol Corp. “A” 7,474
244,993 Corning, Inc. 7,40142,675 FLIR Systems, Inc. 1,85889,924 Fortive Corp. 6,08437,113 Garmin Ltd. 2,350
226,520 Honeywell International, Inc. 29,92857,057 Keysight Technologies, Inc.(a) 3,542
7,639 Mettler-Toledo International, Inc.(a) 4,32134,038 PerkinElmer, Inc. 2,674
104,994 TE Connectivity Ltd. 7,94123,260 Waters Corp.(a) 4,388
86,847Engineering & Construction (0.1%)
43,336 Fluor Corp. 1,39636,355 Jacobs Engineering Group, Inc. 2,125
3,521
MarketNumber Valueof Shares Security (000)
20 | USAA S&P 500 Index Fund

Portfolio of Investments | 21
Environmental Control (0.3%)48,804 Pentair plc $ 1,84466,517 Republic Services, Inc. 4,795
119,815 Waste Management, Inc. 10,66217,301
Hand/Machine Tools (0.1%)17,125 Snap-on, Inc. 2,48846,210 Stanley Black & Decker, Inc. 5,533
8,021Machinery-Construction & Mining (0.3%)
180,542 Caterpillar, Inc. 22,941
Machinery-Diversified (0.7%)45,185 Cummins, Inc. 6,03898,419 Deere & Co. 14,68144,625 Dover Corp. 3,16640,342 Flowserve Corp. 1,53436,908 Rockwell Automation, Inc. 5,55431,647 Roper Technologies, Inc. 8,43555,076 Xylem, Inc. 3,675
43,083Miscellaneous Manufacturers (1.4%)
178,161 3M Co. 33,94743,889 A.O. Smith Corp. 1,874
132,545 Eaton Corp. plc 9,1012,661,375 General Electric Co. 20,147
93,388 Illinois Tool Works, Inc. 11,83175,161 Ingersoll-Rand plc 6,85740,482 Parker-Hannifin Corp. 6,03774,366 Textron, Inc. 3,420
93,214Packaging & Containers (0.2%)
103,719 Ball Corp. 4,76928,922 Packaging Corp. of America 2,41448,133 Sealed Air Corp. 1,67777,394 WestRock Co. 2,922
11,782Shipbuilding (0.0%)
13,199 Huntington Ingalls Industries, Inc. 2,512
MarketNumber Valueof Shares Security (000)

Transportation (1.6%)42,301 C.H. Robinson Worldwide, Inc. $ 3,557
245,430 CSX Corp. 15,24852,770 Expeditors International of Washington, Inc. 3,59374,195 FedEx Corp. 11,97026,708 J.B. Hunt Transport Services, Inc. 2,48531,177 Kansas City Southern 2,97683,314 Norfolk Southern Corp. 12,459
225,420 Union Pacific Corp. 31,160212,650 United Parcel Service, Inc. “B” 20,740
104,188Total Industrial 584,155
Technology (15.5%)Computers (4.9%)
194,957 Accenture plc “A” 27,4911,379,378 Apple, Inc.(b) 217,583
177,204 Cognizant Technology Solutions Corp. “A” 11,24985,817 DXC Technology Co. 4,56344,338 Fortinet, Inc.(a) 3,123
435,324 Hewlett Packard Enterprise Co. 5,751484,249 HP, Inc. 9,908277,950 International Business Machines Corp. 31,594
77,076 NetApp, Inc. 4,59979,590 Seagate Technology plc 3,07188,785 Western Digital Corp. 3,282
322,214Office/Business Equipment (0.0%)
63,109 Xerox Corp. 1,247
Semiconductors (3.7%)269,123 Advanced Micro Devices, Inc.(a) 4,968113,171 Analog Devices, Inc. 9,713300,801 Applied Materials, Inc. 9,848126,506 BROADCOM INC 32,168
1,396,512 Intel Corp. 65,53810,795 IPG Photonics Corp.(a) 1,22346,740 KLA-Tencor Corp. 4,18347,491 Lam Research Corp. 6,46784,574 Maxim Integrated Products, Inc. 4,30172,380 Microchip Technology, Inc.(c) 5,205
342,726 Micron Technology, Inc.(a) 10,875186,650 NVIDIA Corp. 24,918
MarketNumber Valueof Shares Security (000)
22 | USAA S&P 500 Index Fund

Portfolio of Investments | 23
38,315 Qorvo, Inc.(a) $ 2,327370,922 QUALCOMM, Inc. 21,109
54,338 Skyworks Solutions, Inc. 3,642293,943 Texas Instruments, Inc. 27,778
77,456 Xilinx, Inc. 6,597240,860
Software (6.9%)233,458 Activision Blizzard, Inc. 10,872149,409 Adobe Systems, Inc.(a) 33,802
49,865 Akamai Technologies, Inc.(a) 3,04625,561 ANSYS, Inc.(a) 3,65467,009 Autodesk, Inc.(a) 8,61835,764 Broadridge Financial Solutions, Inc. 3,44286,306 Cadence Design Systems, Inc.(a) 3,753
101,100 Cerner Corp.(a) 5,30239,318 Citrix Systems, Inc. 4,02992,629 Electronic Arts, Inc.(a) 7,309
100,287 Fidelity National Information Services, Inc. 10,284121,990 Fiserv, Inc.(a) 8,965
79,402 Intuit, Inc. 15,63023,504 Jack Henry & Associates, Inc. 2,974
2,364,845 Microsoft Corp.(b) 240,19726,861 MSCI INC 3,960
779,662 Oracle Corp. 35,20297,720 Paychex, Inc. 6,36654,051 Red Hat, Inc.(a) 9,494
234,050 salesforce.com, Inc.(a) 32,05845,644 Synopsys, Inc.(a) 3,84534,906 Take-Two Interactive Software, Inc.(a) 3,593
456,395Total Technology 1,020,716
Utilities (3.3%)Electric (3.2%)
202,629 AES Corp. 2,93072,623 Alliant Energy Corp. 3,06874,583 Ameren Corp. 4,865
150,860 American Electric Power Co., Inc. 11,275153,423 CenterPoint Energy, Inc. 4,331
86,858 CMS Energy Corp. 4,31395,040 Consolidated Edison, Inc. 7,267
200,881 Dominion Energy, Inc. 14,35555,720 DTE Energy Co. 6,146
MarketNumber Valueof Shares Security (000)

218,078 Duke Energy Corp. $ 18,82099,706 Edison International 5,66055,401 Entergy Corp. 4,76880,574 Evergy, Inc. 4,57496,982 Eversource Energy 6,308
295,837 Exelon Corp. 13,342148,726 FirstEnergy Corp. 5,585146,245 NextEra Energy, Inc. 25,420
88,727 NRG Energy, Inc. 3,514159,305 PG&E Corp.(a) 3,784
34,318 Pinnacle West Capital Corp. 2,924220,317 PPL Corp. 6,242154,447 Public Service Enterprise Group, Inc. 8,039
43,645 SCANA Corp. 2,08583,754 Sempra Energy 9,061
314,748 Southern Co. 13,82496,638 WEC Energy Group, Inc. 6,693
157,272 Xcel Energy, Inc. 7,749206,942
Gas (0.0%)110,451 NiSource, Inc. 2,800
Water (0.1%)55,349 American Water Works Co., Inc. 5,024
Total Utilities 214,766Total Common Stocks (Cost: $3,231,122) 6,438,031
MONEY MARKET INSTRUMENTS (1.8%)
GOVERNMENT & U.S. TREASURY MONEY MARKET FUNDS (1.6%)107,118,552 Northern Institutional Funds - U.S. Government
Portfolio, 2.22%(e),(f) 107,119
PrincipalAmount Coupon(000) Rate Maturity
U.S. TREASURY SECURITIES (0.2%)Bills
$12,955 U.S. Treasury Bill(g),(h) 2.03% 1/10/19 12,948Total Money Market Instruments (Cost: $120,067) 120,067
MarketNumber Valueof Shares Security (000)
24 | USAA S&P 500 Index Fund

Portfolio of Investments | 25
SHORT-TERM INVESTMENTS PURCHASED WITH CASH COLLATERAL FROM SECURITIES LOANED (0.1%)
GOVERNMENT & U.S. TREASURY MONEY MARKET FUNDS (0.1%)588,326 Goldman Sachs Financial Square Government Fund
Institutional Class, 2.36%(e) $ 5896,465,320 Invesco Government & Agency Portfolio Institutional Class, 2.30%(e) 6,465
Total Short-Term Investments Purchased With Cash Collateral From Securities Loaned (Cost: $7,054) 7,054
Total Investments (Cost: $3,358,243) $6,565,152
Unrealized Notional Contract Appreciation/
Number of Expiration Amount Value (Depreciation) Contracts Date (000) (000) (000)
FUTURES (1.9%)
LONG FUTURES
Equity Contracts999 E-mini S&P 500 Index
Futures(i) 3/15/2019 130,336 USD $125,135 $(5,201)
Total Futures $125,135 $(5,201)
MarketNumber Valueof Shares Security (000)

($ in 000s) VALUATION HIERARCHY
Assets LEVEL 1 LEVEL 2 LEVEL 3 Total
Equity Securities:Common stocks $6,438,031 $ – $– $6,438,031
Money Market Instruments:Government & U.S. Treasury
Money Market Funds 107,119 – – 107,119U.S. Treasury Securities – 12,948 – 12,948
Short-Term Investments Purchased WithCash Collateral From Securities Loaned:Government & U.S. Treasury Money
Market Funds 7,054 – – 7,054
Total $6,552,204 $12,948 $– $6,565,152
Liabilities LEVEL 1 LEVEL 2 LEVEL 3 Total
Futures(1) $ (5,201) $ – $– $ (5,201)
Total $ (5,201) $ – $– $ (5,201)
(1) Futures are valued at the unrealized appreciation/(depreciation) on the investment.
Refer to the Portfolio of Investments for additional industry, country, or geographic regionclassifications.
The Portfolio of Investments uses the Bloomberg Industry Classification System (BICS), which may differfrom the Fund’s compliance classification.
At December 31, 2018, the Fund did not have any transfers into/out of Level 3.
26 | USAA S&P 500 Index Fund

Notes to Portfolio of Investments | 27
NOTES TO PORTFOLIOOF INVESTMENTSDecember 31, 2018
■ GENERAL NOTES
Market values of securities are determined by procedures and practicesdiscussed in Note 1A to the financial statements.
The Portfolio of Investments category percentages shown represent thepercentages of the investments to net assets, and, in total, may not equal100%. A category percentage of 0.0% represents less than 0.1% of netassets.
■ PORTFOLIO ABBREVIATIONS AND DESCRIPTIONS
REITS Real estate investment trusts – Dividend distributions fromREITs may be recorded as income and later characterized bythe REIT at the end of the fiscal year as capital gains or areturn of capital. Thus, the Fund will estimate the componentsof distributions from these securities and revise when actualdistributions are known.
■ SPECIFIC NOTES
(a) Non-income-producing security.
(b) Security, or a portion thereof, is segregated to cover the value ofopen futures contracts at December 31, 2018.
(c) The security, or a portion thereof, was out on loan as ofDecember 31, 2018.
(d) Northern Trust Corp. is the parent to Northern Trust Investments,Inc. (NTI), which is the subadviser of the Fund.

(e) Rate represents the money market fund annualized seven-day yield atDecember 31, 2018.
(f) NTI is both the subadviser of the Fund and the adviser of theNorthern Institutional Funds – U.S. Government Portfolio.
(g) Rate represents an annualized yield at time of purchase, not acoupon rate.
(h) Security with a value of $12,948,000 is segregated as collateral forinitial margin requirements on open futures contracts.
(i) Security deemed illiquid by USAA Asset Management Company,under liquidity guidelines approved by USAA Mutual Funds Trust’sBoard of Trustees.
See accompanying notes to financial statements.
28 | USAA S&P 500 Index Fund

STATEMENT OF ASSETS AND LIABILITIES(IN THOUSANDS)
December 31, 2018
Financial Statements | 29
ASSETSInvestments in securities, at market value (including securities
on loan of $6,918) (cost of $3,358,243) $6,565,152Receivables:
Capital shares sold 5,018USAA Asset Management Company (Note 7) 249USAA Transfer Agency Company (Note 7) 15Dividends and interest 7,695Securities sold 1,944Other 17
Variation margin on futures contracts 980Total assets 6,581,070
LIABILITIESPayables:
Upon return of securities loaned 7,054Securities purchased 4,354Capital shares redeemed 4,045
Accrued management fees 591Accrued administration and servicing fees 11Accrued transfer agent’s fees 98Other accrued expenses and payables 177
Total liabilities 16,330Net assets applicable to capital shares outstanding $6,564,740
NET ASSETS CONSIST OF:Paid-in capital $3,351,929Distributable earnings 3,212,811
Net assets applicable to capital shares outstanding $6,564,740Net asset value, redemption price, and offering price per share:
Member Shares (net assets of $2,957,995/83,975 capital shares outstanding, no par value) $ 35.22
Reward Shares (net assets of $3,606,745/102,356 capital shares outstanding, no par value) $ 35.24
See accompanying notes to financial statements.

STATEMENT OF OPERATIONS(IN THOUSANDS)
Year ended December 31, 2018
30 | USAA S&P 500 Index Fund
INVESTMENT INCOMEDividends $ 141,236Interest 1,646Other (Note 7) 5Securities lending (net) 116
Total income 143,003EXPENSES
Management fees 7,152Administration and servicing fees:
Member Shares 1,964Reward Shares 2,327
Transfer agent’s fees:Member Shares 2,823Reward Shares 328
Custody and accounting fees:Member Shares 36Reward Shares 39
Postage:Member Shares 135Reward Shares 16
Shareholder reporting fees:Member Shares 90Reward Shares 13
Trustees’ fees 33Registration fees:
Member Shares 83Reward Shares 117
Professional fees 170Other 153
Total expenses 15,479

Expenses reimbursed:Member Shares $ (379)Reward Shares (1,093)
Net expenses 14,007NET INVESTMENT INCOME 128,996NET REALIZED AND UNREALIZED GAIN (LOSS) ON INVESTMENTS AND FUTURES CONTRACTS
Net realized gain (loss) on:Investments 103,477Futures transactions (6,013)
Change in net unrealized appreciation/(depreciation) of:Investments (535,048)Futures contracts (5,837)
Net realized and unrealized loss (443,421)
Decrease in net assets resulting from operations $(314,425)
See accompanying notes to financial statements.
Financial Statements | 31

32 | USAA S&P 500 Index Fund
STATEMENTS OF CHANGES IN NET ASSETS(IN THOUSANDS)
Years ended December 31,
2018 2017
FROM OPERATIONSNet investment income $ 128,996 $ 112,603Net realized gain (loss) on investments 103,477 (1,403)Net realized gain (loss) on futures transactions (6,013) 14,449Change in net unrealized appreciation/(depreciation) of:
Investments (535,048) 1,123,674Futures contracts (5,837) 863Increase (decrease) in net assets resulting from operations (314,425) 1,250,186
DISTRIBUTIONS TO SHAREHOLDERS FROM DISTRIBUTABLE EARNINGS:
Member Shares (88,990) (54,407)Reward Shares (110,893) (60,181)
Distributions to shareholders (199,883) (114,588)
NET INCREASE (DECREASE) IN NET ASSETS FROM CAPITAL SHARE TRANSACTIONS (NOTE 6)
Member Shares (106,262) (235,826)Reward Shares 263,209 49,033
Total net increase (decrease) in net assets from capital share transactions 156,947 (186,793)
Capital contribution from USAA Transfer Agency Company (Note 7) 15 –
Net increase (decrease) in net assets (357,346) 948,805
NET ASSETSBeginning of year 6,922,086 5,973,281
End of year $6,564,740 $6,922,086
See accompanying notes to financial statements.

Notes to Financial Statements | 33
NOTES TO FINANCIAL STATEMENTSDecember 31, 2018
(1) SUMMARY OF SIGNIFICANT ACCOUNTING POLICIESUSAA MUTUAL FUNDS TRUST (the Trust), registered under theInvestment Company Act of 1940, as amended (the 1940 Act), is an open-endmanagement investment company organized as a Delaware statutory trustconsisting of 47 separate funds. The USAA S&P 500 Index Fund (the Fund)qualifies as a registered investment company under Accounting StandardsCodification Topic 946. The information presented in this annual reportpertains only to the Fund, which is classified as diversified under the 1940Act. The Fund seeks to match, before fees and expenses, the performance ofthe stocks composing the S&P 500 Index. The S&P 500 Index emphasizesstocks of large U.S. companies. USAA Asset Management Company (theManager), an affiliate of the Fund, has retained Northern Trust Investments,Inc. (NTI) to serve as subadviser for the Fund. NTI is responsible forinvesting the Fund’s assets. Under normal market conditions, NTI attempts toachieve the Fund’s objective by investing at least 80% of the Fund’s assets inthe common stocks of companies composing the S&P 500 Index.
The Fund consists of two classes of shares: Member Shares and RewardShares. Each class of shares has equal rights to assets and earnings, except thateach class bears certain class-related expenses specific to the particular class.These expenses include administration and servicing fees, transfer agency fees,postage, shareholder reporting fees, and certain registration and custodian fees.Expenses not attributable to a specific class, income, and realized gains or losseson investments are allocated to each class of shares based on each class’ relativenet assets. Each class has exclusive voting rights on matters related solely to thatclass and separate voting rights on matters that relate to both classes. TheReward Shares are currently offered for sale to qualified shareholders, USAAdiscretionary managed account program, and a USAA Fund participating in afund-of-funds investment strategy (USAA fund-of-funds).

34 | USAA S&P 500 Index Fund
On November 6, 2018, United Services Automobile Association (USAA),the parent company of USAA Asset Management Company (AMCO orManager), the investment adviser to the Fund, and USAA Transfer AgencyCompany, d/b/a USAA Shareholder Account Services (SAS), the transferagent to the Fund, announced that AMCO and SAS would be acquired byVictory Capital Holdings, Inc. (Victory), a global investment managementfirm headquartered in Cleveland, Ohio (the Transaction). The closing of theTransaction is expected to be completed during the second quarter of 2019,pending satisfaction of certain closing conditions and approvals, includingcertain approvals of the Fund’s Board of Trustees and of the Fund’sshareholders at a special shareholder meeting to be held in 2019. Inconnection with the Transaction, the index tracked by the Fund is beingchanged to a to a custom index published by Wilshire Associates, Inc. Thenew index, Victory US Large Cap 500 Index, is intended to be a comparableindex in terms of market cap exposure, return, and risk profile to the existingS&P 500 Index. The name of the Fund will also change to “USAA 500 IndexFund.” Additionally, the investment objective and principal investmentstrategies will change to reflect the change in index. Additionally, the Fund’ssubadviser, NTI, is expected to be terminated and the Fund managed internally.
A. Security valuation – The Trust’s Board of Trustees (the Board) hasestablished the Valuation and Liquidity Committee (the Committee),and subject to Board oversight, the Committee administers and overseesthe Fund’s valuation policies and procedures, which are approved by theBoard. The Fund utilizes independent pricing services, quotations fromsecurities dealers, and a wide variety of sources and information toestablish and adjust the fair value of securities as events occur andcircumstances warrant.
The value of each security is determined (as of the close of trading onthe New York Stock Exchange (NYSE) on each business day the NYSEis open) as set forth below:
1. Equity securities, including exchange-traded funds (ETFs), except asotherwise noted, traded primarily on a domestic securities exchangeor the over-the-counter markets, are valued at the last sales price orofficial closing price on the exchange or primary market on whichthey trade. Securities traded primarily on foreign securities exchanges

Notes to Financial Statements | 35
or markets are valued at the last quoted sale price, or the most recentlydetermined official closing price calculated according to local marketconvention, available at the time the Fund is valued. If no last sale orofficial closing price is reported or available, the average of the bidand ask prices generally is used. Actively traded equity securitieslisted on a domestic exchange generally are categorized in Level 1of the fair value hierarchy. Certain preferred and equity securitiestraded in inactive markets generally are categorized in Level 2 of thefair value hierarchy.
2. Investments in open-end investment companies, commingled, orother funds, other than ETFs, are valued at their net asset value(NAV) at the end of each business day and are categorized in Level 1of the fair value hierarchy.
3. Futures are valued at the settlement price at the close of market onthe principal exchange on which they are traded or, in the absence ofany transactions that day, the settlement price on the prior tradingdate if it is within the spread between the closing bid and ask priceclosest to the last reported sale price.
4. Short-term debt securities with original or remaining maturities of60 days or less may be valued at amortized cost, provided thatamortized cost represents the fair value of such securities.
5. Debt securities with maturities greater than 60 days are valued eachbusiness day by a pricing service (the Service) approved by the Board.The Service uses an evaluated mean between quoted bid and askprices or the last sales price to value a security when, in the Service’sjudgment, these prices are readily available and are representative ofthe security’s market value. For many securities, such prices are notreadily available. The Service generally prices those securities based onmethods which include consideration of yields or prices of securitiesof comparable quality, coupon, maturity, and type; indications as tovalues from dealers in securities; and general market conditions.Generally, debt securities are categorized in Level 2 of the fair valuehierarchy; however, to the extent the valuations include significantunobservable inputs, the securities would be categorized in Level 3.

36 | USAA S&P 500 Index Fund
6. Repurchase agreements are valued at cost.
7. In the event that price quotations or valuations are not readilyavailable, are not reflective of market value, or a significant event hasbeen recognized in relation to a security or class of securities, thesecurities are valued in good faith by the Committee in accordancewith valuation procedures approved by the Board. The effect of fairvalue pricing is that securities may not be priced on the basis ofquotations from the primary market in which they are traded andthe actual price realized from the sale of a security may differmaterially from the fair value price. Valuing these securities at fairvalue is intended to cause the Fund’s NAV to be more reliable than itotherwise would be.
Fair value methods used by the Manager include, but are not limitedto, obtaining market quotations from secondary pricing services,broker-dealers, other pricing services, or widely used quotationsystems. General factors considered in determining the fair value ofsecurities include fundamental analytical data, the nature and durationof any restrictions on disposition of the securities, evaluation of creditquality, and an evaluation of the forces that influenced the market inwhich the securities are purchased and sold.
B. Fair value measurements – Fair value is defined as the price that wouldbe received to sell an asset or paid to transfer a liability in an orderlytransaction between market participants at the measurement date. Thethree-level valuation hierarchy disclosed in the Portfolio of Investmentsis based upon the transparency of inputs to the valuation of an asset orliability as of the measurement date. The three levels are defined as follows:
Level 1 – inputs to the valuation methodology are quoted prices(unadjusted) in active markets for identical securities.
Level 2 – inputs to the valuation methodology are other significantobservable inputs, including quoted prices for similar securities, inputsthat are observable for the securities, either directly or indirectly, andmarket-corroborated inputs such as market indexes.
Notes to Financial Statements | 37
Level 3 – inputs to the valuation methodology are unobservable andsignificant to the fair value measurement, including the Manager’s ownassumptions in determining the fair value.
The inputs or methodologies used for valuing securities are notnecessarily an indication of the risks associated with investing in thosesecurities.
C. Derivative instruments and hedging activities – The Fund may buy, sell,and enter into certain types of derivatives, including, but not limited to,futures contracts, options, and options on futures contracts, undercircumstances in which such instruments are expected by the portfoliomanager to aid in achieving the Fund’s investment objective. The Fundalso may use derivatives in circumstances where the portfolio managerbelieves they offer an economical means of gaining exposure to aparticular asset class or securities market or to keep cash on hand to meetshareholder redemptions or other needs while maintaining exposure to themarket. With exchange-listed futures contracts and options, counterpartycredit risk to the Fund is limited to the exchange’s clearinghouse which, ascounterparty to all exchange-traded futures contracts and options,guarantees the transactions against default from the actual counterpartyto the transaction. The Fund’s derivative agreements held at December 31,2018, did not include master netting provisions.
Futures contracts – The Fund is subject to cash flow and tracking error riskin the normal course of pursuing its investment objectives. The Fund mayuse stock index futures contracts in an attempt to reduce any performancediscrepancies between the Fund and the S&P 500 Index. A futures contractrepresents a commitment for the future purchase or sale of an asset at aspecified price on a specified date. Upon entering into such contracts, theFund is required to deposit with the broker in either cash or securities aninitial margin in an amount equal to a certain percentage of the contractamount. Subsequent payments (variation margin) are made or received bythe Fund each day, depending on the daily fluctuations in the value of thecontract, and are recorded for financial statement purposes as unrealizedgains or losses. When the contract is closed, the Fund records a realizedgain or loss equal to the difference between the value of the contract at the
38 | USAA S&P 500 Index Fund
time it was opened and the value at the time it was closed. Upon enteringinto such contracts, the Fund bears the risk of interest or exchange rates orsecurities prices moving unexpectedly in an unfavorable direction, in whichcase, the Fund may not achieve the anticipated benefits of the futurescontracts.
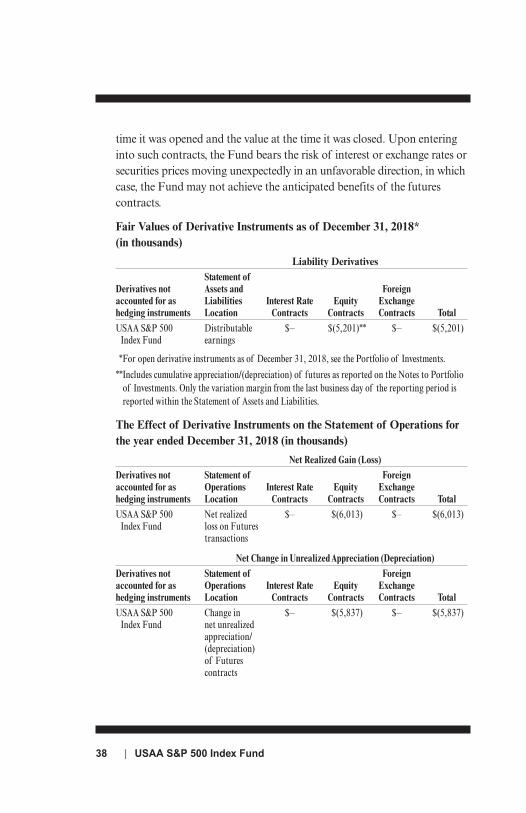
Fair Values of Derivative Instruments as of December 31, 2018*
(in thousands)
Liability Derivatives
Statement of Derivatives not Assets and Foreign accounted for as Liabilities Interest Rate Equity Exchange hedging instruments Location Contracts Contracts Contracts TotalUSAA S&P 500 Distributable $– $(5,201)** $– $(5,201)
Index Fund earnings
*For open derivative instruments as of December 31, 2018, see the Portfolio of Investments.
**Includes cumulative appreciation/(depreciation) of futures as reported on the Notes to Portfolioof Investments. Only the variation margin from the last business day of the reporting period isreported within the Statement of Assets and Liabilities.
The Effect of Derivative Instruments on the Statement of Operations for
the year ended December 31, 2018 (in thousands)
Net Realized Gain (Loss)Derivatives not Statement of Foreign accounted for as Operations Interest Rate Equity Exchange hedging instruments Location Contracts Contracts Contracts TotalUSAA S&P 500 Net realized $– $(6,013) $– $(6,013)
Index Fund loss on Futures transactions
Net Change in Unrealized Appreciation (Depreciation)Derivatives not Statement of Foreign accounted for as Operations Interest Rate Equity Exchange hedging instruments Location Contracts Contracts Contracts TotalUSAA S&P 500 Change in $– $(5,837) $– $(5,837)
Index Fund net unrealized appreciation/ (depreciation) of Futures contracts

Notes to Financial Statements | 39
D. Federal taxes – The Fund’s policy is to comply with the requirements ofthe Internal Revenue Code of 1986, as amended, applicable to regulatedinvestment companies and to distribute substantially all of its taxableincome and net capital gains, if any, to its shareholders. Therefore, nofederal income tax provision is required.
For the year ended December 31, 2018, the Fund did not incur any incometax, interest, or penalties, and has recorded no liability for net unrecognizedtax benefits relating to uncertain income tax positions. On an ongoingbasis, the Manager will monitor the Fund’s tax basis to determine ifadjustments to this conclusion are necessary. The statute of limitations onthe Fund’s tax return filings generally remain open for the three precedingfiscal reporting year ends and remain subject to examination by the InternalRevenue Service and state taxing authorities.
E. Investments in securities – Securities transactions are accounted for as ofthe date the securities are purchased or sold (trade date). Gains or lossesfrom sales of investment securities are computed on the identified costbasis. Dividend income, less foreign taxes, if any, is recorded on the ex-dividend date. If the ex-dividend date has passed, certain dividends fromforeign securities are recorded upon notification. Interest income isrecorded daily on the accrual basis. Premiums and discounts on short-termsecurities are amortized on a straight-line basis over the life of therespective securities.
F. Indemnifications – Under the Trust’s organizational documents, its officersand trustees are indemnified against certain liabilities arising out of theperformance of their duties to the Trust. In addition, in the normal courseof business, the Trust enters into contracts that contain a variety ofrepresentations and warranties that provide general indemnifications. TheTrust’s maximum exposure under these arrangements is unknown, as thiswould involve future claims that may be made against the Trust that havenot yet occurred. However, the Trust expects the risk of loss to be remote.
G. Use of estimates – The preparation of financial statements in conformitywith U.S. generally accepted accounting principles requires managementto make estimates and assumptions that may affect the reported amountsin the financial statements.

40 | USAA S&P 500 Index Fund
(2) LINE OF CREDITThe Fund participates, along with other funds of the Trust and USAA ETFTrust (together, the Trusts), in a joint, short-term, revolving, committed loanagreement of $500 million with USAA Capital Corporation (CAPCO), anaffiliate of the Manager. The purpose of the agreement is to provide temporaryor emergency cash needs, including redemption requests that might otherwiserequire the untimely disposition of securities. Subject to availability (includingusage of the facility by other funds of the Trusts), the Fund may borrow fromCAPCO an amount up to 5% of the Fund’s total assets at an interest rate basedon the London Interbank Offered Rate (LIBOR), plus 100.0 basis points.
The Trusts are also assessed facility fees by CAPCO in the amount of 14.0 basispoints of the amount of the committed loan agreement. Prior to September 30,2018, the maximum annual facility fee was 13.0 basis points of the amount ofthe committed loan agreement. The facility fees are allocated among the fundsof the Trusts based on their respective average daily net assets for the period.
The Trusts may request an optional increase of the committed loanagreement from $500 million up to $750 million. If the Trusts increase thecommitted loan agreement, the assessed facility fee on the amount of theadditional commitment will be 15.0 basis points.
For the year ended December 31, 2018, the Fund paid CAPCO facility feesof $56,000, which represents 8.6% of the total fees paid to CAPCO by thefunds of the Trusts. The Fund had no borrowings under this agreementduring the year ended December 31, 2018.
(3) DISTRIBUTIONSThe character of any distributions made during the year from net investmentincome or net realized gains is determined in accordance with federal taxregulations and may differ from those determined in accordance with U.S.generally accepted accounting principles. Also, due to the timing ofdistributions, the fiscal year in which amounts are distributed may differfrom the year that the income or realized gains were recorded by the Fund.
During the current fiscal year, permanent differences between book-basis andtax-basis accounting for non-REIT return of capital dividend, REIT return

Notes to Financial Statements | 41
of capital dividend, REIT capital gain dividend, equalization, and additionaladjustments resulted in reclassifications to the Statement of Assets andLiabilities to decrease accumulated undistributed net investment income by$2,036,000, increase accumulated net realized gain on investments by $185,000,and increase in paid in capital by $1,851,000. These reclassifications had noeffect on net assets.
The tax character of distributions paid during the years ended December 31,2018, and 2017, was as follows:
2018 2017
Ordinary income* $133,314,000 $114,588,000Long-term realized capital gain 66,569,000 –
Total distributions paid $199,883,000 $114,588,000
As of December 31, 2018, the components of net assets representingdistributable earnings on a tax basis were as follows:
Undistributed ordinary income* $ 4,072,000Undistributed long-term capital gains 22,152,000Unrealized appreciation of investments 3,186,587,000
* Includes short-term realized capital gains, if any, which are taxable as ordinary income.
The difference between book-basis and tax-basis unrealized appreciation ofinvestments is attributable to the tax deferral of losses on wash sales, REITreturn of capital dividend, and non-REIT return of capital dividendadjustments.
Distributions of net investment income are made quarterly. Distributions ofrealized gains from security transactions not offset by capital losses are madeannually in the succeeding fiscal year or as otherwise required to avoid thepayment of federal taxes.
At December 31, 2018, the Fund had no capital loss carryforwards, forfederal income tax purposes.

42 | USAA S&P 500 Index Fund
Tax Basis of Investments – At December 31, 2018, the aggregate cost ofinvestments for federal income tax purposes and net unrealized appreciation/(depreciation) on investments are disclosed below:
Gross Gross Net UnrealizedUnrealized Unrealized Appreciation/
Fund Tax Cost Appreciation Depreciation (Depreciation)
USAA S&P 500 Index Fund $3,378,565,000 $3,399,653,000 $(213,066,000) $3,186,587,000
(4) INVESTMENT TRANSACTIONSCost of purchases and proceeds from sales/maturities of securities, excludingshort-term securities, for the year ended December 31, 2018, were$287,339,000 and $283,664,000, respectively.
(5) SECURITIES LENDINGThe Fund, through a securities lending agreement with Citibank, N.A.(Citibank), may lend its securities to qualified financial institutions, such ascertain broker-dealers, to earn additional income, net of income retained byCitibank. The borrowers are required to secure their loans continuously withcollateral in an amount at least equal to 102% of the fair value of domesticsecurities and foreign government securities loaned and 105% of the fair valueof foreign securities and all other securities loaned. Collateral may be cash,U.S. government securities, or other securities as permitted by SEC guidelines.Cash collateral may be invested in high-quality short-term investments.Collateral requirements are determined daily based on the value of the Fund’ssecurities on loan as of the end of the prior business day. Loans are terminableupon demand and the borrower must return the loaned securities within thelesser of one standard settlement period or five business days. Risks relating tosecurities-lending transactions include that the borrower may not provideadditional collateral when required or return the securities when due, and thatthe value of the short-term investments will be less than the amount of cashcollateral required to be returned to the borrower. The Fund’s agreement withCitibank does not include master netting provisions. Non-cash collateralreceived by the Fund may not be sold or re-pledged except to satisfy borrowerdefault. Cash collateral is listed in the Fund’s Portfolio of Investments andFinancial Statements while non-cash collateral is not included.

Notes to Financial Statements | 43
At December 31, 2018, the Fund’s value of outstanding securities on loan andthe value of collateral are as follows:
Value of Securities on Loan Non-Cash Collateral Cash Collateral
$6,918,000 $– $7,054,000
(6) CAPITAL SHARE TRANSACTIONSAt December 31, 2018, there were an unlimited number of shares of capitalstock at no par value authorized for the Fund.
Capital share transactions for all classes were as follows, in thousands:
Year Ended Year Ended December 31, 2018 December 31, 2017 Shares Amount Shares AmountMember Shares:Shares sold 14,167 $ 551,000 13,887 $ 481,857Shares issued from reinvested
dividends 2,341 87,909 1,518 53,682Shares redeemed (19,008) (745,171) (22,063) (771,365)Net decrease from
capital share transactions (2,500) $(106,262) (6,658) $(235,826)
Reward Shares:Shares sold 15,303 $ 600,865 17,379 $ 608,487Shares issued from reinvested
dividends 2,831 106,388 1,634 57,877Shares redeemed (11,444) (444,044) (17,974) (617,331)Net increase from capital share
transactions 6,690 $ 263,209 1,039 $ 49,033
(7) TRANSACTIONS WITH MANAGERManagement fees – The Manager provides investment management servicesto the Fund pursuant to a Management Agreement. Under this agreement,the Manager is responsible for managing the business and affairs of theFund. The Manager also is authorized to select (with approval of the Boardand without shareholder approval) one or more subadvisers to manage theday-to-day investment of all or a portion of the Fund’s assets.

44 | USAA S&P 500 Index Fund
The Manager monitors each subadviser’s performance through quantitativeand qualitative analysis and periodically reports to the Board as to whethereach subadviser’s agreement should be renewed, terminated, or modified.The Manager is also responsible for determining the asset allocation for thesubadviser(s). The allocation for each subadviser could range from 0% to 100%of the Fund’s assets, and the Manager could change the allocations withoutshareholder approval.
The Fund’s management fees are accrued daily and paid monthly at anannualized rate of 0.10% of the Fund’s average daily net assets. For the yearended December 31, 2018, the Fund incurred management fees, paid orpayable to the Manager, of $7,152,000.
Subadvisory arrangement(s) – The Manager has entered into an InvestmentSubadvisory Agreement with NTI, under which NTI directs the investmentand reinvestment of the Fund’s assets (as allocated from time to time by theManager). This arrangement provides for monthly fees that are paid by theManager.
The Manager (not the Fund) pays NTI a subadvisory fee in an annual amountof 0.02% of the Fund’s average daily net assets on amounts up to $1.5 billion;0.01% of the Fund’s average daily net assets for the next $1.5 billion; and0.005% of the Fund’s average daily net assets that exceed $3 billion. For theyear ended December 31, 2018, the Manager incurred subadvisory fees withrespect to the Fund, paid or payable to NTI, of $658,000.
NTI has agreed to remit to the Fund all subadvisory fees earned on Fundassets invested in any of NTI’s affiliated money market funds. For the yearended December 31, 2018, NTI remitted $5,000 to the Fund for theinvestments in the Northern Institutional Funds Money Market Portfolios.
NTI is a subsidiary of The Northern Trust Company, the Fund’s custodianand accounting agent.
Administration and servicing fees – The Manager provides certainadministration and servicing functions for the Fund. For such services, theManager receives a fee accrued daily and paid monthly at an annualized rateof 0.06% of the Fund’s average daily net assets for the fiscal year. For theyear ended December 31, 2018, the Member Shares and Reward Shares

Notes to Financial Statements | 45
incurred administration and servicing fees, paid or payable to the Manager,of $1,964,000 and $2,327,000, respectively.
In addition to the services provided under its Administration and ServicingAgreement with the Fund, the Manager also provides certain complianceand legal services for the benefit of the Fund. The Board has approved thereimbursement of a portion of these expenses incurred by the Manager. Forthe year ended December 31, 2018, the Fund reimbursed the Manager$67,000 for these compliance and legal services. These expenses are includedin the professional fees on the Fund’s Statement of Operations.
Expense limitation – The Manager agreed through April 30, 2019, to limit thetotal annual operating expenses of the Member Shares and the Reward Sharesto 0.25% and 0.15%, respectively, of their average daily net assets, excludingextraordinary expenses and before reductions of any expenses paid indirectly,and to reimburse the Fund for all expenses in excess of those amounts. Thisexpense limitation arrangement may not be changed or terminated throughApril 30, 2019, without approval of the Board, and may be changed orterminated by the Manager at any time after that date. For the year endedDecember 31, 2018, the Fund incurred reimbursable expenses from theManager for the Member Shares and the Reward Shares of $379,000 and$1,093,000, respectively, of which $249,000 was receivable from the Manager.
In addition, NTI has contractually agreed to reimburse the Fund for alllicense fees paid by the Fund to Standard & Poor’s, in amounts not exceedingthe annual rate of 0.001% of the average daily net assets of the Fund. For theyear ended December 31, 2018, the Fund incurred reimbursable expensesfrom NTI for the Member Shares and the Reward Shares of $35,000 and$37,000, respectively.
Transfer agent’s fees – USAA Transfer Agency Company, d/b/a USAAShareholder Account Services (SAS), an affiliate of the Manager, providestransfer agent services to the Fund based on an annual charge of $20 pershareholder account plus out-of-pocket expenses. SAS pays a portion of thesefees to certain intermediaries for the administration and servicing of accountsthat are held with such intermediaries. For the year ended December 31, 2018,the Fund incurred transfer agent’s fees, paid or payable to SAS for theMember Shares and Reward Shares, of $2,823,000 and $328,000, respectively.

46 | USAA S&P 500 Index Fund
Additionally, the Fund’s Reward Shares recorded a capital contribution andreceivable from SAS of $15,000 at December 31, 2018, for adjustmentsrelated to corrections to certain shareholder transactions.
Underwriting services – USAA Investment Management Company providesexclusive underwriting and distribution of the Fund’s shares on a continuingbest-efforts basis and receives no fee or other compensation for these services.
Account maintenance fee – SAS assesses a $10 annual account maintenancefee to the Member Shares to allocate part of the fixed cost of maintainingshareholder accounts. This fee is charged directly to the shareholders’accounts and does not impact the Fund. The fee is waived on accounts withbalances of $10,000 or more.
(8) TRANSACTIONS WITH AFFILIATESThe Fund’s Reward Shares is one of 16 USAA mutual funds in which theaffiliated USAA fund-of-funds invest. The USAA fund-of-funds do notinvest in the underlying funds for the purpose of exercising management orcontrol, and the affiliated fund-of-funds’ annual or semiannual reports maybe viewed at usaa.com. As of December 31, 2018, the USAA fund-of-fundsowned the following percentages of the total outstanding shares of the Fund:
Affiliated USAA Fund Ownership %
Cornerstone Conservative 0.1Cornerstone Equity 0.4Target Retirement Income 0.0*Target Retirement 2020 0.1Target Retirement 2030 0.5Target Retirement 2040 0.6Target Retirement 2050 0.4Target Retirement 2060 0.0*
*Represents less than 0.1%
The Manager is indirectly wholly owned by United Services AutomobileAssociation (USAA), a large, diversified financial services institution.

Certain trustees and officers of the Fund are also directors, officers, and/oremployees of the Manager. None of the affiliated trustees or Fund officersreceived any compensation from the Fund.
(9) UPCOMING REGULATORY MATTERSIn October 2016, the U.S. Securities and Exchange Commission (SEC) issuedFinal Rule Release No. 33-10233, Investment Company Liquidity RiskManagement Programs (Liquidity Rule). The Liquidity Rule requires fundsto establish a liquidity risk management program and enhances disclosuresregarding funds’ liquidity. The requirements to implement a liquidity riskmanagement program and establish a 15% illiquid investment limit becameeffective December 1, 2018. However, in February 2018, the SEC issuedRelease No. IC-33010, Investment Company Liquidity Risk ManagementPrograms; Commission Guidance for In-Kind ETFs, which delayed certainrequirements related to liquidity classification, highly liquid investmentminimums, and board approval of the liquidity risk management programsto June 1, 2019. The Manager continues to evaluate the impact of this ruleon the Fund’s financial statements and various filings.
(10) RECENTLY ADOPTED ACCOUNTING STANDARDIn August 2018, the SEC adopted amendments to Regulation S-X forinvestment companies governing the form and content of financialstatements. The amendments to Regulation S-X took effect on November 5,2018, and the financial statements have been modified accordingly, for thecurrent and prior periods.
ASU 2018-13, Fair Value Measurement
In August 2018, the Financial Accounting Standards Board (FASB) issuedAccounting Standards Update (ASU) 2018-13, Fair Value Measurement(Topic 820). The amendments in the ASU impact disclosure requirements forfair value measurement. This ASU is effective for fiscal years beginning afterDecember 15, 2019. Early adoption is permitted and can include the entirestandard or certain provisions that exclude or amend disclosures. Managementhas elected to early adopt ASU 2018-13 effective with the current reportingperiod. The adoption of this ASU guidance is limited to changes in theFund’s notes to financial statement disclosures regarding valuation method,fair value and transfers between levels of the fair value hierarchy.
Notes to Financial Statements | 47
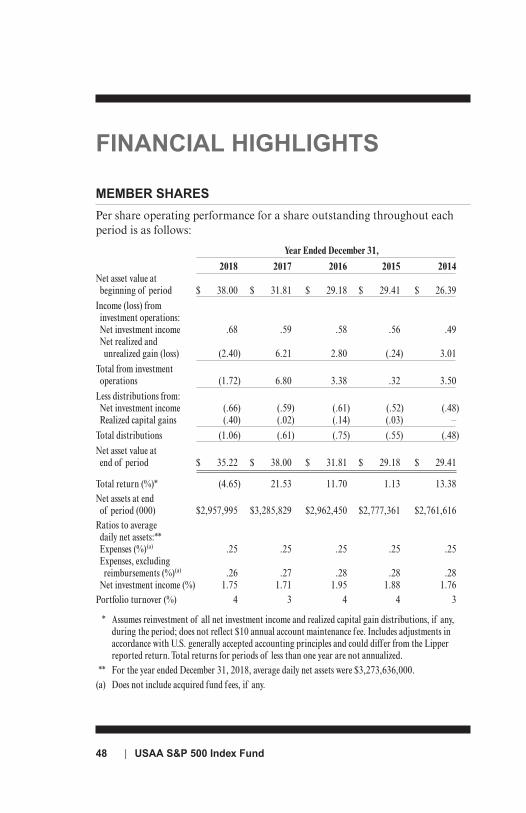
48 | USAA S&P 500 Index Fund
FINANCIAL HIGHLIGHTS
MEMBER SHARES
Per share operating performance for a share outstanding throughout eachperiod is as follows:
Year Ended December 31,
2018 2017 2016 2015 2014Net asset value at
beginning of period $ 38.00 $ 31.81 $ 29.18 $ 29.41 $ 26.39 Income (loss) from
investment operations:Net investment income .68 .59 .58 .56 .49Net realized and
unrealized gain (loss) (2.40) 6.21 2.80 (.24) 3.01 Total from investment
operations (1.72) 6.80 3.38 .32 3.50 Less distributions from:
Net investment income (.66) (.59) (.61) (.52) (.48)Realized capital gains (.40) (.02) (.14) (.03) –
Total distributions (1.06) (.61) (.75) (.55) (.48) Net asset value at
end of period $ 35.22 $ 38.00 $ 31.81 $ 29.18 $ 29.41 Total return (%)* (4.65) 21.53 11.70 1.13 13.38Net assets at end
of period (000) $2,957,995 $3,285,829 $2,962,450 $2,777,361 $2,761,616Ratios to average
daily net assets:**Expenses (%)(a) .25 .25 .25 .25 .25Expenses, excluding
reimbursements (%)(a) .26 .27 .28 .28 .28Net investment income (%) 1.75 1.71 1.95 1.88 1.76
Portfolio turnover (%) 4 3 4 4 3
* Assumes reinvestment of all net investment income and realized capital gain distributions, if any,during the period; does not reflect $10 annual account maintenance fee. Includes adjustments inaccordance with U.S. generally accepted accounting principles and could differ from the Lipperreported return. Total returns for periods of less than one year are not annualized.
** For the year ended December 31, 2018, average daily net assets were $3,273,636,000.(a) Does not include acquired fund fees, if any.

Financial Highlights | 49
REWARD SHARES
Per share operating performance for a share outstanding throughout eachperiod is as follows:
Year Ended December 31,
2018 2017 2016 2015 2014Net asset value at
beginning of period $ 38.01 $ 31.82 $ 29.19 $ 29.42 $ 26.39 Income (loss) from
investment operations:Net investment income .71 .61 .60 .59 .51Net realized and
unrealized gain (loss) (2.38) 6.22 2.81 (.24) 3.03 Total from investment
operations (1.67) 6.83 3.41 .35 3.54 Less distributions from:
Net investment income (.70) (.62) (.64) (.55) (.51)Realized capital gains (.40) (.02) (.14) (.03) –
Total distributions (1.10) (.64) (.78) (.58) (.51) Net asset value at
end of period $ 35.24 $ 38.01 $ 31.82 $ 29.19 $ 29.42 Total return (%)* (4.53) 21.64 11.79 1.23 13.53Net assets at end
of period (000) $3,606,745 $3,636,257 $3,010,831 $2,613,832 $2,306,656Ratios to average
daily net assets:**Expenses (%)(a) .15 .15 .15 .15 .15Expenses, excluding
reimbursements (%)(a) .18 .18 .18 .18 .18Net investment income (%) 1.85 1.81 2.04 1.99 1.86
Portfolio turnover (%) 4 3 4 4 3
* Assumes reinvestment of all net investment income and realized capital gain distributions, if any,during the period. Includes adjustments in accordance with U.S. generally accepted accountingprinciples and could differ from the Lipper reported return. Total returns for periods of less than oneyear are not annualized.
** For the year ended December 31, 2018, average daily net assets were $3,877,979,000.(a) Does not include acquired fund fees, if any.

EXPENSE EXAMPLEDecember 31, 2018 (unaudited)
50 | USAA S&P 500 Index Fund
EXAMPLEAs a shareholder of the Fund, you incur two types of costs: direct costs, suchas account maintenance fees, wire fees, redemption fees, and low balance fees;and indirect costs, including management fees, transfer agency fees, and otherFund operating expenses. This example is intended to help you understandyour indirect costs, also referred to as “ongoing costs” (in dollars), of investingin the Fund and to compare these costs with the ongoing costs of investing inother mutual funds.
The example is based on an investment of $1,000 invested at the beginning ofthe period and held for the entire six-month period of July 1, 2018, throughDecember 31, 2018.
ACTUAL EXPENSESThe line labeled “actual” under each share class in the table providesinformation about actual account values and actual expenses. You may usethe information in this line, together with the amount you invested at thebeginning of the period, to estimate the expenses that you paid over theperiod. Simply divide your account value by $1,000 (for example, an $8,600account value divided by $1,000 = 8.6), then multiply the result by thenumber for your share class in the “actual” line under the heading “ExpensesPaid During Period” to estimate the expenses you paid on your accountduring this period.
Actual expenses in the table on the next page do not reflect the effect of theannual $10.00 account maintenance fee that is assessed on Member Shareaccounts with balances of less than $10,000, at a rate of $2.50 per quarter.To include the effect of this fee on the expenses that you paid, add $5.00($2.50 for two quarters) to your calculated estimated expenses. If you arecurrently assessed this fee, your ending account value reflects the quarterlydeduction from your account.

Expense Example | 51
HYPOTHETICAL EXAMPLE FOR COMPARISON PURPOSESThe line labeled “hypothetical” under each share class in the table providesinformation about hypothetical account values and hypothetical expensesbased on the Fund’s actual expense ratios for each class and an assumedrate of return of 5% per year before expenses, which is not the Fund’s actualreturn. The hypothetical account values and expenses may not be used toestimate the actual ending account balance or expenses you paid for theperiod. You may use this information to compare the ongoing costs ofinvesting in the Fund and other funds. To do so, compare this 5% hypotheticalexample with the 5% hypothetical examples that appear in the shareholderreports of other funds.
Please note that the expenses shown in the table are meant to highlight yourongoing costs only and do not reflect any direct costs, such as accountmaintenance fees, wire fees, redemption fees, or low balance fees. Therefore, theline labeled “hypothetical” is useful in comparing ongoing costs only, and willnot help you determine the relative total costs of owning different funds. Inaddition, if these direct costs were included, your costs would have been higher.
Expenses Paid Beginning Ending During Period* Account Value Account Value July 1, 2018 – July 1, 2018 December 31, 2018 December 31, 2018
Member SharesActual $1,000.00 $ 930.00 $1.22
Hypothetical (5% return before expenses) 1,000.00 1,023.95 1.28
Reward SharesActual 1,000.00 930.70 0.73
Hypothetical(5% return before expenses) 1,000.00 1,024.45 0.77
*Expenses are equal to the Fund’s annualized expense ratio of 0.25% for Member Shares and 0.15% forReward Shares, which are net of any reimbursements and expenses paid indirectly, multiplied by theaverage account value over the period, multiplied by 184 days/365 days (to reflect the one-half-yearperiod). The Fund’s actual ending account values are based on its actual total returns of (7.00)% forMember Shares and (6.93)% for Reward Shares for the six-month period of July 1, 2018, throughDecember 31, 2018.

52 | USAA S&P 500 Index Fund
TRUSTEES’ AND OFFICERS’INFORMATION
TRUSTEES AND OFFICERS OF THE TRUST
The Board of Trustees (the Board) of the Trust consists of eight Trustees.These Trustees and the Trust’s Officers supervise the business affairs of theUSAA family of funds. The Board is responsible for the general oversight ofthe funds’ business and for assuring that the funds are managed in the bestinterests of each fund’s respective shareholders. The Board periodically reviewsthe funds’ investment performance as well as the quality of other servicesprovided to the funds and their shareholders by each of the fund’s serviceproviders, including USAA Asset Management Company (AMCO) and itsaffiliates. Pursuant to a policy adopted by the Board, the term of office foreach Trustee shall be 20 years or until the Independent Trustee reaches age 72or an Interested Trustee reaches age 65. The Board may change or grantexceptions from this policy at any time without shareholder approval. ATrustee may resign or be removed by a vote of two-thirds of the Trusteesbefore the removal or by the holders of two-thirds of the outstanding sharesof the Trust at any time. Vacancies on the Board can be filled by the actionof a majority of the Trustees, provided that after filling such vacancy atleast two-thirds of the Trustees have been elected by the shareholders.
Set forth below are the Trustees and Officers of the Trust, their respectiveoffices and principal occupations during the last five years, length of timeserved, and information relating to any other directorships held. Eachserves on the Boards of the USAA family of funds consisting of two registeredinvestment companies which, together, offer 53 individual funds. Unlessotherwise indicated, the business address for each is P.O. Box 659430, SanAntonio, TX 78265-9430.

Trustees’ and Officers’ Information | 53
If you would like more information about the funds’ Trustees, you maycall (800) 531-USAA (8722) or (210) 531-8722 to request a free copy of thefunds’ Statement of Additional Information (SAI).
INTERESTED TRUSTEE1
Daniel S. McNamara2, 4, 6
Trustee, President, and Vice Chair of the Board of TrusteesBorn: June 1966Year of Election or Appointment: 2012
Trustee, President, and Vice Chairman, USAA ETF Trust (06/17–present);President of Financial Advice & Solutions Group (FASG), USAA(02/13–present); Director of USAA Asset Management Company (AMCO),(08/11–present); Director of USAA Investment Management Company(IMCO) (09/09–present); President, IMCO (09/09–04/14); President andDirector of USAA Shareholder Account Services (SAS) (10/09–present);Senior Vice President of USAA Financial Planning Services InsuranceAgency, Inc. (FPS) (04/11–present); Director of FPS (12/13–present);President and Director of USAA Investment Corporation (ICORP)(03/10–present); Director of USAA Financial Advisors, Inc. (FAI)(12/13–present). Mr. McNamara brings to the Board extensive experience inthe financial services industry, including experience as an officer of the Trust.

54 | USAA S&P 500 Index Fund
NON-INTERESTED (INDEPENDENT) TRUSTEES
Robert L. Mason, Ph.D.2, 3, 4, 5, 6, 7
Trustee and Chair of the Board of TrusteesBorn: July 1946Year of Election or Appointment: 1997†
Trustee, USAA ETF Trust (06/17–present); Adjunct Professor in theDepartment of Management Science and Statistics in the College of Businessat the University of Texas at San Antonio (2001–present); Institute Analyst,Southwest Research Institute (03/02–01/16), which focuses on providinginnovative technology, science, and engineering services to clients around theworld and is one of the oldest independent, nonprofit, applied research anddevelopment organizations in the United States. He was employed at SouthwestResearch Institute for 40 years. Dr. Mason brings to the Board particularexperience with information technology matters, statistical analysis, andhuman resources as well as over 22 years’ experience as a Board member ofthe USAA family of funds. Dr. Mason holds no other directorships of anypublicly held corporations or other investment companies outside the USAAfamily of funds.
Jefferson C. Boyce3, 4, 5, 6, 7
TrusteeBorn: September 1957Year of Election or Appointment: 2013
Trustee, USAA ETF Trust (06/17–present); Senior Managing Director, NewYork Life Investments, LLC (1992–2012), an investment manager. Mr. Boycebrings to the Board experience in financial investment management, and, inparticular, institutional and retail mutual funds, variable annuity products,broker dealers, and retirement programs, including experience inorganizational development, marketing, product development, and moneymanagement as well as five years’ experience as a Board member of theUSAA family of funds. Mr. Boyce is a board member of Westhab, Inc.

Trustees’ and Officers’ Information | 55
Dawn M. Hawley3, 4, 5, 6, 7, 9
TrusteeBorn: February 1954Year of Election or Appointment: 2014
Trustee, USAA ETF Trust (06/17–present); Manager of Finance, MenilFoundation, Inc. (05/07–06/11), which is a private foundation that overseesthe assemblage of sculptures, prints, drawings, photographs, and rare books.Director of Financial Planning and Analysis and Chief Financial Officer,AIM Management Group, Inc. (10/87–01/06). Ms. Hawley brings to theBoard experience in financial investment management and, in particular,institutional and retail mutual funds, variable annuity products, brokerdealers, and retirement programs, including experience in financial planning,budgeting, accounting practices, and asset/liability management functionsincluding major acquisitions and mergers, as well as over four years’ experienceas a Board member of the USAA family of funds. Ms. Hawley holds noother directorships of any publicly held corporations or other investmentcompanies outside the USAA family of funds.
Paul L. McNamara3, 4, 5, 6, 7
TrusteeBorn: July 1948Year of Election or Appointment: 2012
Trustee, USAA ETF Trust (06/17–present); Director, Cantor OpportunisticAlternatives Fund, LLC (03/10–02/14), which is a closed-end fund of funds byCantor Fitzgerald Investment Advisors, LLC. Mr. McNamara retired fromLord Abbett & Co. LLC, an independent U.S. investment management firm, asan Executive Member on 09/30/09, a position he held since 10/02. He had beenemployed at Lord Abbett since 1996. Mr. McNamara brings to the Boardextensive experience with the financial services industry and, in particular,institutional and retail mutual fund markets, including experience with mutualfund marketing, distribution, and risk management, as well as overallexperience with compliance and corporate governance issues. Mr. McNamaraalso has experience serving as a fund director as well as seven years’ experienceas a Board member of the USAA family of funds. Paul L. McNamara is of norelation to Daniel S. McNamara. Mr. McNamara holds no other directorshipsof any publicly held corporations or other investment companies outside theUSAA family of funds.

56 | USAA S&P 500 Index Fund
Richard Y. Newton III3,4,5,6,7
TrusteeBorn: January 1956Year of Election or Appointment: 2017
Trustee, USAA ETF Trust (06/17–present); Director, Elta North America(01/18–present), which is a global leader in the design, manufacture andsupport of innovative electronic systems in the ground, maritime, airborne,and security domains for the nation’s warfighters, security personnel, andfirst responders; Managing Partner, Pioneer Partnership DevelopmentGroup (12/15–present); Executive Director, The Union League Club ofNew York (06/14–11/15); Executive Vice President, Air Force Association(08/12–05/14); Lieutenant General, United States Air Force (01/08–06/12).Lieutenant General Newton (Ret.) served 34 years of active duty in theUnited States Air Force. Lt. Gen. Newton retired as the Assistant Vice Chiefof Staff and Director of Air Staff at the Headquarters of the U.S. Air Forcewhere he was responsible for overseeing the administration and organizationof the Air Staff, which develops policies, plans and programs, establishesrequirements, and provides resources to support the Air Force’s mission. Lt. Gen. Newton is a graduate of the United States Air Force Academy,Webster University, and The National War College. Lt. Gen. Newton bringsto the Board extensive management and military experience, as well as one year of experience as a Board member of the USAA family of funds.Lt. Gen. Newton holds no other directorships of any publicly heldcorporations or other investment companies outside the USAA family offunds.

Trustees’ and Officers’ Information | 57
Barbara B. Ostdiek, Ph.D.3, 4, 5, 6, 7, 8
TrusteeBorn: March 1964Year of Election or Appointment: 2008
Trustee, USAA ETF Trust (06/17–present); Senior Associate Dean of Degreeprograms at Jesse H. Jones Graduate School of Business at Rice University(07/13–present); Associate Professor of Finance at Jesse H. Jones GraduateSchool of Business at Rice University (07/01–present); Academic Director,El Paso Corporation Finance Center at Jesse H. Jones Graduate School ofBusiness at Rice University (07/02–06/12). Dr. Ostdiek brings to the Boardparticular experience with financial investment management, education, andresearch as well as over eleven years’ experience as a Board member of theUSAA family of funds. Dr. Ostdiek holds no other directorships of anypublicly held corporations or other investment companies outside the USAAfamily of funds.

58 | USAA S&P 500 Index Fund
Michael F. Reimherr3, 4, 5, 6, 7
TrusteeBorn: August 1945Year of Election or Appointment: 2000
Trustee, USAA ETF Trust (06/17–present); President of Reimherr BusinessConsulting performing business valuations of medium to large companies;developing business plans, budgets, and internal financial reporting; andwork with mergers and acquisitions (05/95–12/17). St. Mary’s UniversityInvestment Committee overseeing University Endowment (06/14–present).Mr. Reimherr brings to the Board particular experience with organizationaldevelopment, budgeting, finance, capital markets, and mergers andacquisitions, as well as over 19 years’ experience as a Board member of theUSAA family of funds. Mr. Reimherr holds no other directorships of anypublicly held corporations or other investment companies outside theUSAA family of funds.
1 Indicates the Trustee is an employee of AMCO or affiliated companies and isconsidered an “interested person” under the Investment Company Act of 1940.
2 Member of Executive Committee.3 Member of Audit and Compliance Committee.4 Member of Product Management and Distribution Committee.5 Member of Corporate Governance Committee.6 Member of Investments Committee.7 The address for all non-interested trustees is that of the USAA Funds,
P.O. Box 659430, San Antonio, TX 78265-9430.8 Dr. Ostdiek has been designated as an Audit and Compliance Committee
Financial Expert by the Funds’ Board. 9 Ms. Hawley has been designated as an Audit and Compliance Committee
Financial Expert by the Funds’ Board.† Dr. Mason was elected as Chair of the Board in January 2012.

Trustees’ and Officers’ Information | 59
INTERESTED OFFICERS1
John C. Spear
Vice PresidentBorn: May 1964Year of Appointment: 2016
Vice President, USAA ETF Trust (06/17–present); Senior Vice Presidentand Chief Investment Officer, USAA Investments, (03/17–present); VicePresident and Chief Investment Officer, USAA Investments, (11/16–03/17);Vice President, Long Term Fixed Income (05/12–11/16).
John P. Toohey
Vice PresidentBorn: March 1968Year of Appointment: 2009
Vice President, USAA ETF Trust (06/17–present); Head of Equities, EquityInvestments, AMCO (01/12–present).
Kristen Millan
SecretaryBorn: April 1983Year of Appointment: 2019
Senior Attorney, FASG General Counsel, USAA (09/17–present);Attorney, FASG General Counsel, USAA (06/13–09/17). Ms. Millan alsoserves as Assistant Secretary of AMCO, ICORP, and SAS.
Seba Kurian
Assistant SecretaryBorn: December 1978Year of Appointment: 2019
Secretary, USAA ETF Trust (09/17–present); Senior Attorney, USAA FASGCounsel (06/16–present); Senior Attorney, Invesco Ltd. (05/11–06/16). Ms. Kurian also serves as assistant secretary of ICORP and IMCO.

James K. De Vries
TreasurerBorn: April 1969Year of Appointment: 2018
Treasurer, USAA ETF Trust (09/18–present); Executive Director, Investmentand Financial Administration, USAA (04/12–present); Assistant Treasurer,USAA ETF Trust (06/17–09/18); Assistant Treasurer, USAA Mutual FundsTrust (12/13–02/18). Mr. De Vries also serves as the Funds’ Principal FinancialOfficer.
Carol D. Trevino
Assistant TreasurerBorn: October 1965Year of Appointment: 2018
Assistant Treasurer, USAA ETF Trust (09/18–present); Accounting/FinancialDirector, USAA (12/13–present); Senior Accounting Analyst, USAA(03/11–12/13).
Stephanie A. Higby
Chief Compliance OfficerBorn: July 1974Year of Appointment: 2013
Chief Compliance Officer, USAA ETF Trust (06/17–present); AssistantVice President, Compliance-Investments, USAA (02/18–present); AssistantVice President, Compliance Mutual Funds, USAA (12/16–01/18); ExecutiveDirector, Institutional Asset Management Compliance, USAA (04/13–12/16).Ms. Higby also serves as the Funds’ anti-money laundering complianceofficer and as the Chief Compliance Officer for AMCO and IMCO.
60 | USAA S&P 500 Index Fund
1 Indicates those Officers who are employees of AMCO or affiliated companiesand are considered “interested persons” under the Investment Company Actof 1940.

Trustees Daniel S. McNamaraRobert L. Mason, Ph.D.Jefferson C. BoyceDawn M. HawleyPaul L. McNamaraRichard Y. Newton IIIBarbara B. Ostdiek, Ph.D. Michael F. Reimherr
Administrator and USAA Asset Management CompanyInvestment Adviser P.O. Box 659453
San Antonio, Texas 78265-9825
Underwriter and USAA Investment Management CompanyDistributor P.O. Box 659453
San Antonio, Texas 78265-9825
Transfer Agent USAA Shareholder Account Services9800 Fredericksburg RoadSan Antonio, Texas 78288
Custodian and The Northern Trust CompanyAccounting Agent 50 S. LaSalle St.
Chicago, Illinois 60603
Independent Ernst & Young LLPRegistered Public 100 West Houston St., Suite 1700Accounting Firm San Antonio, Texas 78205
Copies of the Manager’s proxy voting policies and procedures, approved by the Trust’s Board ofTrustees for use in voting proxies on behalf of the Fund, are available without charge (i) by calling(800) 531-USAA (8722) or (210) 531-8722; (ii) at usaa.com; and (iii) in summary within theStatement of Additional Information on the SEC’s website at http://www.sec.gov. Informationregarding how the Fund voted proxies relating to portfolio securities during the most recent 12-monthperiod ended June 30 is available without charge (i) at usaa.com; and (ii) on the SEC’s website athttp://www.sec.gov.
The Fund files its complete schedule of portfolio holdings with the SEC for the first and thirdquarters of each fiscal year on Form N-Q. These Forms N-Q are available at no charge (i) by calling(800) 531-USAA (8722) or (210) 531-8722; (ii) at usaa.com; and (iii) on the SEC’s website athttp://www.sec.gov.
29237-0219 ©2019, USAA. All rights reserved.