Embed Size (px)
Citation preview

NM -1 – Nutrient Management and IWM Planning
Irrigation water management is an integral part of a conservation management system to support one or more of the following:
• Manage soil moisture to promote desired crop response • Optimize use of available water supplies • Minimize irrigation induced soil erosion • Decrease non-point source pollution of surface and groundwater resources • Manage salts in the crop root zone • Manage air, soil, or plant microclimate
All irrigated cropland must have, at a minimum, the following essential practices as part of their conservation management system: Irrigation Water Management, Nutrient Management, Pest Management, and Conservation Crop Rotation. For nutrient management, in addition to a soil test to be taken, in order to evaluate risks due to nutrients, the phosphorus index (Section NM-9) and nitrogen index (this section), also located at http://www.nm.nrcs.usda.gov/technical/tech-notes/agro.html, need to be run. These help in evaluating the type of risk to surface and groundwater and choosing an alternative conservation practice or management practice to reduce the risk, such as leaching and runoff reduction practices. Nutrient management plans are developed to specify the source, amount, timing and method of application of nutrients on each field to achieve realistic yield goals, while minimizing movement of nutrients out of the root zone or off the field. Nutrient applications associated with irrigation systems need to be applied according to Irrigation Water Management practice standard and Nutrient Management standards, http://www.nm.nrcs.usda.gov/technical/fotg/section-4/std-specs.html . The application rate (in/hr) for material applied through irrigation shall not exceed the water holding capacity of the soil root zone. Application amounts must be adjusted to match the soil intake rate. When applying manure with irrigation equipment, modifying the equipment can reduce the potential for volatilization of nitrogen from the time the manure leaves the application equipment until it reaches the surface of the soil (e.g. reduced pressure, drop down tubes for center pivots). Nitrogen volatilization from manure in a surface irrigation system will be reduced when applied under a crop canopy. Schedule salt leaching events to coincide with lower residual soil nutrients and pesticides.
1
2
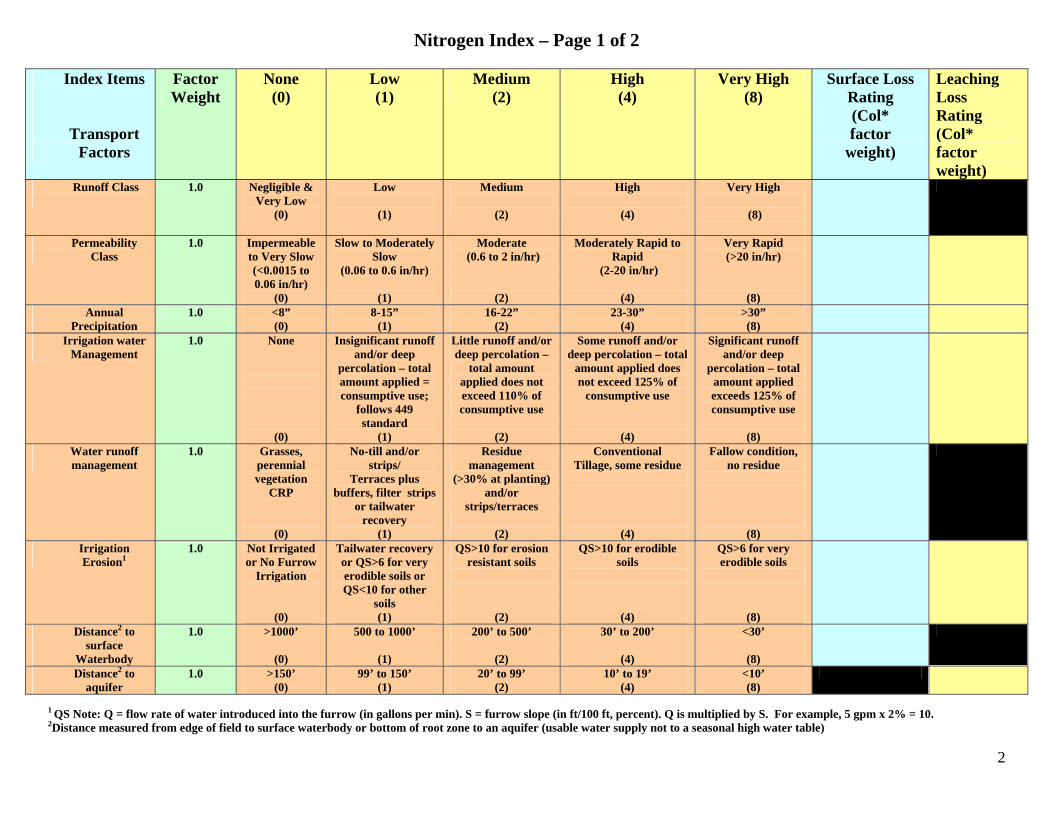
Nitrogen Index – Page 1 of 2
Index Items
Transport
Factors
Factor Weight
None (0)
Low (1)
Medium (2)
High (4)
Very High (8)
Surface Loss Rating (Col* factor
weight)
Leaching Loss Rating (Col* factor weight)
Runoff Class
1.0 Negligible & Very Low
(0)
Low
(1)
Medium
(2)
High
(4)
Very High
(8)
Permeability Class
1.0 Impermeable to Very Slow (<0.0015 to 0.06 in/hr)
(0)
Slow to Moderately Slow
(0.06 to 0.6 in/hr)
(1)
Moderate (0.6 to 2 in/hr)
(2)
Moderately Rapid to Rapid
(2-20 in/hr)
(4)
Very Rapid (>20 in/hr)
(8)
Annual Precipitation
1.0 <8” (0)
8-15” (1)
16-22” (2)
23-30” (4)
>30” (8)
Irrigation water Management
1.0 None
(0)
Insignificant runoff and/or deep
percolation – total amount applied = consumptive use;
follows 449 standard
(1)
Little runoff and/or deep percolation –
total amount applied does not exceed 110% of consumptive use
(2)
Some runoff and/or deep percolation – total
amount applied does not exceed 125% of
consumptive use
(4)
Significant runoff and/or deep
percolation – total amount applied exceeds 125% of consumptive use
(8)
Water runoff management
1.0 Grasses, perennial vegetation
CRP
(0)
No-till and/or strips/
Terraces plus buffers, filter strips
or tailwater recovery
(1)
Residue management
(>30% at planting) and/or
strips/terraces
(2)
Conventional Tillage, some residue
(4)
Fallow condition, no residue
(8)
Irrigation Erosion1
1.0 Not Irrigated or No Furrow
Irrigation
(0)
Tailwater recovery or QS>6 for very erodible soils or QS<10 for other
soils (1)
QS>10 for erosion resistant soils
(2)
QS>10 for erodible soils
(4)
QS>6 for very erodible soils
(8)
Distance2 to surface
Waterbody
1.0 >1000’
(0)
500 to 1000’
(1)
200’ to 500’
(2)
30’ to 200’
(4)
<30’
(8)
Distance2 to aquifer
1.0 >150’ (0)
99’ to 150’ (1)
20’ to 99’ (2)
10’ to 19’ (4)
<10’ (8)
1 QS Note: Q = flow rate of water introduced into the furrow (in gallons per min). S = furrow slope (in ft/100 ft, percent). Q is multiplied by S. For example, 5 gpm x 2% = 10. 2Distance measured from edge of field to surface waterbody or bottom of root zone to an aquifer (usable water supply not to a seasonal high water table)

3
Nitrogen Index – Page 2 of 2
Index Items
Source Factors
Factor Weight
None (0)
Low (1)
Medium (2)
High (4)
Very High (8)
Surface Loss Rating (Col* factor
weight)
Leaching Loss Rating (Col*factor weight)
Application Rate
1.5 None applied
(0)
Nitrogen applied at agronomic rates with soil
test; follows 590 standard
(1.5)
Nitrogen applied at rates greater
than 100 to 150% of
agronomic rates; with soil test
(3)
Nitrogen applied at rates over 150% of agronomic rates;
with soil test
(6)
No soil test
(12)
Application Form
1.0 None applied
(0)
Commercial fertilizer
w/calibrated application equipment
(1)
Commercial fertilizer but w/o
calibration of application equipment
Or Organic w/ manure test &
calibrated application
(2)
Organic w/manure Test but w/o calibrated application equipment
(4)
Organic w/o manure test or calibration of application equipment
(8)
Commercial Fertilizer Timing (and/or)
1.0 None applied
(0)
Grid or zone sampling; precision
application
(1)
Spring Applic. and/or top
dressed during growing season
(2)
Split applications on fall seeded crops
(starter in fall/top dressed
spring/summer) (4)
Application more than 1
month ahead of planting
(8)
Organic Fertilizer Timing
1.0 None applied
(0)
Incremental application
applied as crop uses N
throughout year (1)
All manure applied less than 1 month before
planting
(2)
Application more than 1 month ahead
of planting
(4)
Application in winter months (December and
January)
(8)
Application Method
1.0 None applied
(0)
Banded/ injected or
precision applied
(1)
Broadcast/ surface applied,
incorporated within 5 days
(2)
Broadcast/surface applied,
incorporated more than 5 days
(4)
Surface applied, not incorporated
(8)
Total Weighted Rating (Sum of Columns)
Rating Surface Water Ground Water
Low Potential <17 <14 Medium Potential 17 to 34 14 to 28
High Potential 34 to 68 28 to 58
Very High Potential >68 >58

1
NNMM –– 22 –– HHooww ttoo CCoolllleecctt SSooiill SSaammpplleess
Why Soil Tests are Important Why Sample Soil testing is the key to nutrient management. Without a preplant soil test, fertilizing is a guess at best. Most soil testing is very cost effective. Many times growers put on fertilizer as “insurance” instead of testing the soil to see if fertilizer is needed. People could save as much as $100/ac by spending $20 on a soil test. NMSU has guidelines for soil sampling (Guide A-114), http://cahe.nmsu.edu/pubs/_a/a-114.html, and interpretations (Guide A-122), http://cahe.nmsu.edu/pubs/_a/a-122.html. NRCS Agronomy Technical Note 58, http://www.nm.nrcs.usda.gov/technical/tech-notes/agro/ag58.pdf , provides instructions for use of NMSU Fertilization Interpretation Software (NRCS 590 Job sheet), http://www.nm.nrcs.usda.gov/technical/tech-notes/agro.html, once the user has obtained a proper soil test. For routine analysis, request pH - saturated paste, electrical conductivity (EC): saturated paste, soil organic matter (OM): Walkley Black, nitrate nitrogen (N) (KCl or water soluble method), phosphorus (P) (Olsen-P test if pH>6.8), potassium (K) (water soluble (preferred) or ammonium acetate method), magnesium, calcium, and sodium (SAR). Many soils and crops in NM also show a need for sulfur, zinc, manganese, and other micronutrients (DTPA extractable Fe, Zn, Mn, and Cu). Those listed are part of the standard/micronutrient analysis done at the NMSU Soil, Water and Agricultural Testing Laboratory in Las Cruces; other soil testing laboratories can run the same tests, but the client needs to specify which procedures to use to enable proper nutrient recommendations for NM crops. When and How to Take Soil Samples
1. The best time to sample is before spring fertilization or after harvest from uniform sampling areas with similar management.
2. Use any of the tools shown below to take sample. Sample to the plow depth (Usually 8-12”). Each sample should represent a uniform area. Size up the area and observe these variations:
Differences in texture (sand, silt, clay), color, slope, degree of erosion, drainage, past management (fertilization, manure application, rotation, irrigation type, etc.). 1. Take 15 to 20 subsamples from each uniform area. Mix thoroughly in a plastic container and fill a plastic bag with a pint of soil. This is the
composite sample, which represents the field or area. Label each container with your name and address and the field or sample identification (ID) corresponding to the ID on the information sheet.
2. Avoid (or sample separately, if of interest) such areas as: Dead or back furrows, old straw piles, waterways, terraces, fencerows, and unusual or difficult spots.
3. Repeat the sampling procedure outlined on each uniform area you want tested.
4. Air-dry the samples before mailing. Do not use heat for drying. Wet samples will delay analyses up to one week.
Soil Tube Soil Auger Spade
8-12”
Field1a
1b1c
23a
3b
These three fields need six soil samples

2
Where to Send Soil Samples for Analysis: Following NRCS 590 Nutrient Management Standard and NMSU Fertilization Interpretation software, soil test analyses shall be performed by laboratories that are accepted in the North American Proficiency Testing Program or those laboratories whose tests are accepted by the NMSU (partial list of labs below).
Partial Listing of Soil Testing Laboratories
Agricultural Testing and Research Lab NMSU SWAT Testing Lab P.O. Drawer 1318 MSC 3Q, Box 30003 Farmington, NM 87499 Dept. of Agronomy and Horticulture 505/326-2730 Las Cruces, NM 88003 505/646-4422 Servi-Tech Labs Ward Laboratories P.O. Box 1397 4007 Cherry Ave 1816 E. Wyatt Earp Kearney, NE 68848-0788 Dodge City, KS 67801 402/476-2811 308/234-2418 www.wardlab.com www.servi-techinc.com Inter Ag Services, Inc. MDS Harris IAS Laboratories 621 Rose St. 2515 E. University Dr. P.O. Box 80837 Phoenix, AZ 85034 Lincoln, NE 68501 602/273-7248 www.mdsharris.com
. (listing of North American Proficiency Testing participating laboratories available at http://www.naptprogram.org/pap/)

3
NMSU Land Grant University Soil Testing Information Sheet: IMPORTANT
If your sample is to be tested for available zinc and iron, rusty tools will contaminate the sample with iron, and galvanized or brass containers will contaminate it with zinc. The resultant soil analysis could indicate a sufficiency of these elements when actually a deficiency exists. Use plastic container when possible.
ALL EQUIPMENT MUST BE ABSOLUTELY CLEAN SOIL TESTS AVAILABLE
TEST PURPOSE COST PER
SAMPLE Standard: pH, total soluble salts, sodium adsorption ratio, organic matter, nitrate-nitrogen (water extractable), phosphorus (bicarb) method, and water soluble potassium.
Basic evaluation for characterizing the soil fertility status for growing crops. A fertilizer recommendation is given with sufficient information. Normally this test is sufficient unless a special problem is suspected.
$19.00
Subsoil Nitrate: Evaluation of nitrate supply below the plow depth. Fertilizer nitrogen recommendation based on routine soil test of surface soil is adjusted if subsoil nitrate is high.
$5.00
Iron and Zinc: Information on the micronutrients Iron and Zinc. Zinc is usually deficient in New Mexico soil. Carbonates interfere with iron and zinc uptake.
$6.00
Manganese and Copper: Information on the micronutrients Manganese and Copper. $6.00 Checks or Money Orders are made payable to New Mexico State University. Always verify prices by contacting the lab or visiting their website at http://swatlab.nmsu.edu/ . Click on soil for a price list. Water and plant samples can also be tested at this laboratory. Information on additional tests (soil, water, and plant) is available from the Soil, Water, and Agricultural Testing Laboratory. Expected turn-around time is one week in lab. If a delay is expected, you will be notified by phone.
USPS Address: Physical Address: New Mexico State University New Mexico State University SWAT LAB SWAT LAB Box 30003, Dept. 3Q 2290 Knox Street, PGEL West Agronomy and Hort Dept. Las Cruces, NM 88003 Las Cruces, New Mexico 88003

4
Attachment 1 Sampling Date:
CHECK DESIRED ANALYSIS
Name Standard $19.00 Address Subsoil Nitrate (subsoil sample) $5.00 City State Zip Iron & Zinc (w/standard test) $6.00 Phone Number ( )
SOIL SAMPLE INFORMATION SHEET
NEW MEXICO STATE UNIVERSITY
SWAT LABORATORY Manganese & Copper (w/std) $6.00
Email address: Received Date: Verify Prices at: http://swatlab.nmsu.edu/soilist.html Sample is for: Farm Home Orchard Farm Home Orchard Farm Home Orchard Farm Home Orchard
Lab ID Number
Field ID
Geographic Location (TRS, X, Y, Lat/Long)
Acres or Square Feet Sampling Depth (circle one) 0-2 0-4 0-6 0-8 0-12 12-24 0-2 0-4 0-6 0-8 0-12 12-24 0-2 0-4 0-6 0-8 0-12 12-24 0-2 0-4 0-6 0-8 0-12 12-24
Last years crop
This years crop Yield Goal
Orchard or Vineyard? Establishment year &
number per acre
Organic Amendments Enter Quantity of Each Enter Quantity of Each Enter Quantity of Each Enter Quantity of Each Solids
Liquids Irrigation System Drip Flood Sprinkler Drip Flood Sprinkler Drip Flood Sprinkler Drip Flood Sprinkler
Depth to Groundwater <6’ 6-12’ >12’ <6’ 6-12’ >12’ <6’ 6-12’ >12’ <6’ 6-12’ >12’
Water Nitrate-N Credit mg/l (ppm) mg/l (ppm) mg/l (ppm) mg/l (ppm)
Contact Info for Person taking sample:
COMMENTS:
Please remove any rocks from the sample. Submit a minimum of 2 cups of soil that has been air-dried. Avoid using rusty tools or containers.

(NM – 3) Soil Fertility Interpretation GUIDE/Form (ETc example is for Corn Silage) Crop_______ Variety _______ Average Annual Yield_______ Depth of Soil Sample________ Sample Date_______ Soil Nutrient Status Mar Apr May Jun Jul Aug Sep
Parameter
Result (ppm)
Emergence Rapid Effective Maturation Growth Full Cover
Nitrate-N
Phosphorus Potassium
Calcium Magnesium
Sulfur Iron (Fe)
Copper (Cu)
Zinc (Zn)
Mangan (Mn
OrganMatte
%
69 GDD
443 GDD
696 GDD
856 GDD
784 GDD
pH ETc:
1.75”
4.32”
8.33”
10.28”
8.35”
ECe
(dS/m
SARSodiumPetiole/L
used as a for det
adeqfertiliza
Soil Test Interpretations for N, P, K & Micronutrients:
* A Very Low or Low classification indicates a high probability for obtaining a fertilizer response. * A Moderate classification indicates a fertilizer response may or may not occur. * A High or Very High classification indicates a fertilizer response is not likely to occur.
Required Tests:
* The Olsen Test is used to determine the Phosphorus content * Potassium interpretations are based on a water extract * A saturated paste extract is used for determining the ECe and pH (most crops will grow satisfactorily on soils with a pH between 6.2 to 8.3)
Petiole/Leaf Sampling:
*To evaluate actual nutrient content (sufficiency level)
Factors Affecting Nutrient Supply & Availability:
O.M., CEC, Soil Texture, Soil Structure, Soil Water
Content, Salinity, pH, Temperature, Crop
Rotations (Legumes), Crop Residues,
Nutrient Carry-over
Crop growth curve
It is IMPO
ese ) ic r
)(Na) ppm eaf analysis is
monitoring tool ermining the uacy of the tion practices. Rudy Garcia 2008
Enter Fertilizer InputsType: Rate: Form: Application method: Date applied:
Other:
• When the ECe (soluble salts) is less than 2 dS/m, few salinity problems occur
• The SAR evaluates potential infiltration problems. ECe, SAR & pH are used to categorize soils as saline, saline-sodic, sodic or normal (i.e., no salinity, pH or Na problems)
RTANT to correlate Soil Fertility Test, Fertilizer Inputs & Leaf Analysis with IWM. Note: Follow NMSU fertilizer recommendations

(NM – 4) Developing a basic Nitrogen Budget Units conversion lbs. N/acre
Nitrogen Source example your result
e.g. your result
Soil Nitrate-Nitrogen (NO3- -N):
• The amount of residual soil nitrate-nitrogen can vary considerably depending on the soil type, irrigation efficiency, fertility program and plant uptake of previous crop. A conversion factor of 2.0 is used for a 0 – 6”soil sample depth to convert ppm N to lbs./ac.
7 ppm
Multiply by 2.0 to get lbs. N/ac.
14.0
Estimated Nitrogen Release (ENR) from the mineralization of Soil Organic Matter (SOM):
• About 15 – 25 lbs. of N/acre/yr. is mineralized from each % of SOM
1 % SOM
Assume 20 lbs. of N is
mineralized/ac
20.0
Irrigation Water Nitrate-Nitrogen (NO3- -N):
• Typically low levels are found in most irrigation waters. For this example, 2.5 ac-ft of irrigation water is used.
2 ppm
Multiply by 2.72 to get lbs. N/ac-ft(2.5 ac-ft used)
13.6
Manure N credits for the first year after application: • Moisture content can be 10 – 50% of the total weight and N content
is about 1.5 – 2.0% on a dry weight basis. Approximately 30 – 70% of the N is made available to the crop during the first year.
5.0 tons/ac. @ 30%
moisture & 1.5% N
Assume 45% of the total N is
available during the first year
47.25
Legume N credits from previous crop: • About 25 – 100 lbs. of N/ac. can be provided by the legume crop (i.e.,
pounds of legume crop residue/ac. and crop quality determines the amount of N made available)
≈ 30 lbs. of N/ac. (low
crop residues)
30.0
Total Available Nitrogen per acre = 124.85 Crop: Corn Silage; Yield: 20 tons/acre; N requirement: 160 lbs./acre (Ref. Crop Nutrient Uptake Tool @ http://npk.nrcs.usda.gov/)
Crop N Requirement (160.0 lbs./ac.) – Total Available N (124.85 lbs./ac) = 35.15 lbs. of N/ac. needed as fertilizer Fertilizer used: Urea (CO(NH2)2 ; 45 – 46% N)
Cost/lb. of N: $500/ton of Urea 46% N = 920 lbs. of
actual N/ton of Urea $500/920 = $0.54/lb. of N
Enter your Cost/lb. of N: Note: All N sources should be split-applied in order to increase N uptake efficiency. It is recommended that the producer take soil & petiole/leaf samples in order to monitor the effectiveness of their nutrient management program and to modify it as needed.
Remember to use realistic yield goals when developing crop N requirements. rudy garcia 2008

(NH4)2SO4) NH4NO3
SO4-2
S2O3-2
NO3-
NH3
NH4+
CO(NH2)2 + NH4NO3
NH4NO3
(NH4)2SO4
(NH4)2HPO4
NH4H2PO4
(NH4)3HP2O7
(NH4)2S2O3
NH4+
NH4+
NH4+ H2PO4
-
NH4+
NH4+NH4
+ NH3
NO3-NH4+CO(NH2)2
NH4+ NH4
+HPO4-2
CO(NH2)2
NH4+ NH4
+HP2O7
-3

(NM – 7) IWM to increase Nitrogen Use Efficiency - Evaluation Guide (Corn Silage example) Crop: Corn Silage Expected Yield: 20 tons Sample Depth: 0-12” Irr. System: Hi-Flow Leveled Field: Yes
MAR APR MAY JUN JUL AUG SEP ☻ Emergence------------------Rapid---------------Effective---------- Maturation Growth Full Cover
.33
.28
.28
.14
.06
Dai
ly E
Tc
(in./d
ay)
.40 .30 .20 .10
Soil Analysis: Enter sampling date(s) and test results for Nitrate-N (ppm) & ENR2/ (lbs)
24 ppm 20 lbs
Nitrogen Inputs 3/ (N fertilizer, manure, other): Enter application date(s) and pounds of N applied per acre
4/10 50 lbs N
6/5 50 lbs N
7/5 50 lbs N
Petiole/Leaf Analysis4/: Enter sampling date(s) and test results for % N (sufficiency level is 2.7-3.5%)
5/15 2.9%
Irrigations5/ (irrigated on a two-week fixed schedule): Enter irrigation dates and amount applied per irrigation (3” applied/irrigation)
It is
impo
rtan
t tha
t the
pla
nt r
espo
nse
(yie
ld &
qu
ality
) be
corr
elat
ed to
the
IWM
and
Fer
tility
pr
ogra
m (w
hich
is b
ased
on
soil
& ti
ssue
ana
lysi
s a
atio
nsnd
NM
SU r
ecom
men
d1/).
3/15
4/1 4/15
5/1 5/15
6/1 6/15
7/1 7/15
8/1
1/ Agronomy Tech. Note 58 (NMSU jobsheet – soil test interpretations) 2/ ENR = Expected Nitrogen Release (N from mineralized O.M.) 3/ Nitrogen Inputs: Nitrogen (urea) applied in three applications 4/ NMSU Guide A-143: Using Plant Tissue Analyses for Efficient Water Use by Plants 5/ Refer to the following Sections of this Guide for further IWM Assessments:
Section 30: Field Irrigation Evaluation Guide
Section 32: Graded Border Irrigation Analyses Guide Section 35: Soil Moisture
Monitoring Record Keeping Form & Irrigation Scheduling
Guide rudy garcia 2008
Petiole/Leaf Samples - To assess N
sufficiency level & adequacy of fertility
program
Soil Samples taken on March 5
Removal of Soil N occurs through leaching, volatilization, denitrification, soil erosion, and
harvested crop.
NOTE: Factors involved in IWM planning: Soil Texture, Soil Structure, Intake Family, Water Quality (salinity and SAR), Irrigation Application Efficiency evaluations, irrigation monitoring and scheduling, Irrigation System selection, consumptive use requirements, root zone depth.
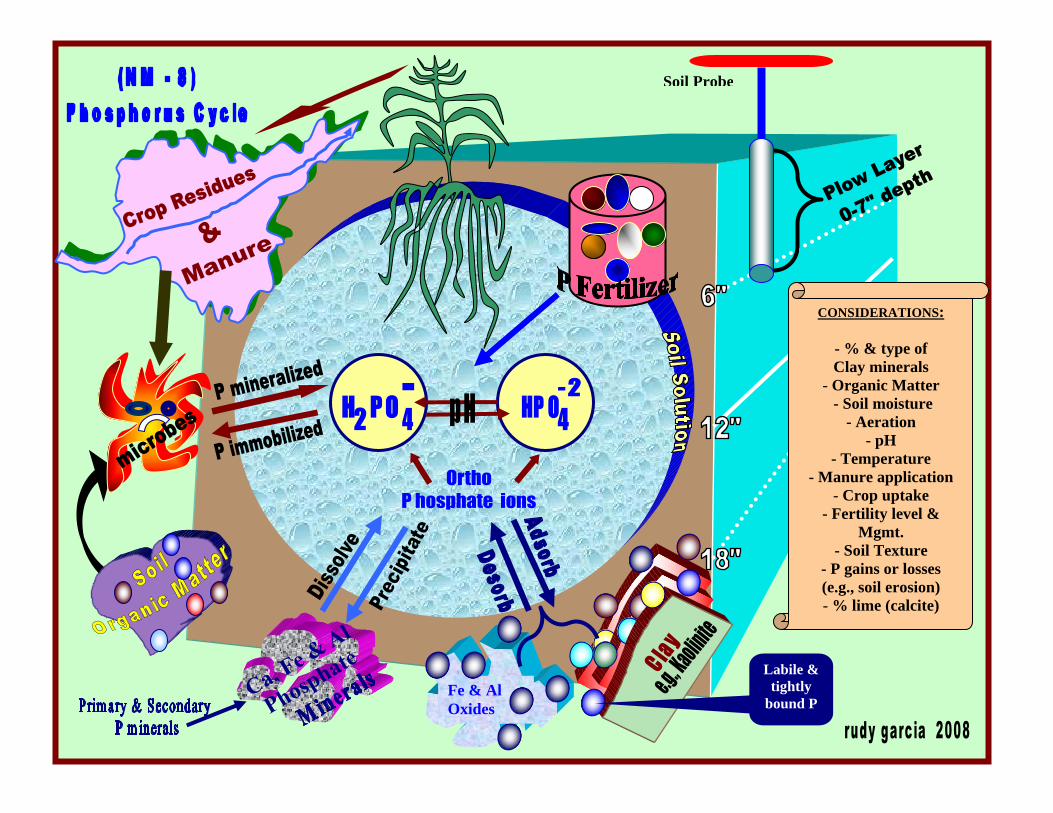
Soil Probe
CONSIDERATIONS:
- % & type of Clay minerals
- Organic Matter - Soil moisture
- Aeration - pH
- Temperature - Manure application
- Crop uptake - Fertility level &
Mgmt. - Soil Texture
- P gains or losses (e.g., soil erosion) - % lime (calcite)
Fe & Al Oxides
Labile & tightly
bound P

V
(NM – 9) Phosphorus Index Rating: - Soil Test P Level - P2O5 application rate - Manure application method - P Fertilizer application method - Edge of Field to Stream/Lake - Soil Erosion - Runoff Class - Irrigation Induced erosion - Grazing Management - Vegetative Buffer
Phosphorus Transport
Site ulnerability
Class:
Low
Medium
High
Very High
Rudy Garcia 2008

(NM – 10) Phosphorus Management (Using the P Index Rating) Weighting Factor (Wt. F.) x Column Factor (0, 1, 2, 4 & 8) = P Index Points
None or Very Low
Low
Medium
High
Very High
Site
Characteristic
Wt.
F.
0 1 2 4 8
P
Index Pts.
Soil Test P Level
1
V. Low < 8 ppm
Low 8 - 15 ppm
Moderate > 15 - 23 ppm
High > 23-30 ppm
V. High > 30 ppm
2.0
P (P2O5) Appl. Rate
1
None Applied
< 30 lbs/ac
30 - 90 lbs/ac
> 90-150 lbs/ac
> 150 lbs/ac
1.0
Organic P Appl. Method
1
None Applied
Injected 3 - 6” below surface
Incorp. Immediately before planting
Incorporated > 36 mo. before planting
Surface Applied
8.0
P Fertilizer Appl. Method
1
None Applied
Placed w/ Planter Deeper than 2”
Incorp. Immediately before planting
Incorporated > 37 mo. before planting
Surface Applied
1.0
Edge of Field to Stream/lake1
1.5
V. Low > 1000 ft.
Low > 500 - 1000 ft.
Medium > 200 - 500 ft.
High 30-200 ft.
V. High < 30 ft.
0
Soil Erosion2
1.5
V. Low < 1 t/ac
Low 1 - 3 t/ac
Medium > 3 - 5 t/ac
High > 5-15 t/ac
V. High > 15 t/ac
1.5
Runoff Class3
1.5
Negligible & V. Low
Low
Medium
High
V. High
1.5
Irr. Erosion (see QS note)
1.5
Not4
Irrigated Tail water
Recovery or 5 QS > 10 for erosion
resistant soils QS > 10 for erodible
soils QS > 6 for very erodible soils
3.0
Grazing Management
0.5
Not Grazed
Only graze crop residue
Pasture < 30% Dry Matter as supp. feed
Pasture 30-80% Dry Matter as supp. feed
Pasture 80-100% D.M. as supp. feed
0
Vegetative Buffer
1.5
> 100 ft.
> 65 - 100 ft.
20 - 65 ft.
< 20 ft.
No Buffer
0
Enter Total P Index Points:_e.g., 18________Index Pts.
P Hazard Class
P Application Classification
QS Note: Q = flow rate of water introduced into the furrow (in gpm). S = furrow slope (ft/100 ft, %). Q is multiplied by S: (e.g.: 5 gpm x 2% = 10).
0 – 10 V. Low N Based 10 – 17 Low N Based 17 – 27 Med. N Based 27 – 37 High P Based (1.5x crop removal) 37 - 47 V. High P Based (at crop removal)
P In
dex
Cla
ssifi
catio
n
> 47 Excessive No P application allowed
(1) Proximity of Nearest Field Edge to Named Stream or Lake
(2) WEPS & RUSLE(3) refer to Runoff Class Table
(which is based on % field slope & soil permeability class (in/hr))
(4) or No Furrow Irrigation(5) QS < 6 for Very erodible soils
or QS < 10 for other soils(6) or Surface Application < 3 Mo.
before planting(7) or Surface Applied < 3 months
before plantingPhosphorus Index Rating (Reference: NRCS Agronomy Technical Note 57) rudy garcia 2008

MANURE MINERALIZATION
• Temperature • Moisture • Aeration • C:N Ratio • Cultivation • Other (pH) MANURE
NUTRIENT VARIABILITY • Feed Ration • Bedding • Soil • Moisture • Wasted Feed • Waste Storage • Climate • Time • Animal Type
- % H2O - % Dry Matter - TSS & TDS - Volatile Solids
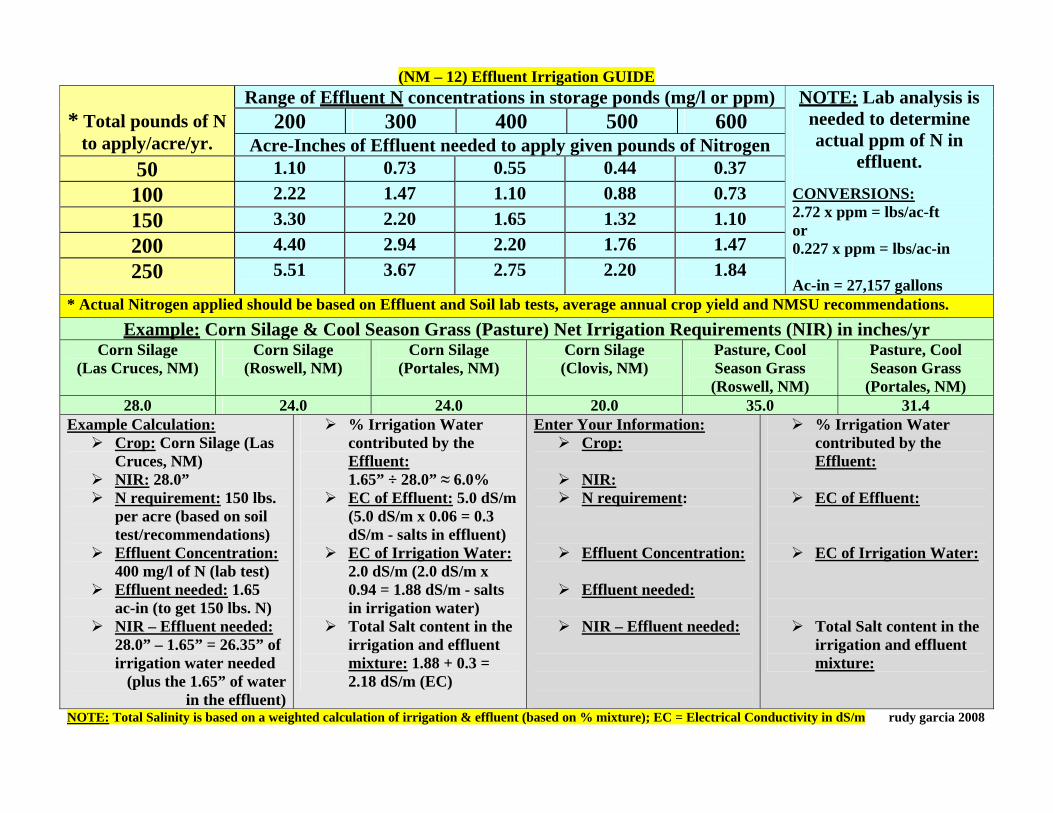
(NM – 12) Effluent Irrigation GUIDE Range of Effluent N concentrations in storage ponds (mg/l or ppm)
200 300 400 500 600
* Total pounds of N to apply/acre/yr. Acre-Inches of Effluent needed to apply given pounds of Nitrogen
50 1.10 0.73 0.55 0.44 0.37 100 2.22 1.47 1.10 0.88 0.73 150 3.30 2.20 1.65 1.32 1.10 200 4.40 2.94 2.20 1.76 1.47 250 5.51 3.67 2.75 2.20 1.84
NOTE: Lab analysis is needed to determine actual ppm of N in
effluent.
CONVERSIONS: 2.72 x ppm = lbs/ac-ft or 0.227 x ppm = lbs/ac-in Ac-in = 27,157 gallons
* Actual Nitrogen applied should be based on Effluent and Soil lab tests, average annual crop yield and NMSU recommendations. Example: Corn Silage & Cool Season Grass (Pasture) Net Irrigation Requirements (NIR) in inches/yr
Corn Silage (Las Cruces, NM)
Corn Silage (Roswell, NM)
Corn Silage (Portales, NM)
Corn Silage (Clovis, NM)
Pasture, Cool Season Grass (Roswell, NM)
Pasture, Cool Season Grass
(Portales, NM) 28.0 24.0 24.0 20.0 35.0 31.4
Example Calculation: Crop: Corn Silage (Las
Cruces, NM) NIR: 28.0” N requirement: 150 lbs.
per acre (based on soil test/recommendations)
Effluent Concentration: 400 mg/l of N (lab test)
Effluent needed: 1.65 ac-in (to get 150 lbs. N)
NIR – Effluent needed: 28.0” – 1.65” = 26.35” of irrigation water needed
(plus the 1.65” of water in the effluent)
% Irrigation Water contributed by the Effluent:
1.65” ÷ 28.0” ≈ 6.0% EC of Effluent: 5.0 dS/m
(5.0 dS/m x 0.06 = 0.3 dS/m - salts in effluent)
EC of Irrigation Water: 2.0 dS/m (2.0 dS/m x 0.94 = 1.88 dS/m - salts in irrigation water)
Total Salt content in the irrigation and effluent mixture: 1.88 + 0.3 = 2.18 dS/m (EC)
Enter Your Information: Crop:
NIR: N requirement:
Effluent Concentration:
Effluent needed:
NIR – Effluent needed:
% Irrigation Water contributed by the Effluent:
EC of Effluent:
EC of Irrigation Water:
Total Salt content in the irrigation and effluent mixture:
NOTE: Total Salinity is based on a weighted calculation of irrigation & effluent (based on % mixture); EC = Electrical Conductivity in dS/m rudy garcia 2008