Embed Size (px)
Citation preview
†† AnAn EdEducatiucationalonal PrProgramogram InitInitiatiateded by theby the
InteInternatirnationalonal Plant NutriPlant Nutrititionon InstInstitituteute (I(IPNI)PNI)
4R Nutrient Stewardship†:
New Mexico Specifics
Robert Flynn, Extension Agronomist
Extension Plant Sciences
Remember what an agronomist is
• Agronomist /ə-’grän-ə-məst/ noun:
– One who studies the science of soil
management and crop production
– One who applies the various soil and plant
sciences to soil management and crop
production; scientific agriculture
Or…
• from Greek: Agros (field) and nomos (to
manage)
• The branch of agriculture that treats of the
principles and practices of crop production and
field management.
• First started, perhaps, in 1843 in Rothamsted,
England to study fertilizer use.

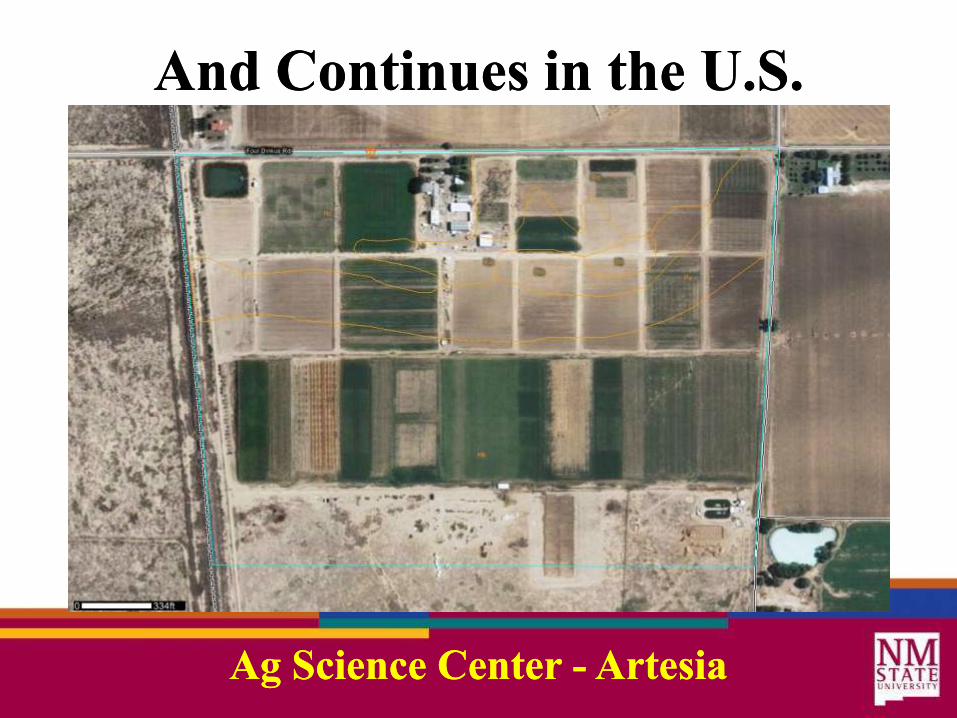
AndAnd ContinuesContinues in thein the U.S.U.S.
AgAg ScienceScience CenterCenter -- ArteArtesiasia

General GGeneral Goaloals fors for BothBoth
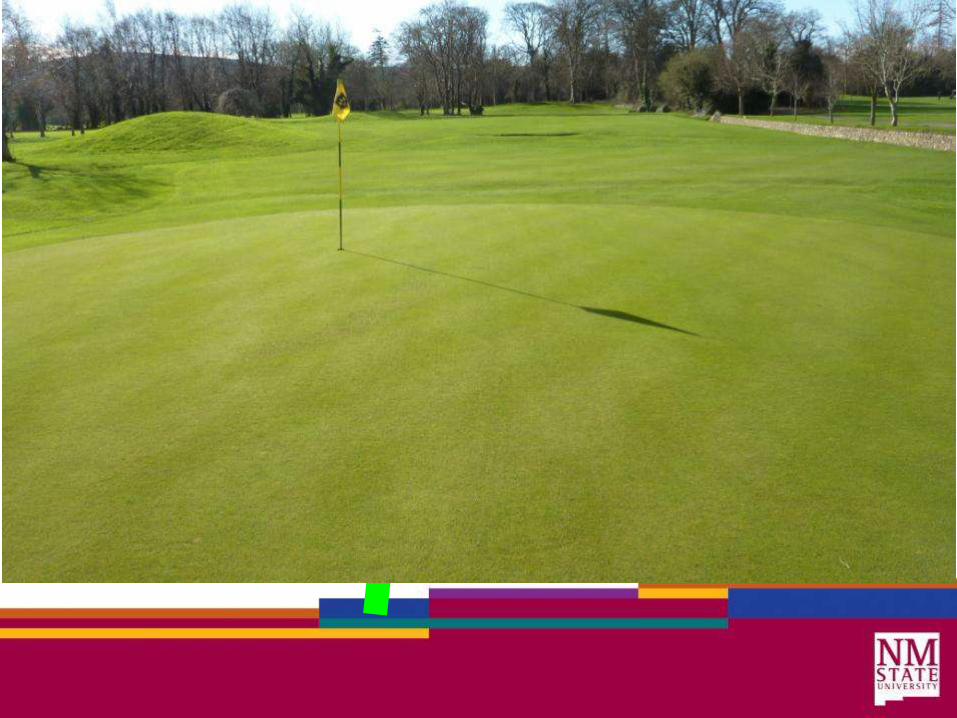
HortiHorticulturacultural andl and Field CropsField Crops • Turf
– Attractive
– Healthy
– Withstand Rigors of Intended Use
• Row Crops
– Chile, Corn, Sorghum, Wheat, others
• Yield
• Quality
• Profitability
• Pecans – Yield
– Quality
• Forages & Grains – Alfalfa
– Small grains for silage
– Small grains for grain
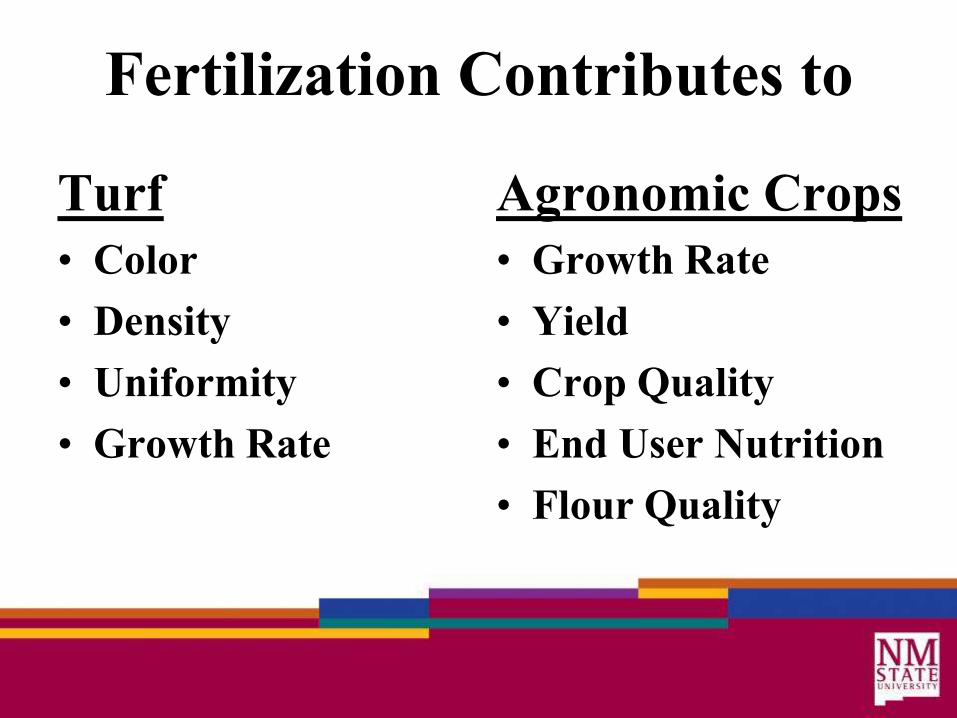
Fertilization Contributes to
Turf
• Color
• Density
• Uniformity
• Growth Rate
Agronomic Crops
• Growth Rate
• Yield
• Crop Quality
• End User Nutrition
• Flour Quality
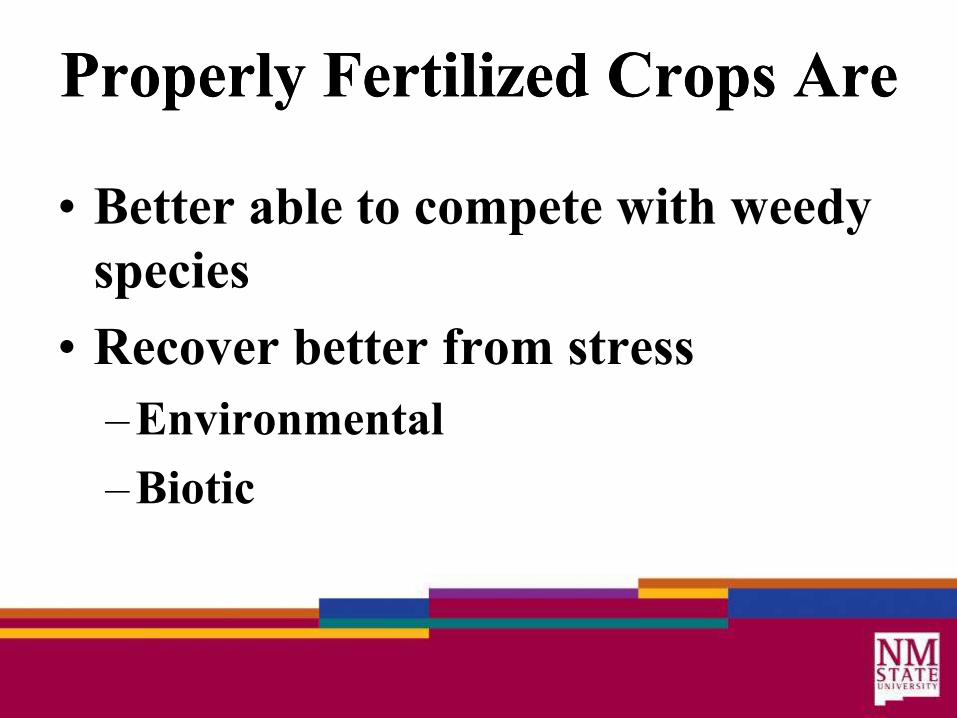
Properly FertilizedProperly Fertilized CropsCrops AreAre
• Better able to compete with weedy
species
• Recover better from stress
– Environmental
– Biotic

So, I could tell you that you need
• 200 – 250 lb N/A
• 80 lb P2O5/A
• 120 lb K2O/A
• Plus other nutrients
• However, ….
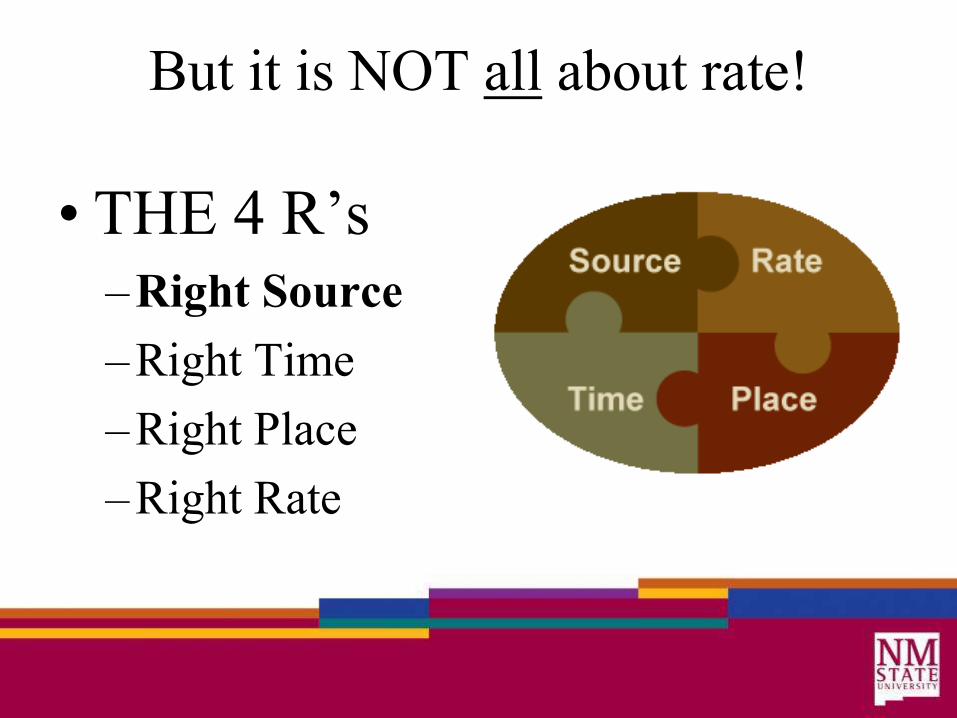
But it is NOT all about rate!
• THE 4 R’s – Right Source
– Right Time
– Right Place
– Right Rate
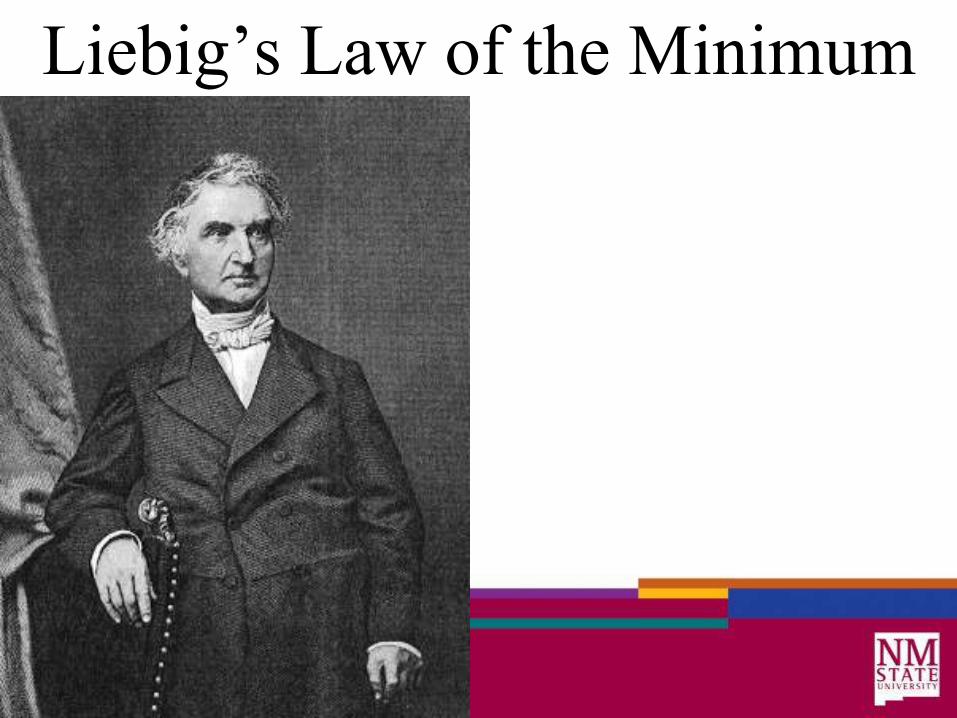
Liebig’s Law of the Minimum
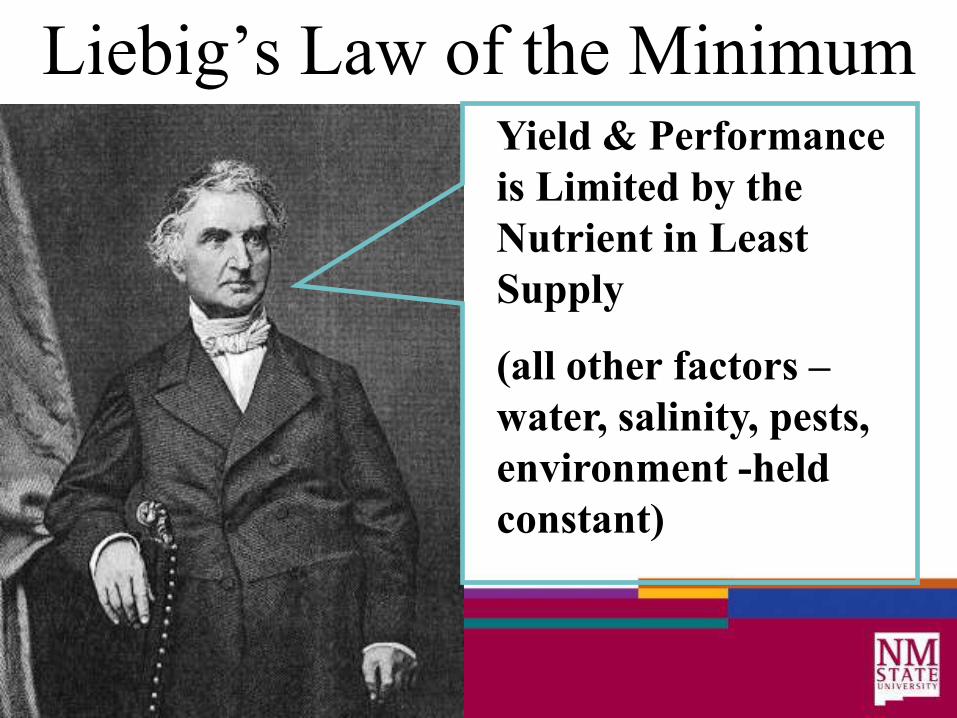
Liebig’s Law of the Minimum Yield & Performance
is Limited by the
Nutrient in Least
Supply
(all other factors – water, salinity, pests,
environment -held
constant)

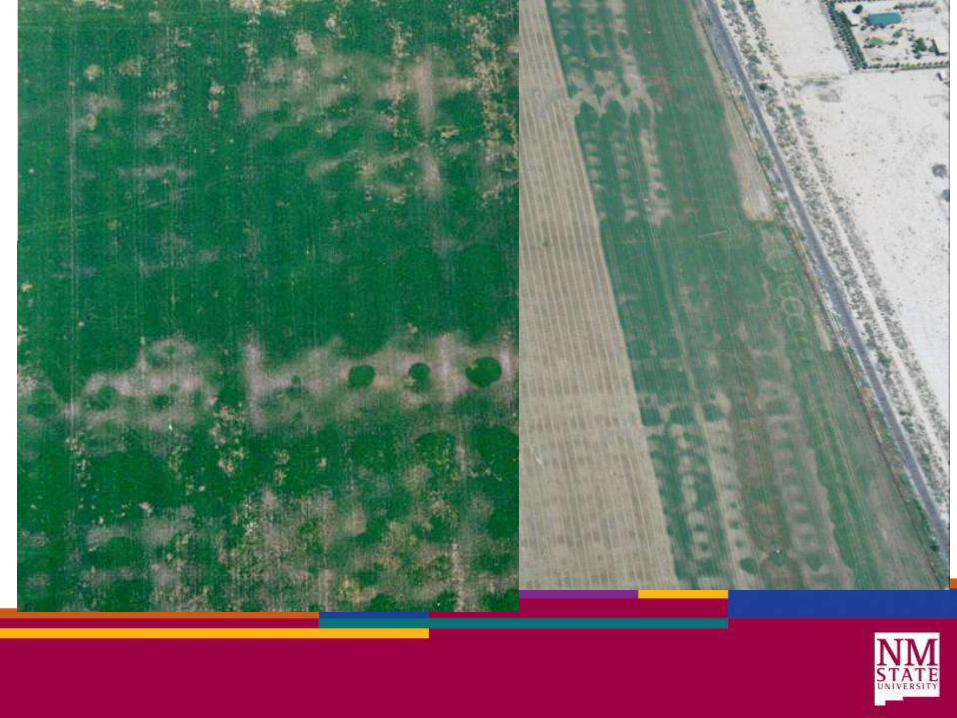
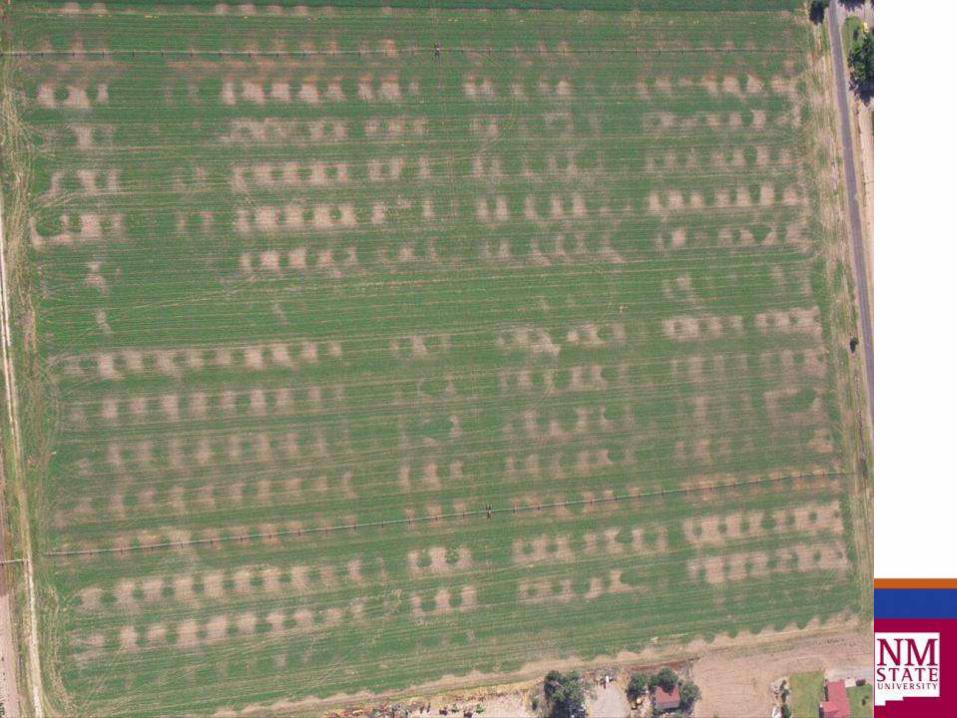
WaterWater is a BIG “other”is a BIG “other” factorfactor
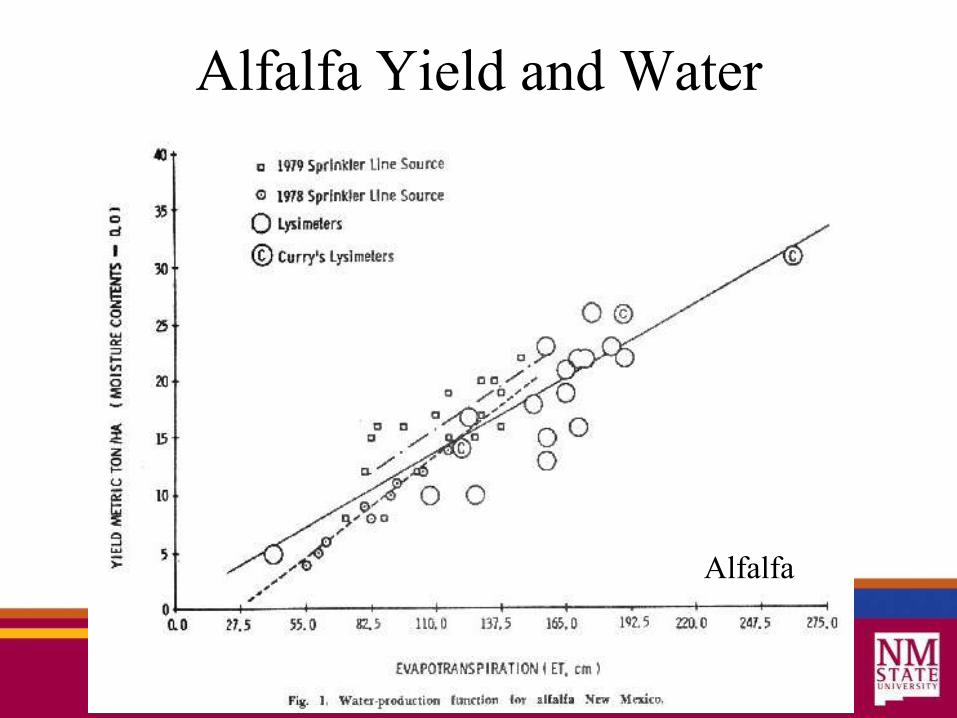
Alfalfa Yield and Water
ALFALFA
Alfalfa
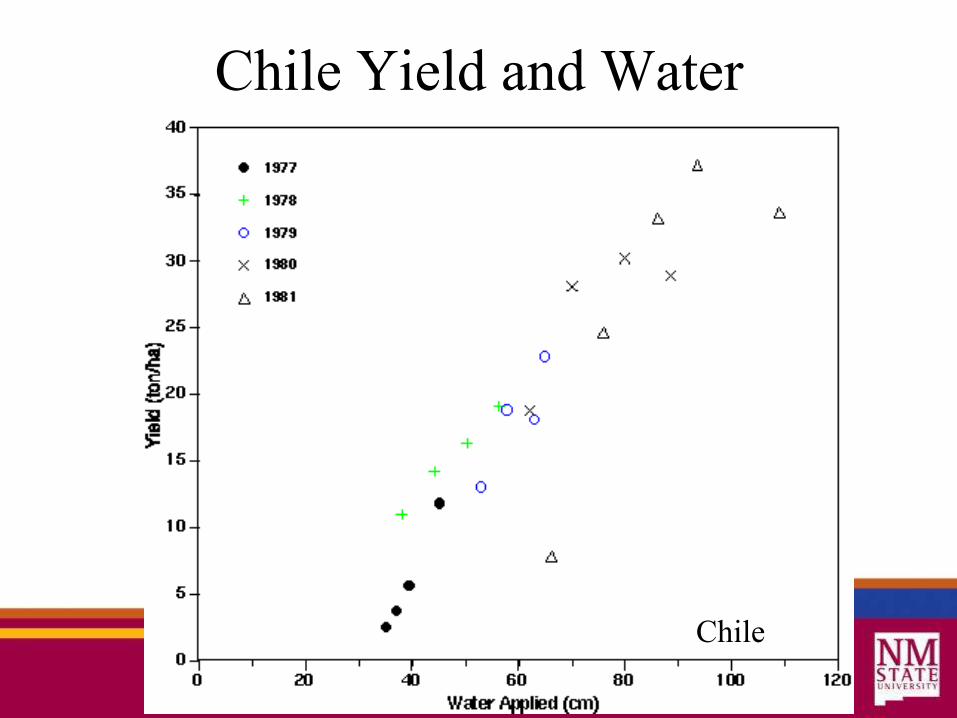
Chile Yield and Water
CHILE
Chile
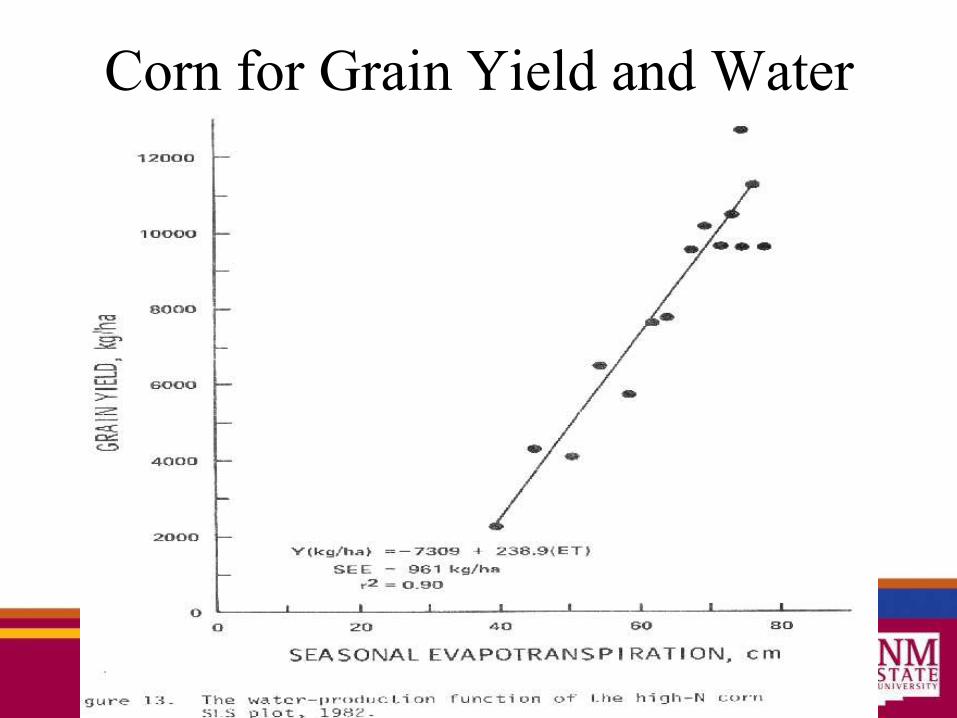
CORN
Corn for Grain Yield and Water


Uphill side Downhill side
FrictionFriction losseslosses

Soil Type Impacts
Crop Response to Irrigation
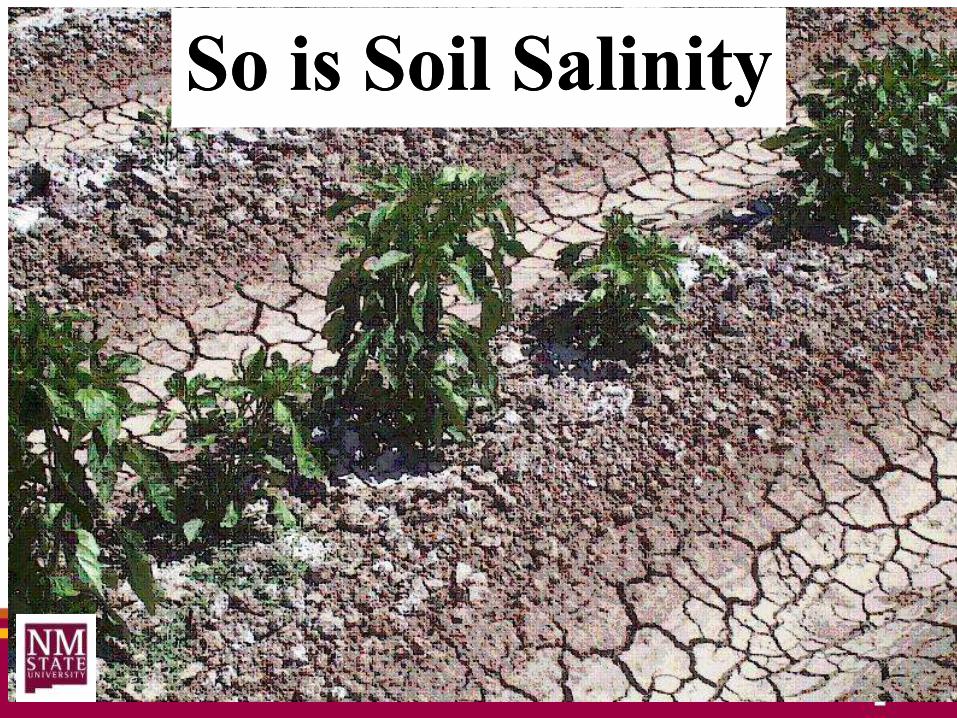
So isSo is Soil SalinitySoil Salinity
In
cre
asi
ng S
ali
nit
y
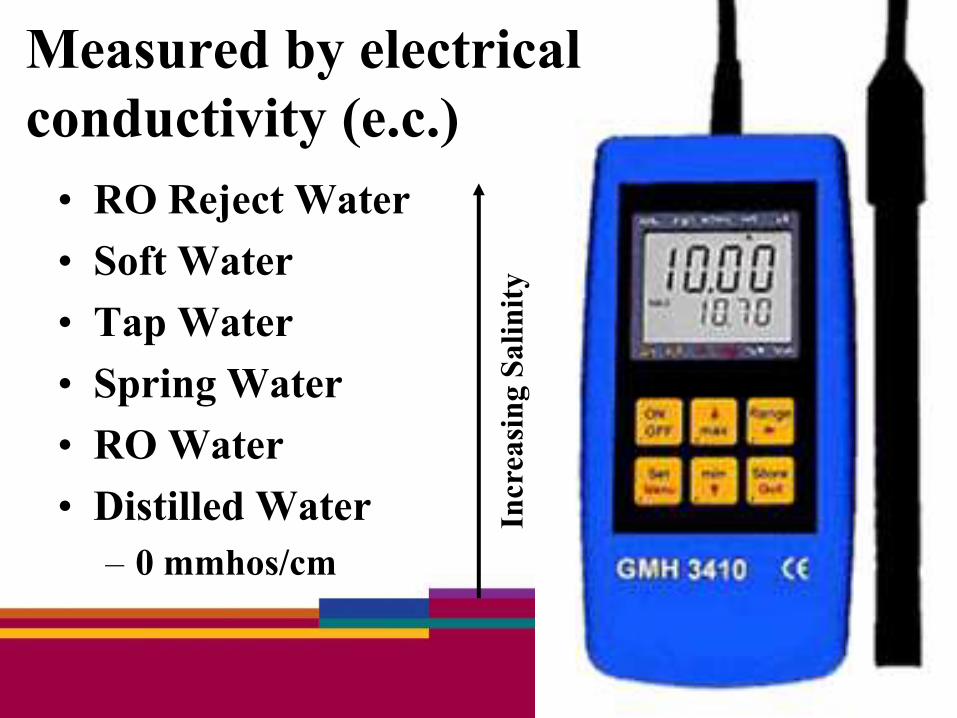
Measured by electrical
conductivity (e.c.)
• RO Reject Water
• Soft Water
• Tap Water
• Spring Water
• RO Water
• Distilled Water
– 0 mmhos/cm
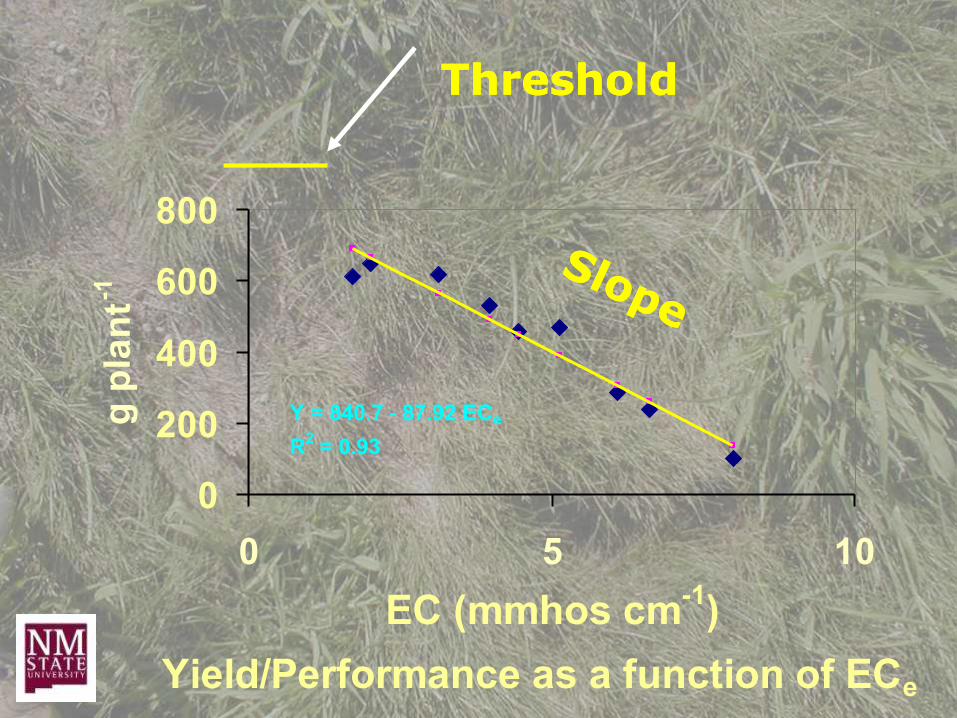
Yield/Performance as a function of ECe
0
200
400
600
800
0 5 10
EC (mmhos cm-1
)
g p
lan
t-1
Y = 840.7 - 87.92 ECe
R2 = 0.93
ThresThreshoholdld
Yield/Performance as a function of ECe
0
200
400
600
800
0 5 10
EC (mmhos cm-1
)
g p
lan
t-1
Y = 840.7 - 87.92 ECe
R2 = 0.93
ThresThreshoholdld

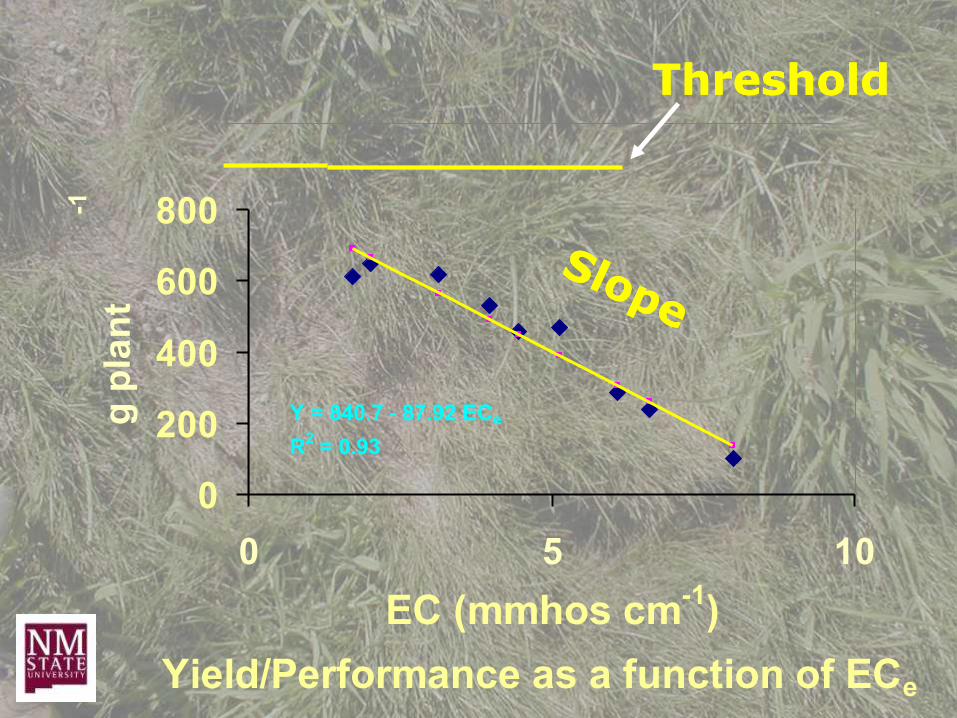
Yield/Performance as a function of ECe
0
200
400
600
800
0 5 10
EC (mmhos cm-1
)
g p
lan
t-1
Y = 840.7 - 87.92 ECe
R2 = 0.93
ThresThreshoholdld
-1
Yield/Performance as a function of ECe
0
200
400
600
800
0 5 10
EC (mmhos cm-1
)
g p
lan
t
Y = 840.7 - 87.92 ECe
R2 = 0.93
ThresThreshoholdld

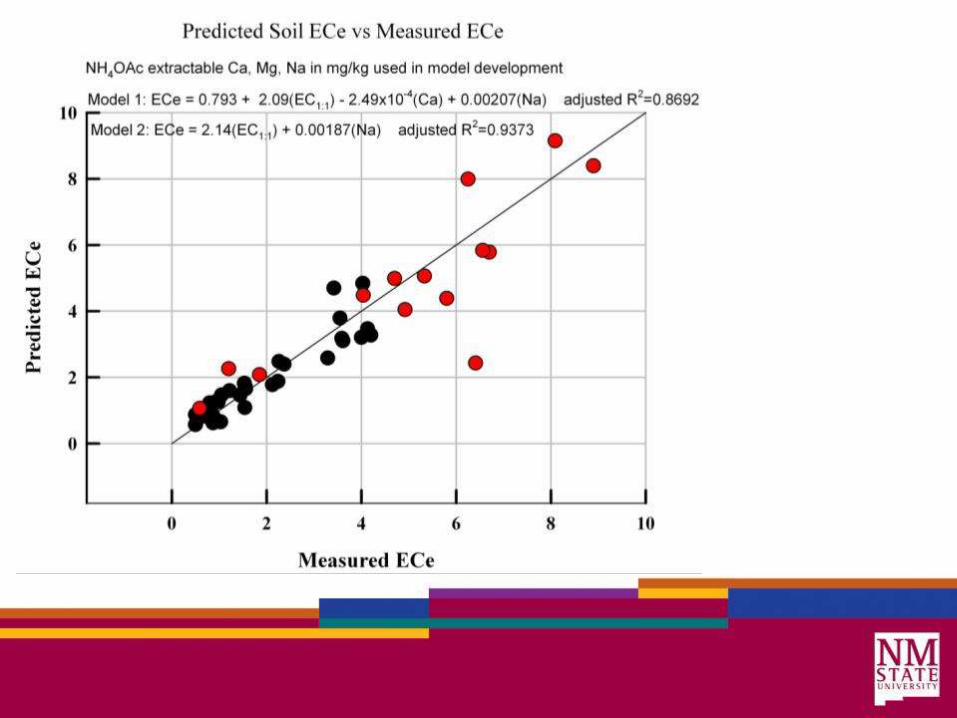
1:11:1 soil:watersoil:water okok
when EC<0.5 mmhos/cmwhen EC<0.5 mmhos/cm
Saturated Paste is Best & Preferred
when EC>0.5 mmhos/cm
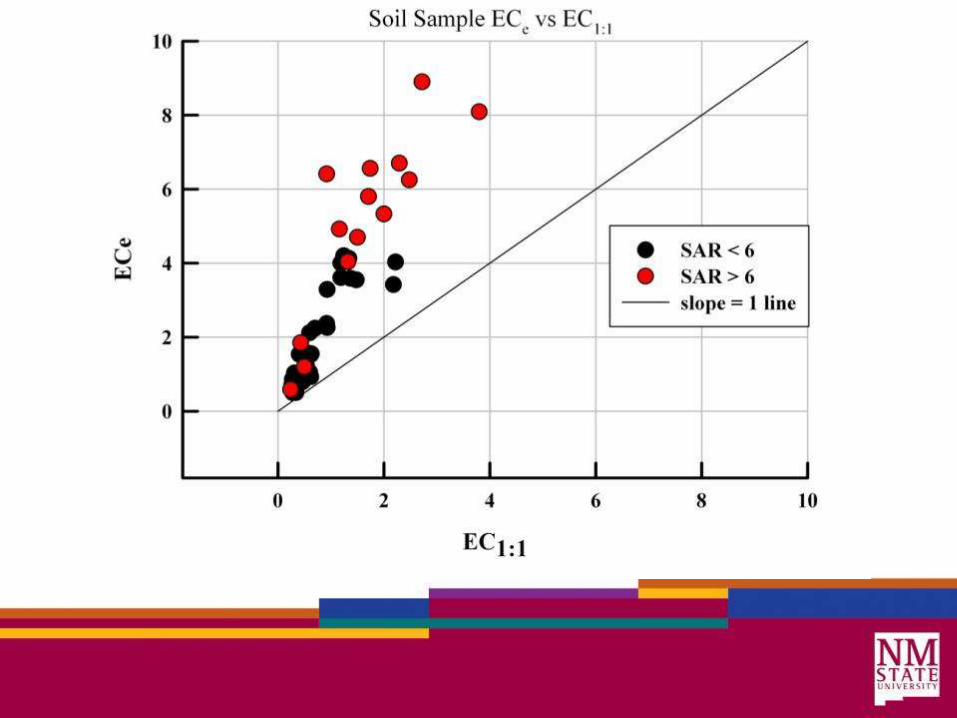

SalinitySalinity & Sodium& Sodium
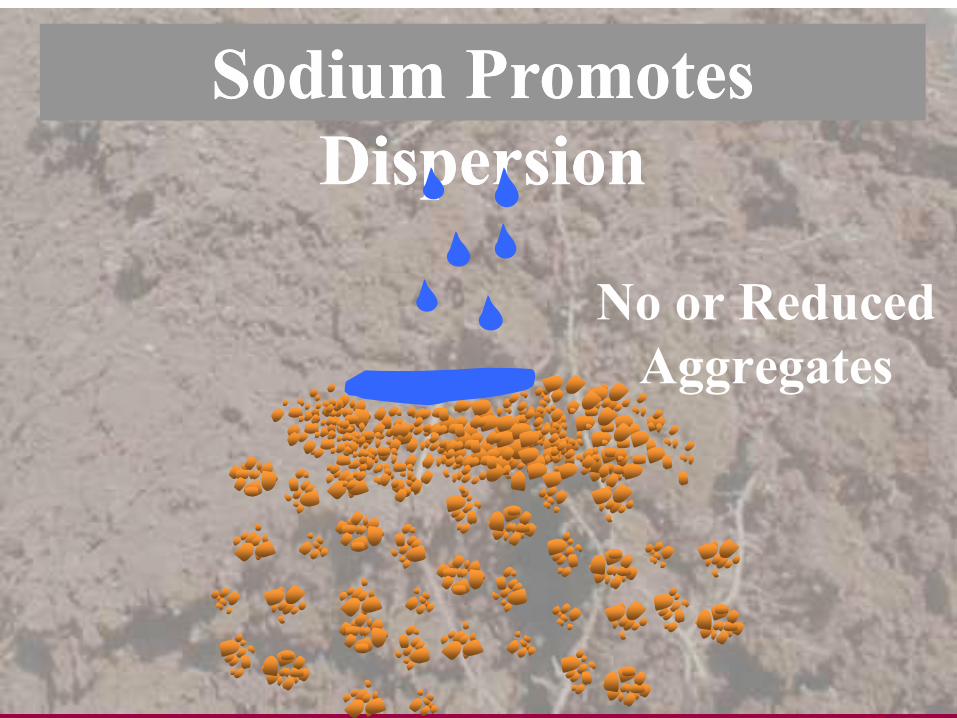
Sodium PrSodium Promotesomotes
DisperDispersionsion
No or Reduced
Aggregates

Sodium Adsorption Ratio
[Na+]
SAR = ([Ca2+] + [Mg2+])/2
(concentrations are in mmol/L)
• High SAR = Unstable Soil
• Low SAR = Stable Soil

- - -- - - -
- - -- - - -
Ca++ =SO4
Ca++ Ca++
- - Ca++
Ca++Na+ Na+ Na+
Ca++ -Na+ -
Na+ Na+
Na+Na+
Na+ Na+
Na+
Excess water must be applied!! Na+ Na+
Must also be good drainage! K+
Manage Sodium in Soil with
Calcium (Gypsum (CaSO4))

TIME = 0
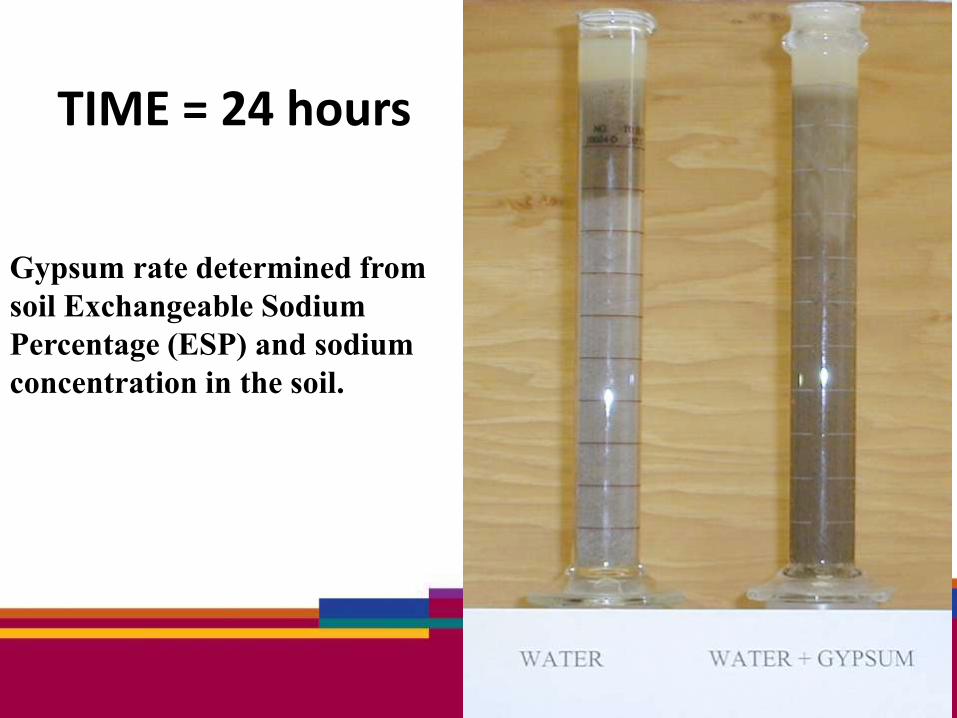
TIME = 24 hours
Gypsum rate determined from
soil Exchangeable Sodium
Percentage (ESP) and sodium
concentration in the soil.
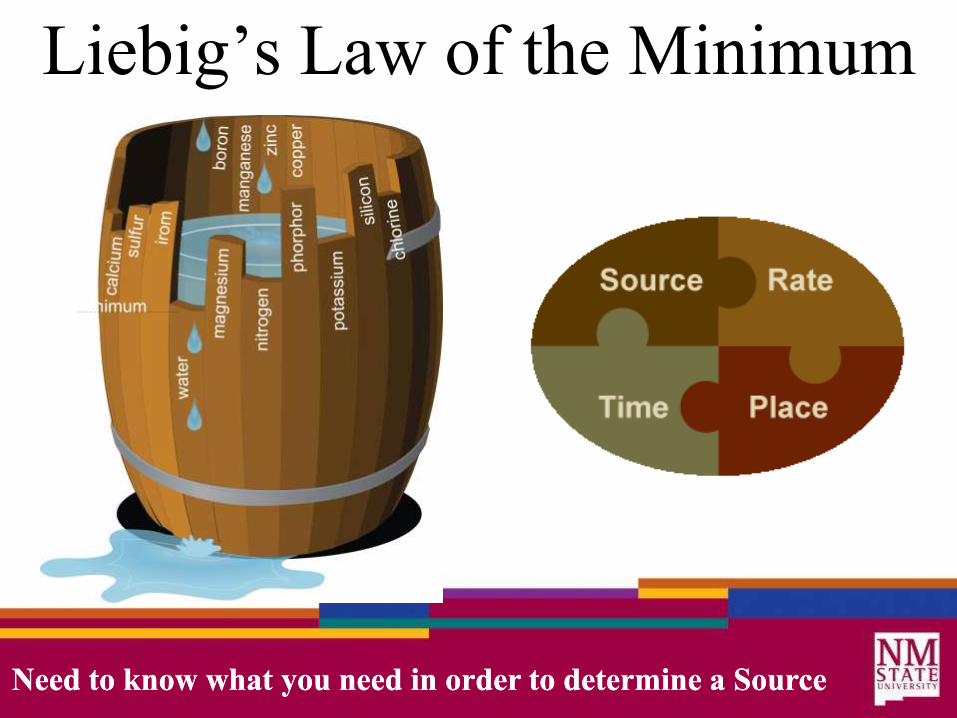
Liebig’s Law of the Minimum
NeedNeed to kto knownow wwhathat you nyou need in ordereed in order to determto determineine a Soua Sourrcece
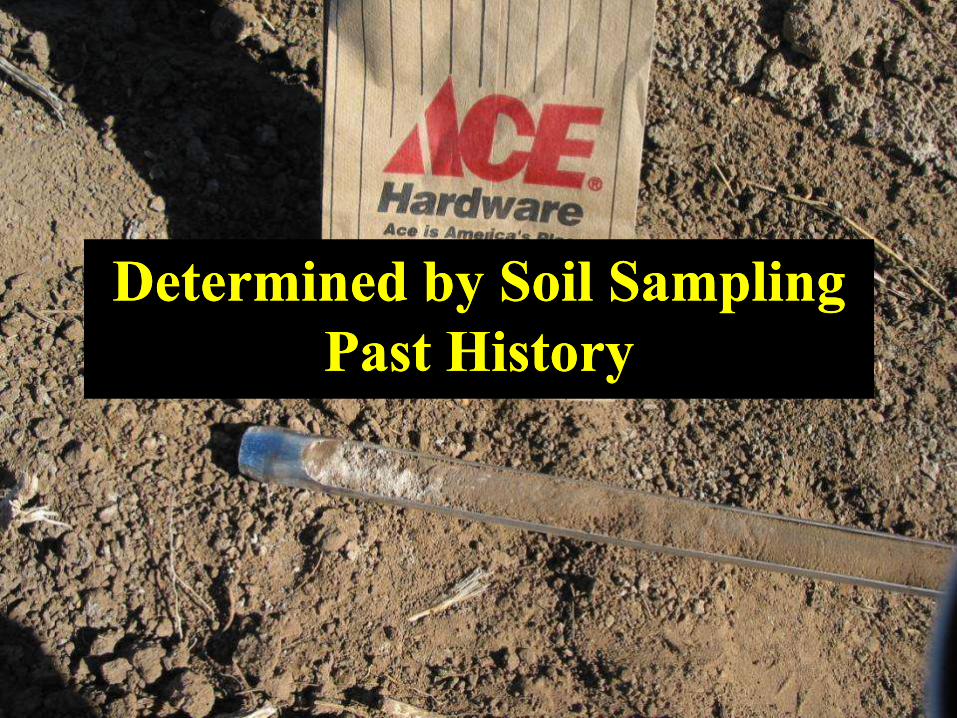
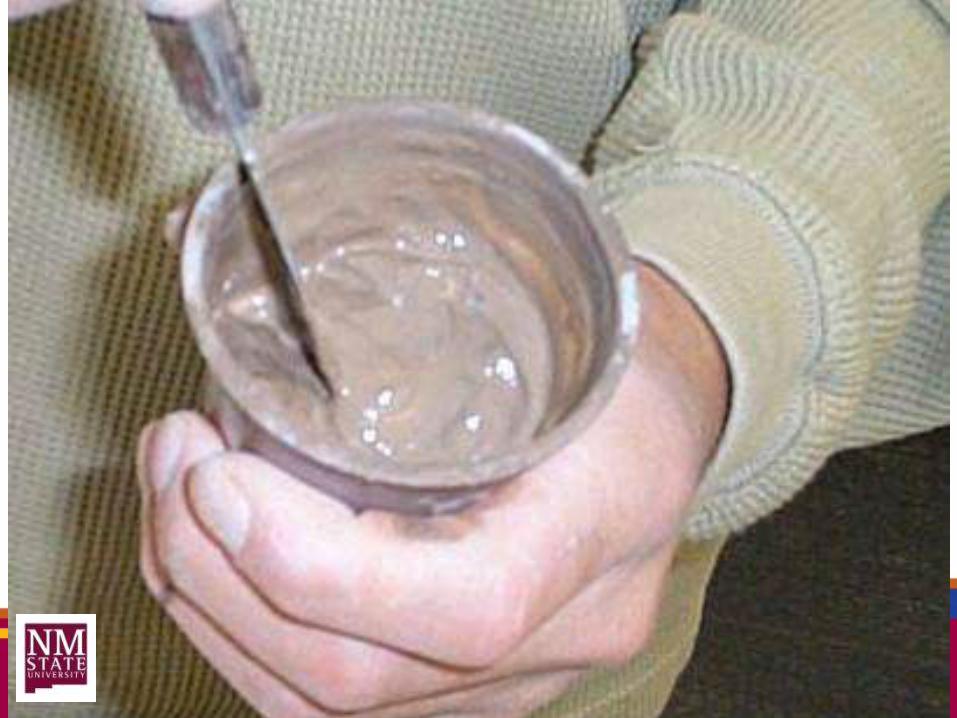
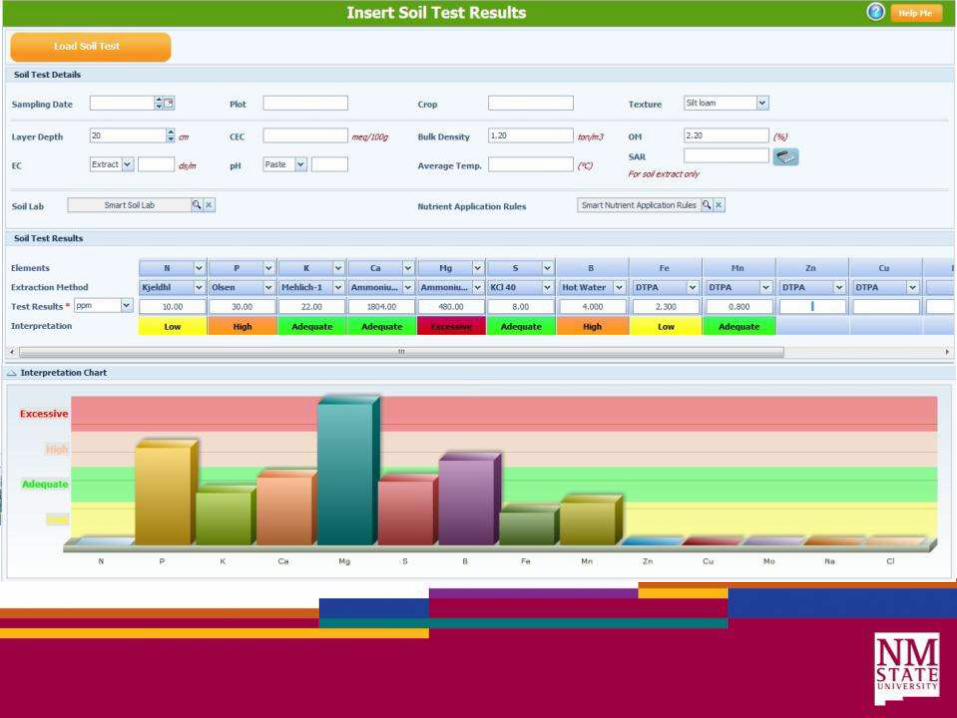
Determined Determined by Soil Samplingby Soil Sampling
Past Past HistoryHistory
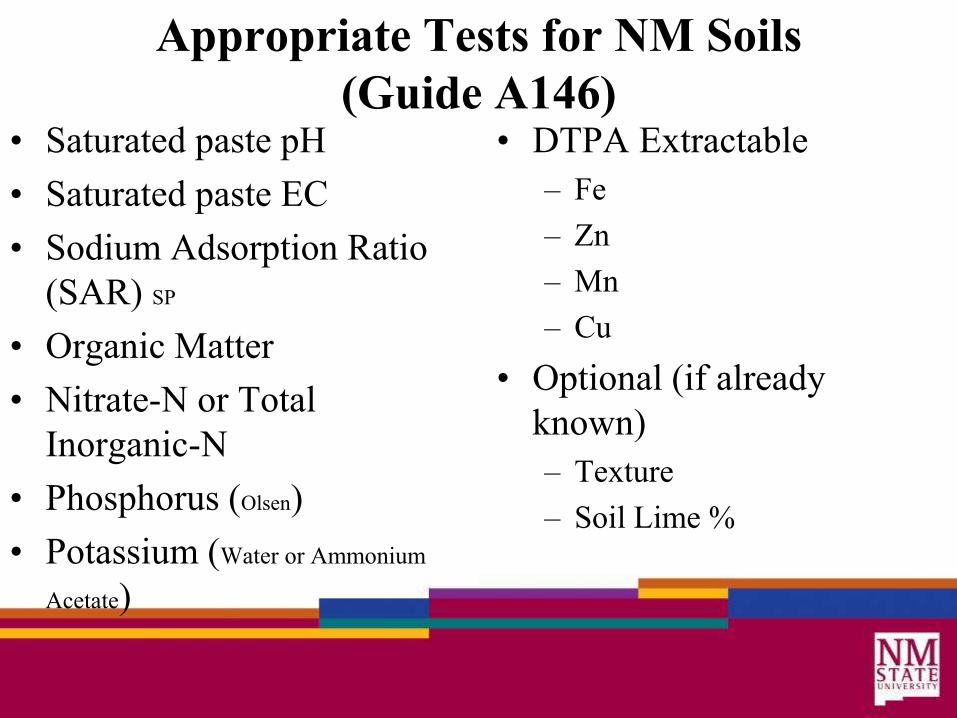
Appropriate Tests for NM Soils
(Guide A146) • Saturated paste pH
• Saturated paste EC
• Sodium Adsorption Ratio
(SAR) SP
• Organic Matter
• Nitrate-N or Total
Inorganic-N
• Phosphorus (Olsen)
• Potassium (Water or Ammonium
Acetate)
• DTPA Extractable
– Fe
– Zn
– Mn
– Cu
• Optional (if already
known)
– Texture
– Soil Lime %

Sampling isSampling is KEYKEY toto the 4R prthe 4R prograogramm
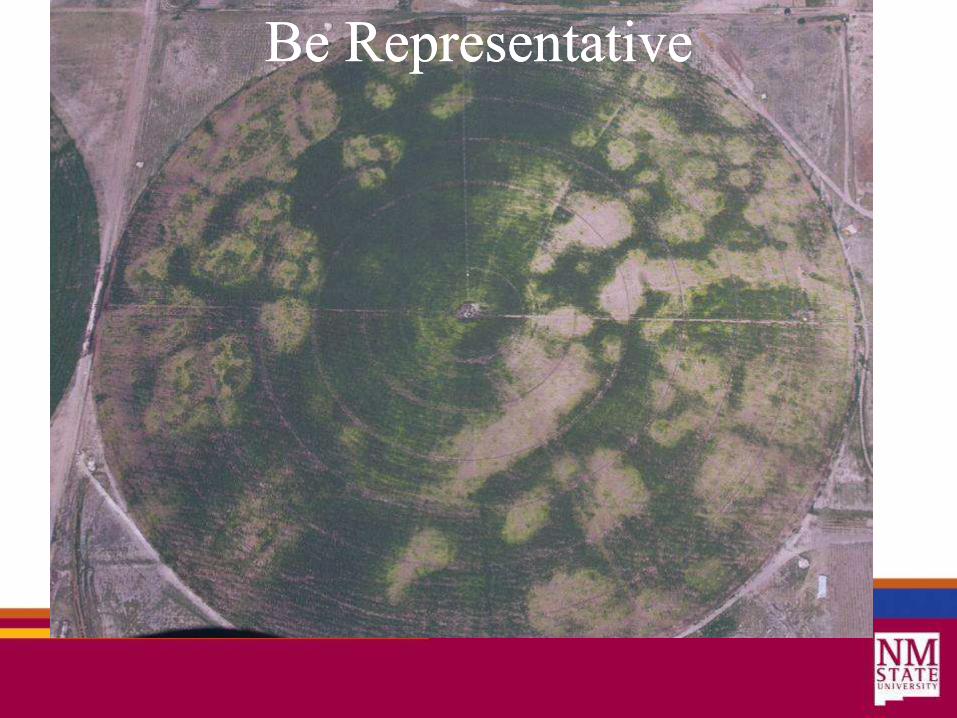
Be RepresenBe Representativetative

Be Representative!

Plant Nutrition
• Soil testing identifies nutrients needed
for productivity
– Low
– Moderate
– Sufficient
– Excessive

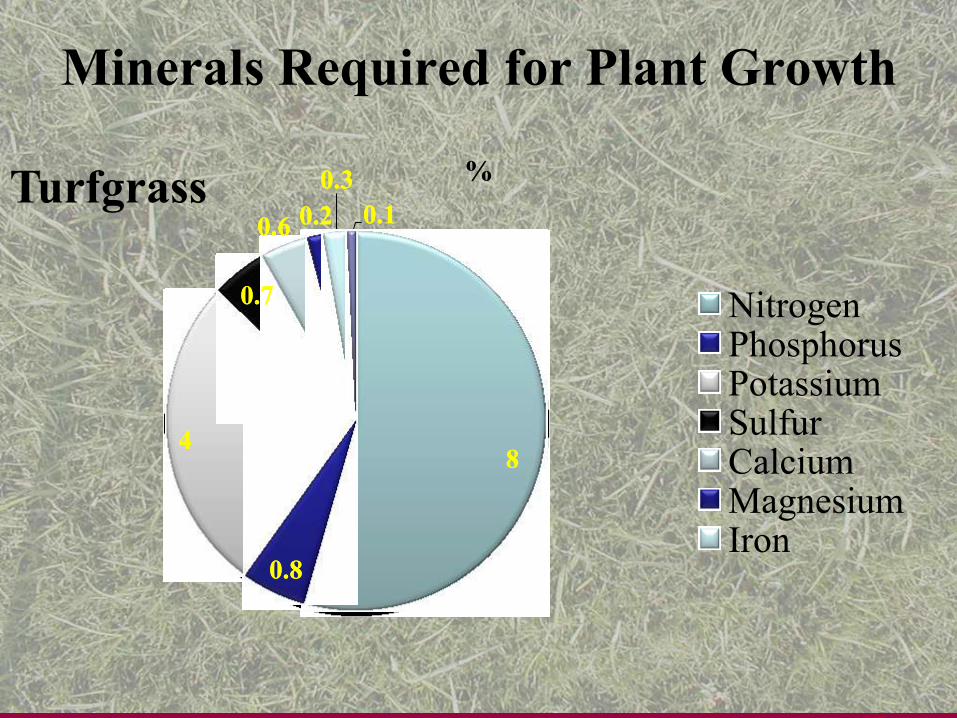
88
0.80.8
44
0.70.7
Turfgrass 0.0.33 %
0.0.22 0.0.110.0.66
Nitrogen Phosphorus Potassium Sulfur Calcium Magnesium Iron
Minerals Required for Plant Growth
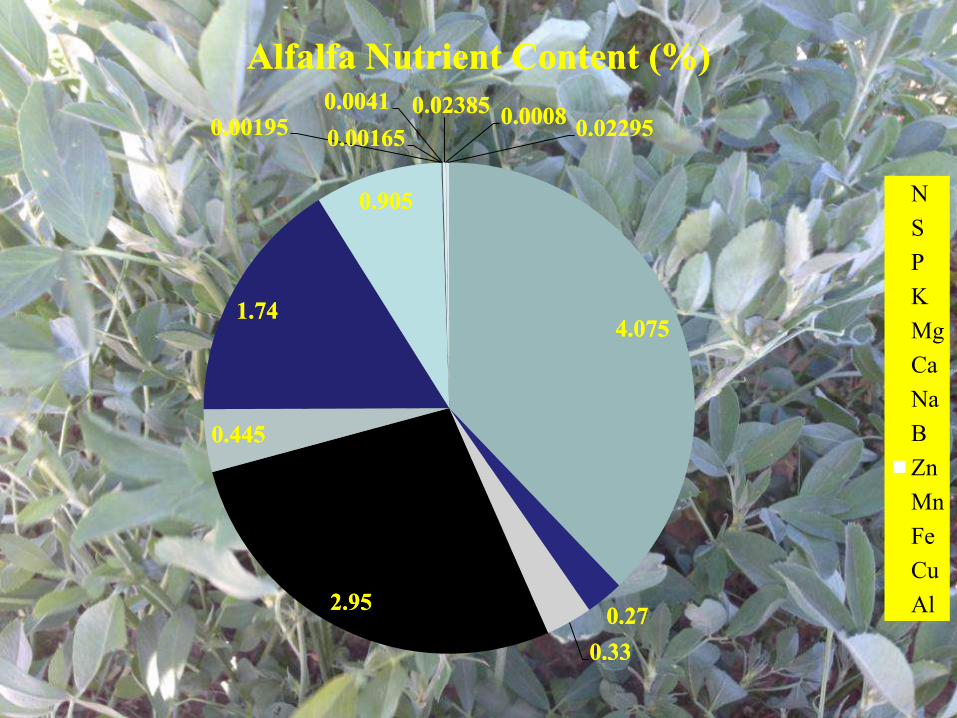
0.0.00410041
4.0754.075
2.952.95
0.4450.445
1.741.74
0.9050.905
0.001950.00195 0.022950.0.001650.00165
0.023850.02385 0.00080.0008
02295
N
S
P
K
Mg
Ca
Na
B
Zn
Mn
Fe
Cu
Al0.0.2727
0.0.3333
AlfaAlfalfalfa NutrientNutrient ConContenttent (%)(%)
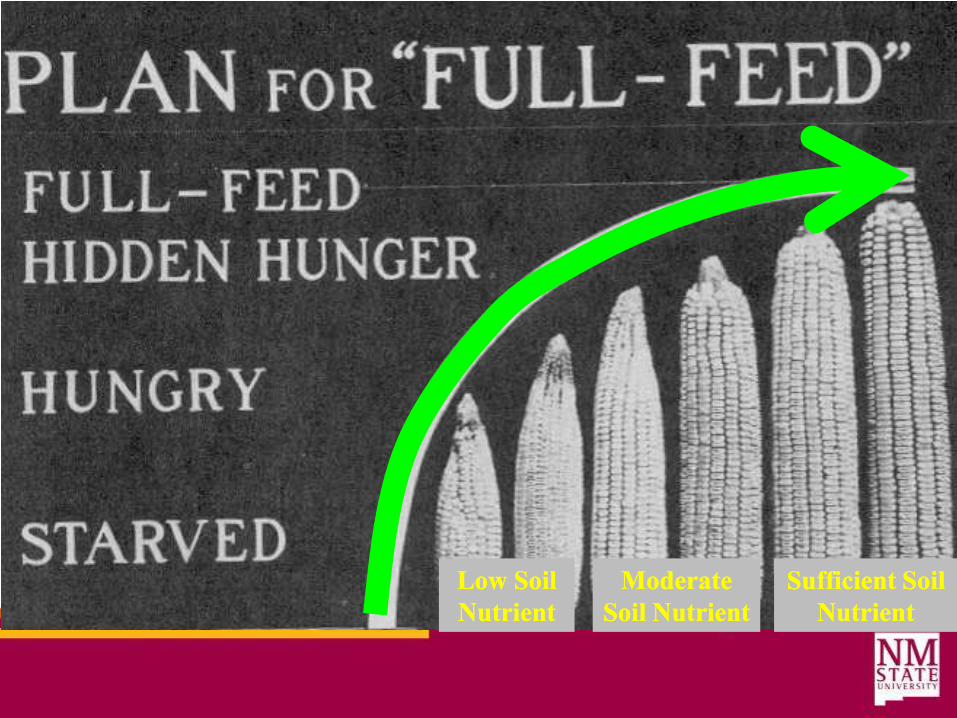
Low SoilLow Soil
NutrientNutrient
ModerateModerate
Soil NutrientSoil Nutrient
Sufficient SoilSufficient Soil
NutrientNutrient
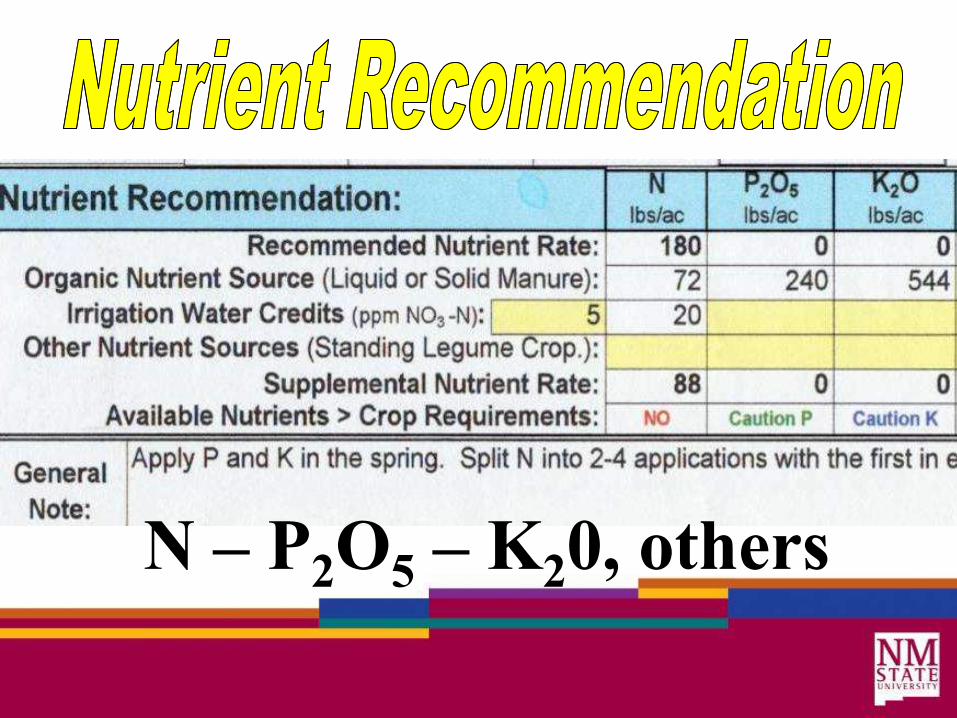
N – P2O5 – K20, others
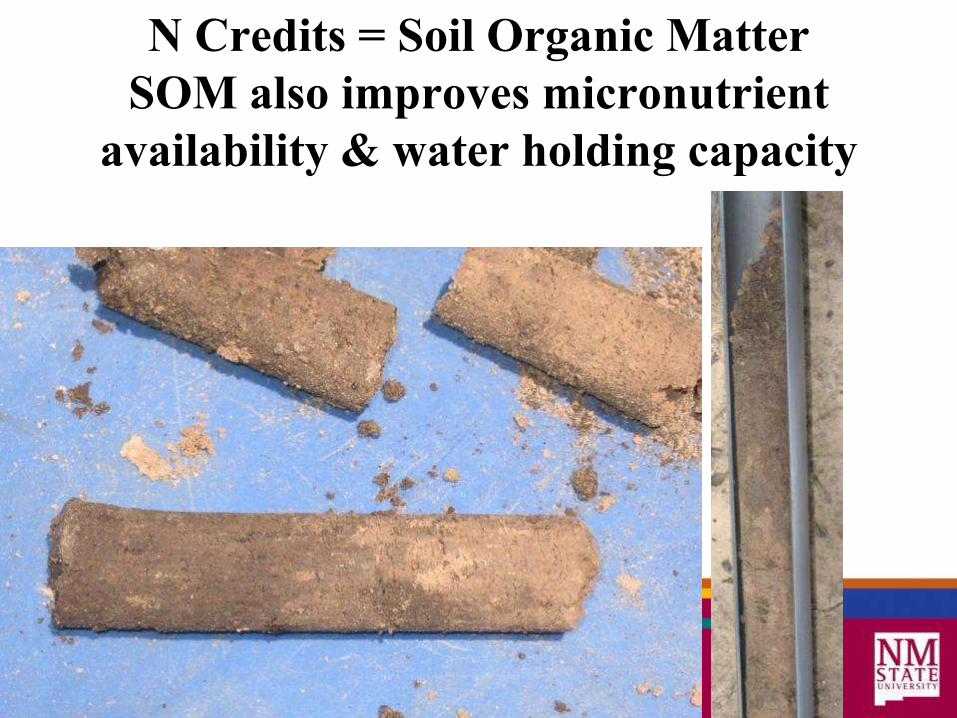
N Credits = Soil Organic Matter
SOM also improves micronutrient
availability & water holding capacity
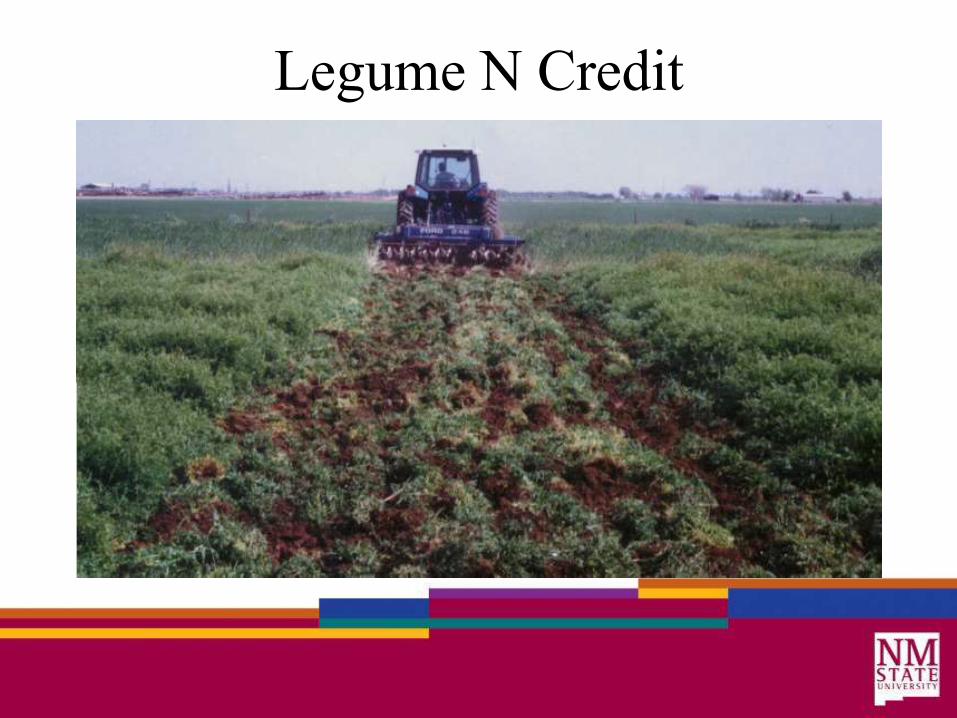
Legume N Credit

Manure Nutrient Credit
• Average 35 lb Total N/dry ton (8-12 lb available
N).
• NMSU Soil Test Interpretation Workbook will
subtract out
– potential volatilization losses of the NH4 content
– De-nitrification (N2) losses depending on soil organic
matter levels and soil drainage class
– Mineralized N from the organic N pool in manure is
estimated based on literature or C:N ratio

Other Manure Nutrient Credits
per Dry Ton
Nutrient
• Phosphorus
• Potash
• Calcium
• Magnesium
• Iron Credit
• Zinc
• Total Salt
Pounds per Dry Ton
• 24
• 50
• 63
• 15
• 7.2
• 0.3
• 51

0
20
40
60
80
100
120
140
160
Cl
P2O
5
K2O
Na O
rg. N
NH4-N
lbs p
er
acre
in
ch
EffluentEffluent CharacteristicsCharacteristics
706 lb total salt per acre inch706 lb total salt per acre inch
Fall 2003, n = 48 sampled dairies
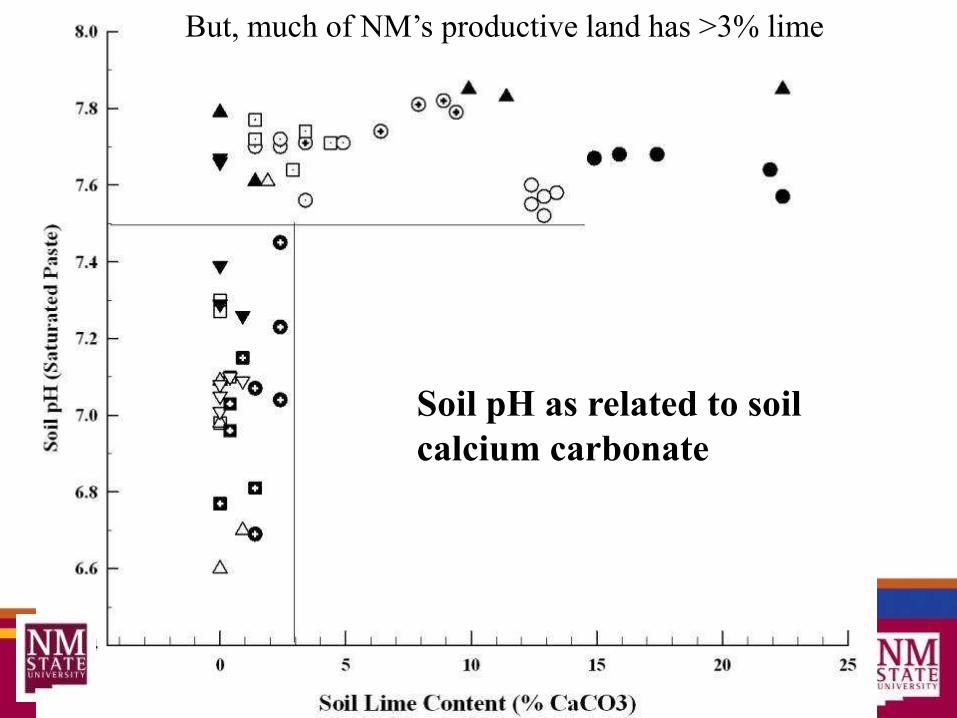
But, much of NM’s productive land has >3% lime
Soil pH as related to soil
calcium carbonate


Soil pH = 7.3
Iron = 12 ppm (VH)
Free lime = medium
(~2%)
Choices:
Elemental S
Ironite
Sequestar
Fe-EDDHA
Fertilome’s Chelated
(EDTA) Liquid Iron
Product


Client results
• Fertilome & Ironite is a very rich green color.
Most successful products.
• EDDHA had not greened up much
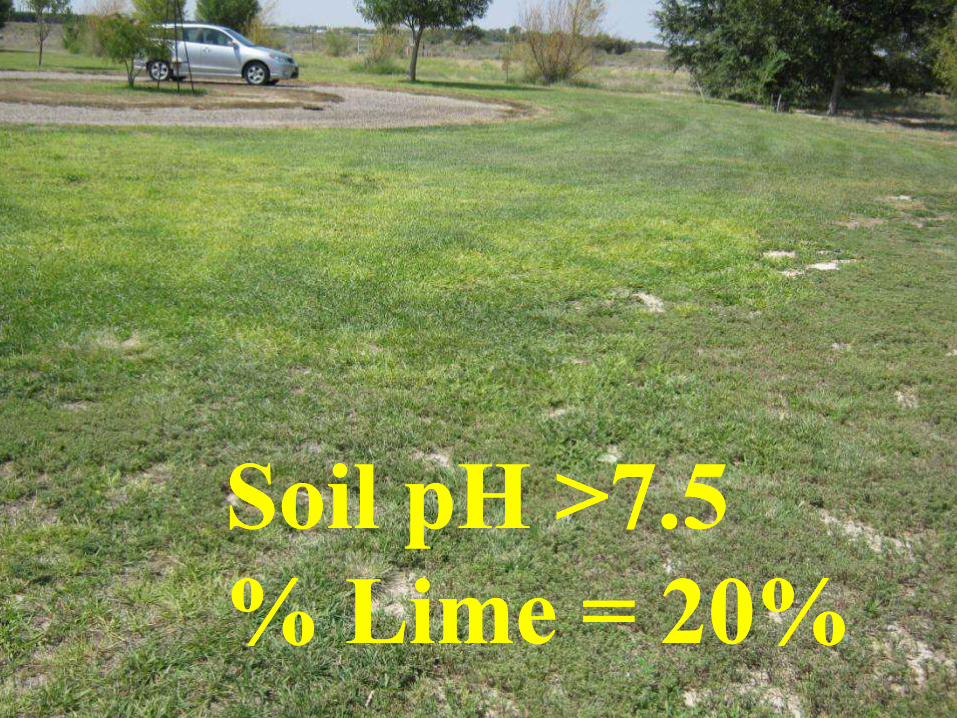
Soil pHSoil pH >7.5>7.5
% Lime = 20%% Lime = 20%

EDDHA Chelate
• Miller’s Ferriplus
• Some additional N may
help the chelate do a
better job.


The Chelates
• Organic Molecules that “hold” metals like
Iron, Zinc, Nickel, etc.
• Hampene
– (Fe)EDTA
• Sequestrene 138
– (Fe)DTPA
Miller’s Ferriplus (Fe)EDDHA
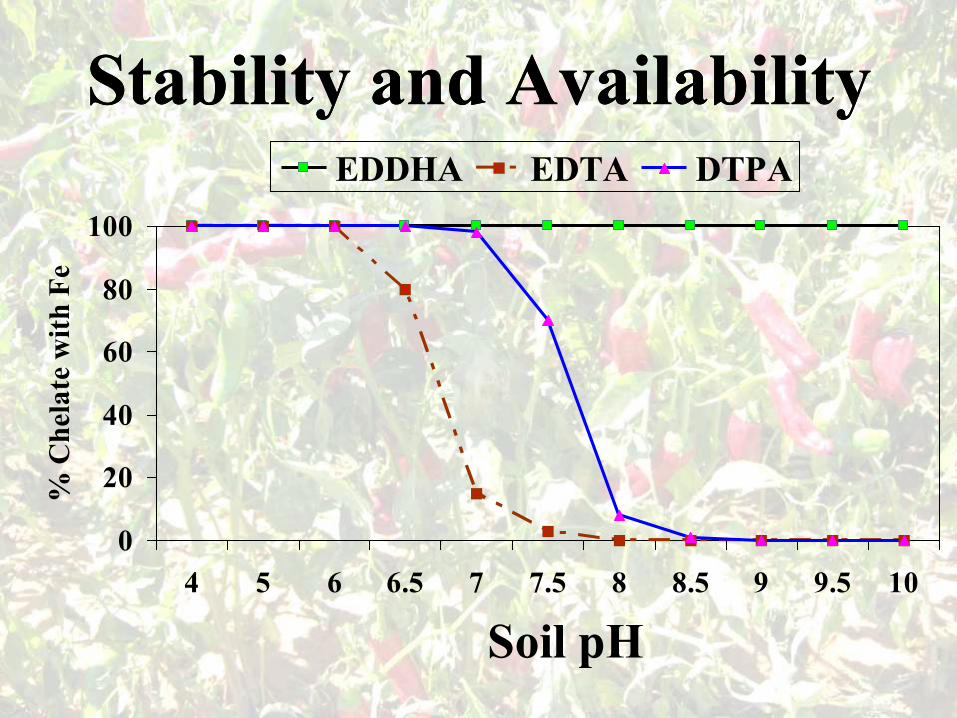
StabStability and Aility and Availabilityvailability
0
20
40
60
80
100
4 5 6 6.5 7 7.5 8 8.5 9 9.5 10
Soil pH
% C
hel
ate
wit
h F
e
EDDHA EDTA DTPA

Chelate Effectiveness
0
5
10
15
20
0 2 4 6 8
Fe added (ppm)
Yie
ld (
lb/p
ot)
FeEDDHA FeDTPA FeEDTA
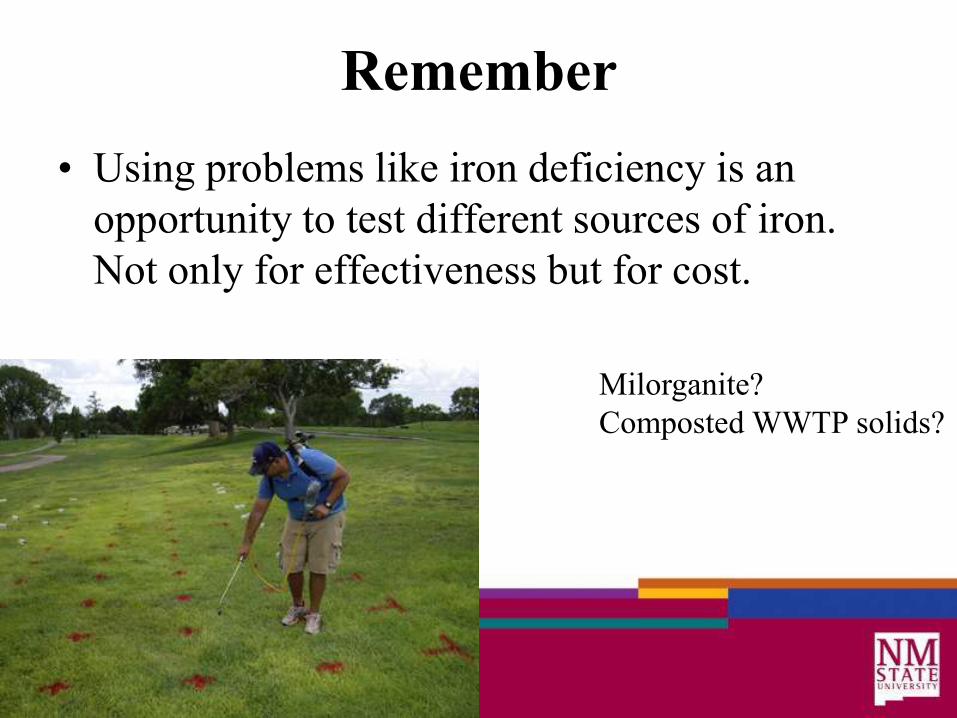
Remember
• Using problems like iron deficiency is an
opportunity to test different sources of iron.
Not only for effectiveness but for cost.
Milorganite?
Composted WWTP solids?
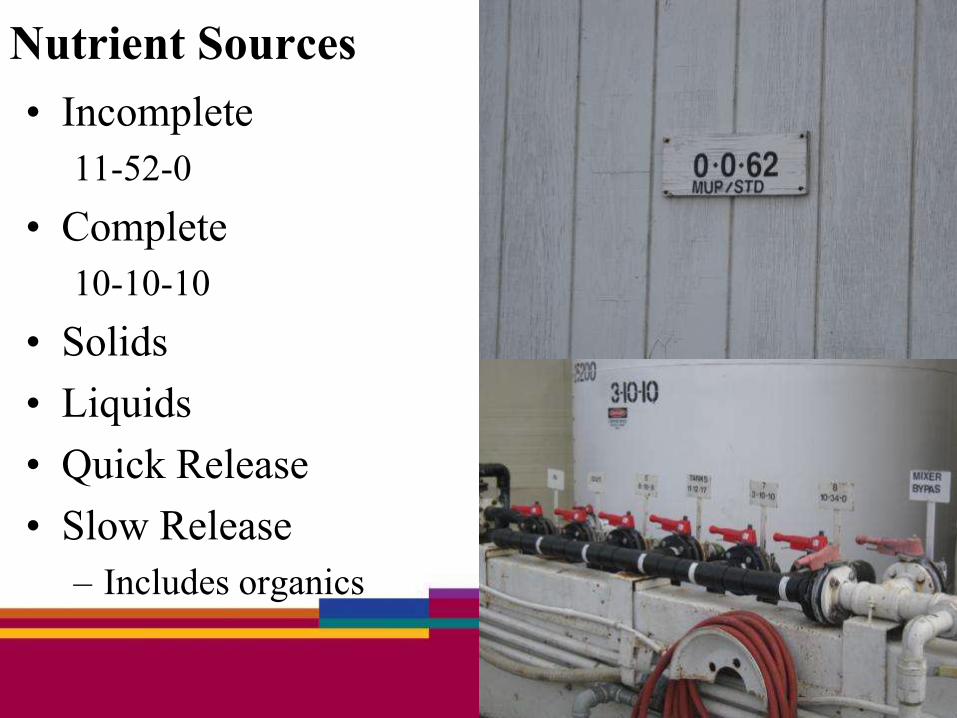
Nutrient Sources
• Incomplete
11-52-0
• Complete
10-10-10
• Solids
• Liquids
• Quick Release
• Slow Release
– Includes organics
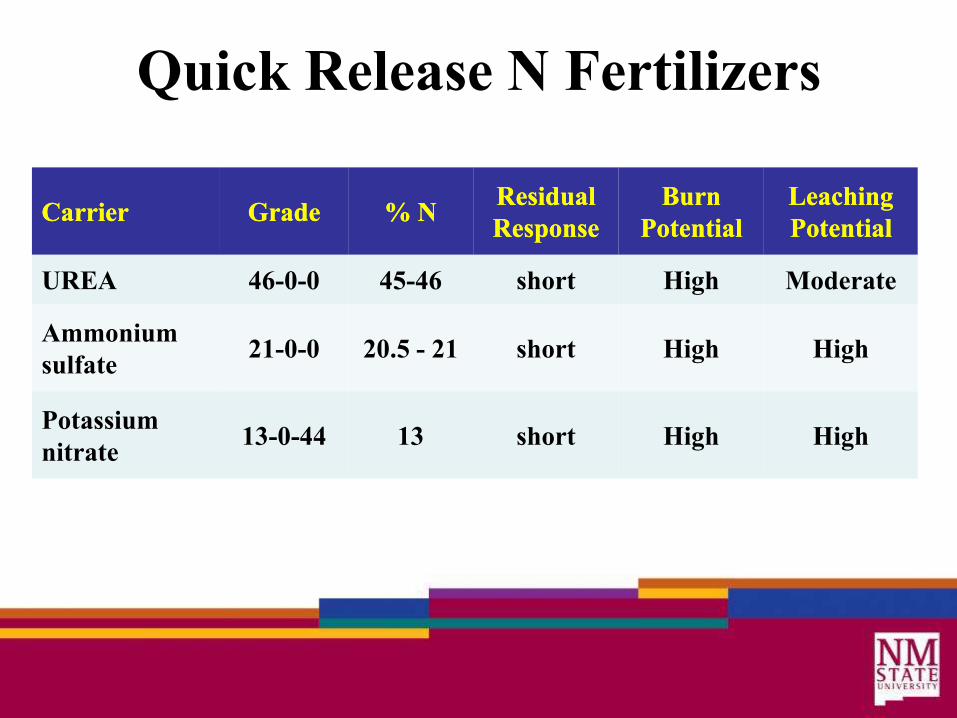
Quick Release N Fertilizers
ResiduaResiduall Burn Burn LeLeaching aching CaCarrirrierer GradGradee %% N N
RespoResponsense PotPotentialential PotPotentialential
UREA 46-0-0 45-46 short High Moderate
Ammonium
sulfate 21-0-0 20.5 - 21 short High High
Potassium
nitrate 13-0-44 13 short High High
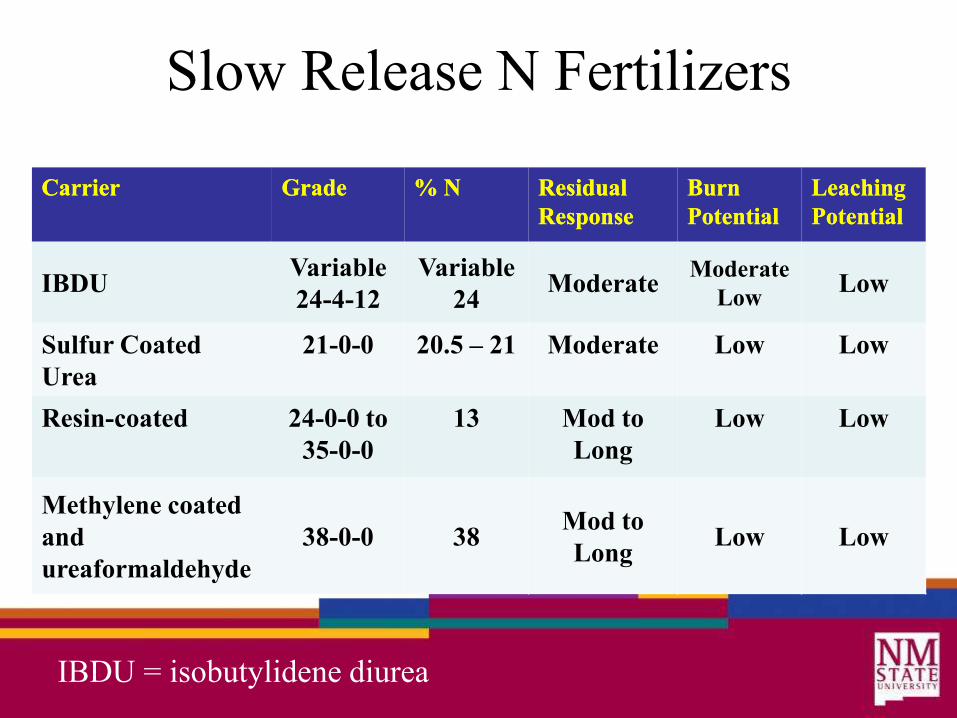
Slow Release N Fertilizers
CarrCarrieier r GrGradeade %% N N ResiduResidual al BuBurnrn LeacLeachinhingg
RespResponsonsee PotePotentialntial PotePotentialntial
IBDU Variable
24-4-12
Variable
24 Moderate
Moderate
Low Low
Sulfur Coated 21-0-0 20.5 – 21 Moderate Low Low
Urea
Resin-coated 24-0-0 to 13 Mod to Low Low
35-0-0 Long
Methylene coated
and
ureaformaldehyde
38-0-0 38 Mod to
Long Low Low
IBDU = isobutylidene diurea
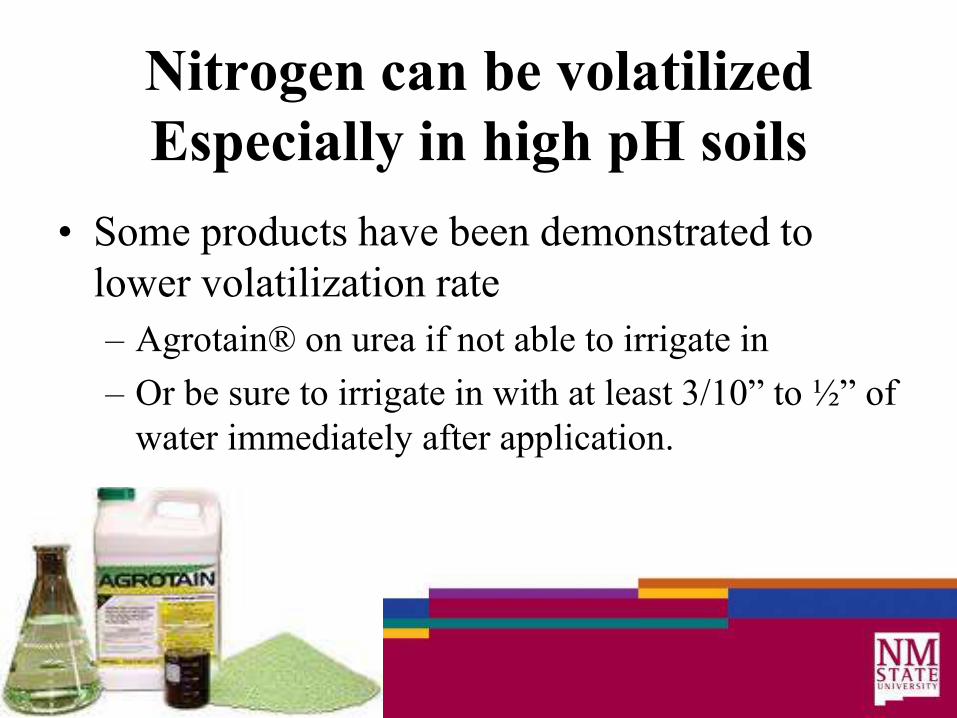
Nitrogen can be volatilized
Especially in high pH soils
• Some products have been demonstrated to
lower volatilization rate
– Agrotain® on urea if not able to irrigate in
– Or be sure to irrigate in with at least 3/10” to ½” of
water immediately after application.

Nitrogen Carriers
• Ammonium Sulfate (NH4+)
• Urea (CH4N2O)
• UAN (Urea Ammonium Nitrate)
• Calcium Nitrate (Ca(NO3)2)
• Ammonium Nitrate (NH4NO3)
• Organic Sources through Mineralization

Beware of Volatilization / Leaching
• Ammonium containing
fertilizers subject to
volatilization losses.
– Additives may reduce
volatility (eg. Agrotain)
• Nitrate containing
fertilizers subject to
leaching with too much
applied water.
ppm NO3-N
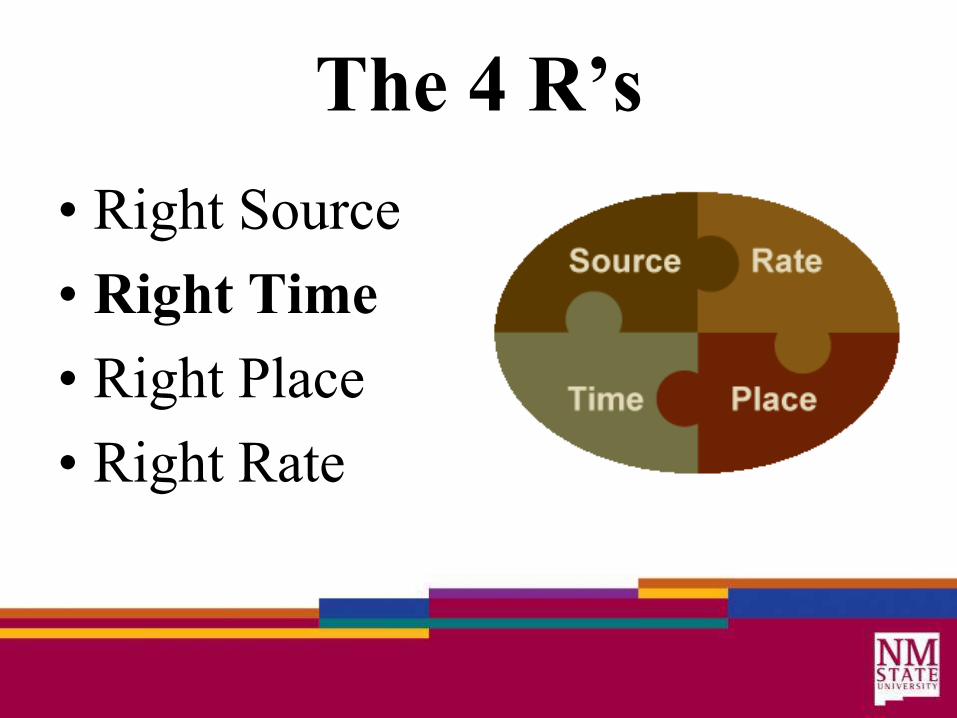
The 4 R’s
• Right Source
• Right Time
• Right Place
• Right Rate
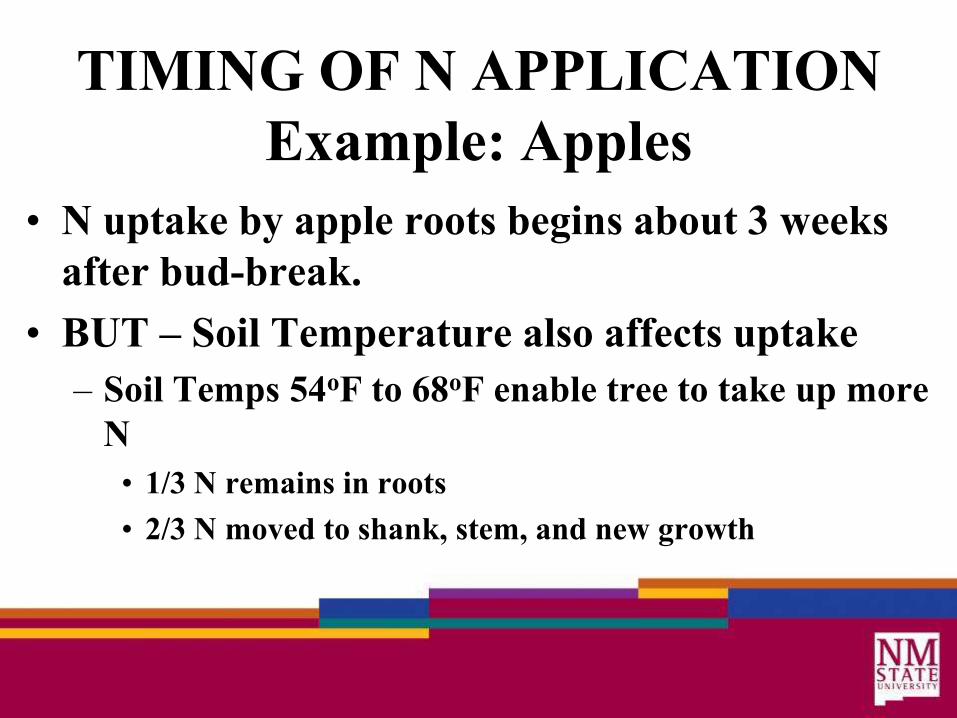
TIMING OF N APPLICATION
Example: Apples
• N uptake by apple roots begins about 3 weeks
after bud-break.
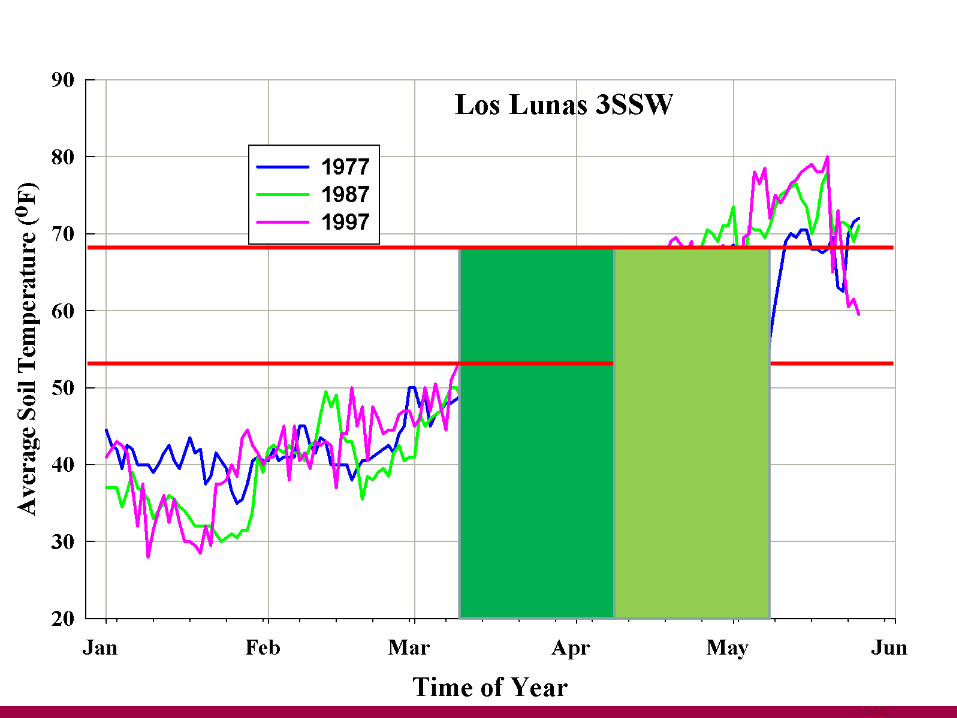
• BUT – Soil Temperature also affects uptake
– Soil Temps 54oF to 68oF enable tree to take up more
N
• 1/3 N remains in roots
• 2/3 N moved to shank, stem, and new growth

Timing Important for Irrigated Fields
Flood/Furrow Irrigated Fields
No Effluent or
Manure
With Effluent
or Manure
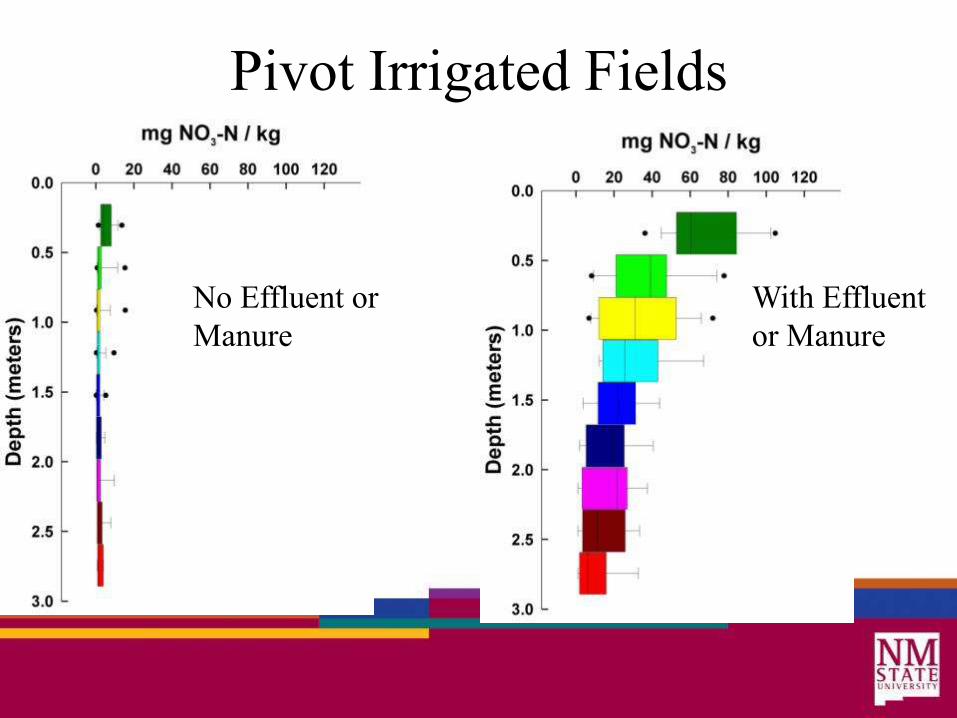
Pivot Irrigated Fields
No Effluent or
Manure
With Effluent
or Manure
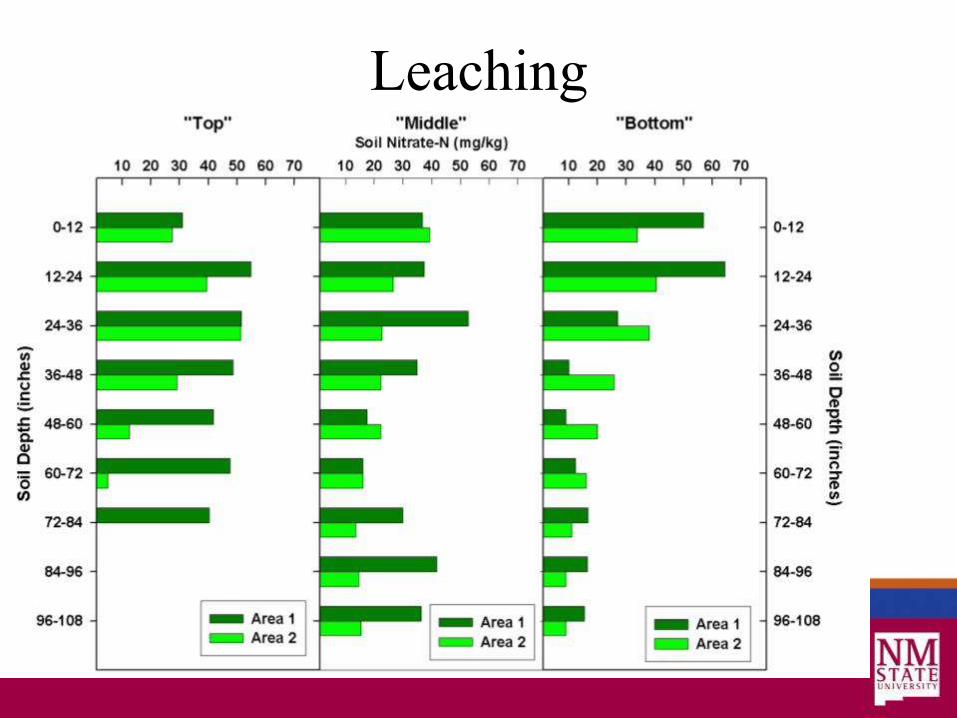
Leaching
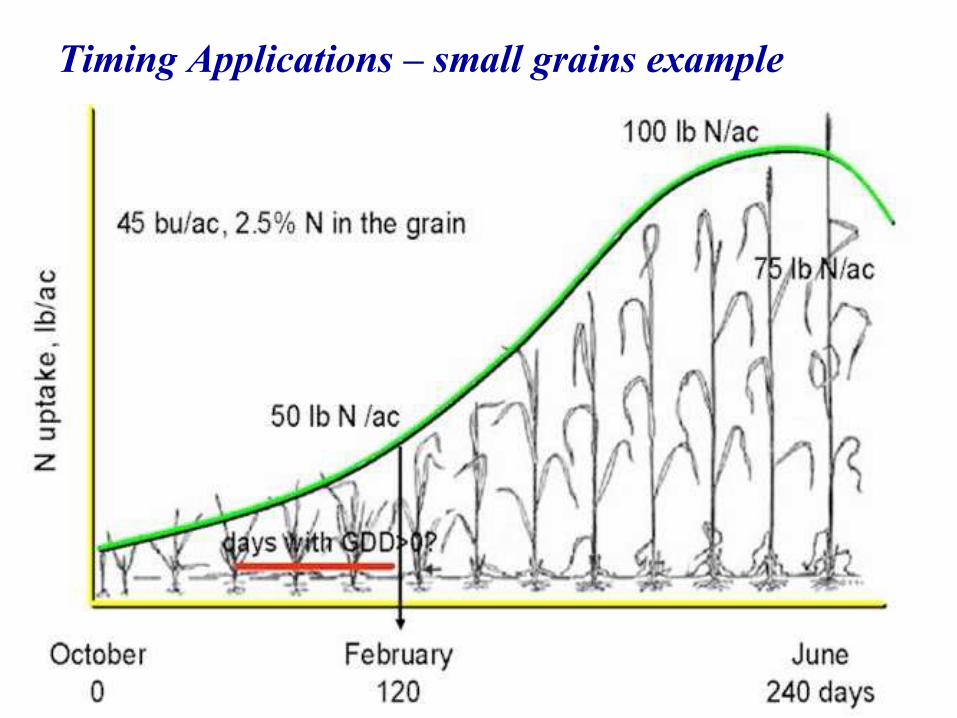
Timing Applications – small grains example
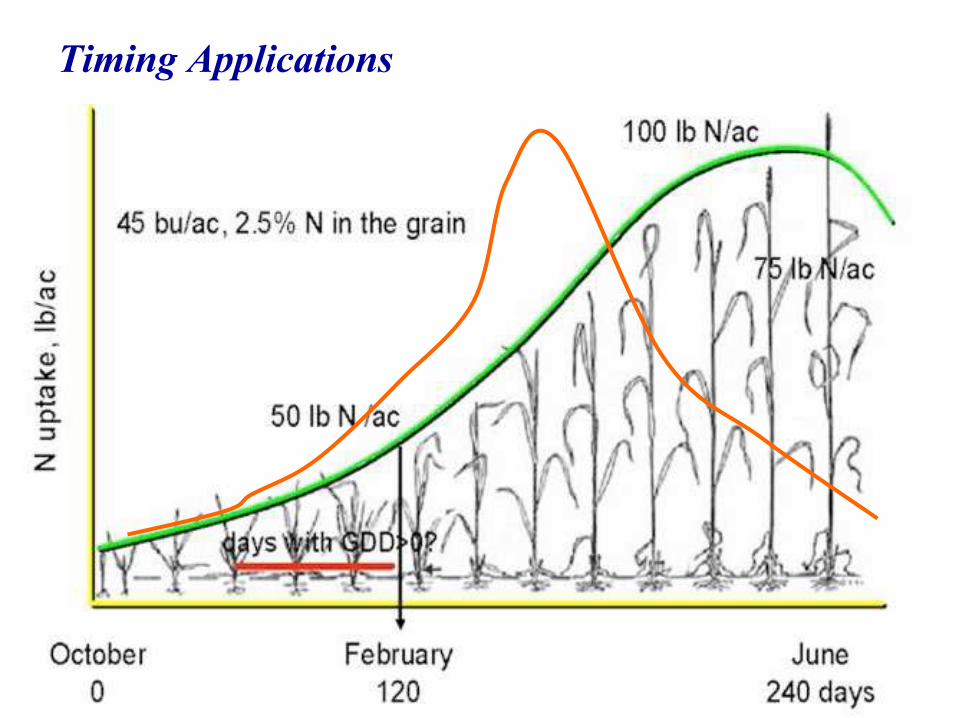
Timing Applications
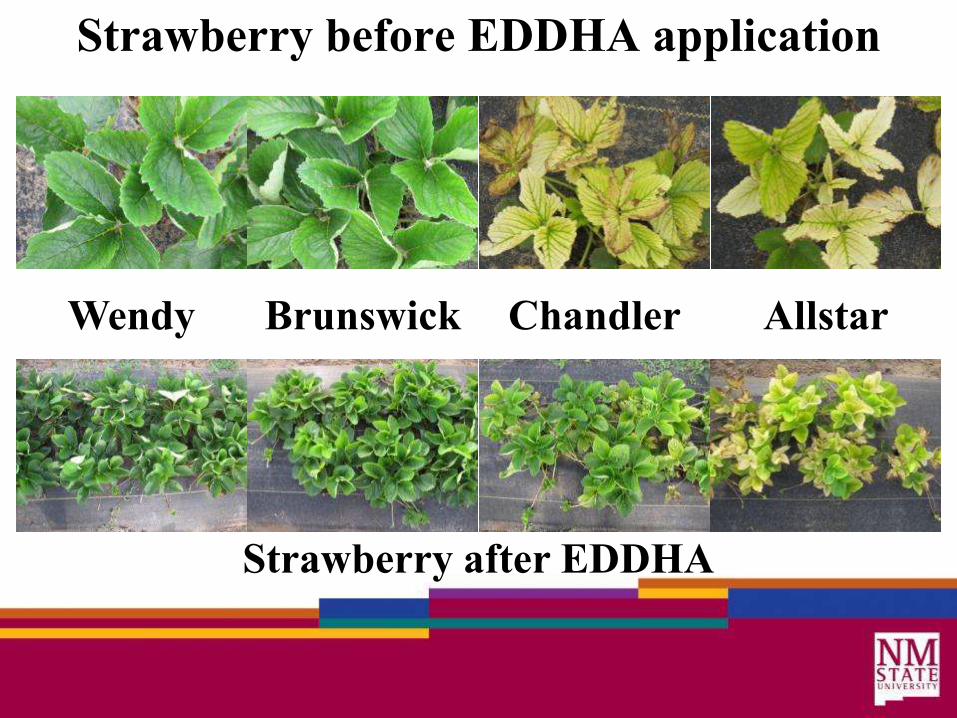
Strawberry before EDDHA application
Wendy Brunswick Chandler Allstar
Strawberry after EDDHA


The 4 R’s
• Right Source
• Right Time
• Right Place
• Right Rate

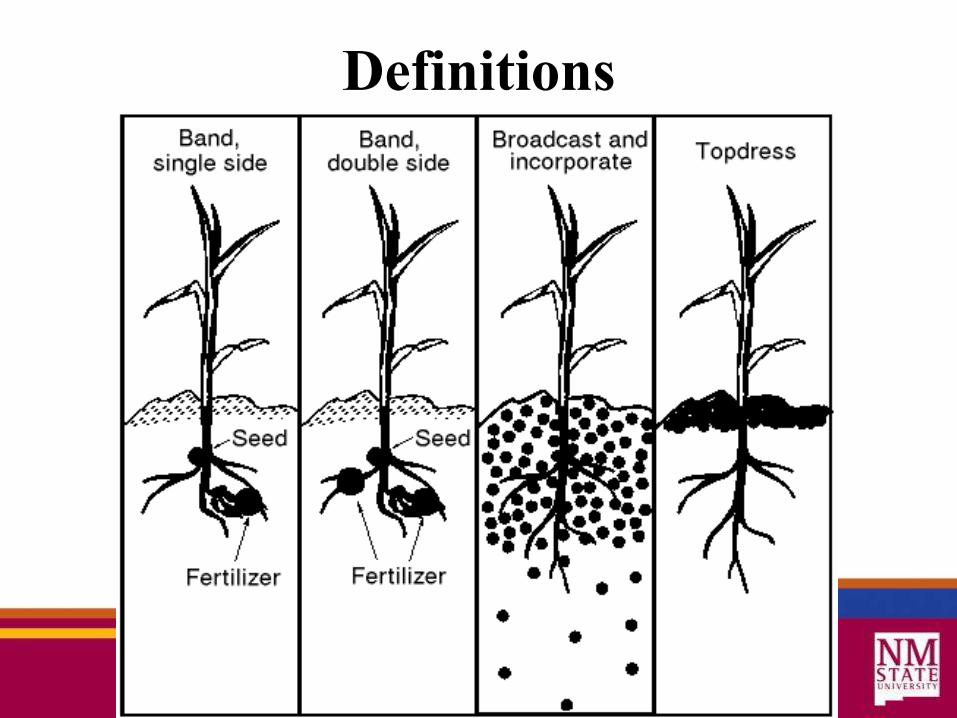
Definitions
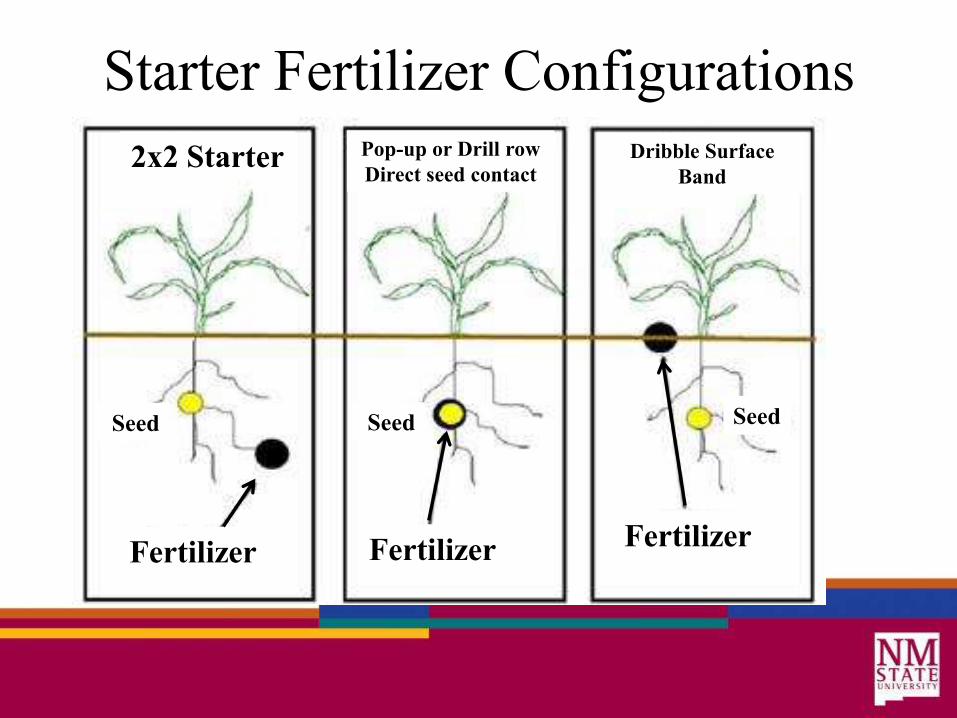
Pop-up or Drill row Dribble Surface 2x2 Starter Direct seed contact Band
SeedSeed Seed
Fertilizer Fertilizer Fertilizer
Starter Fertilizer Configurations

The 4 R’s
• Right Source
• Right Time
• Right Place
• Right Rate

N – P2O5 – K20, others

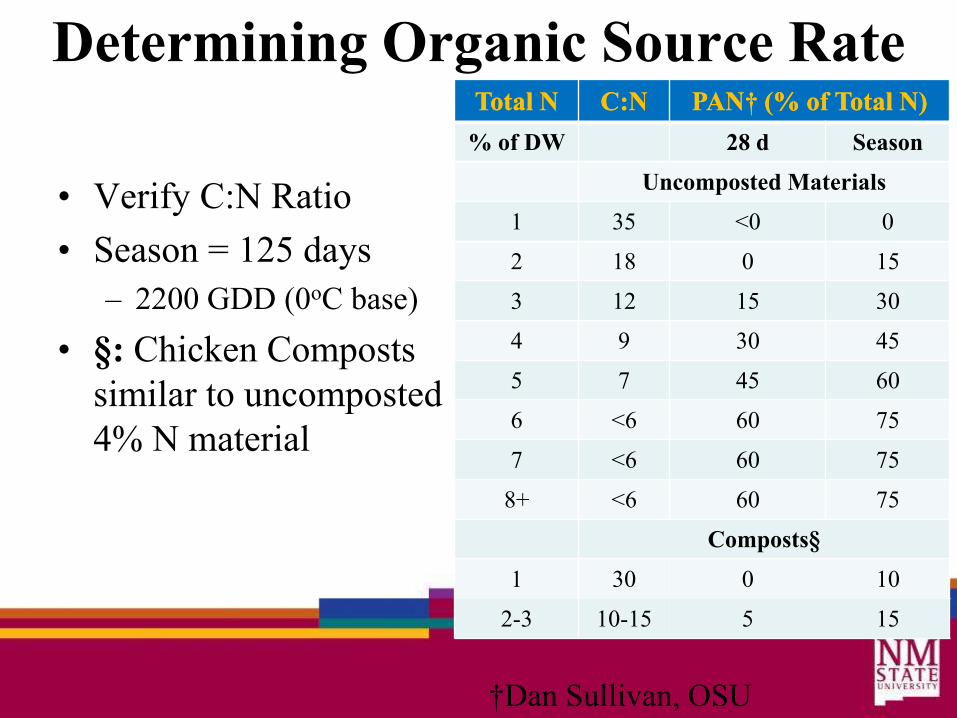
Total Total NN C:NC:N PPANAN ( †† (%% ofof TTotal al N)ot N)
% of DW 28 d Season
Uncomposted Materials
1 35 <0 0
2 18 0 15
3 12 15 30
4 9 30 45
5
6
7
<6
45
60
60
75
7 <6 60 75
8+ <6 60 75
Composts§
1 30 0 10
2-3 10-15 5 15
Determining Organic Source Rate
• Verify C:N Ratio
• Season = 125 days
– 2200 GDD (0oC base)
• §: Chicken Composts
similar to uncomposted
4% N material
†Dan Sullivan, OSU

%PAN & Total %N
-20
0
20
40
60
80
100
120
0 5 10 15 20
%P
AN
28-day PAN Full-season PAN
Total %N
Measured Data
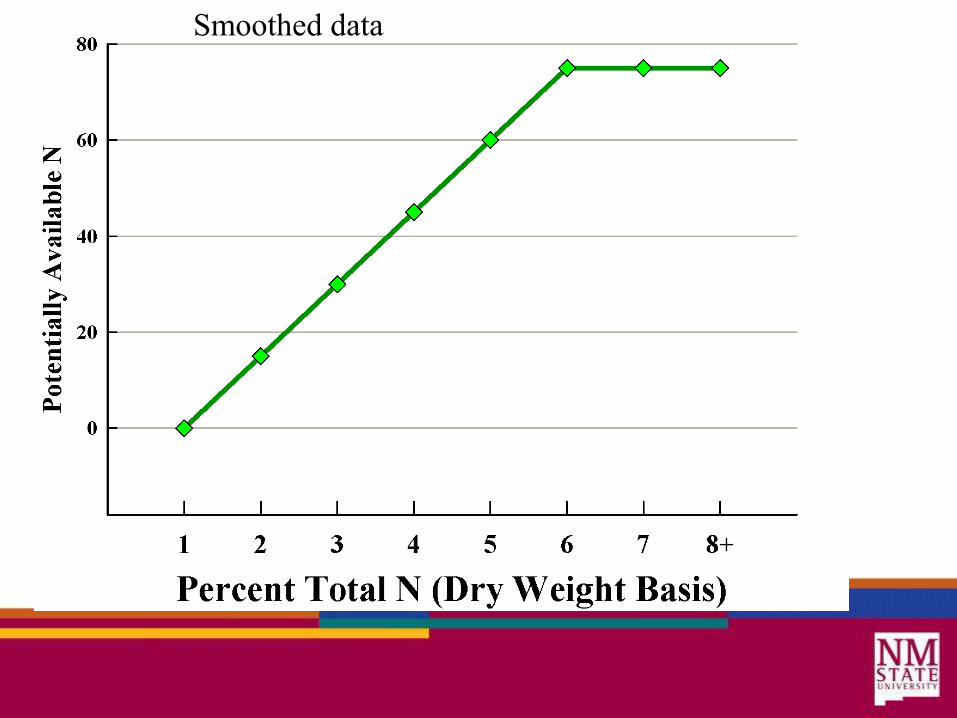
Smoothed data
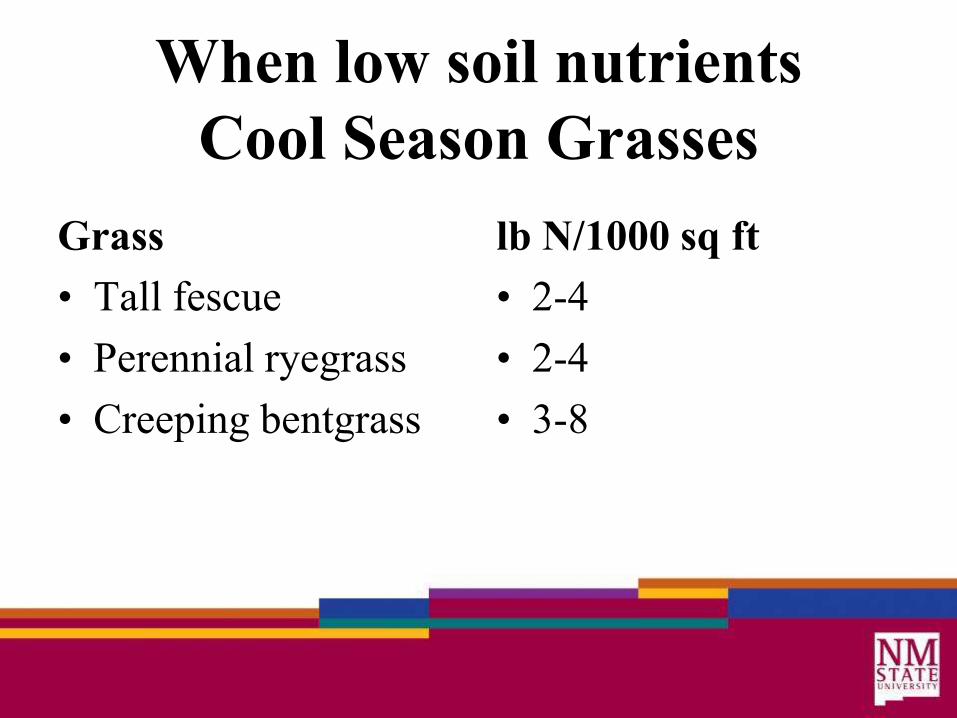
When low soil nutrients
Cool Season Grasses
Grass lb N/1000 sq ft
• Tall fescue • 2-4
• Perennial ryegrass • 2-4
• Creeping bentgrass • 3-8

When low soil nutrients
Warm Season Turf
Grass
• Improved bermudagrass
• Buffalograss
• St. Augustinegrass
• zoysiagrass
lb N/1000 sq ft
• 4-8
• 0-2
• 2-4
• 2-4

Biodiversity
Resource use Nutrient loss efficiencies:
Energy, Labor, Water & air quality Nutrient, Water CROPPING SYSTEM OBJECTIVES
Healthy environment Soil erosion Adoption
Nutrient balance Soil productivity
Yield Ecosystems
Net profit services
Productivity Durability Farm income
Profitability
Return on Quality Working investment conditions
Yield stability
4R Nutrient Stewardship