Embed Size (px)
Citation preview
A National Statistics publication for Scotland
PEOPLE, COMMUNITIES AND PLACES
Scottish Local GovernmentFinancial Statistics 2014-15
SG/2016/16
1
Contents
EXECUTIVE SUMMARY ....................................................................................... 2
1 Local Government Revenue Expenditure and Funding ..................................... 5
1.1 Total Revenue Expenditure and Funding .................................................... 5
1.2 General Fund Revenue Expenditure and Income ....................................... 8
1.3 Revenue Expenditure Financing ............................................................... 12
1.4 Council Tax ................................................................................................ 14
1.5 Non-Domestic Rates .................................................................................. 24
1.6 Customer and Client Receipts ................................................................... 32
2. Local Government Capital Expenditure and Financing ................................... 33
2.1 General Fund Capital Expenditure ............................................................ 36
2.2 General Fund Capital Financing ................................................................ 39
2.3 Borrowing ................................................................................................... 40
3. Local Government Reserves, Fixed Assets and Debt ..................................... 42
3.1 Reserves .................................................................................................... 42
3.2 Fixed Assets .............................................................................................. 43
3.3 Local Authority Debt .................................................................................. 44
3.4 Prudential Indicators .................................................................................. 46
4. Local Government Pensions ........................................................................... 49
5. Background to Scottish Local Government Financial Statistics ...................... 51
6. Sources ............................................................................................................ 54
7. Glossary ........................................................................................................... 55
2
EXECUTIVE SUMMARY
Revenue Expenditure and Funding
Scottish local authorities reported an overall revenue surplus of £69.4 million (0.46% of
gross revenue expenditure) at 31st March 2015, compared with an overall deficit of £54.8
million at 31st March 2014. Of this surplus, £52.3 million (0.36% of General Fund gross
expenditure) was in the General Fund and £17.1 million (2.61% of HRA gross expenditure)
was in the Housing Revenue Account (HRA).
Gross revenue expenditure on services was £15.2 billion in 2014-15 (up 1.3% on 2013-
14). Of this, £0.66 billion (up 1.9% on 2013-14) of expenditure relates to the provision of
housing through the Housing Revenue Account (HRA) and £14.57 billion (up 1.3% on
2013-14) relates to the General Fund.
Net revenue expenditure on services was £10.04 billion in 2014-15 (up 0.8% on 2013-14).
The highest spending service in the General Fund is education which had net expenditure
of £4.6 billion (44% of General Fund net revenue expenditure). Social Work is the next
largest service with net expenditure of £3.1 billion (30%).
Total Finance costs (interest payments net of investment income) was £0.76 billion in
2014-15 (up 5.7% on 2013-14). Total statutory adjustments (which includes Revenue
Contributions to Capital and statutory repayment of debt) was down 3.8% to £1.09 billion
in 2014-15.
Total General Funding in 2014-15 was £11.92 billion. This is made up of Scottish
Government General Revenue Grant £7.17 billion (60%), Non Domestic Rates
Distributable Amount £2.65 billion (22%), Council tax £2.02 billion (17%), and other
funding of £0.08 billion (1%).
Council Tax
The average Band D Council Tax in Scotland was £1,149 in 2014-15.
Council Tax income was £2.022 billion in 2014-15 (after Council Tax Reduction). The total number of chargeable dwellings (i.e. the tax base) has increased slightly each year, rising from 2.377 million in September 2010 to 2.441 million in September 2015. As a result of the Council Tax freeze, Council Tax levels have remained fixed since 2007-08 (except in Stirling where there was a slight drop in the Council Tax level in 2008-09 and 2012-13).
3
Non-domestic Rates
Non-domestic rates bills are calculated using the rateable value (RV) of a non-domestic
property, multiplied by the poundage rate (47.1p in 2014-15) plus any relevant
supplements (such as Large Business Supplement), less any rates reliefs.
Non-domestic rate income collected increased from £2.367 billion in 2013-14 to £2.511 billion in 2014-15. This is due to the net effect of several factors such as the inflationary increase in the poundage rate, the impact of revaluation appeals, changes to rates relief schemes and other changes to the tax base (e.g. new or demolished properties).
Non-domestic rates reliefs provided relief of £0.607 billion in 2014-15, up from £0.590 billion in 2013-14. Increases in Small Business Bonus Scheme and Charity relief were the main factors which contributed to the increased total.
As at 1st April 2015, the non-domestic rate tax base comprised of 223,046 non-domestic properties on the Valuation Roll with a total rateable value of £6.719 billion.
The non-domestic rates „Distributable Amount‟ was £2.650 billion in 2014-15.
Capital Expenditure
Total capital expenditure was £2.40 billion in 2014-15 (£0.67 billion in the HRA and £1.73
billion in the General Fund), compared to £2.46 billion in 2013-14 – a fall of 2.5% or £0.06
billion. The majority of capital expenditure went on new construction, conversions and
enhancements to existing buildings, this category accounted for around 80% of
expenditure.
General Fund capital expenditure in 2014-15 was £1.73 billion (down 5.8% on 2013-14).
The service with the highest capital expenditure was Education with £0.56 billion (32% of
General Fund capital expenditure), which has increased by 7% since 2013-14. Roads and
transport is the service area with the second highest capital expenditure with £0.43 billion
(25% of General Fund capital expenditure), which is 6% lower than in 2013-14.
Reserves
On 1 April 2014 local authorities had total revenue reserves of £1.81 billion; over the
course of the year this increased by £0.07 billion (3.6%) to stand at £1.88 billion on 31st
March 2015. Capital reserves increased by £0.01 billion (1.9%), from £0.56 billion to
£0.57 billion.
Assets
The total value of assets held by local authorities at 31st March 2015 was £39.4 billion.
This is an increase of 1.4% (£0.05 billion) since 31st March 2014. The vast majority of the
assets were operational assets (£38.0 billion, 96% of total assets), including £10.5 billion
of council dwellings (27% of total assets) and £18.9 billion (48%) of other land and
buildings.
4
Loans Fund Borrowing
The all Scotland value of Loans Fund advances outstanding at 31st March 2015 was
£13.18 billion (of which £9.96 billion was General Fund and £3.22 billion was HRA).
General Fund Loans Fund advances outstanding increased by £26.1 million (0.3%)
between 1st April 2014 and 31st March 2015. HRA loans fund advances outstanding rose
by £195 million (6.5%) between 1st April 2014 and 31st March 2015.
At 31st March 2015, the Scottish average General Fund loans fund advances outstanding
was equal to £1,862 per person (down 0.1% on 31st March 2014) and the average HRA
loans fund advances outstanding was equal to £10,138 per HRA dwelling (up 6.3% on 31st
March 2014).
Local Government Pensions
Total Local Government Pension Scheme Fund income in 2014-15 was £5.4 billion. This is up 67% (£2.2 billion) on 2013-14, due to high investment income which can be highly variable. Contributions from employees and employers total £1.2 billion, an increase of £0.022 billion or 1.9% on 2013-14. Local Government Pension Fund Expenditure in 2014-15 was £1.18 billion, an increase of £0.053 billion or 4.7%. The majority (94%) of this expenditure is on benefits, of which £0.239 billion was on lump sum payments and £0.877 billion was on pensions.
5
1 Local Government Revenue Expenditure and Funding
1.1 Total Revenue Expenditure and Funding
Note that Revenue Contributions to Capital (RCC) are now counted under statutory
adjustments while previous publications will have counted RCC as service expenditure.
The re-categorisation of RCC is more in line with how it is treated in authorities accounts
and how readers will interpret the statistics.
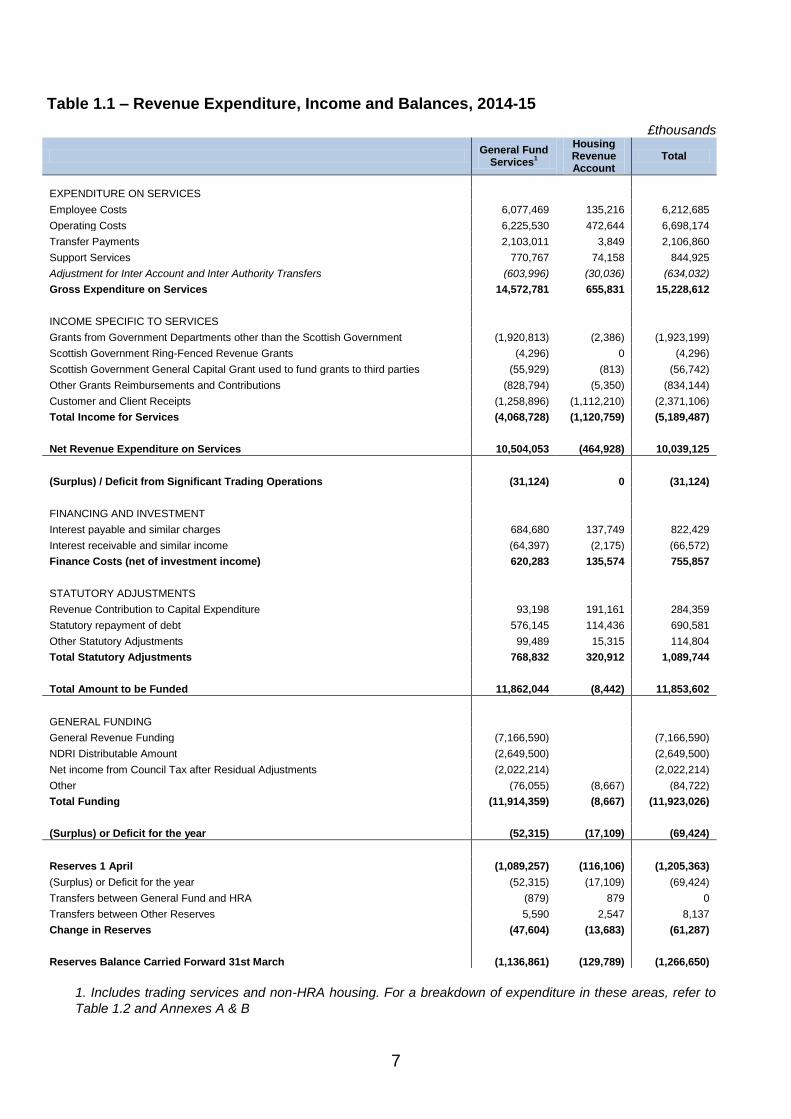
Total Gross Revenue Expenditure on services by local government in Scotland in 2014-15
was £15.2 billion. Of this, £0.66 billion of expenditure was for the provision of housing
through the Housing Revenue Account (HRA).
Table 1.1 summarises revenue income, expenditure, funding and balances for 2014-15.
The largest single element of gross expenditure is operating costs (which includes
property costs, supplies and services costs, transport and payments to agencies and other
bodies) which account for £6.7 billion of expenditure. The second largest element was
employee costs which account for £6.2 billion.
Transfer payments are those made to individuals for which no goods or services are
received in return by the local authority. The majority of transfer payments are housing
benefits which make up £1.8 billion of the total of £2.1 billion. An adjustment for Inter
Account and Inter Authority Transfers is made to the gross expenditure to take account of
transfers between local authorities and between different services within an authority and
ensure that expenditure is not counted twice.
Net Revenue Expenditure on services, which is gross expenditure on services minus
income for services, was £10.04 billion. Of this, £10.5 billion is in the General Fund, while
Net Revenue Expenditure on Services for the HRA was -£0.46 billion, i.e. service income
was greater than service expenditure. Note that the HRA has high levels of Revenue
Contributions to Capital, statutory repayment of debt and interest payments, which are not
counted as service expenditure.
After taking into account the surplus or deficit from Significant Trading Operations, Finance
Costs, Statutory Adjustments and General Funding, authorities had an overall surplus of
£69.4 million. This surplus is contributed to the reserves. After transfers to other reserves
(e.g. repairs and renewals fund, insurance fund), General Fund reserves increased by
£47.6 million to a total of £1.137 billion at the 31st March 2015 and HRA reserves
increased by £13.7 million to £129.8 million.
HRA
The Housing Revenue Account (HRA) records income and expenditure relating to local
authority housing stock. Whilst most other local authority services are funded through a
combination of non-domestic rates, council tax income and Government grants, the HRA
is a ring-fenced account, and expenditure is funded mainly by housing rents with some
Government grant.

6
Trading Services
Trading Service Accounts cover the finances of local authority operated services that are
commercial in nature. They are financed by the charges made by a local authority to the
recipients of the services they provide.
The main trading services are local authority transport (buses, ferries and other Local
Authority transport undertakings), fishery harbours and markets and other trading services
(including airports, other harbours and bridges).
7
Table 1.1 – Revenue Expenditure, Income and Balances, 2014-15
£thousands
General Fund
Services1
Housing Revenue Account
Total
EXPENDITURE ON SERVICES
Employee Costs 6,077,469 135,216 6,212,685
Operating Costs 6,225,530 472,644 6,698,174
Transfer Payments 2,103,011 3,849 2,106,860
Support Services 770,767 74,158 844,925
Adjustment for Inter Account and Inter Authority Transfers (603,996) (30,036) (634,032)
Gross Expenditure on Services 14,572,781 655,831 15,228,612
INCOME SPECIFIC TO SERVICES
Grants from Government Departments other than the Scottish Government (1,920,813) (2,386) (1,923,199)
Scottish Government Ring-Fenced Revenue Grants (4,296) 0 (4,296)
Scottish Government General Capital Grant used to fund grants to third parties (55,929) (813) (56,742)
Other Grants Reimbursements and Contributions (828,794) (5,350) (834,144)
Customer and Client Receipts (1,258,896) (1,112,210) (2,371,106)
Total Income for Services (4,068,728) (1,120,759) (5,189,487)
Net Revenue Expenditure on Services 10,504,053 (464,928) 10,039,125
(Surplus) / Deficit from Significant Trading Operations (31,124) 0 (31,124)
FINANCING AND INVESTMENT
Interest payable and similar charges 684,680 137,749 822,429
Interest receivable and similar income (64,397) (2,175) (66,572)
Finance Costs (net of investment income) 620,283 135,574 755,857
STATUTORY ADJUSTMENTS
Revenue Contribution to Capital Expenditure 93,198 191,161 284,359
Statutory repayment of debt 576,145 114,436 690,581
Other Statutory Adjustments 99,489 15,315 114,804
Total Statutory Adjustments 768,832 320,912 1,089,744
Total Amount to be Funded 11,862,044 (8,442) 11,853,602
GENERAL FUNDING
General Revenue Funding (7,166,590) (7,166,590)
NDRI Distributable Amount (2,649,500) (2,649,500)
Net income from Council Tax after Residual Adjustments (2,022,214) (2,022,214)
Other (76,055) (8,667) (84,722)
Total Funding (11,914,359) (8,667) (11,923,026)
(Surplus) or Deficit for the year (52,315) (17,109) (69,424)
Reserves 1 April (1,089,257) (116,106) (1,205,363)
(Surplus) or Deficit for the year (52,315) (17,109) (69,424)
Transfers between General Fund and HRA (879) 879 0
Transfers between Other Reserves 5,590 2,547 8,137
Change in Reserves (47,604) (13,683) (61,287)
Reserves Balance Carried Forward 31st March (1,136,861) (129,789) (1,266,650)
1. Includes trading services and non-HRA housing. For a breakdown of expenditure in these areas, refer to
Table 1.2 and Annexes A & B
8
1.2 General Fund Revenue Expenditure and Income
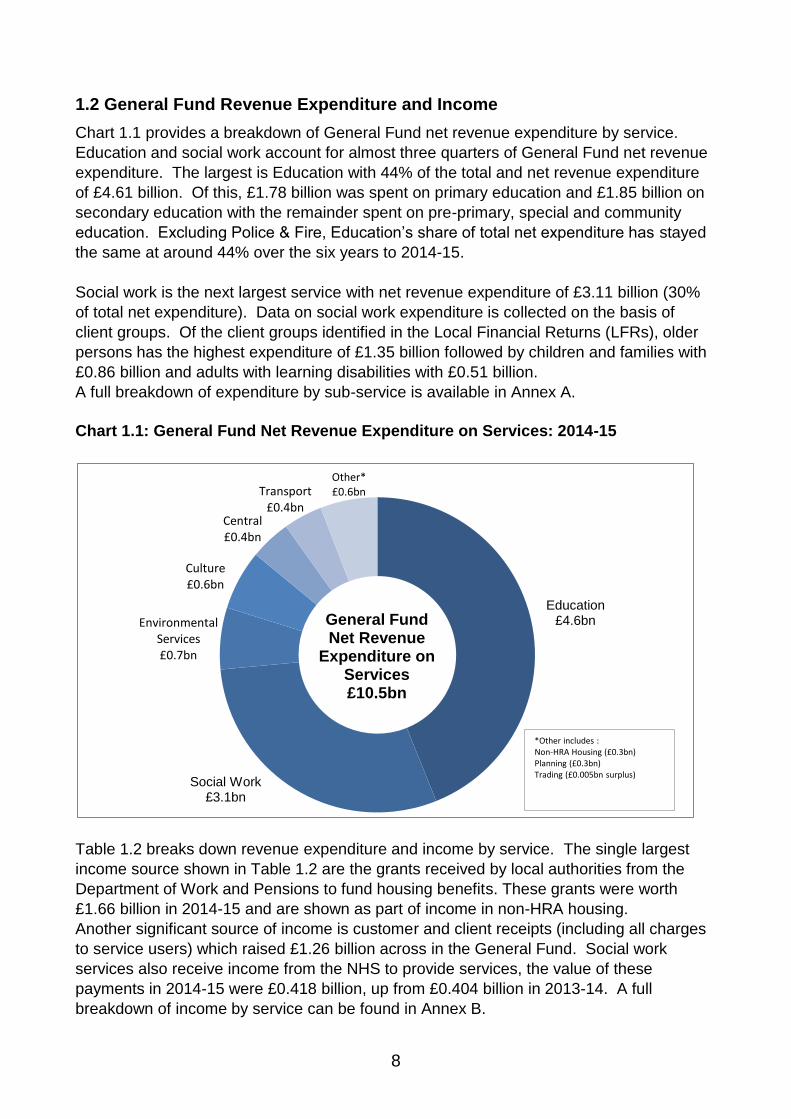
Chart 1.1 provides a breakdown of General Fund net revenue expenditure by service.
Education and social work account for almost three quarters of General Fund net revenue
expenditure. The largest is Education with 44% of the total and net revenue expenditure
of £4.61 billion. Of this, £1.78 billion was spent on primary education and £1.85 billion on
secondary education with the remainder spent on pre-primary, special and community
education. Excluding Police & Fire, Education‟s share of total net expenditure has stayed
the same at around 44% over the six years to 2014-15.
Social work is the next largest service with net revenue expenditure of £3.11 billion (30%
of total net expenditure). Data on social work expenditure is collected on the basis of
client groups. Of the client groups identified in the Local Financial Returns (LFRs), older
persons has the highest expenditure of £1.35 billion followed by children and families with
£0.86 billion and adults with learning disabilities with £0.51 billion.
A full breakdown of expenditure by sub-service is available in Annex A.
Chart 1.1: General Fund Net Revenue Expenditure on Services: 2014-15
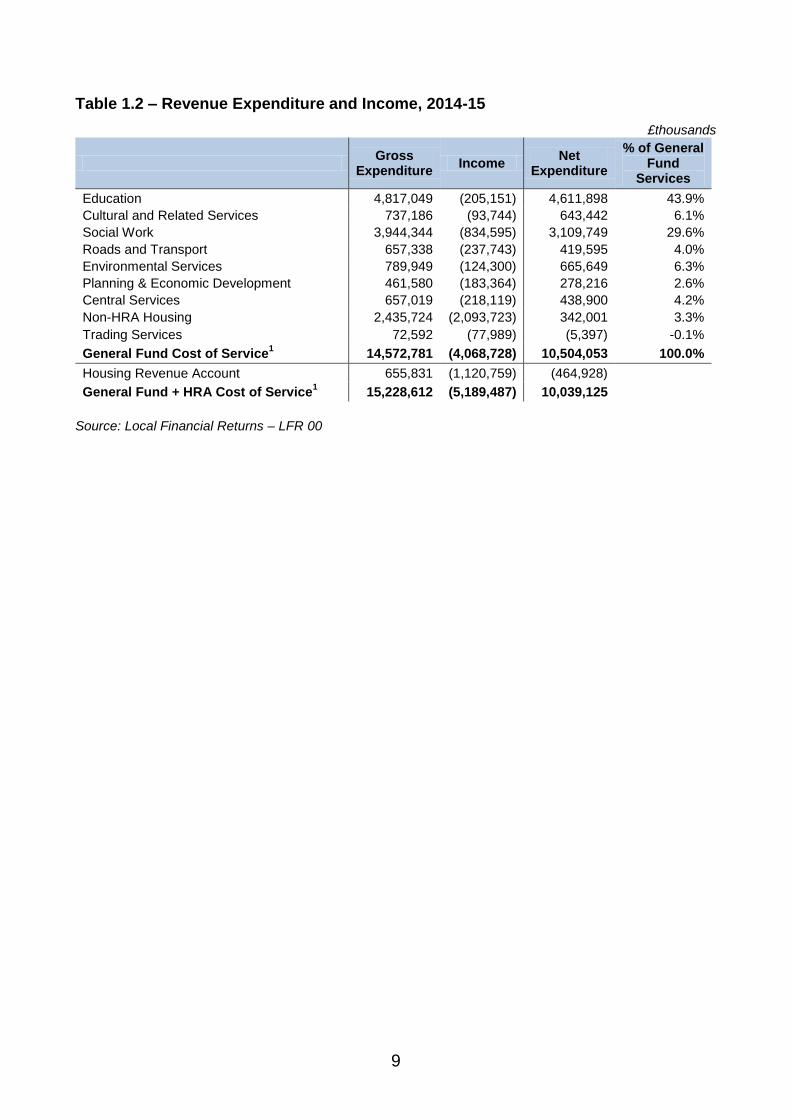
Table 1.2 breaks down revenue expenditure and income by service. The single largest
income source shown in Table 1.2 are the grants received by local authorities from the
Department of Work and Pensions to fund housing benefits. These grants were worth
£1.66 billion in 2014-15 and are shown as part of income in non-HRA housing.
Another significant source of income is customer and client receipts (including all charges
to service users) which raised £1.26 billion across in the General Fund. Social work
services also receive income from the NHS to provide services, the value of these
payments in 2014-15 were £0.418 billion, up from £0.404 billion in 2013-14. A full
breakdown of income by service can be found in Annex B.
Education £4.6bn
Social Work £3.1bn
Environmental Services £0.7bn
Culture £0.6bn
Central £0.4bn
Transport £0.4bn
Other* £0.6bn
General Fund Net Revenue
Expenditure on Services £10.5bn
*Other includes : Non-HRA Housing (£0.3bn) Planning (£0.3bn) Trading (£0.005bn surplus)
9
Table 1.2 – Revenue Expenditure and Income, 2014-15
£thousands
Gross
Expenditure Income
Net Expenditure
% of General Fund
Services
Education 4,817,049 (205,151) 4,611,898 43.9%
Cultural and Related Services 737,186 (93,744) 643,442 6.1%
Social Work 3,944,344 (834,595) 3,109,749 29.6%
Roads and Transport 657,338 (237,743) 419,595 4.0%
Environmental Services 789,949 (124,300) 665,649 6.3%
Planning & Economic Development 461,580 (183,364) 278,216 2.6%
Central Services 657,019 (218,119) 438,900 4.2%
Non-HRA Housing 2,435,724 (2,093,723) 342,001 3.3%
Trading Services 72,592 (77,989) (5,397) -0.1%
General Fund Cost of Service1 14,572,781 (4,068,728) 10,504,053 100.0%
Housing Revenue Account 655,831 (1,120,759) (464,928)
General Fund + HRA Cost of Service1 15,228,612 (5,189,487) 10,039,125
Source: Local Financial Returns – LFR 00
10
Table 1.3 – Net Revenue Expenditure by Service, 2010-11 to 2014-15
£millions
2010-11 2011-12 2012-13 2013-14 2014-15
Education 4,648 4,538 4,571 4,578 4,612
Cultural & Related Services 635 613 609 614 643
Social Work 2,857 2,871 2,959 3,031 3,110
Roads & Transport 486 460 457 436 420
Environmental Services 658 646 644 659 666
Planning & Development Services 308 289 279 279 278
Central Services 1, 2
546 428 386 484 439
Non-HRA Housing 391 323 306 321 342
Trading Services 2 (13) (4) (2) (5)
General Fund Net Expenditure
(excluding Police & Fire 2)
10,531 10,156 10,208 10,400 10,504
Housing Revenue Account (365) (389) (425) (439) (465)
General Fund + HRA Net Revenue
Expenditure (excluding Police & Fire 2)
10,166 9,767 9,783 9,961 10,039
Police 1 580 516 517
Fire 1 310 280 291
Central Services (Police & Fire) 1, 2
7 (22) (50)
General Fund + HRA Net Revenue
Expenditure 11,064 10,540 10,540 9,961 10,039
1. Following the Police and Fire Reform (Scotland) Act 2012 figures for 2013-14 may not be comparable with
previous years. See section 5.2 for details.
2. Police and fire board net expenditure in central services has been separated from overall General Fund
expenditure to allow for time series comparison.
Source: Local Financial Returns – LFR 00
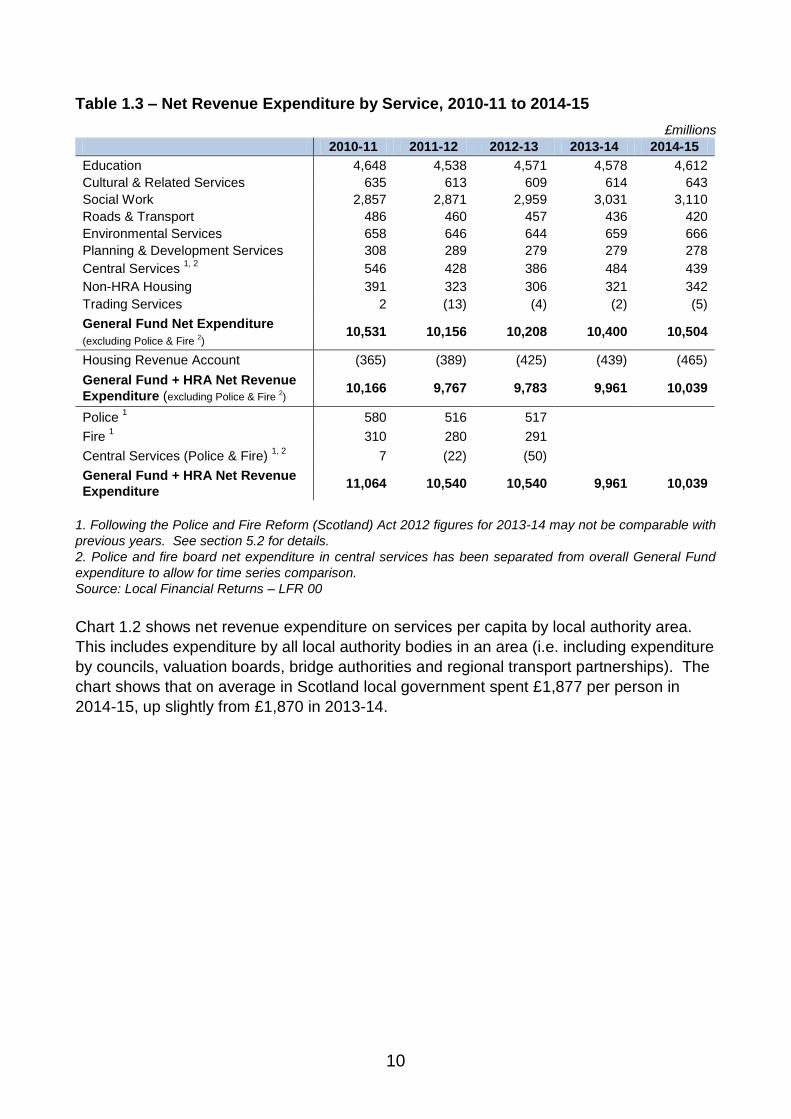
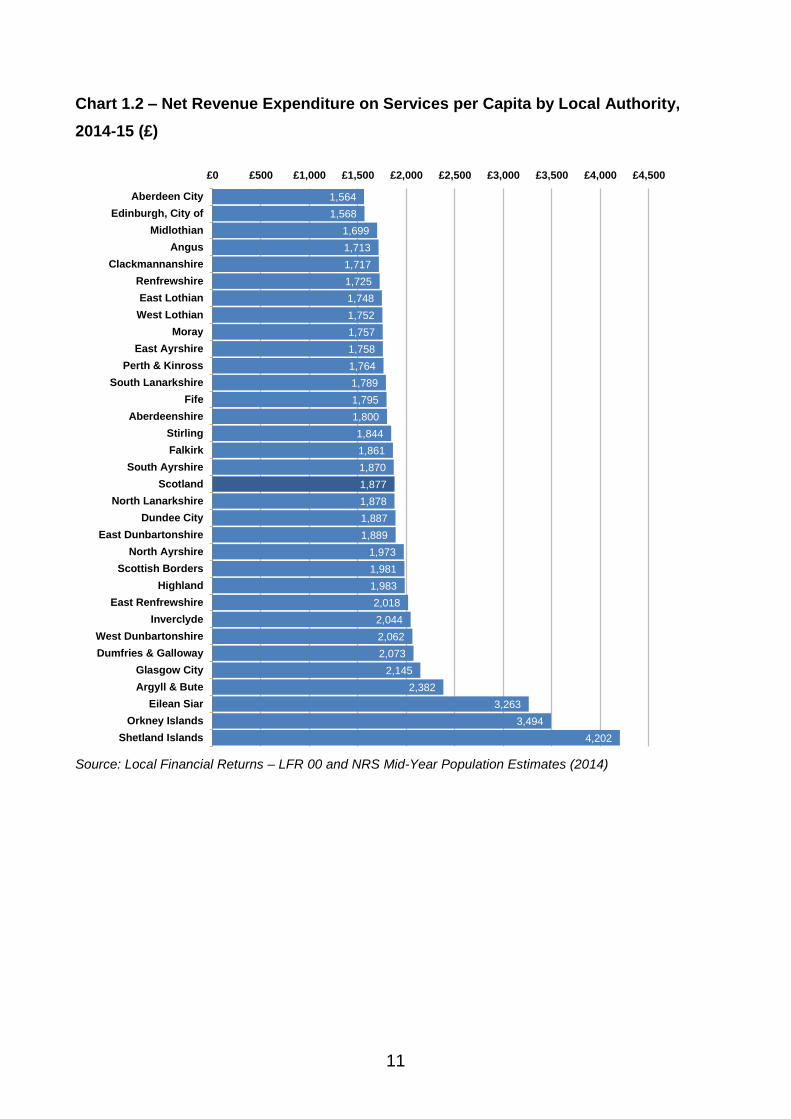
Chart 1.2 shows net revenue expenditure on services per capita by local authority area.
This includes expenditure by all local authority bodies in an area (i.e. including expenditure
by councils, valuation boards, bridge authorities and regional transport partnerships). The
chart shows that on average in Scotland local government spent £1,877 per person in
2014-15, up slightly from £1,870 in 2013-14.
11
Chart 1.2 – Net Revenue Expenditure on Services per Capita by Local Authority,
2014-15 (£)
Source: Local Financial Returns – LFR 00 and NRS Mid-Year Population Estimates (2014)
1,564
1,568
1,699
1,713
1,717
1,725
1,748
1,752
1,757
1,758
1,764
1,789
1,795
1,800
1,844
1,861
1,870
1,877
1,878
1,887
1,889
1,973
1,981
1,983
2,018
2,044
2,062
2,073
2,145
2,382
3,263
3,494
4,202
£0 £500 £1,000 £1,500 £2,000 £2,500 £3,000 £3,500 £4,000 £4,500
Aberdeen City
Edinburgh, City of
Midlothian
Angus
Clackmannanshire
Renfrewshire
East Lothian
West Lothian
Moray
East Ayrshire
Perth & Kinross
South Lanarkshire
Fife
Aberdeenshire
Stirling
Falkirk
South Ayrshire
Scotland
North Lanarkshire
Dundee City
East Dunbartonshire
North Ayrshire
Scottish Borders
Highland
East Renfrewshire
Inverclyde
West Dunbartonshire
Dumfries & Galloway
Glasgow City
Argyll & Bute
Eilean Siar
Orkney Islands
Shetland Islands
12
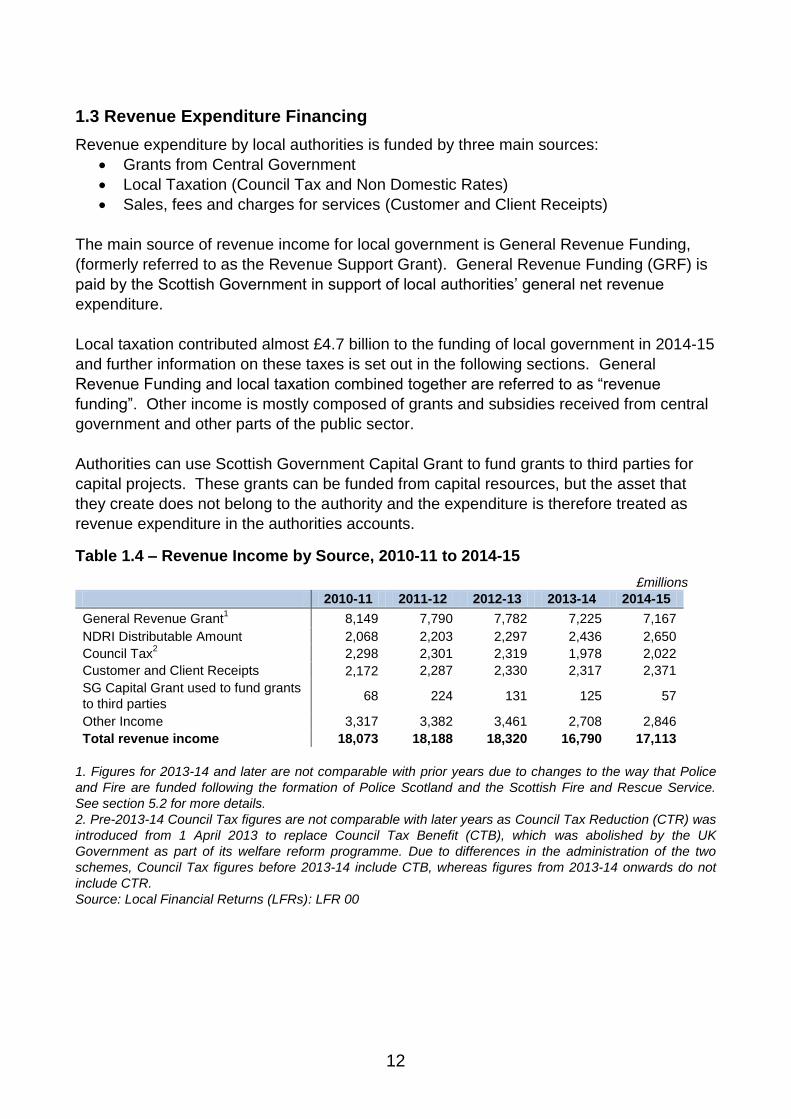
1.3 Revenue Expenditure Financing
Revenue expenditure by local authorities is funded by three main sources:
Grants from Central Government
Local Taxation (Council Tax and Non Domestic Rates)
Sales, fees and charges for services (Customer and Client Receipts)
The main source of revenue income for local government is General Revenue Funding,
(formerly referred to as the Revenue Support Grant). General Revenue Funding (GRF) is
paid by the Scottish Government in support of local authorities‟ general net revenue
expenditure.
Local taxation contributed almost £4.7 billion to the funding of local government in 2014-15
and further information on these taxes is set out in the following sections. General
Revenue Funding and local taxation combined together are referred to as “revenue
funding”. Other income is mostly composed of grants and subsidies received from central
government and other parts of the public sector.
Authorities can use Scottish Government Capital Grant to fund grants to third parties for
capital projects. These grants can be funded from capital resources, but the asset that
they create does not belong to the authority and the expenditure is therefore treated as
revenue expenditure in the authorities accounts.
Table 1.4 – Revenue Income by Source, 2010-11 to 2014-15
£millions
2010-11 2011-12 2012-13 2013-14 2014-15
General Revenue Grant1 8,149 7,790 7,782 7,225 7,167
NDRI Distributable Amount 2,068 2,203 2,297 2,436 2,650
Council Tax2 2,298 2,301 2,319 1,978 2,022
Customer and Client Receipts 2,172 2,287 2,330 2,317 2,371
SG Capital Grant used to fund grants
to third parties 68 224 131 125 57
Other Income 3,317 3,382 3,461 2,708 2,846
Total revenue income 18,073 18,188 18,320 16,790 17,113
1. Figures for 2013-14 and later are not comparable with prior years due to changes to the way that Police
and Fire are funded following the formation of Police Scotland and the Scottish Fire and Rescue Service.
See section 5.2 for more details.
2. Pre-2013-14 Council Tax figures are not comparable with later years as Council Tax Reduction (CTR) was
introduced from 1 April 2013 to replace Council Tax Benefit (CTB), which was abolished by the UK
Government as part of its welfare reform programme. Due to differences in the administration of the two
schemes, Council Tax figures before 2013-14 include CTB, whereas figures from 2013-14 onwards do not
include CTR.
Source: Local Financial Returns (LFRs): LFR 00
13
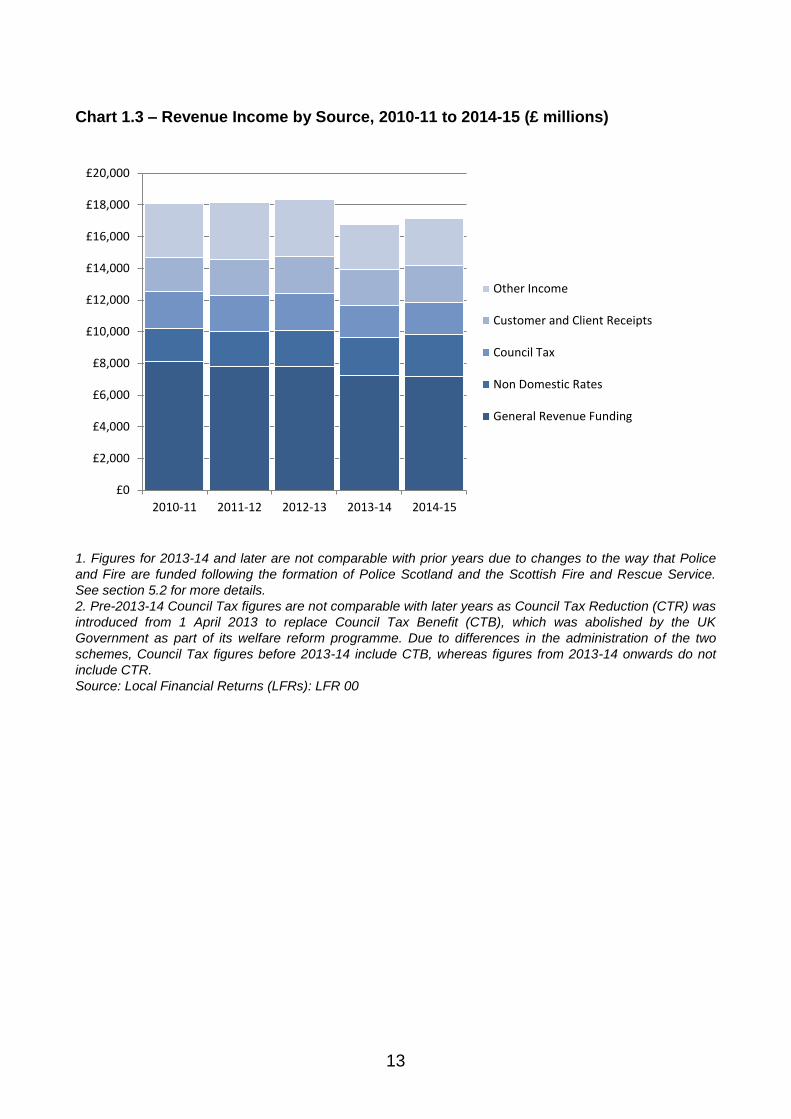
Chart 1.3 – Revenue Income by Source, 2010-11 to 2014-15 (£ millions)
1. Figures for 2013-14 and later are not comparable with prior years due to changes to the way that Police
and Fire are funded following the formation of Police Scotland and the Scottish Fire and Rescue Service.
See section 5.2 for more details.
2. Pre-2013-14 Council Tax figures are not comparable with later years as Council Tax Reduction (CTR) was
introduced from 1 April 2013 to replace Council Tax Benefit (CTB), which was abolished by the UK
Government as part of its welfare reform programme. Due to differences in the administration of the two
schemes, Council Tax figures before 2013-14 include CTB, whereas figures from 2013-14 onwards do not
include CTR.
Source: Local Financial Returns (LFRs): LFR 00
£0
£2,000
£4,000
£6,000
£8,000
£10,000
£12,000
£14,000
£16,000
£18,000
£20,000
2010-11 2011-12 2012-13 2013-14 2014-15
Other Income
Customer and Client Receipts
Council Tax
Non Domestic Rates
General Revenue Funding
14
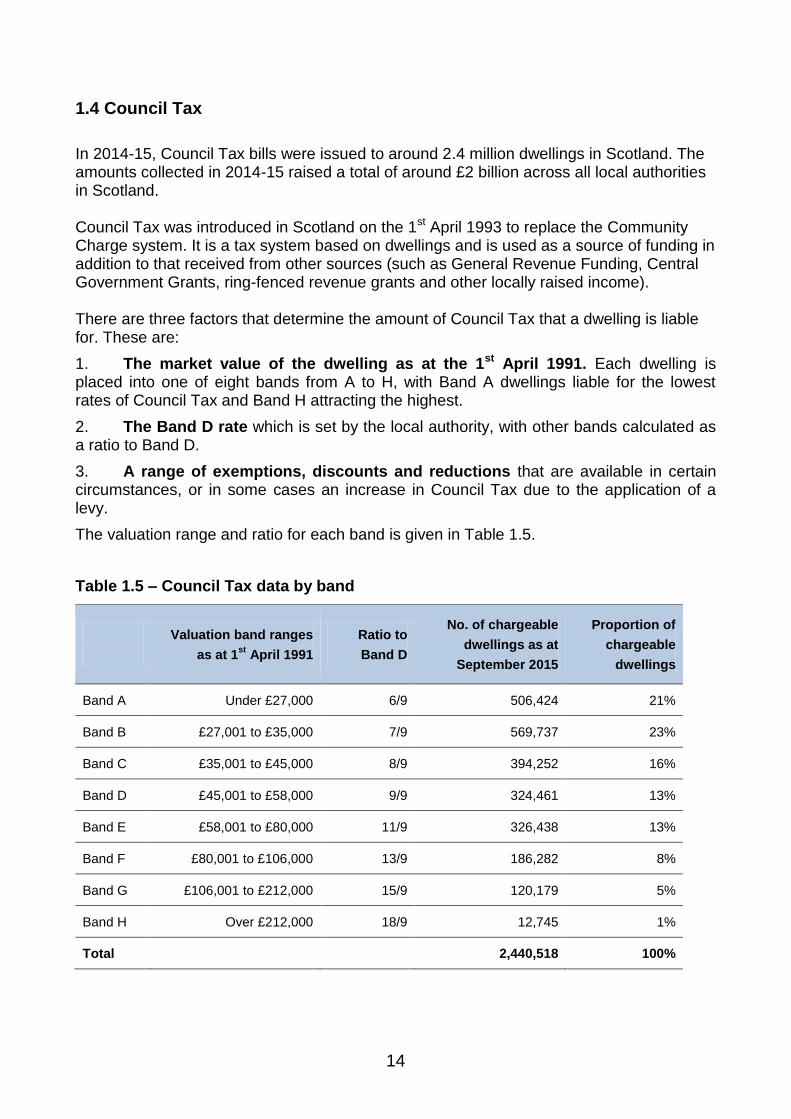
1.4 Council Tax
In 2014-15, Council Tax bills were issued to around 2.4 million dwellings in Scotland. The amounts collected in 2014-15 raised a total of around £2 billion across all local authorities in Scotland. Council Tax was introduced in Scotland on the 1st April 1993 to replace the Community Charge system. It is a tax system based on dwellings and is used as a source of funding in addition to that received from other sources (such as General Revenue Funding, Central Government Grants, ring-fenced revenue grants and other locally raised income). There are three factors that determine the amount of Council Tax that a dwelling is liable for. These are:
1. The market value of the dwelling as at the 1st April 1991. Each dwelling is placed into one of eight bands from A to H, with Band A dwellings liable for the lowest rates of Council Tax and Band H attracting the highest.
2. The Band D rate which is set by the local authority, with other bands calculated as a ratio to Band D.
3. A range of exemptions, discounts and reductions that are available in certain circumstances, or in some cases an increase in Council Tax due to the application of a levy.
The valuation range and ratio for each band is given in Table 1.5.
Table 1.5 – Council Tax data by band
Valuation band ranges
as at 1st
April 1991
Ratio to
Band D
No. of chargeable
dwellings as at
September 2015
Proportion of
chargeable
dwellings
Band A Under £27,000 6/9 506,424 21%
Band B £27,001 to £35,000 7/9 569,737 23%
Band C £35,001 to £45,000 8/9 394,252 16%
Band D £45,001 to £58,000 9/9 324,461 13%
Band E £58,001 to £80,000 11/9 326,438 13%
Band F £80,001 to £106,000 13/9 186,282 8%
Band G £106,001 to £212,000 15/9 120,179 5%
Band H Over £212,000 18/9 12,745 1%
Total 2,440,518 100%
15
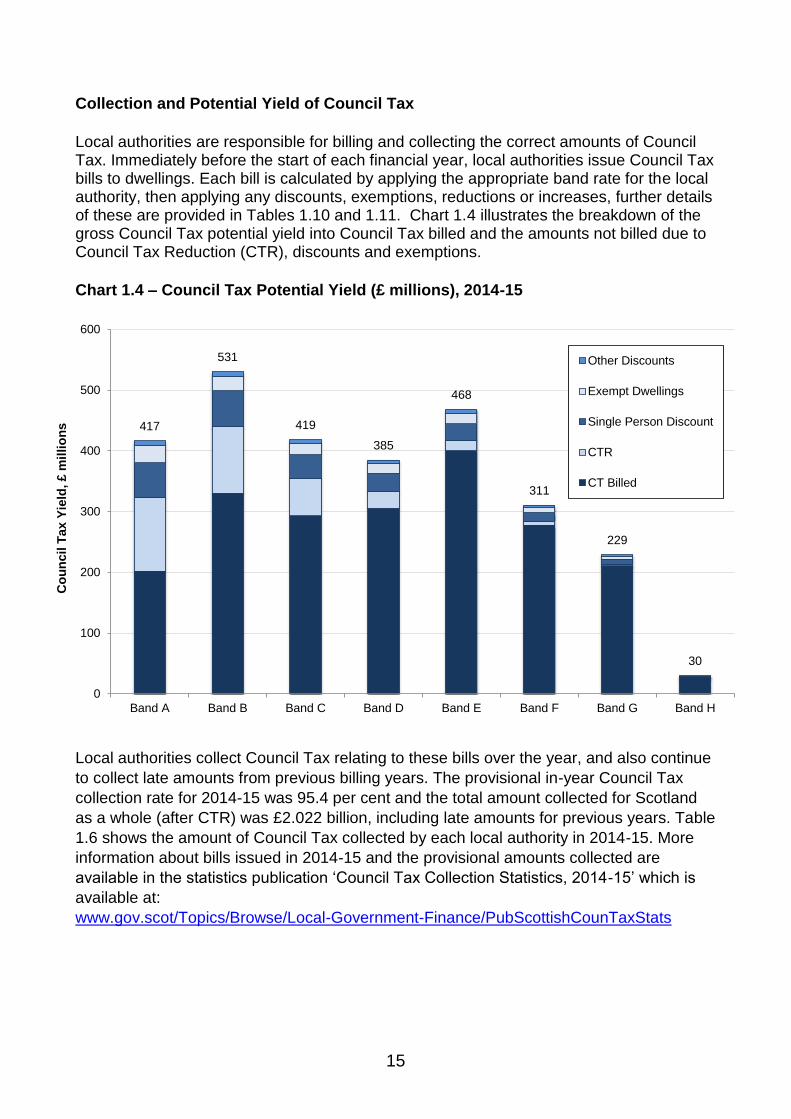
Collection and Potential Yield of Council Tax
Local authorities are responsible for billing and collecting the correct amounts of Council Tax. Immediately before the start of each financial year, local authorities issue Council Tax bills to dwellings. Each bill is calculated by applying the appropriate band rate for the local authority, then applying any discounts, exemptions, reductions or increases, further details of these are provided in Tables 1.10 and 1.11. Chart 1.4 illustrates the breakdown of the gross Council Tax potential yield into Council Tax billed and the amounts not billed due to Council Tax Reduction (CTR), discounts and exemptions.
Chart 1.4 – Council Tax Potential Yield (£ millions), 2014-15
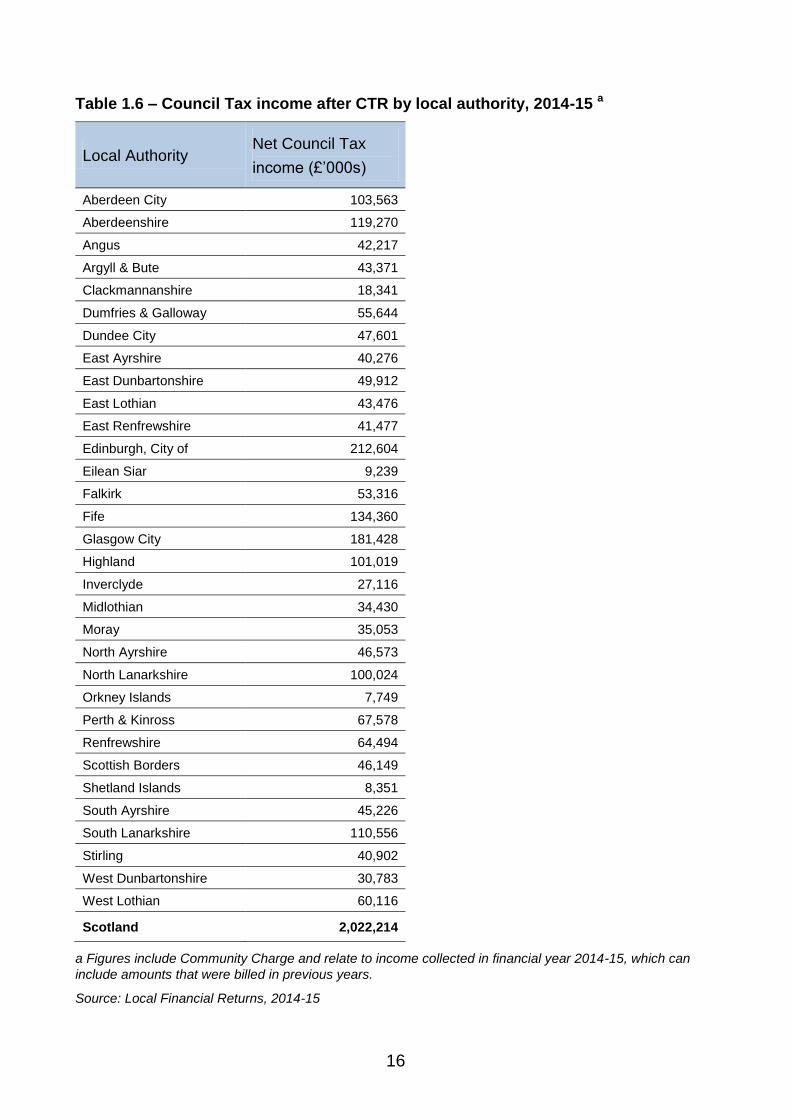
Local authorities collect Council Tax relating to these bills over the year, and also continue
to collect late amounts from previous billing years. The provisional in-year Council Tax
collection rate for 2014-15 was 95.4 per cent and the total amount collected for Scotland
as a whole (after CTR) was £2.022 billion, including late amounts for previous years. Table
1.6 shows the amount of Council Tax collected by each local authority in 2014-15. More
information about bills issued in 2014-15 and the provisional amounts collected are
available in the statistics publication „Council Tax Collection Statistics, 2014-15‟ which is
available at:
www.gov.scot/Topics/Browse/Local-Government-Finance/PubScottishCounTaxStats
417
531
419
385
468
311
229
30
0
100
200
300
400
500
600
Band A Band B Band C Band D Band E Band F Band G Band H
Co
un
cil
Tax Y
ield
, £ m
illi
on
s
Other Discounts
Exempt Dwellings
Single Person Discount
CTR
CT Billed
16
Table 1.6 – Council Tax income after CTR by local authority, 2014-15 a
Local Authority Net Council Tax
income (£‟000s)
Aberdeen City 103,563
Aberdeenshire 119,270
Angus 42,217
Argyll & Bute 43,371
Clackmannanshire 18,341
Dumfries & Galloway 55,644
Dundee City 47,601
East Ayrshire 40,276
East Dunbartonshire 49,912
East Lothian 43,476
East Renfrewshire 41,477
Edinburgh, City of 212,604
Eilean Siar 9,239
Falkirk 53,316
Fife 134,360
Glasgow City 181,428
Highland 101,019
Inverclyde 27,116
Midlothian 34,430
Moray 35,053
North Ayrshire 46,573
North Lanarkshire 100,024
Orkney Islands 7,749
Perth & Kinross 67,578
Renfrewshire 64,494
Scottish Borders 46,149
Shetland Islands 8,351
South Ayrshire 45,226
South Lanarkshire 110,556
Stirling 40,902
West Dunbartonshire 30,783
West Lothian 60,116
Scotland 2,022,214
a Figures include Community Charge and relate to income collected in financial year 2014-15, which can
include amounts that were billed in previous years.
Source: Local Financial Returns, 2014-15
17
Chargeable Dwellings
Table 1.7 shows the number of dwellings in Scotland for each September from 2010 to 2015. There were a total of 2.557 million dwellings in Scotland in 2015, of which 117,000 dwellings were exempt for Council Tax purposes. This gave 2.441 million chargeable dwellings in 2015: an increase of around 2.7 per cent (around 63,000 dwellings) since 2010.
Table 1.7 – Total number of dwellings in Scotland, 2010 to 2015
Total
Dwellings
Exempt
Dwellings
Chargeable
Dwellings
2010 2,488,928 111,454 2,377,474
2011 2,500,769 111,740 2,389,029
2012 2,515,042 113,173 2,401,869
2013 2,526,703 116,372 2,410,331
2014 2,540,330 112,525 2,427,805
2015 2,557,365 116,847 2,440,518
Source: CTAXBASE Return
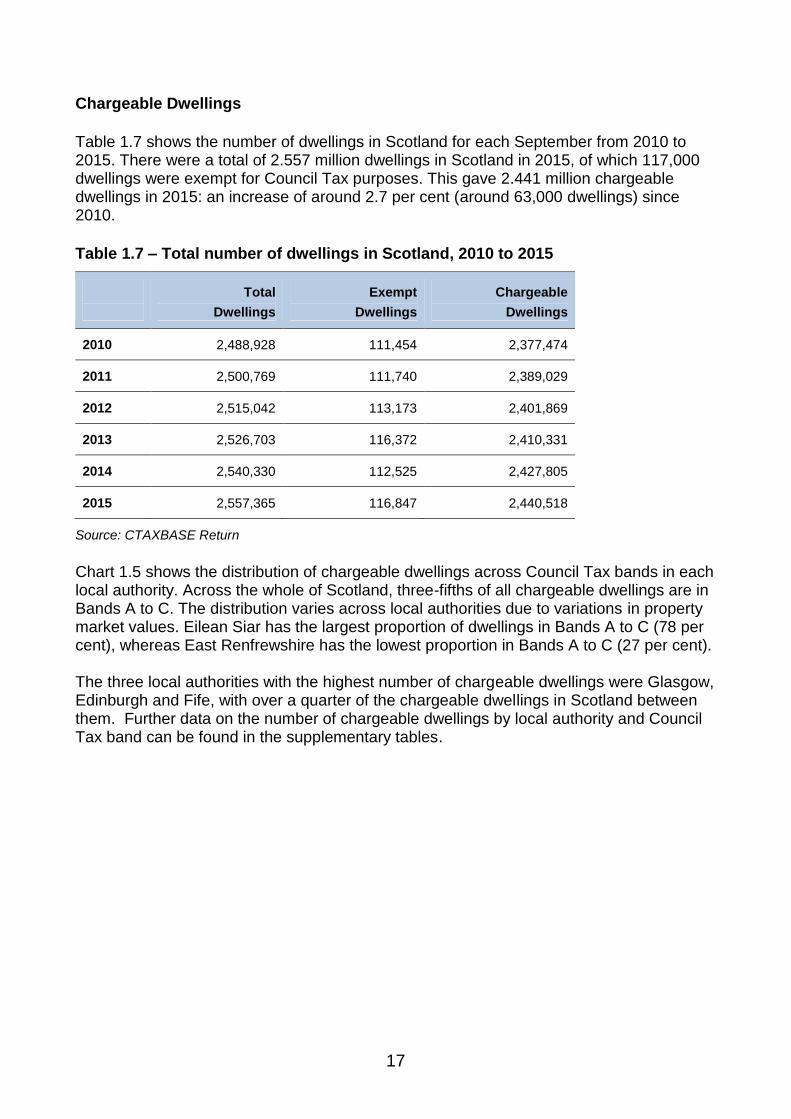
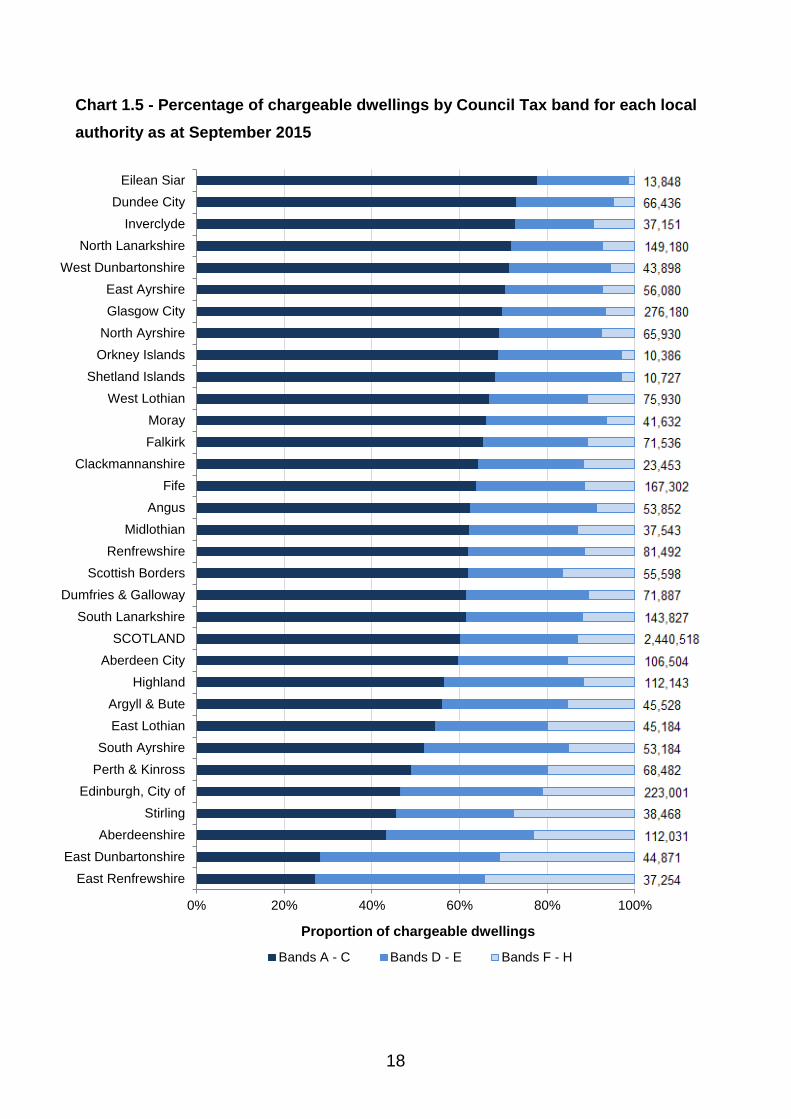
Chart 1.5 shows the distribution of chargeable dwellings across Council Tax bands in each local authority. Across the whole of Scotland, three-fifths of all chargeable dwellings are in Bands A to C. The distribution varies across local authorities due to variations in property market values. Eilean Siar has the largest proportion of dwellings in Bands A to C (78 per cent), whereas East Renfrewshire has the lowest proportion in Bands A to C (27 per cent). The three local authorities with the highest number of chargeable dwellings were Glasgow, Edinburgh and Fife, with over a quarter of the chargeable dwellings in Scotland between them. Further data on the number of chargeable dwellings by local authority and Council Tax band can be found in the supplementary tables.
18
Chart 1.5 - Percentage of chargeable dwellings by Council Tax band for each local
authority as at September 2015
0% 20% 40% 60% 80% 100%
East Renfrewshire
East Dunbartonshire
Aberdeenshire
Stirling
Edinburgh, City of
Perth & Kinross
South Ayrshire
East Lothian
Argyll & Bute
Highland
Aberdeen City
SCOTLAND
South Lanarkshire
Dumfries & Galloway
Scottish Borders
Renfrewshire
Midlothian
Angus
Fife
Clackmannanshire
Falkirk
Moray
West Lothian
Shetland Islands
Orkney Islands
North Ayrshire
Glasgow City
East Ayrshire
West Dunbartonshire
North Lanarkshire
Inverclyde
Dundee City
Eilean Siar
Proportion of chargeable dwellings
Bands A - C Bands D - E Bands F - H
19
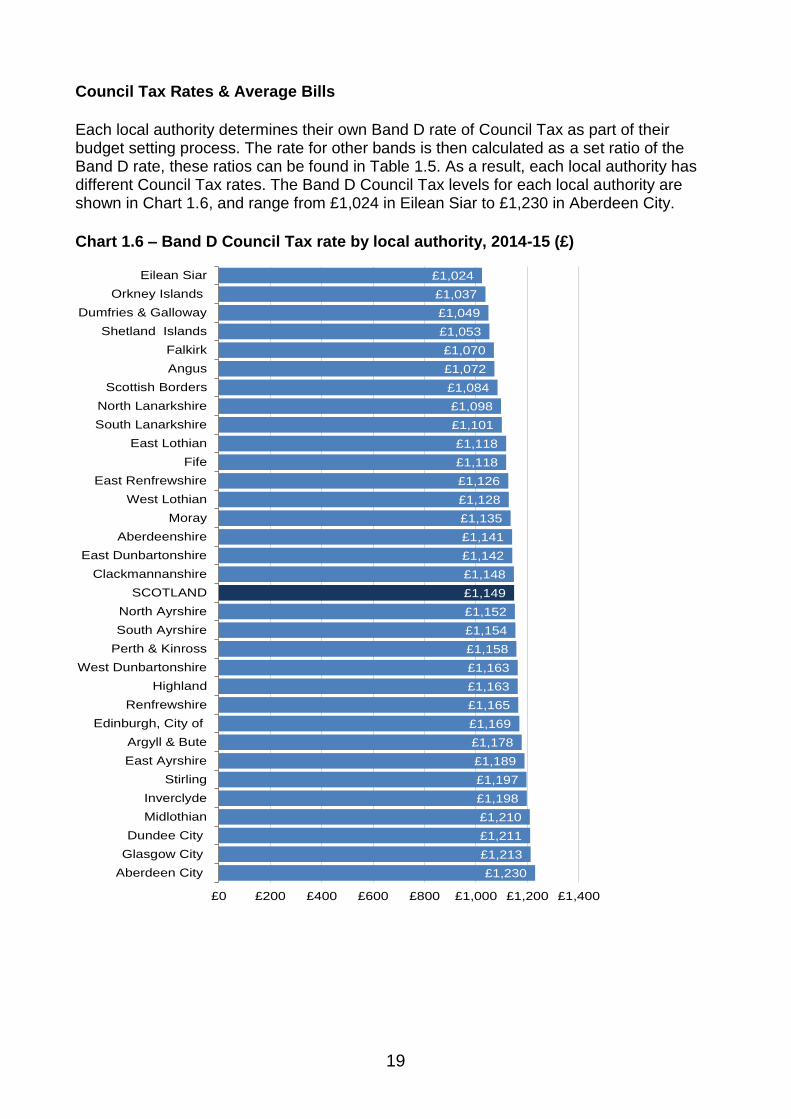
Council Tax Rates & Average Bills
Each local authority determines their own Band D rate of Council Tax as part of their budget setting process. The rate for other bands is then calculated as a set ratio of the Band D rate, these ratios can be found in Table 1.5. As a result, each local authority has different Council Tax rates. The Band D Council Tax levels for each local authority are shown in Chart 1.6, and range from £1,024 in Eilean Siar to £1,230 in Aberdeen City.
Chart 1.6 – Band D Council Tax rate by local authority, 2014-15 (£)
£1,230
£1,213
£1,211
£1,210
£1,198
£1,197
£1,189
£1,178
£1,169
£1,165
£1,163
£1,163
£1,158
£1,154
£1,152
£1,149
£1,148
£1,142
£1,141
£1,135
£1,128
£1,126
£1,118
£1,118
£1,101
£1,098
£1,084
£1,072
£1,070
£1,053
£1,049
£1,037
£1,024
£0 £200 £400 £600 £800 £1,000 £1,200 £1,400
Aberdeen City
Glasgow City
Dundee City
Midlothian
Inverclyde
Stirling
East Ayrshire
Argyll & Bute
Edinburgh, City of
Renfrewshire
Highland
West Dunbartonshire
Perth & Kinross
South Ayrshire
North Ayrshire
SCOTLAND
Clackmannanshire
East Dunbartonshire
Aberdeenshire
Moray
West Lothian
East Renfrewshire
Fife
East Lothian
South Lanarkshire
North Lanarkshire
Scottish Borders
Angus
Falkirk
Shetland Islands
Dumfries & Galloway
Orkney Islands
Eilean Siar
20
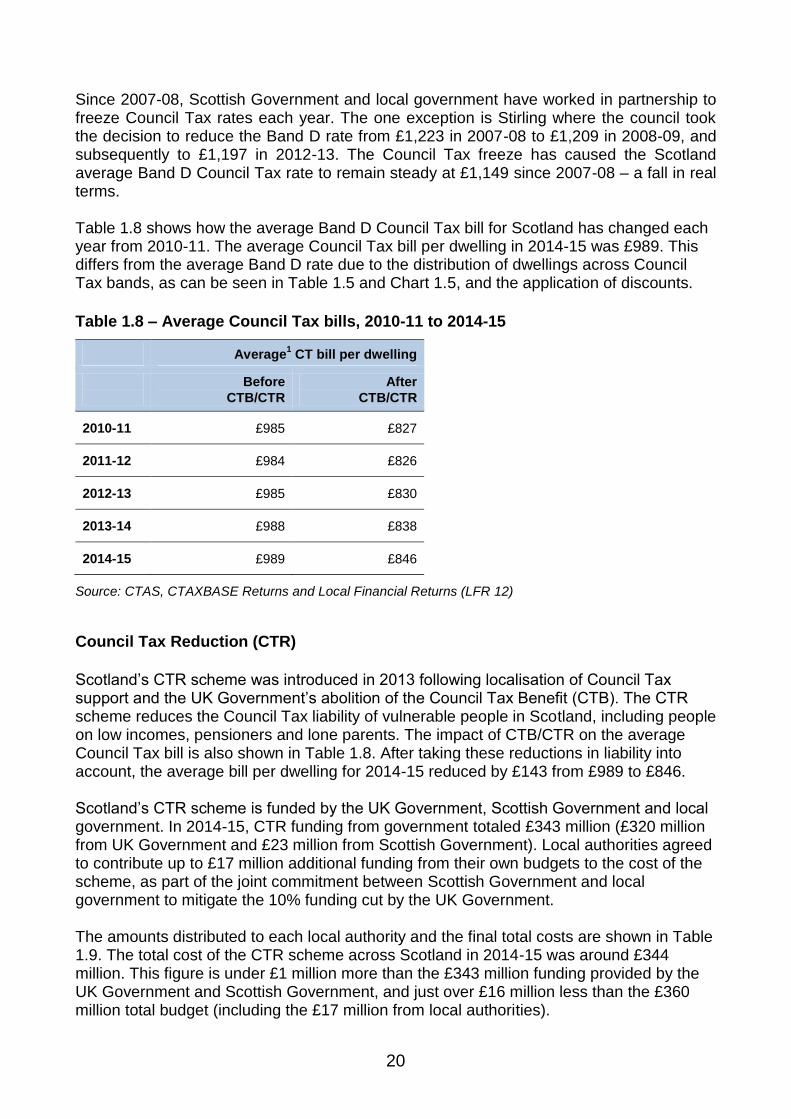
Since 2007-08, Scottish Government and local government have worked in partnership to freeze Council Tax rates each year. The one exception is Stirling where the council took the decision to reduce the Band D rate from £1,223 in 2007-08 to £1,209 in 2008-09, and subsequently to £1,197 in 2012-13. The Council Tax freeze has caused the Scotland average Band D Council Tax rate to remain steady at £1,149 since 2007-08 – a fall in real terms. Table 1.8 shows how the average Band D Council Tax bill for Scotland has changed each year from 2010-11. The average Council Tax bill per dwelling in 2014-15 was £989. This differs from the average Band D rate due to the distribution of dwellings across Council Tax bands, as can be seen in Table 1.5 and Chart 1.5, and the application of discounts.
Table 1.8 – Average Council Tax bills, 2010-11 to 2014-15
Average1 CT bill per dwelling
Before
CTB/CTR
After
CTB/CTR
2010-11 £985 £827
2011-12 £984 £826
2012-13 £985 £830
2013-14 £988 £838
2014-15 £989 £846
Source: CTAS, CTAXBASE Returns and Local Financial Returns (LFR 12)
Council Tax Reduction (CTR)
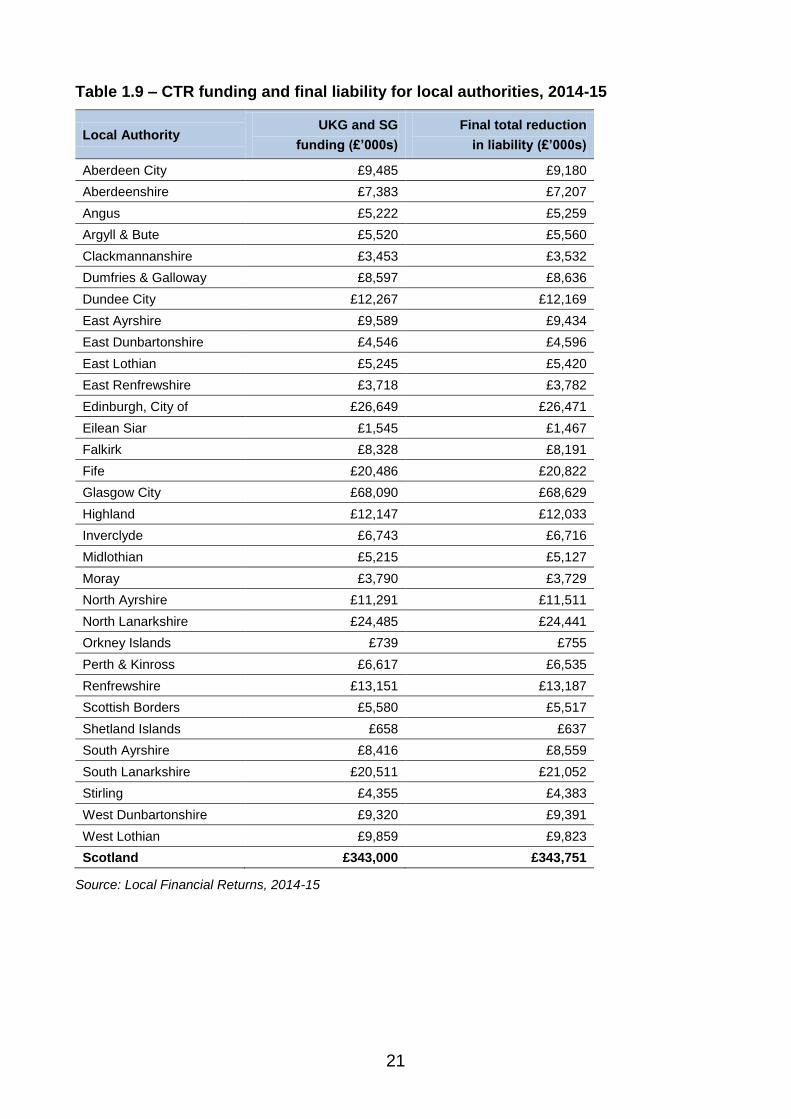
Scotland‟s CTR scheme was introduced in 2013 following localisation of Council Tax support and the UK Government‟s abolition of the Council Tax Benefit (CTB). The CTR scheme reduces the Council Tax liability of vulnerable people in Scotland, including people on low incomes, pensioners and lone parents. The impact of CTB/CTR on the average Council Tax bill is also shown in Table 1.8. After taking these reductions in liability into account, the average bill per dwelling for 2014-15 reduced by £143 from £989 to £846. Scotland‟s CTR scheme is funded by the UK Government, Scottish Government and local government. In 2014-15, CTR funding from government totaled £343 million (£320 million from UK Government and £23 million from Scottish Government). Local authorities agreed to contribute up to £17 million additional funding from their own budgets to the cost of the scheme, as part of the joint commitment between Scottish Government and local government to mitigate the 10% funding cut by the UK Government. The amounts distributed to each local authority and the final total costs are shown in Table 1.9. The total cost of the CTR scheme across Scotland in 2014-15 was around £344 million. This figure is under £1 million more than the £343 million funding provided by the UK Government and Scottish Government, and just over £16 million less than the £360 million total budget (including the £17 million from local authorities).
21
Table 1.9 – CTR funding and final liability for local authorities, 2014-15
Local Authority UKG and SG
funding (£’000s)
Final total reduction
in liability (£’000s)
Aberdeen City £9,485 £9,180
Aberdeenshire £7,383 £7,207
Angus £5,222 £5,259
Argyll & Bute £5,520 £5,560
Clackmannanshire £3,453 £3,532
Dumfries & Galloway £8,597 £8,636
Dundee City £12,267 £12,169
East Ayrshire £9,589 £9,434
East Dunbartonshire £4,546 £4,596
East Lothian £5,245 £5,420
East Renfrewshire £3,718 £3,782
Edinburgh, City of £26,649 £26,471
Eilean Siar £1,545 £1,467
Falkirk £8,328 £8,191
Fife £20,486 £20,822
Glasgow City £68,090 £68,629
Highland £12,147 £12,033
Inverclyde £6,743 £6,716
Midlothian £5,215 £5,127
Moray £3,790 £3,729
North Ayrshire £11,291 £11,511
North Lanarkshire £24,485 £24,441
Orkney Islands £739 £755
Perth & Kinross £6,617 £6,535
Renfrewshire £13,151 £13,187
Scottish Borders £5,580 £5,517
Shetland Islands £658 £637
South Ayrshire £8,416 £8,559
South Lanarkshire £20,511 £21,052
Stirling £4,355 £4,383
West Dunbartonshire £9,320 £9,391
West Lothian £9,859 £9,823
Scotland £343,000 £343,751
Source: Local Financial Returns, 2014-15
22
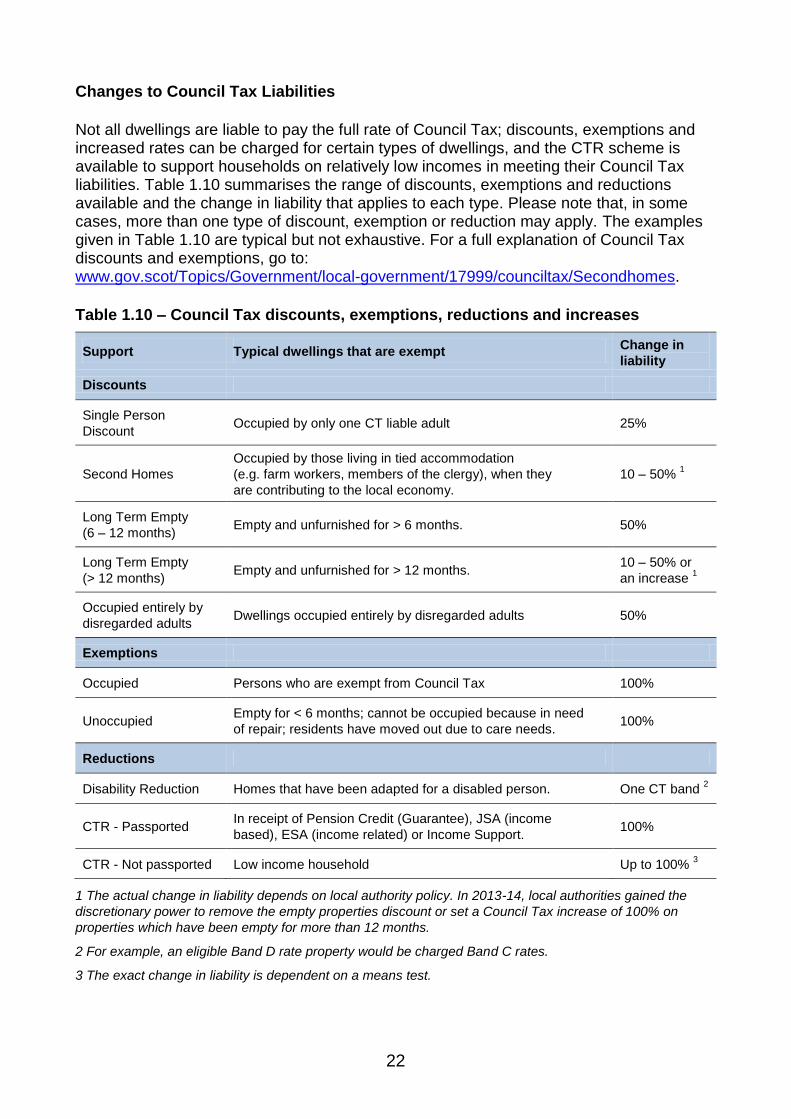
Changes to Council Tax Liabilities
Not all dwellings are liable to pay the full rate of Council Tax; discounts, exemptions and increased rates can be charged for certain types of dwellings, and the CTR scheme is available to support households on relatively low incomes in meeting their Council Tax liabilities. Table 1.10 summarises the range of discounts, exemptions and reductions available and the change in liability that applies to each type. Please note that, in some cases, more than one type of discount, exemption or reduction may apply. The examples given in Table 1.10 are typical but not exhaustive. For a full explanation of Council Tax discounts and exemptions, go to: www.gov.scot/Topics/Government/local-government/17999/counciltax/Secondhomes.
Table 1.10 – Council Tax discounts, exemptions, reductions and increases
Support Typical dwellings that are exempt Change in
liability
Discounts
Single Person
Discount Occupied by only one CT liable adult 25%
Second Homes
Occupied by those living in tied accommodation
(e.g. farm workers, members of the clergy), when they
are contributing to the local economy.
10 – 50% 1
Long Term Empty
(6 – 12 months) Empty and unfurnished for > 6 months. 50%
Long Term Empty
(> 12 months) Empty and unfurnished for > 12 months.
10 – 50% or
an increase 1
Occupied entirely by
disregarded adults Dwellings occupied entirely by disregarded adults 50%
Exemptions
Occupied Persons who are exempt from Council Tax 100%
Unoccupied Empty for < 6 months; cannot be occupied because in need
of repair; residents have moved out due to care needs. 100%
Reductions
Disability Reduction Homes that have been adapted for a disabled person. One CT band 2
CTR - Passported In receipt of Pension Credit (Guarantee), JSA (income
based), ESA (income related) or Income Support. 100%
CTR - Not passported Low income household Up to 100% 3
1 The actual change in liability depends on local authority policy. In 2013-14, local authorities gained the
discretionary power to remove the empty properties discount or set a Council Tax increase of 100% on
properties which have been empty for more than 12 months.
2 For example, an eligible Band D rate property would be charged Band C rates.
3 The exact change in liability is dependent on a means test.
23
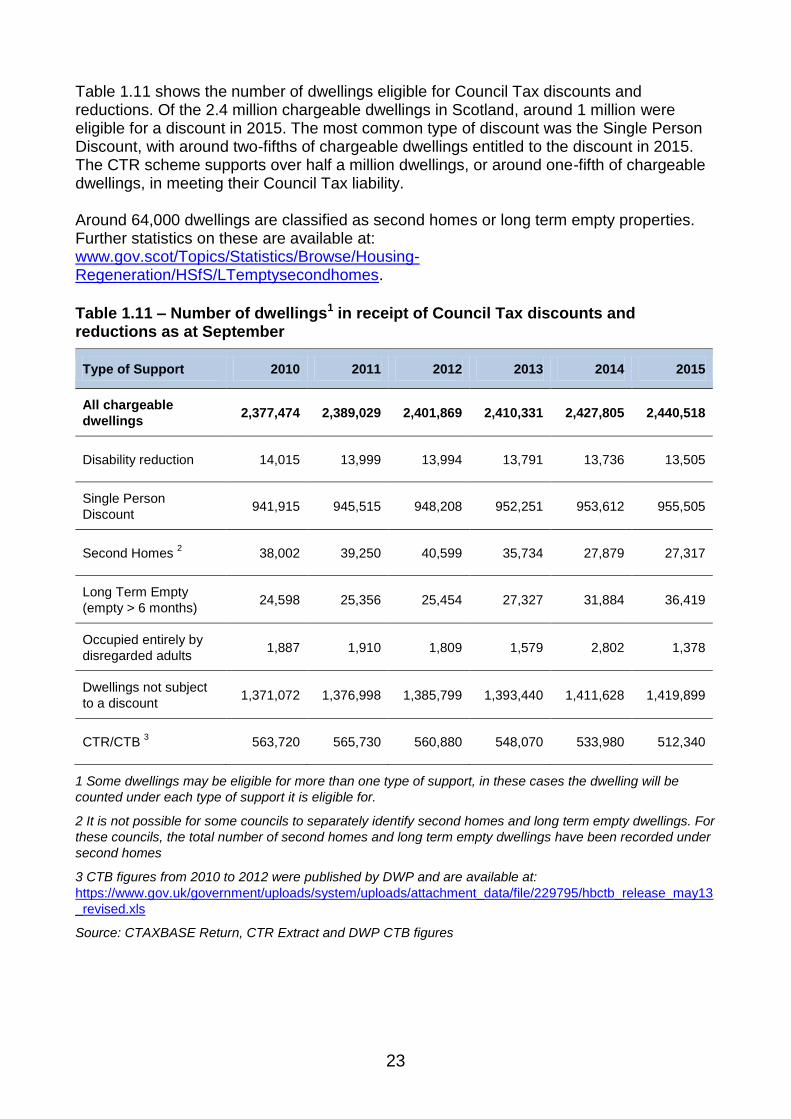
Table 1.11 shows the number of dwellings eligible for Council Tax discounts and reductions. Of the 2.4 million chargeable dwellings in Scotland, around 1 million were eligible for a discount in 2015. The most common type of discount was the Single Person Discount, with around two-fifths of chargeable dwellings entitled to the discount in 2015. The CTR scheme supports over half a million dwellings, or around one-fifth of chargeable dwellings, in meeting their Council Tax liability. Around 64,000 dwellings are classified as second homes or long term empty properties. Further statistics on these are available at: www.gov.scot/Topics/Statistics/Browse/Housing-Regeneration/HSfS/LTemptysecondhomes.
Table 1.11 – Number of dwellings1 in receipt of Council Tax discounts and reductions as at September
Type of Support 2010 2011 2012 2013 2014 2015
All chargeable
dwellings 2,377,474 2,389,029 2,401,869 2,410,331 2,427,805 2,440,518
Disability reduction 14,015 13,999 13,994 13,791 13,736 13,505
Single Person
Discount 941,915 945,515 948,208 952,251 953,612 955,505
Second Homes 2 38,002 39,250 40,599 35,734 27,879 27,317
Long Term Empty
(empty > 6 months) 24,598 25,356 25,454 27,327 31,884 36,419
Occupied entirely by
disregarded adults 1,887 1,910 1,809 1,579 2,802 1,378
Dwellings not subject
to a discount 1,371,072 1,376,998 1,385,799 1,393,440 1,411,628 1,419,899
CTR/CTB 3 563,720 565,730 560,880 548,070 533,980 512,340
1 Some dwellings may be eligible for more than one type of support, in these cases the dwelling will be
counted under each type of support it is eligible for.
2 It is not possible for some councils to separately identify second homes and long term empty dwellings. For
these councils, the total number of second homes and long term empty dwellings have been recorded under
second homes
3 CTB figures from 2010 to 2012 were published by DWP and are available at:
https://www.gov.uk/government/uploads/system/uploads/attachment_data/file/229795/hbctb_release_may13
_revised.xls
Source: CTAXBASE Return, CTR Extract and DWP CTB figures
24
1.5 Non-Domestic Rates
Non-Domestic Rates (NDR) is a property tax paid by the owner/occupier or tenant of a
non-domestic property.
In 2014-15, the income raised from NDR was £2.51 billion.
The principles of non-domestic rates were established in the Lands Valuation (Scotland)
Act of 1854. This act also provided for the appointment of the Scottish Assessors, who are
responsible for determining the classification and valuation of non-domestic and domestic
properties, and are independent of both the Scottish Government and local authorities. A
non-domestic property is an individual property used for non-domestic purposes.
Examples include business premises and third and public sector properties.
The value given to a property for NDR purposes is called its rateable value (RV). The RV
of a property is a legally defined valuation provided by the Assessor, broadly based on the
rental values the property could achieve. As such it is not necessarily a reflection of the
profitability, turnover or output of the business. It is established at revaluation where the
Scottish Assessors assess rateable values for all non-domestic properties in Scotland,
taking account of the type and nature of the property. All non-domestic properties and
their corresponding RVs are listed on the Valuation Roll, which is maintained by the
Scottish Assessors.
NDR bills are calculated using the rateable value (RV) of non-domestic properties,
multiplied by a poundage set nationally by Scottish Ministers, less any relief or exemption
entitlement.
For properties with a rateable value greater than £35,000, the Large Business Supplement
(LBS) applies in addition to the poundage (the poundage is effectively increased slightly by
adding the LBS).
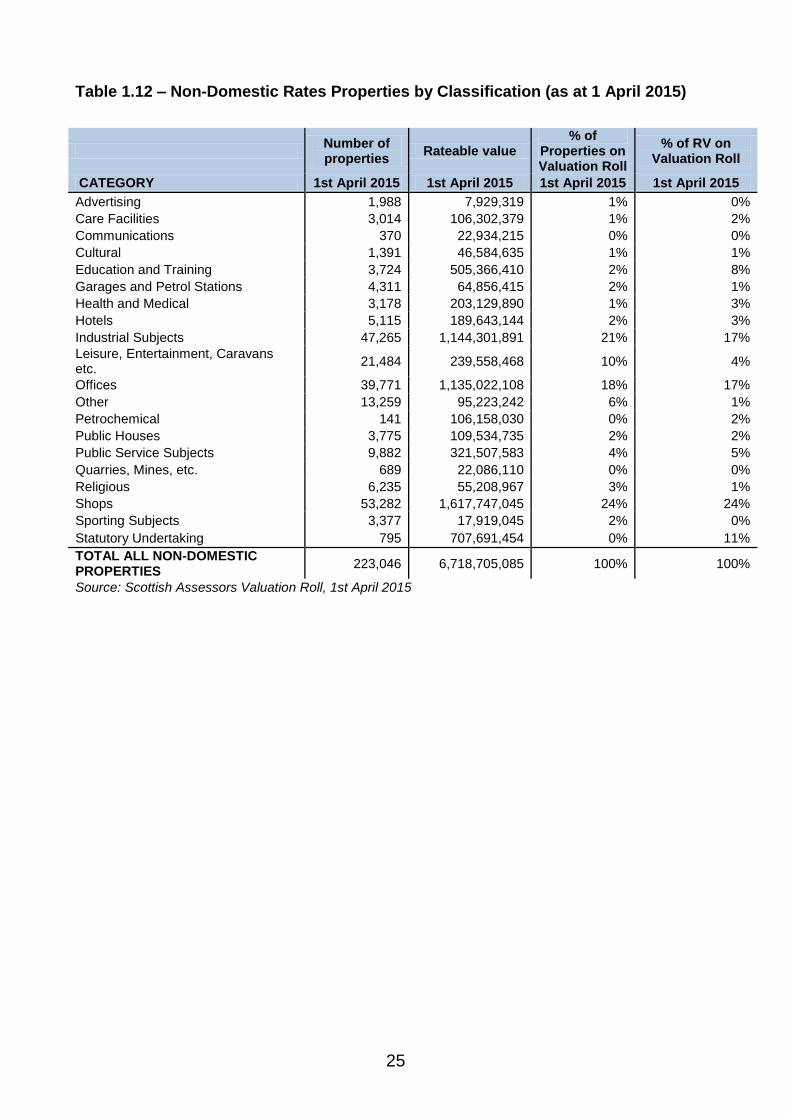
Table 1.12 shows the composition of properties (and associated RV) on the Valuation Roll
by property type. As at 1st April 2015, there were 223,046 properties with a total RV of £6.7
billion. Shops were the most prevalent type of property on the valuation roll, making up
nearly a quarter (24%) of the number of properties and RV on the roll. Industrial subjects
and offices are the next two largest categories in terms of numbers and RV. Together,
these three categories account for 63% of properties on the valuation roll, and 58% of the
RV.
25
Table 1.12 – Non-Domestic Rates Properties by Classification (as at 1 April 2015)
Number of properties
Rateable value % of
Properties on Valuation Roll
% of RV on Valuation Roll
CATEGORY 1st April 2015 1st April 2015 1st April 2015 1st April 2015
Advertising 1,988 7,929,319 1% 0%
Care Facilities 3,014 106,302,379 1% 2%
Communications 370 22,934,215 0% 0%
Cultural 1,391 46,584,635 1% 1%
Education and Training 3,724 505,366,410 2% 8%
Garages and Petrol Stations 4,311 64,856,415 2% 1%
Health and Medical 3,178 203,129,890 1% 3%
Hotels 5,115 189,643,144 2% 3%
Industrial Subjects 47,265 1,144,301,891 21% 17%
Leisure, Entertainment, Caravans etc.
21,484 239,558,468 10% 4%
Offices 39,771 1,135,022,108 18% 17%
Other 13,259 95,223,242 6% 1%
Petrochemical 141 106,158,030 0% 2%
Public Houses 3,775 109,534,735 2% 2%
Public Service Subjects 9,882 321,507,583 4% 5%
Quarries, Mines, etc. 689 22,086,110 0% 0%
Religious 6,235 55,208,967 3% 1%
Shops 53,282 1,617,747,045 24% 24%
Sporting Subjects 3,377 17,919,045 2% 0%
Statutory Undertaking 795 707,691,454 0% 11%
TOTAL ALL NON-DOMESTIC PROPERTIES
223,046 6,718,705,085 100% 100%
Source: Scottish Assessors Valuation Roll, 1st April 2015
26
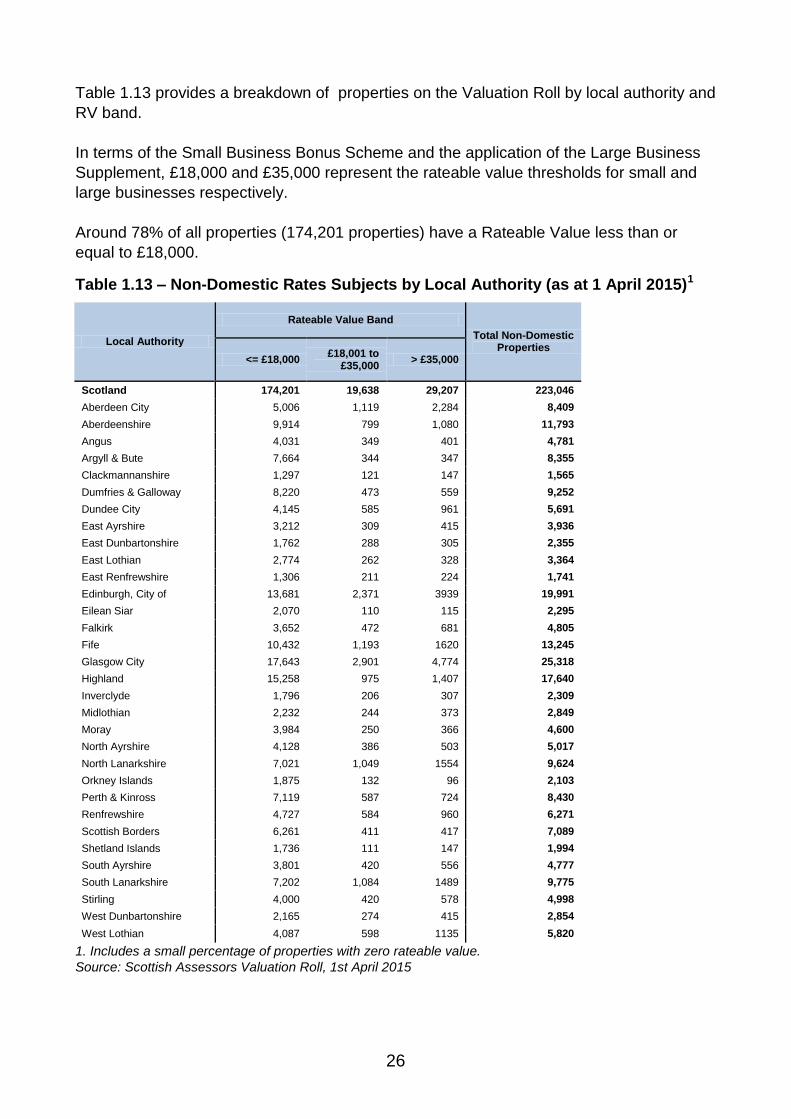
Table 1.13 provides a breakdown of properties on the Valuation Roll by local authority and
RV band.
In terms of the Small Business Bonus Scheme and the application of the Large Business
Supplement, £18,000 and £35,000 represent the rateable value thresholds for small and
large businesses respectively.
Around 78% of all properties (174,201 properties) have a Rateable Value less than or
equal to £18,000.
Table 1.13 – Non-Domestic Rates Subjects by Local Authority (as at 1 April 2015)1
Local Authority
Rateable Value Band
Total Non-Domestic Properties
<= £18,000 £18,001 to
£35,000 > £35,000
Scotland 174,201 19,638 29,207 223,046
Aberdeen City 5,006 1,119 2,284 8,409
Aberdeenshire 9,914 799 1,080 11,793
Angus 4,031 349 401 4,781
Argyll & Bute 7,664 344 347 8,355
Clackmannanshire 1,297 121 147 1,565
Dumfries & Galloway 8,220 473 559 9,252
Dundee City 4,145 585 961 5,691
East Ayrshire 3,212 309 415 3,936
East Dunbartonshire 1,762 288 305 2,355
East Lothian 2,774 262 328 3,364
East Renfrewshire 1,306 211 224 1,741
Edinburgh, City of 13,681 2,371 3939 19,991
Eilean Siar 2,070 110 115 2,295
Falkirk 3,652 472 681 4,805
Fife 10,432 1,193 1620 13,245
Glasgow City 17,643 2,901 4,774 25,318
Highland 15,258 975 1,407 17,640
Inverclyde 1,796 206 307 2,309
Midlothian 2,232 244 373 2,849
Moray 3,984 250 366 4,600
North Ayrshire 4,128 386 503 5,017
North Lanarkshire 7,021 1,049 1554 9,624
Orkney Islands 1,875 132 96 2,103
Perth & Kinross 7,119 587 724 8,430
Renfrewshire 4,727 584 960 6,271
Scottish Borders 6,261 411 417 7,089
Shetland Islands 1,736 111 147 1,994
South Ayrshire 3,801 420 556 4,777
South Lanarkshire 7,202 1,084 1489 9,775
Stirling 4,000 420 578 4,998
West Dunbartonshire 2,165 274 415 2,854
West Lothian 4,087 598 1135 5,820
1. Includes a small percentage of properties with zero rateable value.
Source: Scottish Assessors Valuation Roll, 1st April 2015
27
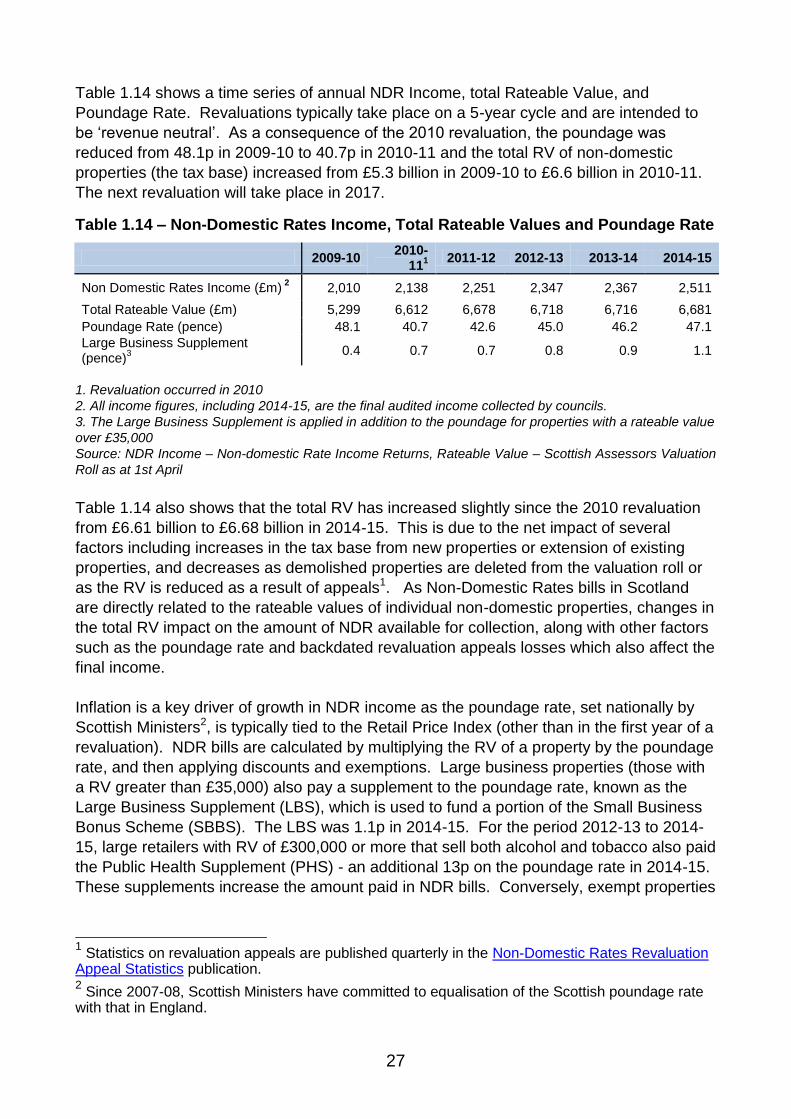
Table 1.14 shows a time series of annual NDR Income, total Rateable Value, and
Poundage Rate. Revaluations typically take place on a 5-year cycle and are intended to
be „revenue neutral‟. As a consequence of the 2010 revaluation, the poundage was
reduced from 48.1p in 2009-10 to 40.7p in 2010-11 and the total RV of non-domestic
properties (the tax base) increased from £5.3 billion in 2009-10 to £6.6 billion in 2010-11.
The next revaluation will take place in 2017.
Table 1.14 – Non-Domestic Rates Income, Total Rateable Values and Poundage Rate
2009-10 2010-
111
2011-12 2012-13 2013-14 2014-15
Non Domestic Rates Income (£m) 2 2,010 2,138 2,251 2,347 2,367 2,511
Total Rateable Value (£m) 5,299 6,612 6,678 6,718 6,716 6,681
Poundage Rate (pence) 48.1 40.7 42.6 45.0 46.2 47.1
Large Business Supplement (pence)
3
0.4 0.7 0.7 0.8 0.9 1.1
1. Revaluation occurred in 2010
2. All income figures, including 2014-15, are the final audited income collected by councils.
3. The Large Business Supplement is applied in addition to the poundage for properties with a rateable value
over £35,000
Source: NDR Income – Non-domestic Rate Income Returns, Rateable Value – Scottish Assessors Valuation
Roll as at 1st April
Table 1.14 also shows that the total RV has increased slightly since the 2010 revaluation
from £6.61 billion to £6.68 billion in 2014-15. This is due to the net impact of several
factors including increases in the tax base from new properties or extension of existing
properties, and decreases as demolished properties are deleted from the valuation roll or
as the RV is reduced as a result of appeals1. As Non-Domestic Rates bills in Scotland
are directly related to the rateable values of individual non-domestic properties, changes in
the total RV impact on the amount of NDR available for collection, along with other factors
such as the poundage rate and backdated revaluation appeals losses which also affect the
final income.
Inflation is a key driver of growth in NDR income as the poundage rate, set nationally by
Scottish Ministers2, is typically tied to the Retail Price Index (other than in the first year of a
revaluation). NDR bills are calculated by multiplying the RV of a property by the poundage
rate, and then applying discounts and exemptions. Large business properties (those with
a RV greater than £35,000) also pay a supplement to the poundage rate, known as the
Large Business Supplement (LBS), which is used to fund a portion of the Small Business
Bonus Scheme (SBBS). The LBS was 1.1p in 2014-15. For the period 2012-13 to 2014-
15, large retailers with RV of £300,000 or more that sell both alcohol and tobacco also paid
the Public Health Supplement (PHS) - an additional 13p on the poundage rate in 2014-15.
These supplements increase the amount paid in NDR bills. Conversely, exempt properties
1 Statistics on revaluation appeals are published quarterly in the Non-Domestic Rates Revaluation
Appeal Statistics publication. 2 Since 2007-08, Scottish Ministers have committed to equalisation of the Scottish poundage rate
with that in England.
28
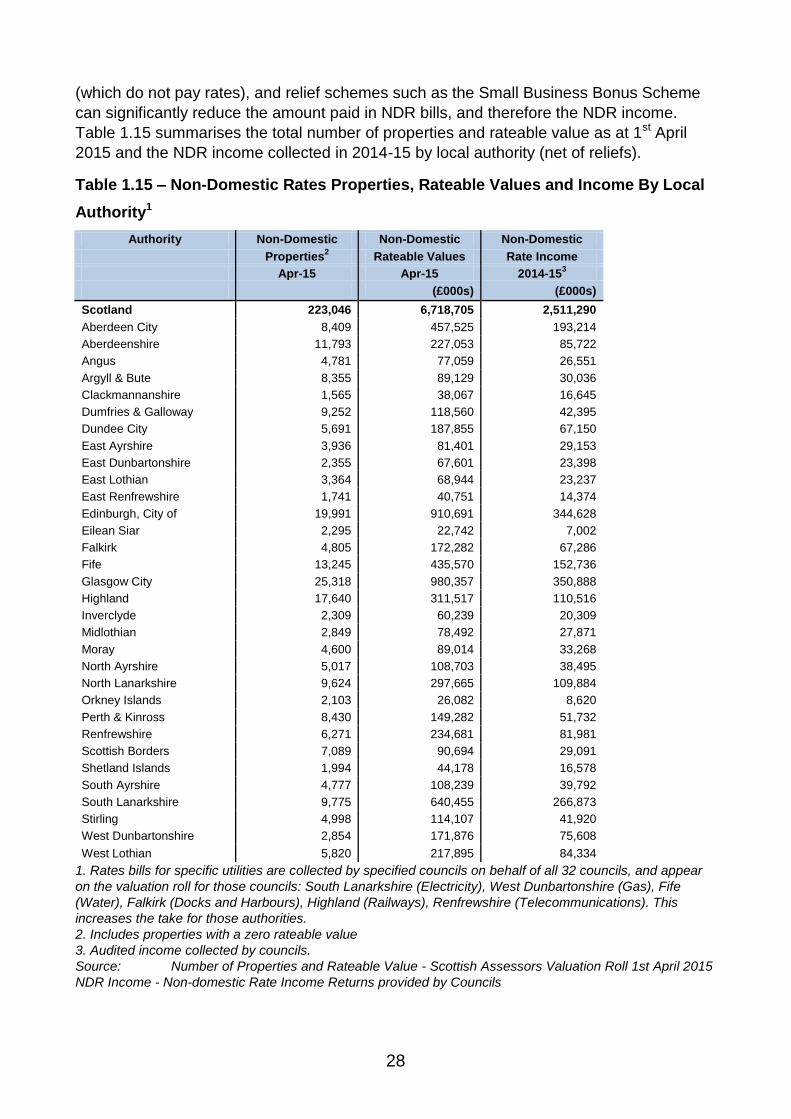
(which do not pay rates), and relief schemes such as the Small Business Bonus Scheme
can significantly reduce the amount paid in NDR bills, and therefore the NDR income.
Table 1.15 summarises the total number of properties and rateable value as at 1st April
2015 and the NDR income collected in 2014-15 by local authority (net of reliefs).
Table 1.15 – Non-Domestic Rates Properties, Rateable Values and Income By Local
Authority1
Authority Non-Domestic Non-Domestic Non-Domestic
Properties2 Rateable Values Rate Income
Apr-15 Apr-15 2014-153
(£000s) (£000s)
Scotland 223,046 6,718,705 2,511,290
Aberdeen City 8,409 457,525 193,214
Aberdeenshire 11,793 227,053 85,722
Angus 4,781 77,059 26,551
Argyll & Bute 8,355 89,129 30,036
Clackmannanshire 1,565 38,067 16,645
Dumfries & Galloway 9,252 118,560 42,395
Dundee City 5,691 187,855 67,150
East Ayrshire 3,936 81,401 29,153
East Dunbartonshire 2,355 67,601 23,398
East Lothian 3,364 68,944 23,237
East Renfrewshire 1,741 40,751 14,374
Edinburgh, City of 19,991 910,691 344,628
Eilean Siar 2,295 22,742 7,002
Falkirk 4,805 172,282 67,286
Fife 13,245 435,570 152,736
Glasgow City 25,318 980,357 350,888
Highland 17,640 311,517 110,516
Inverclyde 2,309 60,239 20,309
Midlothian 2,849 78,492 27,871
Moray 4,600 89,014 33,268
North Ayrshire 5,017 108,703 38,495
North Lanarkshire 9,624 297,665 109,884
Orkney Islands 2,103 26,082 8,620
Perth & Kinross 8,430 149,282 51,732
Renfrewshire 6,271 234,681 81,981
Scottish Borders 7,089 90,694 29,091
Shetland Islands 1,994 44,178 16,578
South Ayrshire 4,777 108,239 39,792
South Lanarkshire 9,775 640,455 266,873
Stirling 4,998 114,107 41,920
West Dunbartonshire 2,854 171,876 75,608
West Lothian 5,820 217,895 84,334
1. Rates bills for specific utilities are collected by specified councils on behalf of all 32 councils, and appear
on the valuation roll for those councils: South Lanarkshire (Electricity), West Dunbartonshire (Gas), Fife
(Water), Falkirk (Docks and Harbours), Highland (Railways), Renfrewshire (Telecommunications). This
increases the take for those authorities.
2. Includes properties with a zero rateable value
3. Audited income collected by councils.
Source: Number of Properties and Rateable Value - Scottish Assessors Valuation Roll 1st April 2015
NDR Income - Non-domestic Rate Income Returns provided by Councils
29
Table 1.15 shows geographical variations in the number of properties, rateable value and
NDR income. It should be noted however that some councils have responsibility for
collection of NDR for specific utilities as detailed in the footnote to the table. For these
councils, the entries on the valuation roll and NDR income include Scotland-wide data for
the specified utilities sectors. To avoid the need for revisions, only final (audited) NDR
income figures are included in this publication. The deadline for NDR income returns was
accelerated for 2014-15 and subsequent years to allow audited NDR income data to be
included.
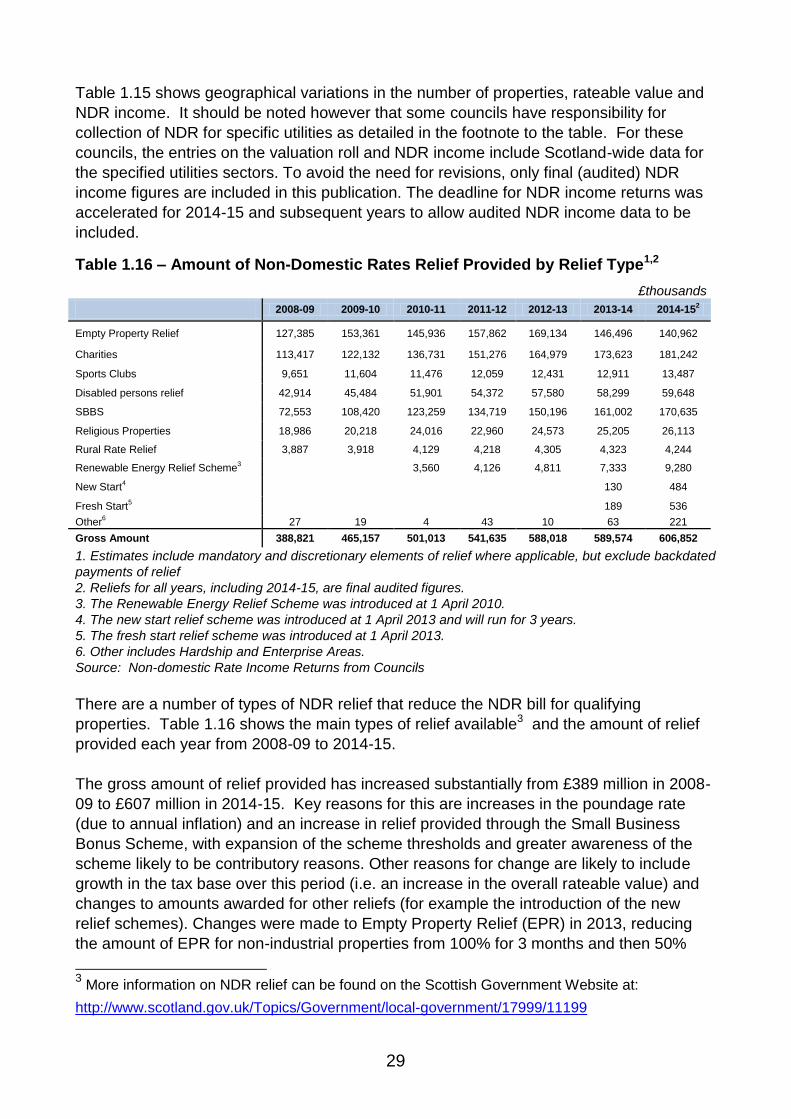
Table 1.16 – Amount of Non-Domestic Rates Relief Provided by Relief Type1,2
£thousands
2008-09 2009-10 2010-11 2011-12 2012-13 2013-14 2014-152
Empty Property Relief 127,385 153,361 145,936 157,862 169,134 146,496 140,962
Charities 113,417 122,132 136,731 151,276 164,979 173,623 181,242
Sports Clubs 9,651 11,604 11,476 12,059 12,431 12,911 13,487
Disabled persons relief 42,914 45,484 51,901 54,372 57,580 58,299 59,648
SBBS 72,553 108,420 123,259 134,719 150,196 161,002 170,635
Religious Properties 18,986 20,218 24,016 22,960 24,573 25,205 26,113
Rural Rate Relief 3,887 3,918 4,129 4,218 4,305 4,323 4,244
Renewable Energy Relief Scheme3
3,560 4,126 4,811 7,333 9,280
New Start4 130 484
Fresh Start5 189 536
Other6 27 19 4 43 10 63 221
Gross Amount 388,821 465,157 501,013 541,635 588,018 589,574 606,852
1. Estimates include mandatory and discretionary elements of relief where applicable, but exclude backdated
payments of relief
2. Reliefs for all years, including 2014-15, are final audited figures.
3. The Renewable Energy Relief Scheme was introduced at 1 April 2010.
4. The new start relief scheme was introduced at 1 April 2013 and will run for 3 years.
5. The fresh start relief scheme was introduced at 1 April 2013.
6. Other includes Hardship and Enterprise Areas.
Source: Non-domestic Rate Income Returns from Councils
There are a number of types of NDR relief that reduce the NDR bill for qualifying
properties. Table 1.16 shows the main types of relief available3 and the amount of relief
provided each year from 2008-09 to 2014-15.
The gross amount of relief provided has increased substantially from £389 million in 2008-
09 to £607 million in 2014-15. Key reasons for this are increases in the poundage rate
(due to annual inflation) and an increase in relief provided through the Small Business
Bonus Scheme, with expansion of the scheme thresholds and greater awareness of the
scheme likely to be contributory reasons. Other reasons for change are likely to include
growth in the tax base over this period (i.e. an increase in the overall rateable value) and
changes to amounts awarded for other reliefs (for example the introduction of the new
relief schemes). Changes were made to Empty Property Relief (EPR) in 2013, reducing
the amount of EPR for non-industrial properties from 100% for 3 months and then 50%
3 More information on NDR relief can be found on the Scottish Government Website at:
http://www.scotland.gov.uk/Topics/Government/local-government/17999/11199
30
thereafter to 100% for 3 months then 10% thereafter, resulting in decreases to the cost of
Empty Property Relief in 2013-14 and 2014-15.
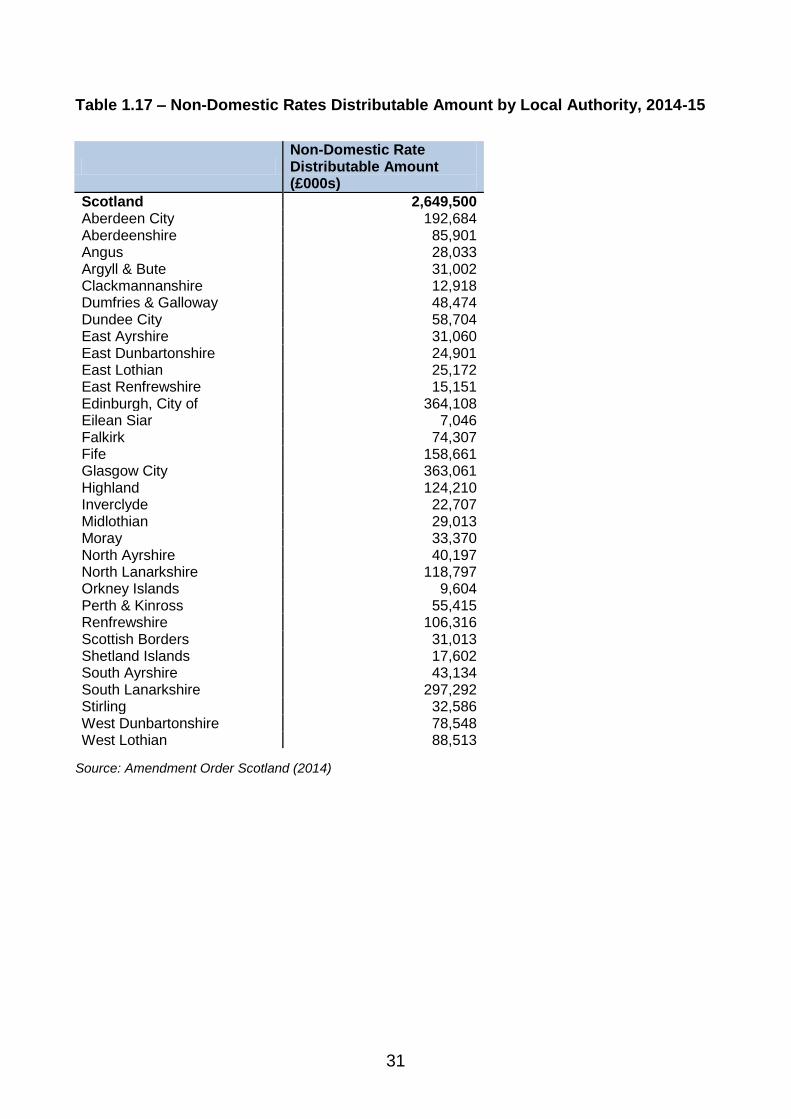
The total NDR income collected by local authorities is pooled at the Scotland level4. Each
council reports the NDR collected to the Scottish Government to be included in the central
pool. The amount to be re-distributed to each authority from the pool is known as the
Distributable Amount (DA) and is set by the Scottish Government before the start of the
financial year in question.
From 1st April 2011, the distribution methodology provides that Councils retain what it is
estimated they can collect in business rates (rather than the previous policy where it was
redistributed on the basis of population shares). As the combined total of NDR income
and General Revenue Funding (GRF) provided to councils is guaranteed by the Scottish
Government, any reduction in the amount of NDR collected is compensated for by a
corresponding increase in GRF and vice versa. Any surpluses or deficits are paid out or
recovered from Councils in the calculation of future years distributable business rates
totals. The DA is based upon a forecast of the NDR income and prior year adjustments,
and is therefore not guaranteed to match the total contributions to the pool for that year.
The calculation of the distributable amount for 2014-15 is given in Annex F and the 2014-
15 distributable amount per Local Authority is shown in Table 1.17.
4 A Business Rates Incentivisation Scheme (BRIS) was introduced from April 2012 to incentivise Councils to
maximise existing business rates income and attract new economic growth by allowing all authorities that
exceed their annual business rates target to retain 50% of any additional income.
31
Table 1.17 – Non-Domestic Rates Distributable Amount by Local Authority, 2014-15
Non-Domestic Rate Distributable Amount (£000s)
Scotland 2,649,500 Aberdeen City 192,684 Aberdeenshire 85,901 Angus 28,033 Argyll & Bute 31,002 Clackmannanshire 12,918 Dumfries & Galloway 48,474 Dundee City 58,704 East Ayrshire 31,060 East Dunbartonshire 24,901 East Lothian 25,172 East Renfrewshire 15,151 Edinburgh, City of 364,108 Eilean Siar 7,046 Falkirk 74,307 Fife 158,661 Glasgow City 363,061 Highland 124,210 Inverclyde 22,707 Midlothian 29,013 Moray 33,370 North Ayrshire 40,197 North Lanarkshire 118,797 Orkney Islands 9,604 Perth & Kinross 55,415 Renfrewshire 106,316 Scottish Borders 31,013 Shetland Islands 17,602 South Ayrshire 43,134 South Lanarkshire 297,292 Stirling 32,586 West Dunbartonshire 78,548 West Lothian 88,513
Source: Amendment Order Scotland (2014)
32
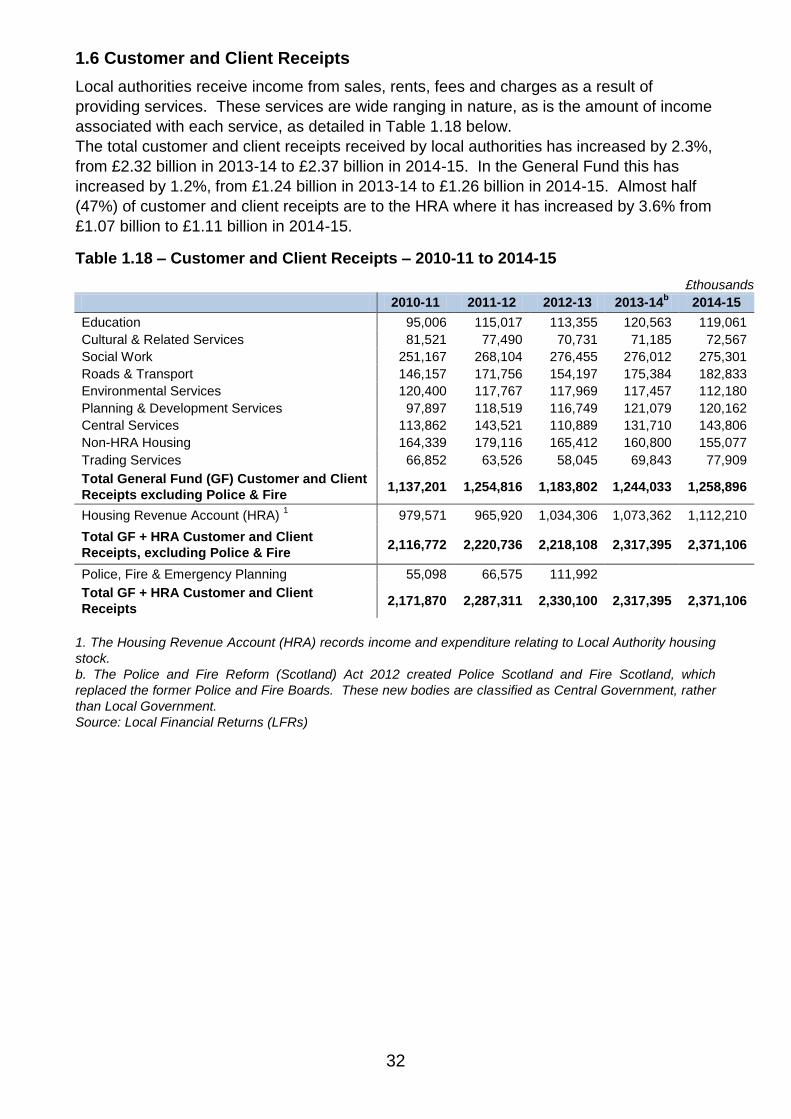
1.6 Customer and Client Receipts
Local authorities receive income from sales, rents, fees and charges as a result of
providing services. These services are wide ranging in nature, as is the amount of income
associated with each service, as detailed in Table 1.18 below.
The total customer and client receipts received by local authorities has increased by 2.3%,
from £2.32 billion in 2013-14 to £2.37 billion in 2014-15. In the General Fund this has
increased by 1.2%, from £1.24 billion in 2013-14 to £1.26 billion in 2014-15. Almost half
(47%) of customer and client receipts are to the HRA where it has increased by 3.6% from
£1.07 billion to £1.11 billion in 2014-15.
Table 1.18 – Customer and Client Receipts – 2010-11 to 2014-15
£thousands
2010-11 2011-12 2012-13 2013-14b 2014-15
Education 95,006 115,017 113,355 120,563 119,061
Cultural & Related Services 81,521 77,490 70,731 71,185 72,567
Social Work 251,167 268,104 276,455 276,012 275,301
Roads & Transport 146,157 171,756 154,197 175,384 182,833
Environmental Services 120,400 117,767 117,969 117,457 112,180
Planning & Development Services 97,897 118,519 116,749 121,079 120,162
Central Services 113,862 143,521 110,889 131,710 143,806
Non-HRA Housing 164,339 179,116 165,412 160,800 155,077
Trading Services 66,852 63,526 58,045 69,843 77,909
Total General Fund (GF) Customer and Client
Receipts excluding Police & Fire 1,137,201 1,254,816 1,183,802 1,244,033 1,258,896
Housing Revenue Account (HRA) 1 979,571 965,920 1,034,306 1,073,362 1,112,210
Total GF + HRA Customer and Client
Receipts, excluding Police & Fire 2,116,772 2,220,736 2,218,108 2,317,395 2,371,106
Police, Fire & Emergency Planning 55,098 66,575 111,992
Total GF + HRA Customer and Client
Receipts 2,171,870 2,287,311 2,330,100 2,317,395 2,371,106
1. The Housing Revenue Account (HRA) records income and expenditure relating to Local Authority housing
stock.
b. The Police and Fire Reform (Scotland) Act 2012 created Police Scotland and Fire Scotland, which
replaced the former Police and Fire Boards. These new bodies are classified as Central Government, rather
than Local Government.
Source: Local Financial Returns (LFRs)
33
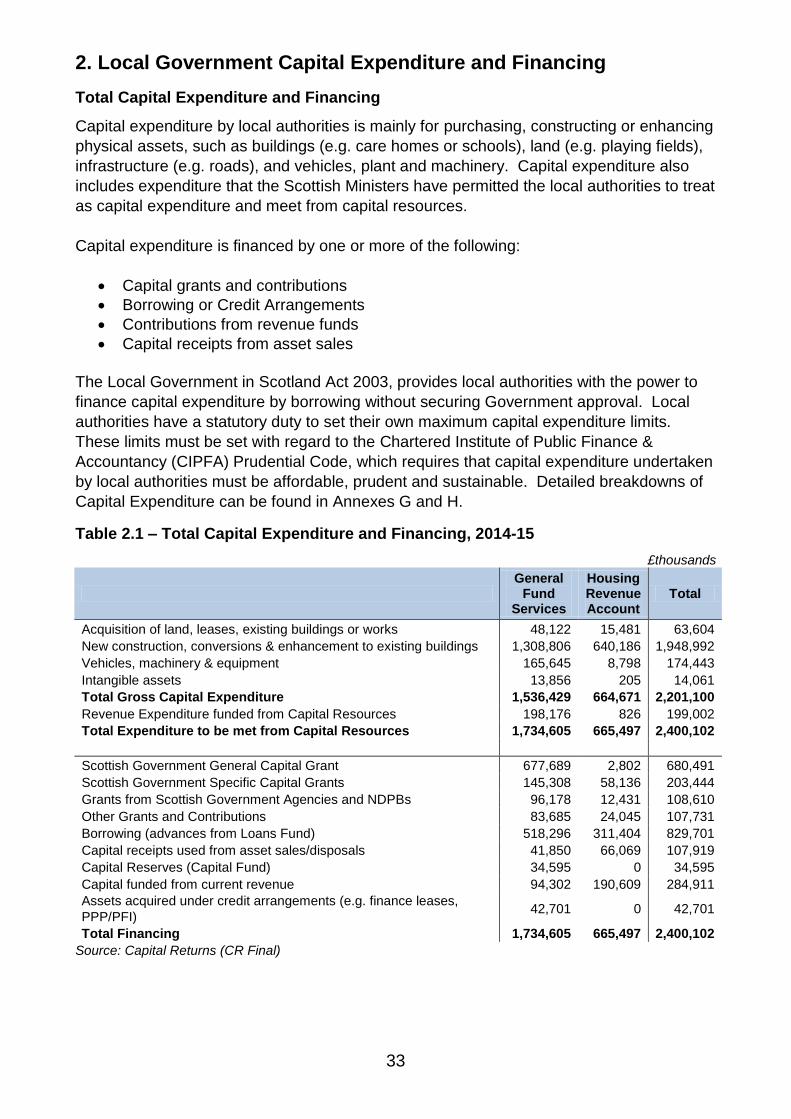
2. Local Government Capital Expenditure and Financing
Total Capital Expenditure and Financing
Capital expenditure by local authorities is mainly for purchasing, constructing or enhancing
physical assets, such as buildings (e.g. care homes or schools), land (e.g. playing fields),
infrastructure (e.g. roads), and vehicles, plant and machinery. Capital expenditure also
includes expenditure that the Scottish Ministers have permitted the local authorities to treat
as capital expenditure and meet from capital resources.
Capital expenditure is financed by one or more of the following:
Capital grants and contributions
Borrowing or Credit Arrangements
Contributions from revenue funds
Capital receipts from asset sales
The Local Government in Scotland Act 2003, provides local authorities with the power to
finance capital expenditure by borrowing without securing Government approval. Local
authorities have a statutory duty to set their own maximum capital expenditure limits.
These limits must be set with regard to the Chartered Institute of Public Finance &
Accountancy (CIPFA) Prudential Code, which requires that capital expenditure undertaken
by local authorities must be affordable, prudent and sustainable. Detailed breakdowns of
Capital Expenditure can be found in Annexes G and H.
Table 2.1 – Total Capital Expenditure and Financing, 2014-15
£thousands
General
Fund Services
Housing Revenue Account
Total
Acquisition of land, leases, existing buildings or works 48,122 15,481 63,604
New construction, conversions & enhancement to existing buildings 1,308,806 640,186 1,948,992
Vehicles, machinery & equipment 165,645 8,798 174,443
Intangible assets 13,856 205 14,061
Total Gross Capital Expenditure 1,536,429 664,671 2,201,100
Revenue Expenditure funded from Capital Resources 198,176 826 199,002
Total Expenditure to be met from Capital Resources 1,734,605 665,497 2,400,102
Scottish Government General Capital Grant 677,689 2,802 680,491
Scottish Government Specific Capital Grants 145,308 58,136 203,444
Grants from Scottish Government Agencies and NDPBs 96,178 12,431 108,610
Other Grants and Contributions 83,685 24,045 107,731
Borrowing (advances from Loans Fund) 518,296 311,404 829,701
Capital receipts used from asset sales/disposals 41,850 66,069 107,919
Capital Reserves (Capital Fund) 34,595 0 34,595
Capital funded from current revenue 94,302 190,609 284,911
Assets acquired under credit arrangements (e.g. finance leases,
PPP/PFI) 42,701 0 42,701
Total Financing 1,734,605 665,497 2,400,102
Source: Capital Returns (CR Final)
34
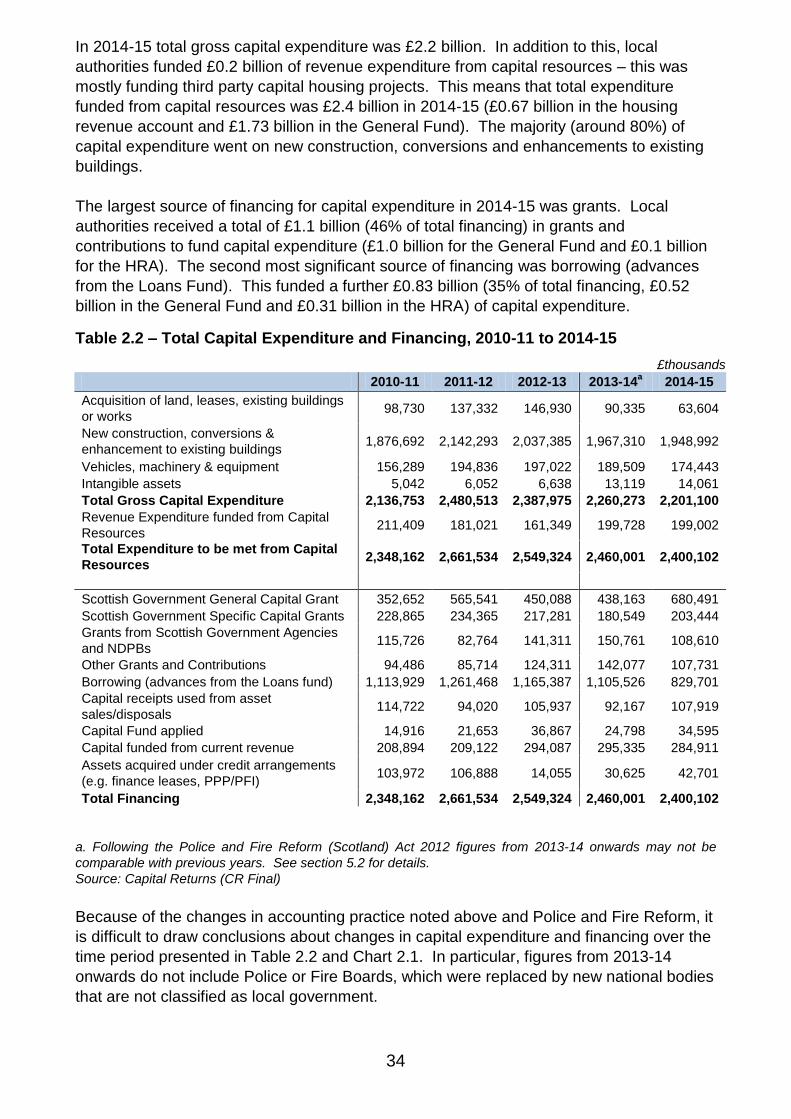
In 2014-15 total gross capital expenditure was £2.2 billion. In addition to this, local
authorities funded £0.2 billion of revenue expenditure from capital resources – this was
mostly funding third party capital housing projects. This means that total expenditure
funded from capital resources was £2.4 billion in 2014-15 (£0.67 billion in the housing
revenue account and £1.73 billion in the General Fund). The majority (around 80%) of
capital expenditure went on new construction, conversions and enhancements to existing
buildings.
The largest source of financing for capital expenditure in 2014-15 was grants. Local
authorities received a total of £1.1 billion (46% of total financing) in grants and
contributions to fund capital expenditure (£1.0 billion for the General Fund and £0.1 billion
for the HRA). The second most significant source of financing was borrowing (advances
from the Loans Fund). This funded a further £0.83 billion (35% of total financing, £0.52
billion in the General Fund and £0.31 billion in the HRA) of capital expenditure.
Table 2.2 – Total Capital Expenditure and Financing, 2010-11 to 2014-15
£thousands
2010-11 2011-12 2012-13 2013-14a 2014-15
Acquisition of land, leases, existing buildings
or works 98,730 137,332 146,930 90,335 63,604
New construction, conversions &
enhancement to existing buildings 1,876,692 2,142,293 2,037,385 1,967,310 1,948,992
Vehicles, machinery & equipment 156,289 194,836 197,022 189,509 174,443
Intangible assets 5,042 6,052 6,638 13,119 14,061
Total Gross Capital Expenditure 2,136,753 2,480,513 2,387,975 2,260,273 2,201,100
Revenue Expenditure funded from Capital
Resources 211,409 181,021 161,349 199,728 199,002
Total Expenditure to be met from Capital
Resources 2,348,162 2,661,534 2,549,324 2,460,001 2,400,102
Scottish Government General Capital Grant 352,652 565,541 450,088 438,163 680,491
Scottish Government Specific Capital Grants 228,865 234,365 217,281 180,549 203,444
Grants from Scottish Government Agencies
and NDPBs 115,726 82,764 141,311 150,761 108,610
Other Grants and Contributions 94,486 85,714 124,311 142,077 107,731
Borrowing (advances from the Loans fund) 1,113,929 1,261,468 1,165,387 1,105,526 829,701
Capital receipts used from asset
sales/disposals 114,722 94,020 105,937 92,167 107,919
Capital Fund applied 14,916 21,653 36,867 24,798 34,595
Capital funded from current revenue 208,894 209,122 294,087 295,335 284,911
Assets acquired under credit arrangements
(e.g. finance leases, PPP/PFI) 103,972 106,888 14,055 30,625 42,701
Total Financing 2,348,162 2,661,534 2,549,324 2,460,001 2,400,102
a. Following the Police and Fire Reform (Scotland) Act 2012 figures from 2013-14 onwards may not be
comparable with previous years. See section 5.2 for details.
Source: Capital Returns (CR Final)
Because of the changes in accounting practice noted above and Police and Fire Reform, it
is difficult to draw conclusions about changes in capital expenditure and financing over the
time period presented in Table 2.2 and Chart 2.1. In particular, figures from 2013-14
onwards do not include Police or Fire Boards, which were replaced by new national bodies
that are not classified as local government.
35
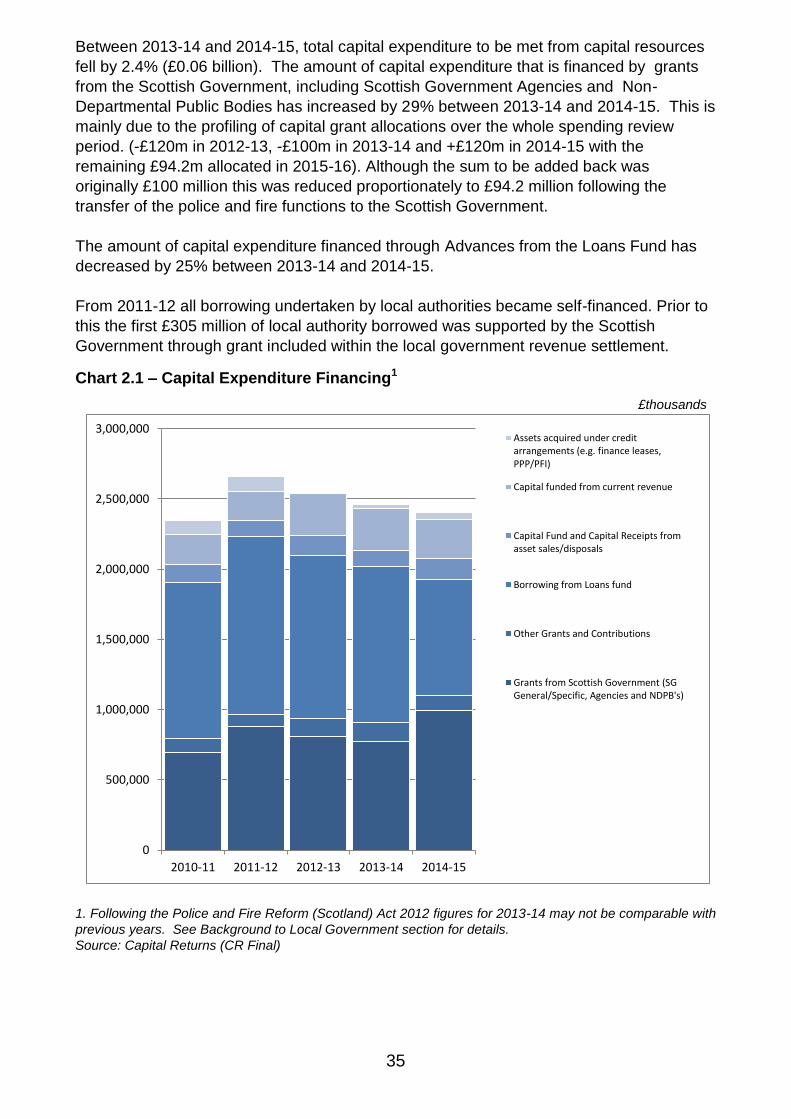
Between 2013-14 and 2014-15, total capital expenditure to be met from capital resources
fell by 2.4% (£0.06 billion). The amount of capital expenditure that is financed by grants
from the Scottish Government, including Scottish Government Agencies and Non-
Departmental Public Bodies has increased by 29% between 2013-14 and 2014-15. This is
mainly due to the profiling of capital grant allocations over the whole spending review
period. (-£120m in 2012-13, -£100m in 2013-14 and +£120m in 2014-15 with the
remaining £94.2m allocated in 2015-16). Although the sum to be added back was
originally £100 million this was reduced proportionately to £94.2 million following the
transfer of the police and fire functions to the Scottish Government.
The amount of capital expenditure financed through Advances from the Loans Fund has
decreased by 25% between 2013-14 and 2014-15.
From 2011-12 all borrowing undertaken by local authorities became self-financed. Prior to
this the first £305 million of local authority borrowed was supported by the Scottish
Government through grant included within the local government revenue settlement.
Chart 2.1 – Capital Expenditure Financing1
£thousands
1. Following the Police and Fire Reform (Scotland) Act 2012 figures for 2013-14 may not be comparable with
previous years. See Background to Local Government section for details.
Source: Capital Returns (CR Final)
0
500,000
1,000,000
1,500,000
2,000,000
2,500,000
3,000,000
2010-11 2011-12 2012-13 2013-14 2014-15
Assets acquired under creditarrangements (e.g. finance leases,PPP/PFI)
Capital funded from current revenue
Capital Fund and Capital Receipts fromasset sales/disposals
Borrowing from Loans fund
Other Grants and Contributions
Grants from Scottish Government (SGGeneral/Specific, Agencies and NDPB's)
36
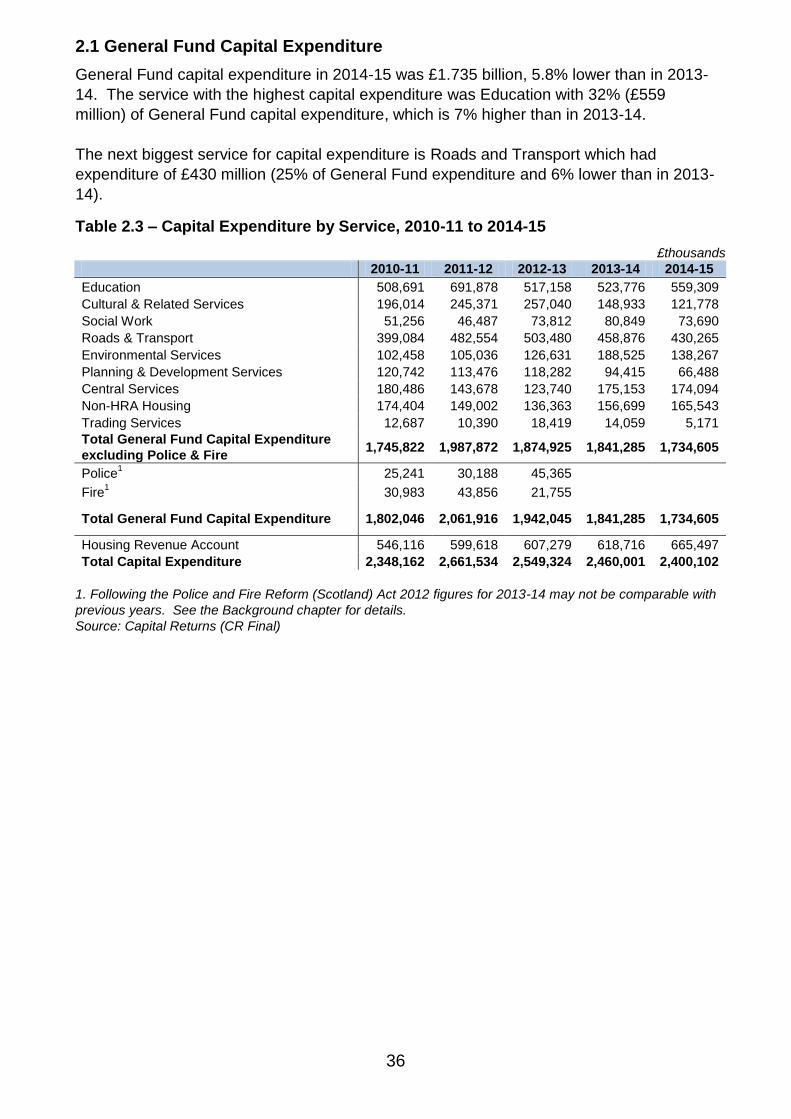
2.1 General Fund Capital Expenditure
General Fund capital expenditure in 2014-15 was £1.735 billion, 5.8% lower than in 2013-
14. The service with the highest capital expenditure was Education with 32% (£559
million) of General Fund capital expenditure, which is 7% higher than in 2013-14.
The next biggest service for capital expenditure is Roads and Transport which had
expenditure of £430 million (25% of General Fund expenditure and 6% lower than in 2013-
14).
Table 2.3 – Capital Expenditure by Service, 2010-11 to 2014-15
£thousands
2010-11 2011-12 2012-13 2013-14 2014-15
Education 508,691 691,878 517,158 523,776 559,309
Cultural & Related Services 196,014 245,371 257,040 148,933 121,778
Social Work 51,256 46,487 73,812 80,849 73,690
Roads & Transport 399,084 482,554 503,480 458,876 430,265
Environmental Services 102,458 105,036 126,631 188,525 138,267
Planning & Development Services 120,742 113,476 118,282 94,415 66,488
Central Services 180,486 143,678 123,740 175,153 174,094
Non-HRA Housing 174,404 149,002 136,363 156,699 165,543
Trading Services 12,687 10,390 18,419 14,059 5,171
Total General Fund Capital Expenditure
excluding Police & Fire 1,745,822 1,987,872 1,874,925 1,841,285 1,734,605
Police1 25,241 30,188 45,365
Fire1 30,983 43,856 21,755
Total General Fund Capital Expenditure 1,802,046 2,061,916 1,942,045 1,841,285 1,734,605
Housing Revenue Account 546,116 599,618 607,279 618,716 665,497
Total Capital Expenditure 2,348,162 2,661,534 2,549,324 2,460,001 2,400,102
1. Following the Police and Fire Reform (Scotland) Act 2012 figures for 2013-14 may not be comparable with
previous years. See the Background chapter for details.
Source: Capital Returns (CR Final)
37
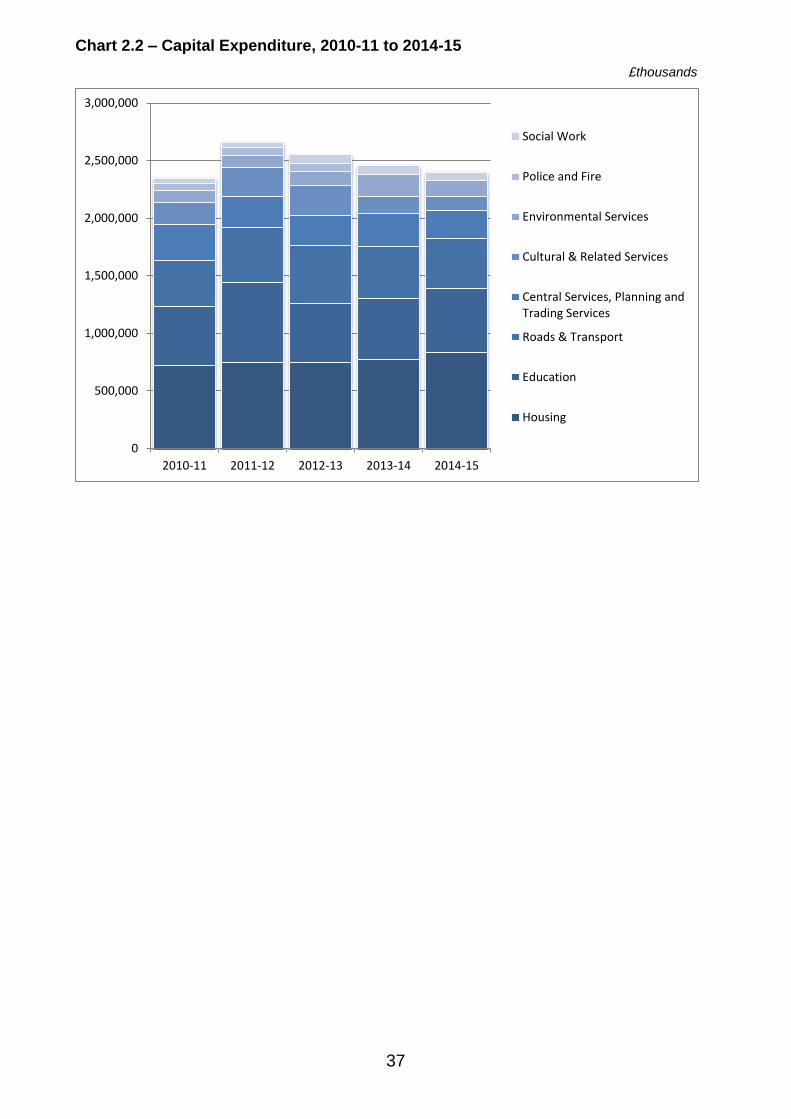
Chart 2.2 – Capital Expenditure, 2010-11 to 2014-15
£thousands
0
500,000
1,000,000
1,500,000
2,000,000
2,500,000
3,000,000
2010-11 2011-12 2012-13 2013-14 2014-15
Social Work
Police and Fire
Environmental Services
Cultural & Related Services
Central Services, Planning andTrading Services
Roads & Transport
Education
Housing
38
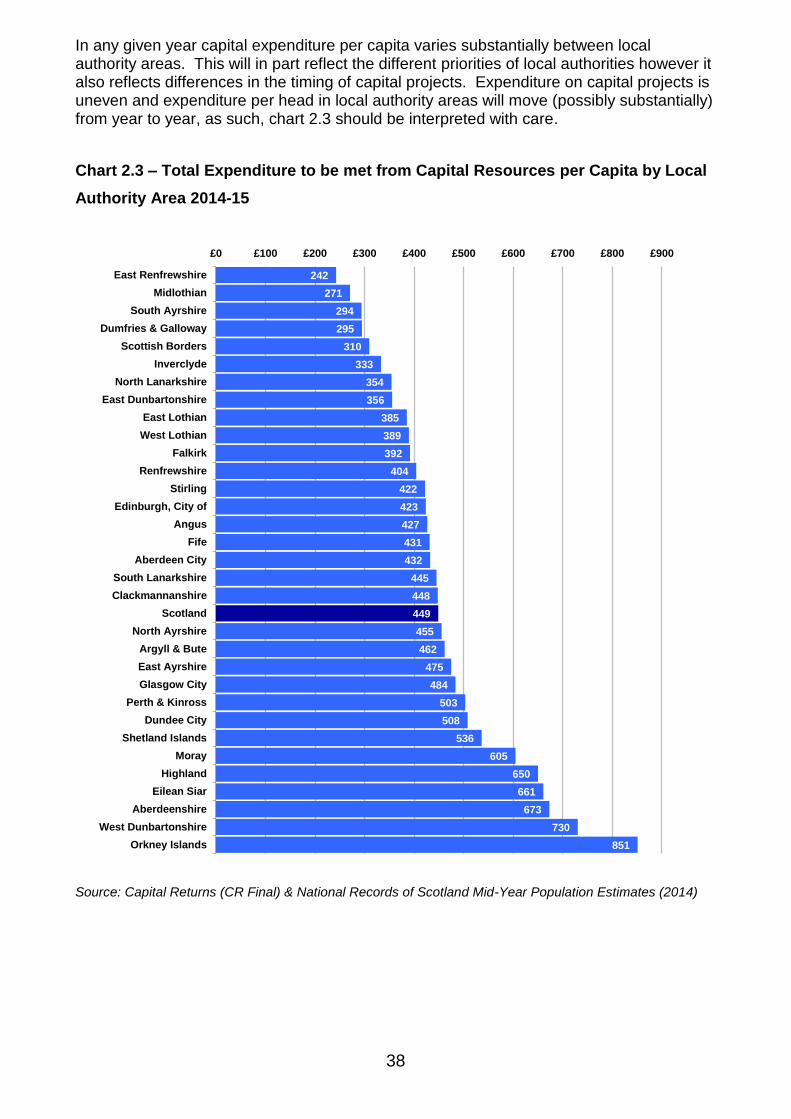
In any given year capital expenditure per capita varies substantially between local authority areas. This will in part reflect the different priorities of local authorities however it also reflects differences in the timing of capital projects. Expenditure on capital projects is uneven and expenditure per head in local authority areas will move (possibly substantially) from year to year, as such, chart 2.3 should be interpreted with care.
Chart 2.3 – Total Expenditure to be met from Capital Resources per Capita by Local
Authority Area 2014-15
Source: Capital Returns (CR Final) & National Records of Scotland Mid-Year Population Estimates (2014)
242
271
294
295
310
333
354
356
385
389
392
404
422
423
427
431
432
445
448
449
455
462
475
484
503
508
536
605
650
661
673
730
851
£0 £100 £200 £300 £400 £500 £600 £700 £800 £900
East Renfrewshire
Midlothian
South Ayrshire
Dumfries & Galloway
Scottish Borders
Inverclyde
North Lanarkshire
East Dunbartonshire
East Lothian
West Lothian
Falkirk
Renfrewshire
Stirling
Edinburgh, City of
Angus
Fife
Aberdeen City
South Lanarkshire
Clackmannanshire
Scotland
North Ayrshire
Argyll & Bute
East Ayrshire
Glasgow City
Perth & Kinross
Dundee City
Shetland Islands
Moray
Highland
Eilean Siar
Aberdeenshire
West Dunbartonshire
Orkney Islands
39
2.2 General Fund Capital Financing
Capital Grants
Capital grants are grants provided to local authorities to fund capital investment. The
Scottish Government provides two types of grant funding to local authorities – a General
Capital Grant and a number of ring-fenced grants. Scottish Government Agencies, such
as Transport Scotland, and Non-Departmental Bodies such as sportscotland may also
award grants for projects. Other grants and contributions include grants from other local
authorities, European Structural Funds, contributions from private developers or persons,
and the use of council tax discounts from second homes or long term empty properties.
Table 2.2 (above) provides time series of grant income from 2010-11 to 2014-15.
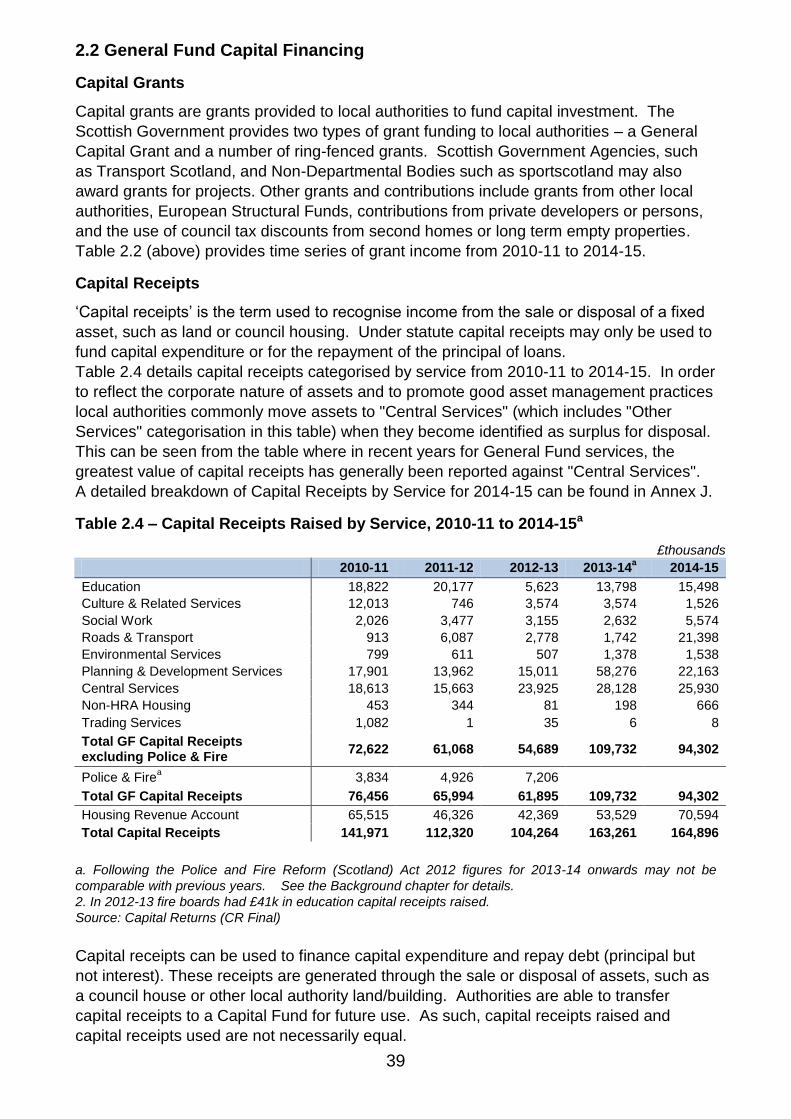
Capital Receipts
„Capital receipts‟ is the term used to recognise income from the sale or disposal of a fixed
asset, such as land or council housing. Under statute capital receipts may only be used to
fund capital expenditure or for the repayment of the principal of loans.
Table 2.4 details capital receipts categorised by service from 2010-11 to 2014-15. In order
to reflect the corporate nature of assets and to promote good asset management practices
local authorities commonly move assets to "Central Services" (which includes "Other
Services" categorisation in this table) when they become identified as surplus for disposal.
This can be seen from the table where in recent years for General Fund services, the
greatest value of capital receipts has generally been reported against "Central Services".
A detailed breakdown of Capital Receipts by Service for 2014-15 can be found in Annex J.
Table 2.4 – Capital Receipts Raised by Service, 2010-11 to 2014-15a
£thousands
2010-11 2011-12 2012-13 2013-14a 2014-15
Education 18,822 20,177 5,623 13,798 15,498
Culture & Related Services 12,013 746 3,574 3,574 1,526
Social Work 2,026 3,477 3,155 2,632 5,574
Roads & Transport 913 6,087 2,778 1,742 21,398
Environmental Services 799 611 507 1,378 1,538
Planning & Development Services 17,901 13,962 15,011 58,276 22,163
Central Services 18,613 15,663 23,925 28,128 25,930
Non-HRA Housing 453 344 81 198 666
Trading Services 1,082 1 35 6 8
Total GF Capital Receipts excluding Police & Fire
72,622 61,068 54,689 109,732 94,302
Police & Firea 3,834 4,926 7,206
Total GF Capital Receipts 76,456 65,994 61,895 109,732 94,302
Housing Revenue Account 65,515 46,326 42,369 53,529 70,594
Total Capital Receipts 141,971 112,320 104,264 163,261 164,896
a. Following the Police and Fire Reform (Scotland) Act 2012 figures for 2013-14 onwards may not be
comparable with previous years. See the Background chapter for details.
2. In 2012-13 fire boards had £41k in education capital receipts raised.
Source: Capital Returns (CR Final)
Capital receipts can be used to finance capital expenditure and repay debt (principal but
not interest). These receipts are generated through the sale or disposal of assets, such as
a council house or other local authority land/building. Authorities are able to transfer
capital receipts to a Capital Fund for future use. As such, capital receipts raised and
capital receipts used are not necessarily equal.
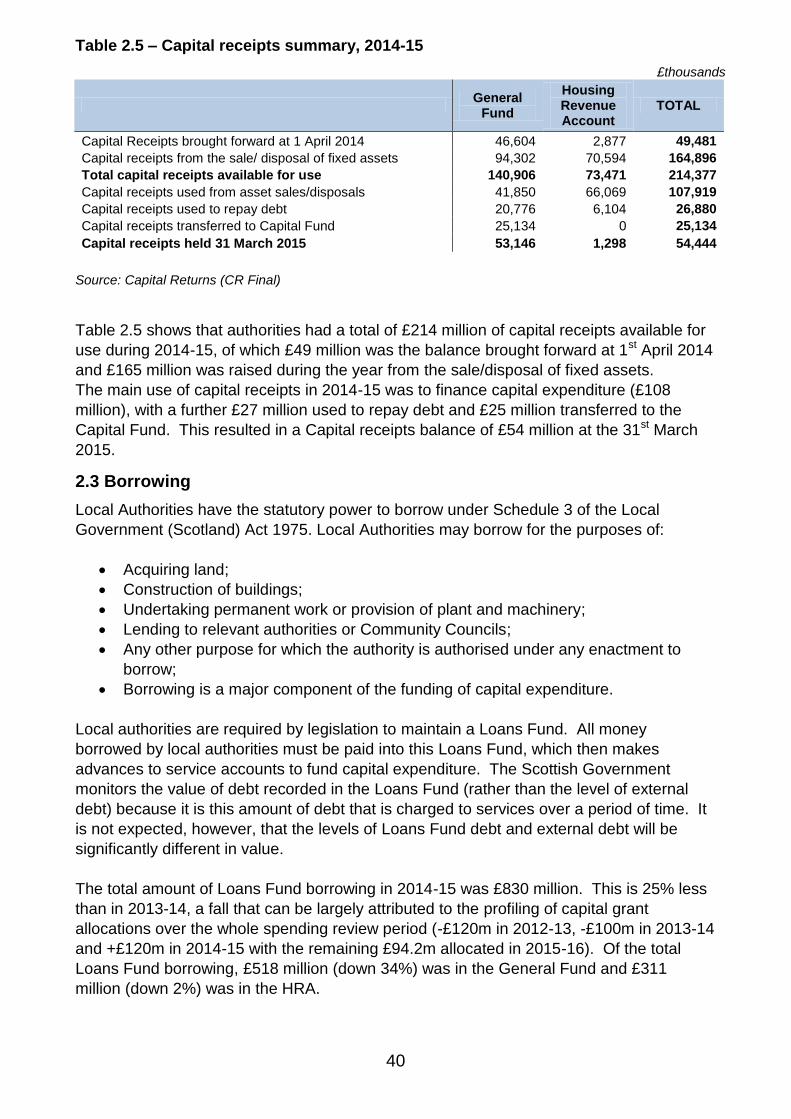
40
Table 2.5 – Capital receipts summary, 2014-15
£thousands
General
Fund
Housing Revenue Account
TOTAL
Capital Receipts brought forward at 1 April 2014 46,604 2,877 49,481
Capital receipts from the sale/ disposal of fixed assets 94,302 70,594 164,896
Total capital receipts available for use 140,906 73,471 214,377
Capital receipts used from asset sales/disposals 41,850 66,069 107,919
Capital receipts used to repay debt 20,776 6,104 26,880
Capital receipts transferred to Capital Fund 25,134 0 25,134
Capital receipts held 31 March 2015 53,146 1,298 54,444
Source: Capital Returns (CR Final)
Table 2.5 shows that authorities had a total of £214 million of capital receipts available for
use during 2014-15, of which £49 million was the balance brought forward at 1st April 2014
and £165 million was raised during the year from the sale/disposal of fixed assets.
The main use of capital receipts in 2014-15 was to finance capital expenditure (£108
million), with a further £27 million used to repay debt and £25 million transferred to the
Capital Fund. This resulted in a Capital receipts balance of £54 million at the 31st March
2015.
2.3 Borrowing
Local Authorities have the statutory power to borrow under Schedule 3 of the Local
Government (Scotland) Act 1975. Local Authorities may borrow for the purposes of:
Acquiring land;
Construction of buildings;
Undertaking permanent work or provision of plant and machinery;
Lending to relevant authorities or Community Councils;
Any other purpose for which the authority is authorised under any enactment to
borrow;
Borrowing is a major component of the funding of capital expenditure.
Local authorities are required by legislation to maintain a Loans Fund. All money
borrowed by local authorities must be paid into this Loans Fund, which then makes
advances to service accounts to fund capital expenditure. The Scottish Government
monitors the value of debt recorded in the Loans Fund (rather than the level of external
debt) because it is this amount of debt that is charged to services over a period of time. It
is not expected, however, that the levels of Loans Fund debt and external debt will be
significantly different in value.
The total amount of Loans Fund borrowing in 2014-15 was £830 million. This is 25% less
than in 2013-14, a fall that can be largely attributed to the profiling of capital grant
allocations over the whole spending review period (-£120m in 2012-13, -£100m in 2013-14
and +£120m in 2014-15 with the remaining £94.2m allocated in 2015-16). Of the total
Loans Fund borrowing, £518 million (down 34%) was in the General Fund and £311
million (down 2%) was in the HRA.
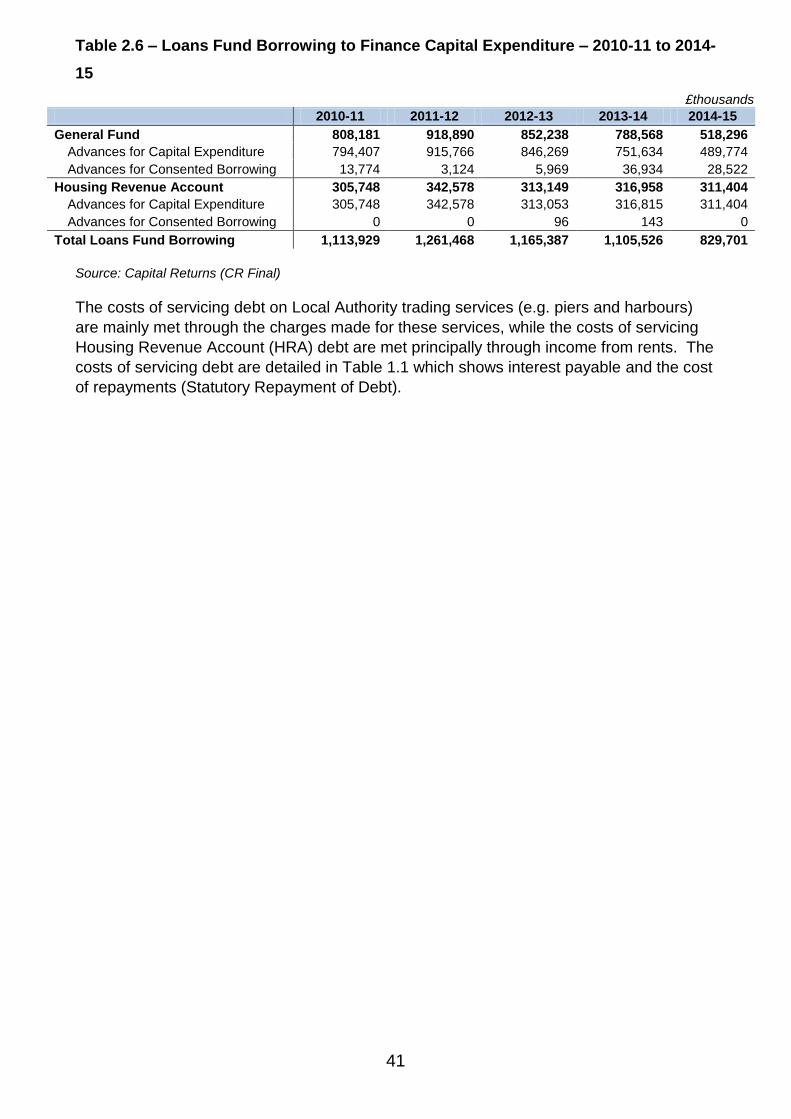
41
Table 2.6 – Loans Fund Borrowing to Finance Capital Expenditure – 2010-11 to 2014-
15
£thousands
2010-11 2011-12 2012-13 2013-14 2014-15
General Fund 808,181 918,890 852,238 788,568 518,296
Advances for Capital Expenditure 794,407 915,766 846,269 751,634 489,774
Advances for Consented Borrowing 13,774 3,124 5,969 36,934 28,522
Housing Revenue Account 305,748 342,578 313,149 316,958 311,404
Advances for Capital Expenditure 305,748 342,578 313,053 316,815 311,404
Advances for Consented Borrowing 0 0 96 143 0
Total Loans Fund Borrowing 1,113,929 1,261,468 1,165,387 1,105,526 829,701
Source: Capital Returns (CR Final)
The costs of servicing debt on Local Authority trading services (e.g. piers and harbours)
are mainly met through the charges made for these services, while the costs of servicing
Housing Revenue Account (HRA) debt are met principally through income from rents. The
costs of servicing debt are detailed in Table 1.1 which shows interest payable and the cost
of repayments (Statutory Repayment of Debt).
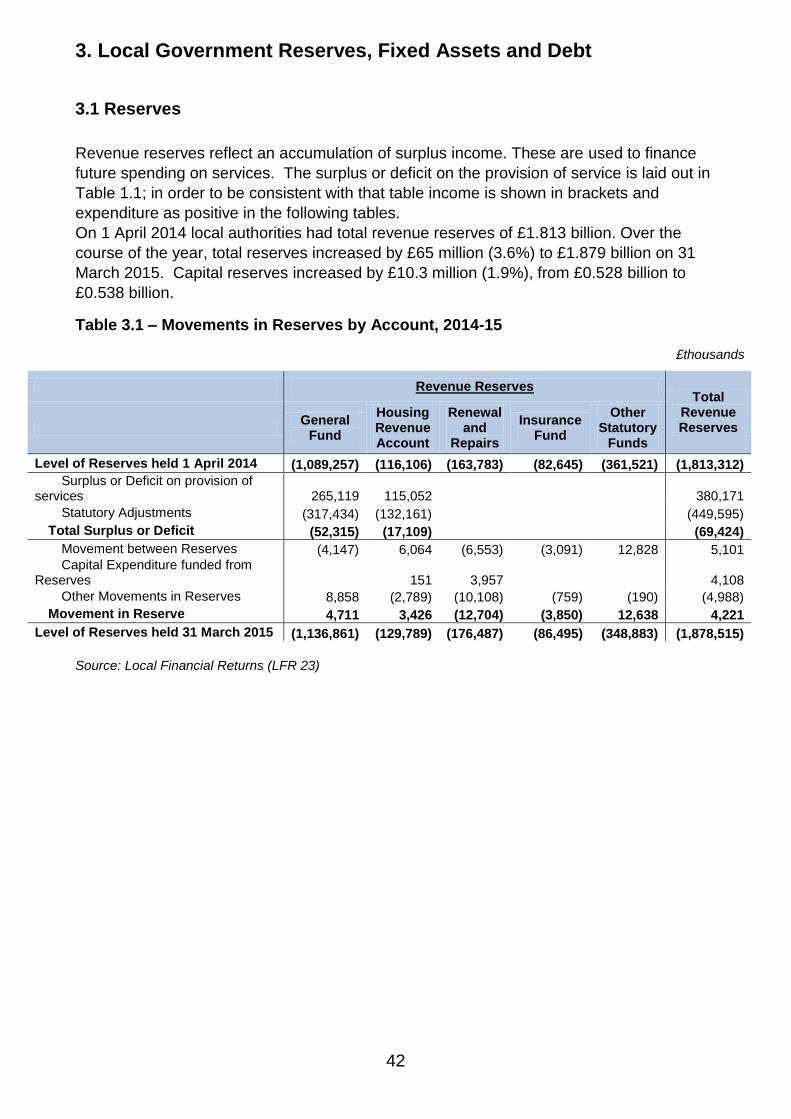
42
3. Local Government Reserves, Fixed Assets and Debt
3.1 Reserves
Revenue reserves reflect an accumulation of surplus income. These are used to finance
future spending on services. The surplus or deficit on the provision of service is laid out in
Table 1.1; in order to be consistent with that table income is shown in brackets and
expenditure as positive in the following tables.
On 1 April 2014 local authorities had total revenue reserves of £1.813 billion. Over the
course of the year, total reserves increased by £65 million (3.6%) to £1.879 billion on 31
March 2015. Capital reserves increased by £10.3 million (1.9%), from £0.528 billion to
£0.538 billion.
Table 3.1 – Movements in Reserves by Account, 2014-15
£thousands
Revenue Reserves Total
Revenue Reserves
General Fund
Housing Revenue Account
Renewal and
Repairs
Insurance Fund
Other Statutory
Funds
Level of Reserves held 1 April 2014 (1,089,257) (116,106) (163,783) (82,645) (361,521) (1,813,312)
Surplus or Deficit on provision of services 265,119 115,052 380,171
Statutory Adjustments (317,434) (132,161) (449,595)
Total Surplus or Deficit (52,315) (17,109) (69,424)
Movement between Reserves (4,147) 6,064 (6,553) (3,091) 12,828 5,101 Capital Expenditure funded from
Reserves 151 3,957 4,108
Other Movements in Reserves 8,858 (2,789) (10,108) (759) (190) (4,988)
Movement in Reserve 4,711 3,426 (12,704) (3,850) 12,638 4,221
Level of Reserves held 31 March 2015 (1,136,861) (129,789) (176,487) (86,495) (348,883) (1,878,515)
Source: Local Financial Returns (LFR 23)
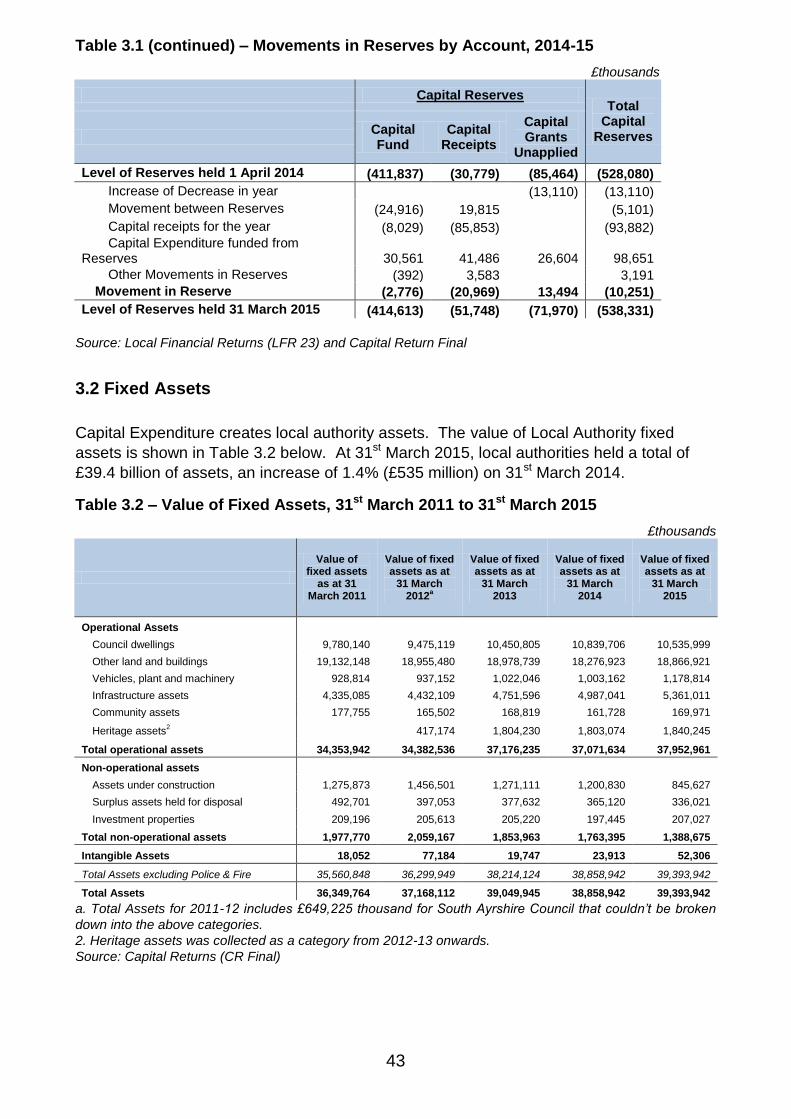
43
Table 3.1 (continued) – Movements in Reserves by Account, 2014-15
£thousands
Capital Reserves Total
Capital Reserves
Capital Fund
Capital Receipts
Capital Grants
Unapplied
Level of Reserves held 1 April 2014 (411,837) (30,779) (85,464) (528,080)
Increase of Decrease in year (13,110) (13,110)
Movement between Reserves (24,916) 19,815 (5,101)
Capital receipts for the year (8,029) (85,853) (93,882) Capital Expenditure funded from
Reserves 30,561 41,486 26,604 98,651
Other Movements in Reserves (392) 3,583 3,191
Movement in Reserve (2,776) (20,969) 13,494 (10,251)
Level of Reserves held 31 March 2015 (414,613) (51,748) (71,970) (538,331)
Source: Local Financial Returns (LFR 23) and Capital Return Final
3.2 Fixed Assets
Capital Expenditure creates local authority assets. The value of Local Authority fixed
assets is shown in Table 3.2 below. At 31st March 2015, local authorities held a total of
£39.4 billion of assets, an increase of 1.4% (£535 million) on 31st March 2014.
Table 3.2 – Value of Fixed Assets, 31st March 2011 to 31st March 2015
£thousands
Value of fixed assets
as at 31 March 2011
Value of fixed assets as at
31 March 2012
a
Value of fixed assets as at
31 March 2013
Value of fixed assets as at
31 March 2014
Value of fixed assets as at
31 March 2015
Operational Assets
Council dwellings 9,780,140 9,475,119 10,450,805 10,839,706 10,535,999
Other land and buildings 19,132,148 18,955,480 18,978,739 18,276,923 18,866,921
Vehicles, plant and machinery 928,814 937,152 1,022,046 1,003,162 1,178,814
Infrastructure assets 4,335,085 4,432,109 4,751,596 4,987,041 5,361,011
Community assets 177,755 165,502 168,819 161,728 169,971
Heritage assets2 417,174 1,804,230 1,803,074 1,840,245
Total operational assets 34,353,942 34,382,536 37,176,235 37,071,634 37,952,961
Non-operational assets
Assets under construction 1,275,873 1,456,501 1,271,111 1,200,830 845,627
Surplus assets held for disposal 492,701 397,053 377,632 365,120 336,021
Investment properties 209,196 205,613 205,220 197,445 207,027
Total non-operational assets 1,977,770 2,059,167 1,853,963 1,763,395 1,388,675
Intangible Assets 18,052 77,184 19,747 23,913 52,306
Total Assets excluding Police & Fire 35,560,848 36,299,949 38,214,124 38,858,942 39,393,942
Total Assets 36,349,764 37,168,112 39,049,945 38,858,942 39,393,942
a. Total Assets for 2011-12 includes £649,225 thousand for South Ayrshire Council that couldn’t be broken
down into the above categories.
2. Heritage assets was collected as a category from 2012-13 onwards.
Source: Capital Returns (CR Final)
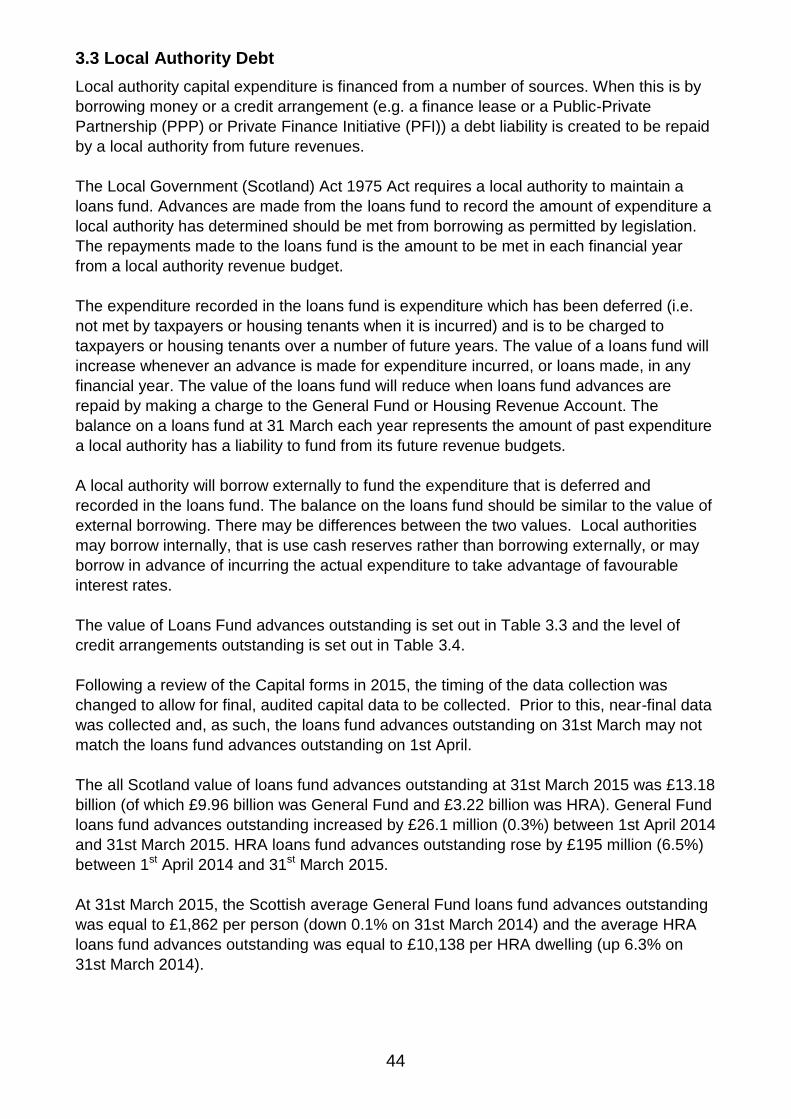
44
3.3 Local Authority Debt
Local authority capital expenditure is financed from a number of sources. When this is by
borrowing money or a credit arrangement (e.g. a finance lease or a Public-Private
Partnership (PPP) or Private Finance Initiative (PFI)) a debt liability is created to be repaid
by a local authority from future revenues.
The Local Government (Scotland) Act 1975 Act requires a local authority to maintain a
loans fund. Advances are made from the loans fund to record the amount of expenditure a
local authority has determined should be met from borrowing as permitted by legislation.
The repayments made to the loans fund is the amount to be met in each financial year
from a local authority revenue budget.
The expenditure recorded in the loans fund is expenditure which has been deferred (i.e.
not met by taxpayers or housing tenants when it is incurred) and is to be charged to
taxpayers or housing tenants over a number of future years. The value of a loans fund will
increase whenever an advance is made for expenditure incurred, or loans made, in any
financial year. The value of the loans fund will reduce when loans fund advances are
repaid by making a charge to the General Fund or Housing Revenue Account. The
balance on a loans fund at 31 March each year represents the amount of past expenditure
a local authority has a liability to fund from its future revenue budgets.
A local authority will borrow externally to fund the expenditure that is deferred and
recorded in the loans fund. The balance on the loans fund should be similar to the value of
external borrowing. There may be differences between the two values. Local authorities
may borrow internally, that is use cash reserves rather than borrowing externally, or may
borrow in advance of incurring the actual expenditure to take advantage of favourable
interest rates.
The value of Loans Fund advances outstanding is set out in Table 3.3 and the level of
credit arrangements outstanding is set out in Table 3.4.
Following a review of the Capital forms in 2015, the timing of the data collection was
changed to allow for final, audited capital data to be collected. Prior to this, near-final data
was collected and, as such, the loans fund advances outstanding on 31st March may not
match the loans fund advances outstanding on 1st April.
The all Scotland value of loans fund advances outstanding at 31st March 2015 was £13.18
billion (of which £9.96 billion was General Fund and £3.22 billion was HRA). General Fund
loans fund advances outstanding increased by £26.1 million (0.3%) between 1st April 2014
and 31st March 2015. HRA loans fund advances outstanding rose by £195 million (6.5%)
between 1st April 2014 and 31st March 2015.
At 31st March 2015, the Scottish average General Fund loans fund advances outstanding
was equal to £1,862 per person (down 0.1% on 31st March 2014) and the average HRA
loans fund advances outstanding was equal to £10,138 per HRA dwelling (up 6.3% on
31st March 2014).
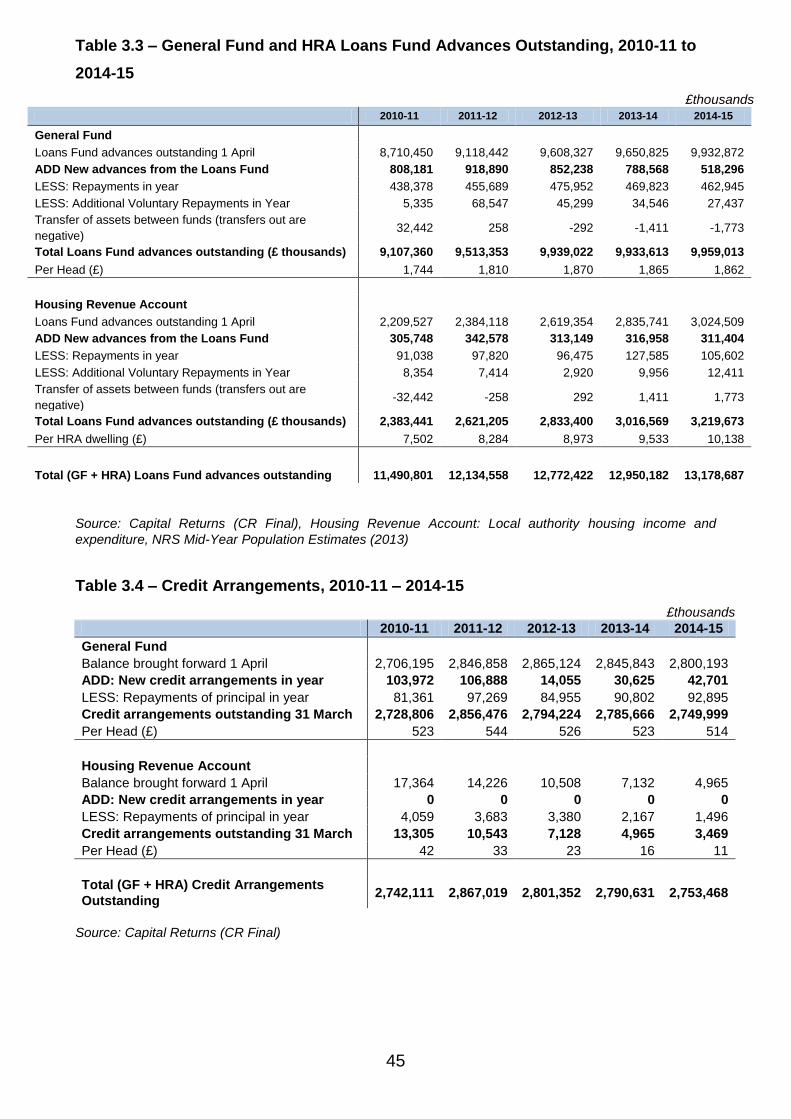
45
Table 3.3 – General Fund and HRA Loans Fund Advances Outstanding, 2010-11 to
2014-15
£thousands
2010-11 2011-12 2012-13 2013-14 2014-15
General Fund
Loans Fund advances outstanding 1 April 8,710,450 9,118,442 9,608,327 9,650,825 9,932,872
ADD New advances from the Loans Fund 808,181 918,890 852,238 788,568 518,296
LESS: Repayments in year 438,378 455,689 475,952 469,823 462,945
LESS: Additional Voluntary Repayments in Year 5,335 68,547 45,299 34,546 27,437
Transfer of assets between funds (transfers out are
negative) 32,442 258 -292 -1,411 -1,773
Total Loans Fund advances outstanding (£ thousands) 9,107,360 9,513,353 9,939,022 9,933,613 9,959,013
Per Head (£) 1,744 1,810 1,870 1,865 1,862
Housing Revenue Account
Loans Fund advances outstanding 1 April 2,209,527 2,384,118 2,619,354 2,835,741 3,024,509
ADD New advances from the Loans Fund 305,748 342,578 313,149 316,958 311,404
LESS: Repayments in year 91,038 97,820 96,475 127,585 105,602
LESS: Additional Voluntary Repayments in Year 8,354 7,414 2,920 9,956 12,411
Transfer of assets between funds (transfers out are
negative) -32,442 -258 292 1,411 1,773
Total Loans Fund advances outstanding (£ thousands) 2,383,441 2,621,205 2,833,400 3,016,569 3,219,673
Per HRA dwelling (£) 7,502 8,284 8,973 9,533 10,138
Total (GF + HRA) Loans Fund advances outstanding 11,490,801 12,134,558 12,772,422 12,950,182 13,178,687
Source: Capital Returns (CR Final), Housing Revenue Account: Local authority housing income and
expenditure, NRS Mid-Year Population Estimates (2013)
Table 3.4 – Credit Arrangements, 2010-11 – 2014-15
£thousands
2010-11 2011-12 2012-13 2013-14 2014-15
General Fund
Balance brought forward 1 April 2,706,195 2,846,858 2,865,124 2,845,843 2,800,193
ADD: New credit arrangements in year 103,972 106,888 14,055 30,625 42,701
LESS: Repayments of principal in year 81,361 97,269 84,955 90,802 92,895
Credit arrangements outstanding 31 March 2,728,806 2,856,476 2,794,224 2,785,666 2,749,999
Per Head (£) 523 544 526 523 514
Housing Revenue Account
Balance brought forward 1 April 17,364 14,226 10,508 7,132 4,965
ADD: New credit arrangements in year 0 0 0 0 0
LESS: Repayments of principal in year 4,059 3,683 3,380 2,167 1,496
Credit arrangements outstanding 31 March 13,305 10,543 7,128 4,965 3,469
Per Head (£) 42 33 23 16 11
Total (GF + HRA) Credit Arrangements
Outstanding 2,742,111 2,867,019 2,801,352 2,790,631 2,753,468
Source: Capital Returns (CR Final)
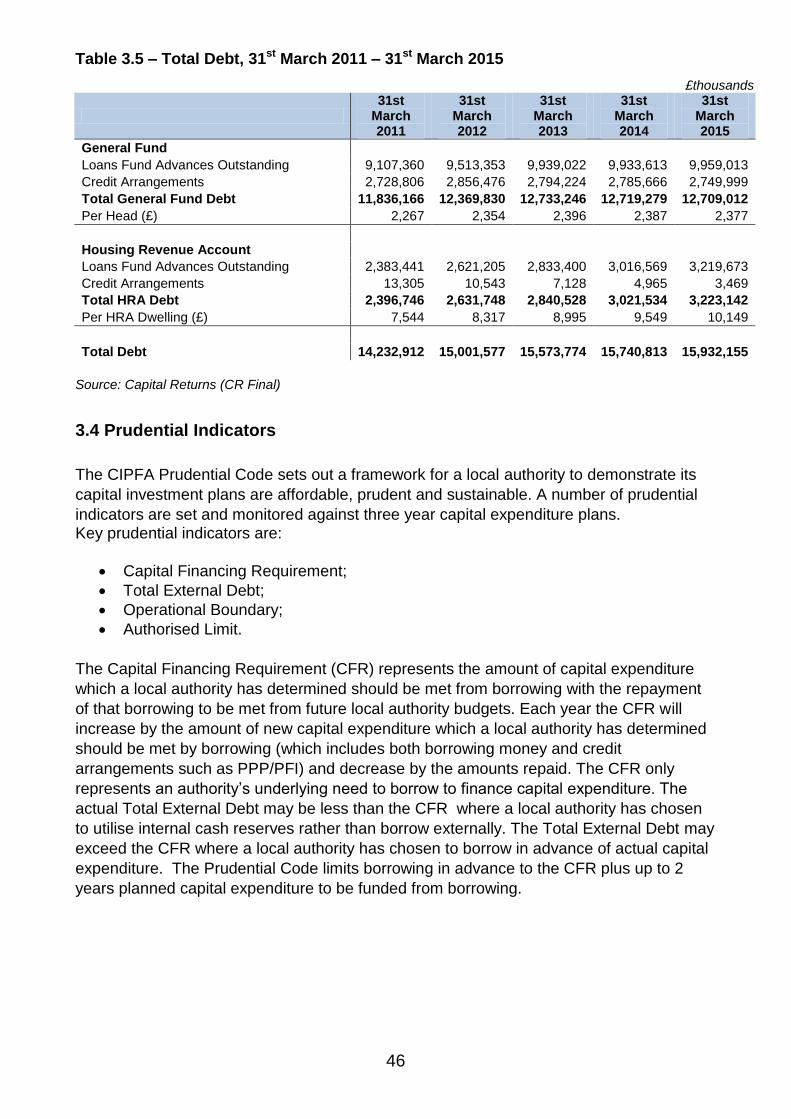
46
Table 3.5 – Total Debt, 31st March 2011 – 31st March 2015
£thousands
31st
March 2011
31st March 2012
31st March 2013
31st March 2014
31st March 2015
General Fund
Loans Fund Advances Outstanding 9,107,360 9,513,353 9,939,022 9,933,613 9,959,013
Credit Arrangements 2,728,806 2,856,476 2,794,224 2,785,666 2,749,999
Total General Fund Debt 11,836,166 12,369,830 12,733,246 12,719,279 12,709,012
Per Head (£) 2,267 2,354 2,396 2,387 2,377
Housing Revenue Account
Loans Fund Advances Outstanding 2,383,441 2,621,205 2,833,400 3,016,569 3,219,673
Credit Arrangements 13,305 10,543 7,128 4,965 3,469
Total HRA Debt 2,396,746 2,631,748 2,840,528 3,021,534 3,223,142
Per HRA Dwelling (£) 7,544 8,317 8,995 9,549 10,149
Total Debt 14,232,912 15,001,577 15,573,774 15,740,813 15,932,155
Source: Capital Returns (CR Final)
3.4 Prudential Indicators
The CIPFA Prudential Code sets out a framework for a local authority to demonstrate its
capital investment plans are affordable, prudent and sustainable. A number of prudential
indicators are set and monitored against three year capital expenditure plans. Key prudential indicators are:
Capital Financing Requirement;
Total External Debt;
Operational Boundary;
Authorised Limit.
The Capital Financing Requirement (CFR) represents the amount of capital expenditure
which a local authority has determined should be met from borrowing with the repayment
of that borrowing to be met from future local authority budgets. Each year the CFR will
increase by the amount of new capital expenditure which a local authority has determined
should be met by borrowing (which includes both borrowing money and credit
arrangements such as PPP/PFI) and decrease by the amounts repaid. The CFR only
represents an authority‟s underlying need to borrow to finance capital expenditure. The
actual Total External Debt may be less than the CFR where a local authority has chosen
to utilise internal cash reserves rather than borrow externally. The Total External Debt may
exceed the CFR where a local authority has chosen to borrow in advance of actual capital
expenditure. The Prudential Code limits borrowing in advance to the CFR plus up to 2
years planned capital expenditure to be funded from borrowing.
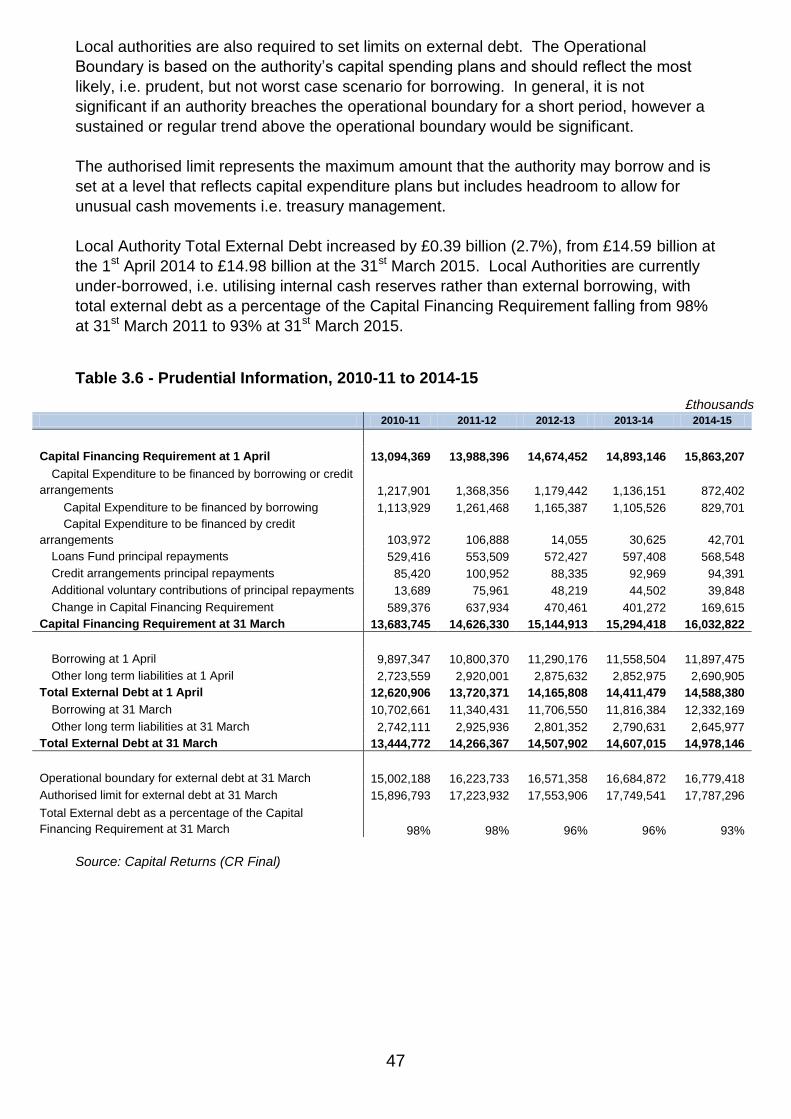
47
Local authorities are also required to set limits on external debt. The Operational
Boundary is based on the authority‟s capital spending plans and should reflect the most
likely, i.e. prudent, but not worst case scenario for borrowing. In general, it is not
significant if an authority breaches the operational boundary for a short period, however a
sustained or regular trend above the operational boundary would be significant.
The authorised limit represents the maximum amount that the authority may borrow and is
set at a level that reflects capital expenditure plans but includes headroom to allow for
unusual cash movements i.e. treasury management.
Local Authority Total External Debt increased by £0.39 billion (2.7%), from £14.59 billion at
the 1st April 2014 to £14.98 billion at the 31st March 2015. Local Authorities are currently
under-borrowed, i.e. utilising internal cash reserves rather than external borrowing, with
total external debt as a percentage of the Capital Financing Requirement falling from 98%
at 31st March 2011 to 93% at 31st March 2015.
Table 3.6 - Prudential Information, 2010-11 to 2014-15
£thousands 2010-11 2011-12 2012-13 2013-14 2014-15
Capital Financing Requirement at 1 April 13,094,369 13,988,396 14,674,452 14,893,146 15,863,207
Capital Expenditure to be financed by borrowing or credit
arrangements 1,217,901 1,368,356 1,179,442 1,136,151 872,402
Capital Expenditure to be financed by borrowing 1,113,929 1,261,468 1,165,387 1,105,526 829,701
Capital Expenditure to be financed by credit
arrangements 103,972 106,888 14,055 30,625 42,701
Loans Fund principal repayments 529,416 553,509 572,427 597,408 568,548
Credit arrangements principal repayments 85,420 100,952 88,335 92,969 94,391
Additional voluntary contributions of principal repayments 13,689 75,961 48,219 44,502 39,848
Change in Capital Financing Requirement 589,376 637,934 470,461 401,272 169,615
Capital Financing Requirement at 31 March 13,683,745 14,626,330 15,144,913 15,294,418 16,032,822
Borrowing at 1 April 9,897,347 10,800,370 11,290,176 11,558,504 11,897,475
Other long term liabilities at 1 April 2,723,559 2,920,001 2,875,632 2,852,975 2,690,905
Total External Debt at 1 April 12,620,906 13,720,371 14,165,808 14,411,479 14,588,380
Borrowing at 31 March 10,702,661 11,340,431 11,706,550 11,816,384 12,332,169
Other long term liabilities at 31 March 2,742,111 2,925,936 2,801,352 2,790,631 2,645,977
Total External Debt at 31 March 13,444,772 14,266,367 14,507,902 14,607,015 14,978,146
Operational boundary for external debt at 31 March 15,002,188 16,223,733 16,571,358 16,684,872 16,779,418
Authorised limit for external debt at 31 March 15,896,793 17,223,932 17,553,906 17,749,541 17,787,296
Total External debt as a percentage of the Capital
Financing Requirement at 31 March 98% 98% 96% 96% 93%
Source: Capital Returns (CR Final)
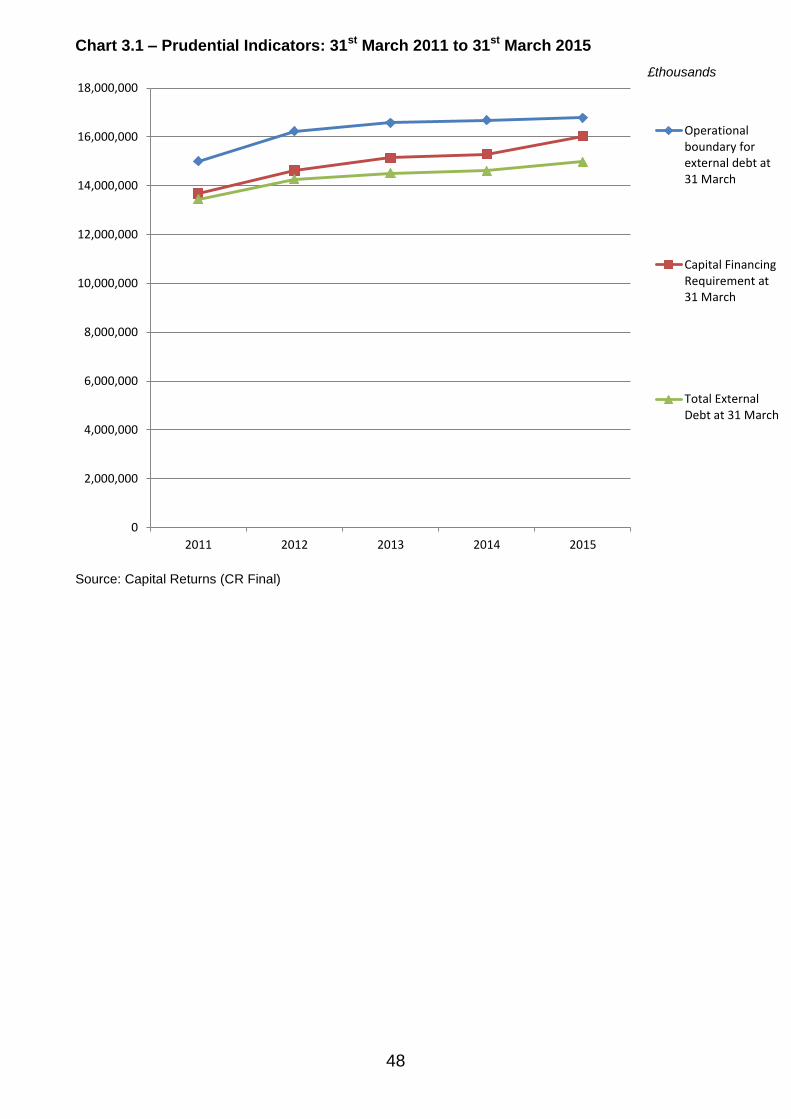
48
Chart 3.1 – Prudential Indicators: 31st March 2011 to 31st March 2015
£thousands
Source: Capital Returns (CR Final)
0
2,000,000
4,000,000
6,000,000
8,000,000
10,000,000
12,000,000
14,000,000
16,000,000
18,000,000
2011 2012 2013 2014 2015
Operationalboundary forexternal debt at31 March
Capital FinancingRequirement at31 March
Total ExternalDebt at 31 March
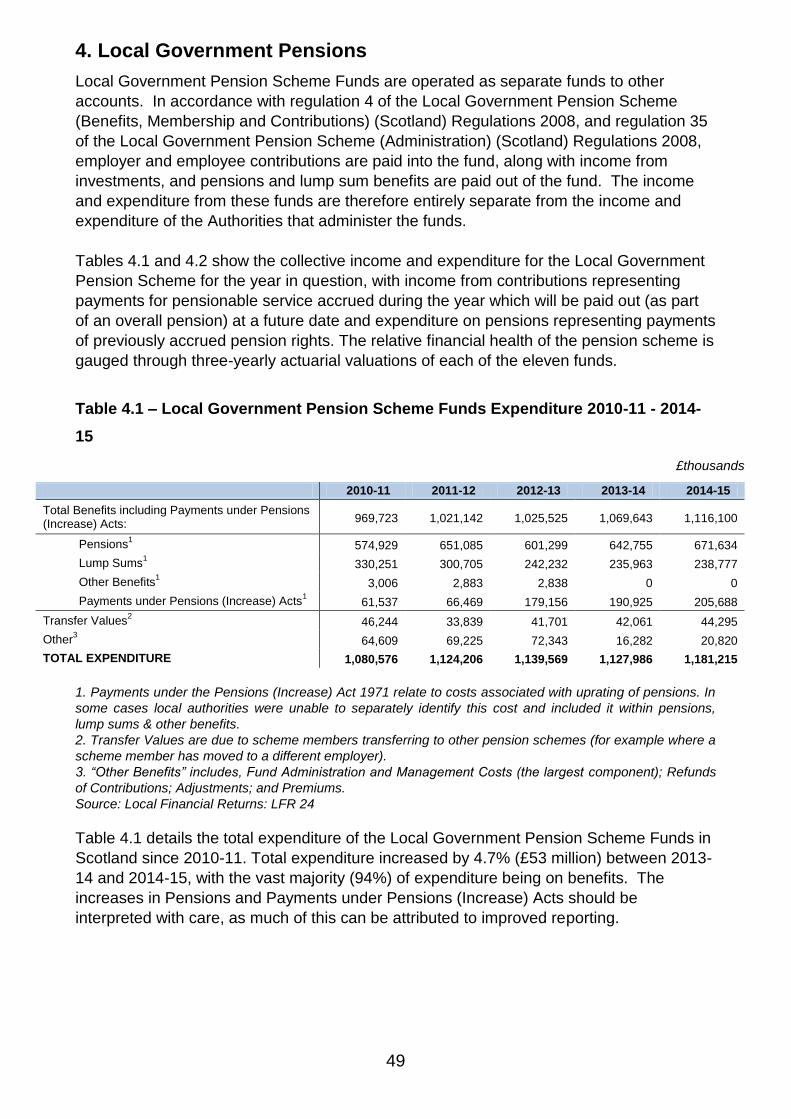
49
4. Local Government Pensions
Local Government Pension Scheme Funds are operated as separate funds to other
accounts. In accordance with regulation 4 of the Local Government Pension Scheme
(Benefits, Membership and Contributions) (Scotland) Regulations 2008, and regulation 35
of the Local Government Pension Scheme (Administration) (Scotland) Regulations 2008,
employer and employee contributions are paid into the fund, along with income from
investments, and pensions and lump sum benefits are paid out of the fund. The income
and expenditure from these funds are therefore entirely separate from the income and
expenditure of the Authorities that administer the funds.
Tables 4.1 and 4.2 show the collective income and expenditure for the Local Government
Pension Scheme for the year in question, with income from contributions representing
payments for pensionable service accrued during the year which will be paid out (as part
of an overall pension) at a future date and expenditure on pensions representing payments
of previously accrued pension rights. The relative financial health of the pension scheme is
gauged through three-yearly actuarial valuations of each of the eleven funds.
Table 4.1 – Local Government Pension Scheme Funds Expenditure 2010-11 - 2014-
15
£thousands
2010-11 2011-12 2012-13 2013-14 2014-15
Total Benefits including Payments under Pensions (Increase) Acts:
969,723 1,021,142 1,025,525 1,069,643 1,116,100
Pensions1 574,929 651,085 601,299 642,755 671,634
Lump Sums1 330,251 300,705 242,232 235,963 238,777
Other Benefits1 3,006 2,883 2,838 0 0
Payments under Pensions (Increase) Acts1 61,537 66,469 179,156 190,925 205,688
Transfer Values2 46,244 33,839 41,701 42,061 44,295
Other3 64,609 69,225 72,343 16,282 20,820
TOTAL EXPENDITURE 1,080,576 1,124,206 1,139,569 1,127,986 1,181,215
1. Payments under the Pensions (Increase) Act 1971 relate to costs associated with uprating of pensions. In
some cases local authorities were unable to separately identify this cost and included it within pensions,
lump sums & other benefits.
2. Transfer Values are due to scheme members transferring to other pension schemes (for example where a
scheme member has moved to a different employer).
3. “Other Benefits” includes, Fund Administration and Management Costs (the largest component); Refunds
of Contributions; Adjustments; and Premiums.
Source: Local Financial Returns: LFR 24
Table 4.1 details the total expenditure of the Local Government Pension Scheme Funds in
Scotland since 2010-11. Total expenditure increased by 4.7% (£53 million) between 2013-
14 and 2014-15, with the vast majority (94%) of expenditure being on benefits. The
increases in Pensions and Payments under Pensions (Increase) Acts should be
interpreted with care, as much of this can be attributed to improved reporting.
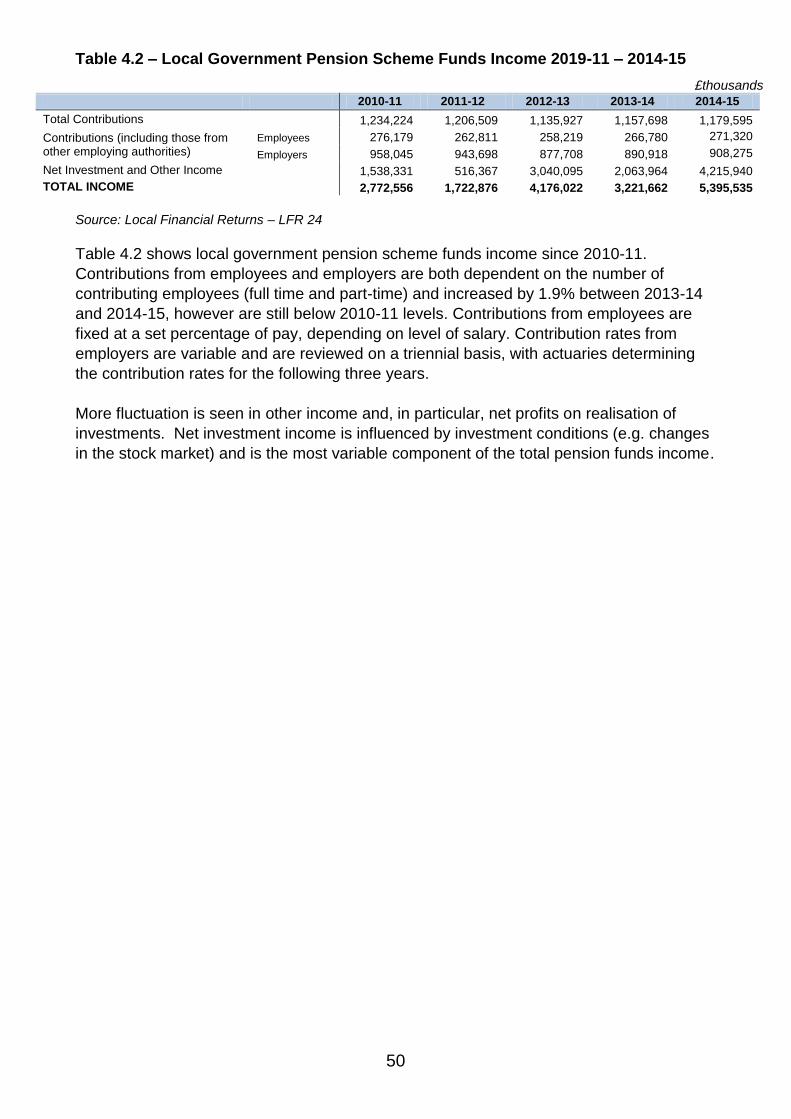
50
Table 4.2 – Local Government Pension Scheme Funds Income 2019-11 – 2014-15
£thousands
2010-11 2011-12 2012-13 2013-14 2014-15
Total Contributions 1,234,224 1,206,509 1,135,927 1,157,698 1,179,595
Contributions (including those from other employing authorities)
Employees 276,179 262,811 258,219 266,780 271,320
Employers 958,045 943,698 877,708 890,918 908,275
Net Investment and Other Income 1,538,331 516,367 3,040,095 2,063,964 4,215,940
TOTAL INCOME 2,772,556 1,722,876 4,176,022 3,221,662 5,395,535
Source: Local Financial Returns – LFR 24
Table 4.2 shows local government pension scheme funds income since 2010-11.
Contributions from employees and employers are both dependent on the number of
contributing employees (full time and part-time) and increased by 1.9% between 2013-14
and 2014-15, however are still below 2010-11 levels. Contributions from employees are
fixed at a set percentage of pay, depending on level of salary. Contribution rates from
employers are variable and are reviewed on a triennial basis, with actuaries determining
the contribution rates for the following three years.
More fluctuation is seen in other income and, in particular, net profits on realisation of
investments. Net investment income is influenced by investment conditions (e.g. changes
in the stock market) and is the most variable component of the total pension funds income.
51
5. Background to Scottish Local Government Financial Statistics
Scottish Local Government Financial Statistics is an annual publication that provides a
comprehensive overview of Scottish local authority financial activity. The publication
covers local authority income, revenue and capital expenditure, outstanding debt, local
taxation and local authority pensions. Further information on Scottish Local Government
Finance Statistics can be found at: http://www.scotland.gov.uk/Topics/Statistics/Browse/Local-Government-Finance.
Structure and Functions of Local Government
Local government is responsible for delivering a wide range of services including
education, social services, transport, housing, environmental services, cultural services,
planning and development and central services. Under the Concordat signed in November
2007, the Scottish Government and local government work jointly towards agreed
outcomes under a single national purpose.
Local government in Scotland is comprised of 32 local authorities as shown in Map 5.1. In
addition to these 32 local authorities, there are also Valuation Joint Boards, Regional
Transport Partnerships and the Forth and Tay Bridge Boards. Most of these Boards are
the collective responsibility of two or more Councils. See Table 5.1 for listings of Boards
and constituent Local Authorities.
Regional Transport Partnerships (RTPs) were established by the Transport (Scotland) Act
2005. Seven statutory regional transport partnerships were created across Scotland to
lead on regional transport strategy and delivery.
Valuation Joint Boards provide valuation services, primarily maintaining the Valuation Roll
for non-domestic properties, and the Council Tax Valuation List for domestic dwellings.
The Valuation Roll and Council Tax Valuation Lists are used as the basis for local taxation
billing liability (council tax and non-domestic rates).
Police and Fire Services
Police and Fire Boards were until 31st March 2013 responsible for providing police and fire
services for their constituent Councils. The Police and Fire Reform (Scotland) Act 2012
created Police Scotland and the Scottish Fire and Rescue Service, which replaced the
former Police and Fire Boards. These new bodies are classified as central government, so
are no longer included in figures on local government from 2013-14 onwards. Due to the
way that Police and Fire Boards were funded, it is not possible to exclude Police and Fire
income from a number of analyses. As such, figures from 2013-14 and later are not strictly
comparable with figures from earlier years.
Where possible, expenditure on Police and Fire have been presented separately so that
comparisons over time can be made. However, for many of the income sections, this has
not been possible and comparisons should be made with care.
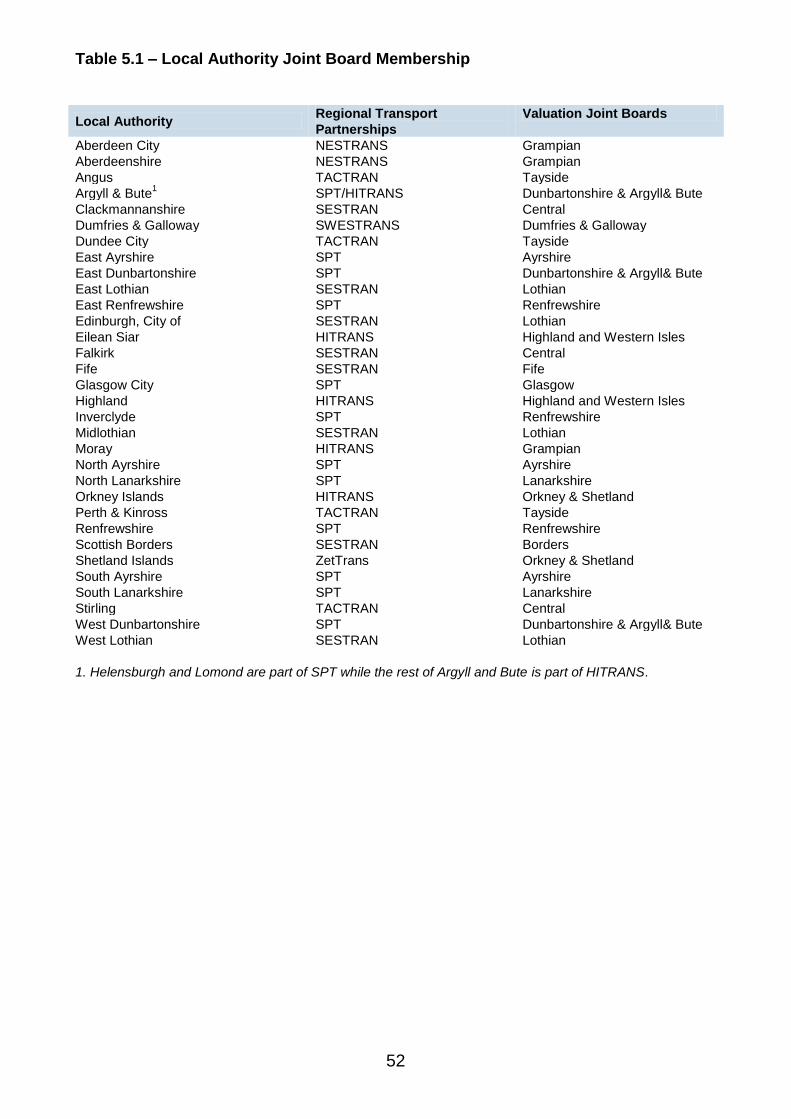
52
Table 5.1 – Local Authority Joint Board Membership
1. Helensburgh and Lomond are part of SPT while the rest of Argyll and Bute is part of HITRANS.
Local Authority Regional Transport
Partnerships
Valuation Joint Boards
Aberdeen City NESTRANS Grampian
Aberdeenshire NESTRANS Grampian
Angus TACTRAN Tayside
Argyll & Bute1 SPT/HITRANS Dunbartonshire & Argyll& Bute
Clackmannanshire SESTRAN Central
Dumfries & Galloway SWESTRANS Dumfries & Galloway
Dundee City TACTRAN Tayside
East Ayrshire SPT Ayrshire
East Dunbartonshire SPT Dunbartonshire & Argyll& Bute
East Lothian SESTRAN Lothian
East Renfrewshire SPT Renfrewshire
Edinburgh, City of SESTRAN Lothian
Eilean Siar HITRANS Highland and Western Isles
Falkirk SESTRAN Central
Fife SESTRAN Fife
Glasgow City SPT Glasgow
Highland HITRANS Highland and Western Isles
Inverclyde SPT Renfrewshire
Midlothian SESTRAN Lothian
Moray HITRANS Grampian
North Ayrshire SPT Ayrshire
North Lanarkshire SPT Lanarkshire
Orkney Islands HITRANS Orkney & Shetland
Perth & Kinross TACTRAN Tayside
Renfrewshire SPT Renfrewshire
Scottish Borders SESTRAN Borders
Shetland Islands ZetTrans Orkney & Shetland
South Ayrshire SPT Ayrshire
South Lanarkshire SPT Lanarkshire
Stirling TACTRAN Central
West Dunbartonshire SPT Dunbartonshire & Argyll& Bute
West Lothian SESTRAN Lothian
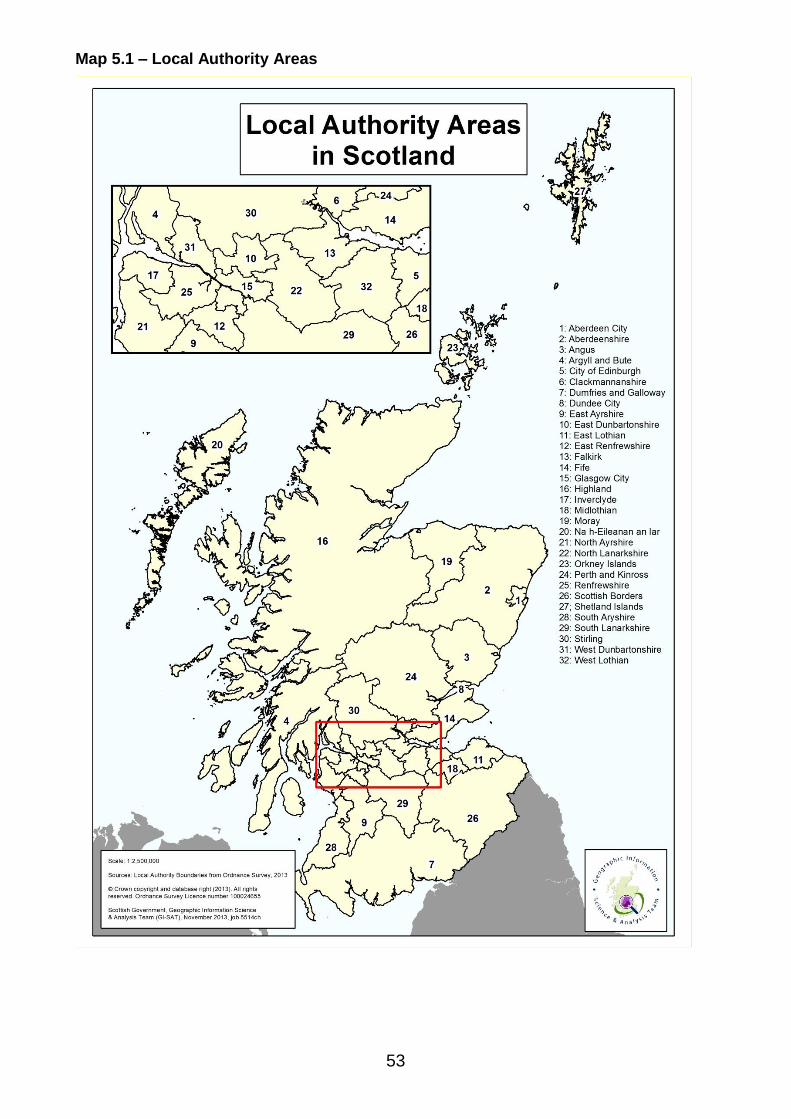
53
Map 5.1 – Local Authority Areas
54
6. Sources
Scottish Government
Scottish Government Local Government Finance Statistics Collections From Local
Authorities
Empty data collection forms, which illustrate what is collected can be viewed on the
Scottish Government website Local Government Finance – Data Supplier Area pages.
Local Financial Returns (LFR)
Final outturn expenditure statistics relating to each Local Authority, Joint Board and
Regional Transport Partnership are collected on an annual basis in this series of detailed
returns.
Council Tax Receipts Return (CTRR)
The CTRR return monitors councils‟ collection levels relating to council tax and community
charge. Information is collected relating to the amounts billed and received and the year to
which the payment refers.
Council Tax Base (CTAXBASE)
The CTAXBASE figures give the number of properties in each council tax band in each
local authority area, including those with exemptions and discounts.
Council Tax Assumptions (CTAS)
The CTAS form asks councils to set out the assumptions used in setting their Band D
council tax levels, and discounts provided for second homes and long term empty
properties.
Non Domestic Rates Income Returns (NDRI)
The Non-Domestic Rates Returns (NDRI returns) collect data on the amount of NDR
income each year. For this there is a cycle of 4 returns to collect estimates and then final
amounts of NDR income – The Provisional Contributable Amount, Mid-year Estimate,
Notified and Audited (Certified) Returns.
Capital Expenditure Returns (CR 1, 2, 3, 4 and Final)
The capital returns collect forecast and outturn income and expenditure statistics relating
to capital income and expenditure for each local authority and joint boards.
National Records of Scotland
Mid-Year Population Estimates
http://www.nrscotland.gov.uk/statistics-and-data/statistics/statistics-by-
theme/population/population-estimates/mid-year-population-estimates/mid-2014
Data sources and Suitability
A “Data Sources and Suitability” section of the local government finance statistics website
is under currently development and will be available soon via the above link. The section
will provide key information on Local Government Finance data sources including the use
made of the data, decisions they inform and the quality and reliability of data.
55
7. Glossary
Revenue expenditure covers the costs of maintaining local services and primarily consists
of employee costs and operating costs. The benefits of revenue expenditure are received
within one financial year. All revenue expenditure, except expenditure on local authority
housing, is accounted for through the General Fund.
Employee costs include salaries and wages, national insurance and superannuation
contributions, cash allowances paid to employees, redundancy and severance payments
and other employee costs.
Operating costs include property costs, supplies and services costs, transport (including
car allowances) and plant costs, payments to agencies and other bodies, and direct
administration costs (including training).
Support Service costs are those paid for services that support the provision of services to
the public, e.g. IT, Human Resources, Legal Services, Procurement Services and
Corporate Services.
Transfer payments are those made to individuals for which no goods or services are
received in return by the local authority.
Revenue Contributions to Capital (RCC) are the revenue contributions towards capital
expenditure on capital assets which were met directly from the service revenue within the
current year. RCC can also be referred to as capital financed from current revenue
(CFCR) in discussions of Capital accounts.
Adjustment for inter-account and inter-authority transfers is an adjustment made for the
contributions made by one authority to another, i.e. inter-authority transfers, and the
recharges, or income from other accounts within an authority, i.e. inter-account transfers.
The adjustment is equal to the total of inter-authority transfers and the total of inter-
account transfers.
Grants to third parties funded by General Capital Grant (GCG) come under both revenue
and capital expenditure. The General Capital Grant was introduced for the first time in
2008-09. It is a Scottish Government grant paid to the 32 local authorities. The grant may
be used to fund the capital expenditure of the local authority. With certain limitations, the
grant may also be used to fund third party capital expenditure (either through direct spend
or the provision of grant). Where the GCG is used to finance the capital expenditure of the
council, this expenditure is considered strictly as capital expenditure. Where the GCG is
used to fund third party capital projects the GCG is treated as revenue income and the
corresponding third party grant or direct payment is treated as revenue expenditure.
Gross revenue expenditure is the total expenditure on local authority services within a
financial year less inter-authority and inter-account transfers.
56
Net revenue expenditure is gross revenue expenditure, less other government grants,
customer and client receipts, grants to third parties funded by General Capital Grant, and
other grants, reimbursements and contributions. It is therefore the net revenue expenditure
that is to be financed from General Revenue Funding, non-domestic rates, council tax and
balances.
Common Good Fund income and expenditure is recorded in a separate set of accounts.
Some property held within a local authority‟s Common Good Fund can be sold, while some
must be maintained in trust for the community. The fund is used for projects that are for
the common good of all residents.
The Housing Revenue Account (HRA) records income and expenditure relating to local
authority housing stock. Whilst most other local authority services are funded through a
combination of non-domestic rates and council tax income plus Government grants, the
HRA is a ring-fenced account, and expenditure is funded by housing rents and
Government subsidies.
57
A National Statistics publication for Scotland
The United Kingdom Statistics Authority has designated these statistics as National Statistics, in accordance with the Statistics and Registration Service Act 2007 and signifying compliance with the Code of Practice for Official Statistics. Designation can be interpreted to mean that the statistics: meet identified user needs; are produced, managed and disseminated to high standards; and are explained well.
Correspondence and enquiries
For enquiries about this publication please contact: Euan Smith, Local Government Finance Statistics, Telephone: 0131 244 7033, e-mail: [email protected] For general enquiries about Scottish Government statistics please contact: Office of the Chief Statistician, Telephone: 0131 244 0442, e-mail: [email protected]
How to access background or source data
The data collected for this statistical bulletin:
☐ are available in more detail through Scottish Neighbourhood Statistics
☐ are available via an alternative route
☒ may be made available on request, subject to consideration of legal and ethical
factors. Please contact [email protected] for further information.
☐ cannot be made available by Scottish Government for further analysis as
Scottish Government is not the data controller.
Complaints and suggestions
If you are not satisfied with our service or have any comments or suggestions, please write to the Chief Statistician, 2W, St Andrews House, Edinburgh, EH1 3DG, Telephone: (0131) 244 0302, e-mail [email protected]. If you would like to be consulted about statistical collections or receive notification of publications, please register your interest at www.gov.scot/scotstat Details of forthcoming publications can be found at www.gov.scot/statistics ISBN: 978-1-78652-065-4 (web only)
Crown Copyright
You may use or re-use this information (not including logos) free of charge in any format or medium, under the terms of the Open Government Licence. See: www.nationalarchives.gov.uk/doc/open-government-licence/ APS Group Scotland, 21 Tennant Street, Edinburgh EH6 5NA
PPDAS64496 (02/16)