Embed Size (px)
Citation preview
0
School of Electrical &
Telecom Engineering
TELE4121
Thesis B Report
Kunxuan Bi
Z3249791
Supervisor: A/Prof. Vijay Sivaraman
Assessor: Dr Tim Moors
“Android interface for pollution
monitoring system”
1
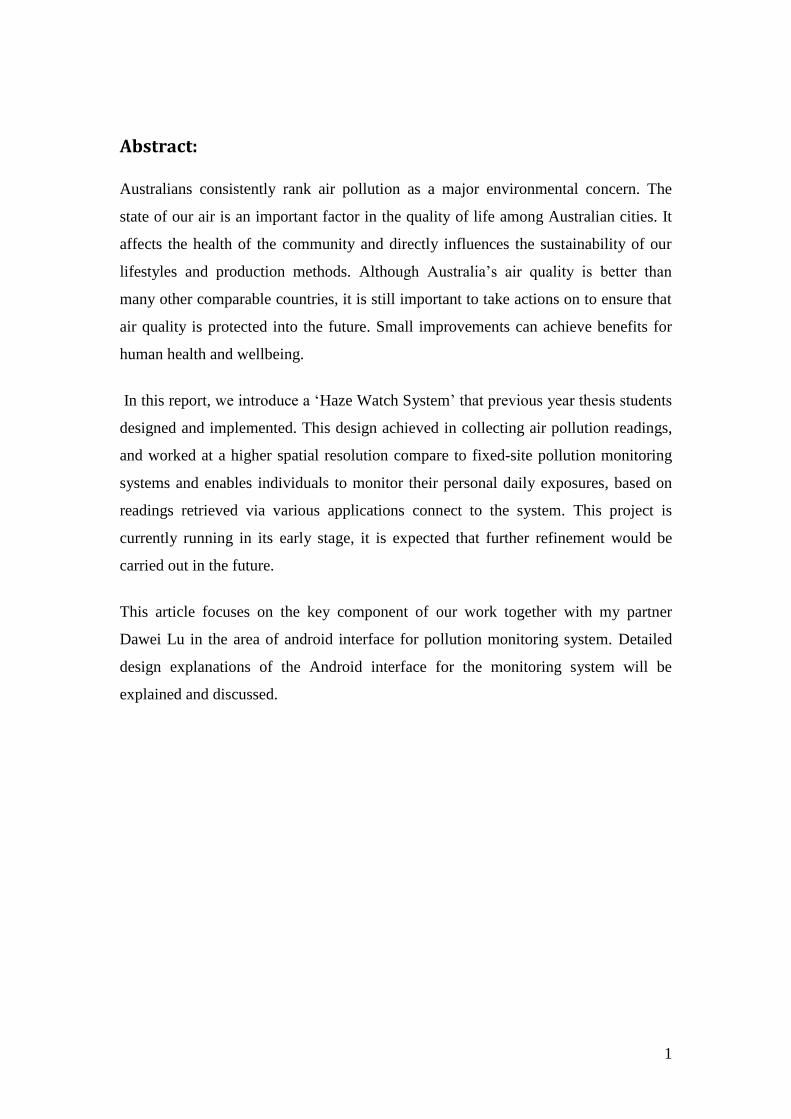
Abstract:
Australians consistently rank air pollution as a major environmental concern. The
state of our air is an important factor in the quality of life among Australian cities. It
affects the health of the community and directly influences the sustainability of our
lifestyles and production methods. Although Australia‘s air quality is better than
many other comparable countries, it is still important to take actions on to ensure that
air quality is protected into the future. Small improvements can achieve benefits for
human health and wellbeing.
In this report, we introduce a ‗Haze Watch System‘ that previous year thesis students
designed and implemented. This design achieved in collecting air pollution readings,
and worked at a higher spatial resolution compare to fixed-site pollution monitoring
systems and enables individuals to monitor their personal daily exposures, based on
readings retrieved via various applications connect to the system. This project is
currently running in its early stage, it is expected that further refinement would be
carried out in the future.
This article focuses on the key component of our work together with my partner
Dawei Lu in the area of android interface for pollution monitoring system. Detailed
design explanations of the Android interface for the monitoring system will be
explained and discussed.
2
3
4
Contents
Abstract: ......................................................................................................................... 1
Acknowledgements ........................................................................................................ 7
1. Introduction: ........................................................................................................... 8
1.1 Project objectives ................................................................................................. 9
2. Background .............................................................................................................. 10
2.1 Related work--- Android operating system ........................................................ 11
3. Haze watch system ................................................................................................... 13
3.1 Overview of the system ...................................................................................... 13
3.2 Mobile sensor unit .............................................................................................. 14
3.2.1 Message structure ........................................................................................ 15
3.2.2 Client applications ................................................................................. 16
3.2.3 Previous android application interface ........................................................ 17
4. New Android mobile application interface .............................................................. 19
4.1 Warming up message screen .............................................................................. 19
4.2 Current location Estimation ............................................................................... 20
4.3 Push buttons and contents .................................................................................. 22
4.4 Battery status of the ―Sensor board‖ .................................................................. 23
4.5 Real-time graphic plot ........................................................................................ 24
4.6 GPS interval control ........................................................................................... 26
4.6.1 Mode operation algorithm ........................................................................... 26
4.6.2 Battery saver mode ...................................................................................... 28
4.6.3 Normal mode ............................................................................................... 28
5
4.6.4 Alarm mode ................................................................................................. 29
4.7 Application background process ........................................................................ 30
5. Power consumption ................................................................................................. 32
6. Bluetooth auto-connection .................................................................................... 33
6.1 .................................................. Basic Algorithm behind Bluetooth auto-connection
.................................................................................................................................. 34
6.2 ...................................................................................................... Android Data storage
.................................................................................................................................. 35
6.3 ....................................................................................... Distinctive features of SQLite
.................................................................................................................................. 36
6.4 ................................................................ SQLite Implementation on Android system
.................................................................................................................................. 37
6.5 ........................................................................................................................Test results
.................................................................................................................................. 38
6.6 .............................................................................. Bluetooth auto-connection stability
.................................................................................................................................. 39
7. Program optimization ........................................................................................... 41
7.1 ......................................................................................... Program performance testing
.................................................................................................................................. 42
7.1.1 Program computational time test ........................................................... 42
7.1.2 Memory usages test................................................................................ 44
8. Java Language optimization ................................................................................. 45
8.1 .................................................... Use Object pool pattern to boost application speed
.................................................................................................................................. 45
8.2 ................ Use basic data type to replace chances of creating objects to save space
.................................................................................................................................. 46
6
8.3 If two classes are associated with each other in some functional way, try to make
one an inner class of the other. ................................................................................. 46
9. Android program optimization ............................................................................. 47
10. Calibrations in Haze watch system: .................................................................. 48
10.1 .................. Method 1: Experimentally doing calibration using pure gas cylinders
.................................................................................................................................. 49
10.2 ............................................................... Method 2: e2v Gas Sensor Evaluation Kits
.................................................................................................................................. 52
11. Future work ....................................................................................................... 55
Hardware .................................................................................................................. 55
Software ................................................................................................................... 55
Confidence level ....................................................................................................... 55
Privacy ...................................................................................................................... 55
12. Conclusion ........................................................................................................ 56
13. Reference sheet ................................................................................................. 57
14. Appendix A ....................................................................................................... 59
7
Acknowledgements
I would like to acknowledge the other members of the Haze watch project, Kunxuan
Bi, Hailian Zhang and Junjie Jiang for their support and hard work throughout this
project. I would also like to specially thank my supervisor, Associated Professor Vijay
Sivaraman who provided our group with excellent guidance, direction and support
throughout this project.
8
1. Introduction:
Air pollution is a major environmental risk to health and it is estimated to cause
approximately 2 million premature deaths worldwide per year. (World health
organization, 2008) Exposure to air pollutants is largely beyond the control of
individuals and requires action by public authorities at the national, regional and even
international levels.
The quality of the air we breathe directly affects human general health and well being.
The regular monitoring and maintenance of air quality is, therefore, extremely
important for our overall quality of life. A key environmental issue which Australia
currently faces is reversing the degradation of our outside and indoor air quality.
Aside from affecting human health, the presence of air pollutants in high levels can
also impact upon wildlife and vegetation.
The main cause of a build-up in air is the emission of exhaust fumes from motor
vehicles, industries. The quality of air is usually poorest, therefore, in highly
urbanised areas. In Australia this is particularly true of larger cities such as Sydney,
where fossil fuel emissions from cars contribute to 80 per cent of air pollution.
(Skwirk Schooling)
Current systems existing in monitoring air pollution levels are usually established or
owned by the government, the most typical formation of those systems are numbers of
fixed stations over an entire city. This structure of monitoring air qualities not only
exists in Australian but also worldwide. Such sparse monitoring cannot effectively
monitor some pollution regions such as heavy industrial pollution areas, tunnels, and
inner city. Therefore the estimated level of pollution in these regions will provide the
public an unreliable result.
To overcome such issues, the ―Haze Watch system‖ exploits this fact by taking
advantage of the built-in GPS hardware found in many such as Smart phones. So that
a real-time air quality results will be provide to the public.
9
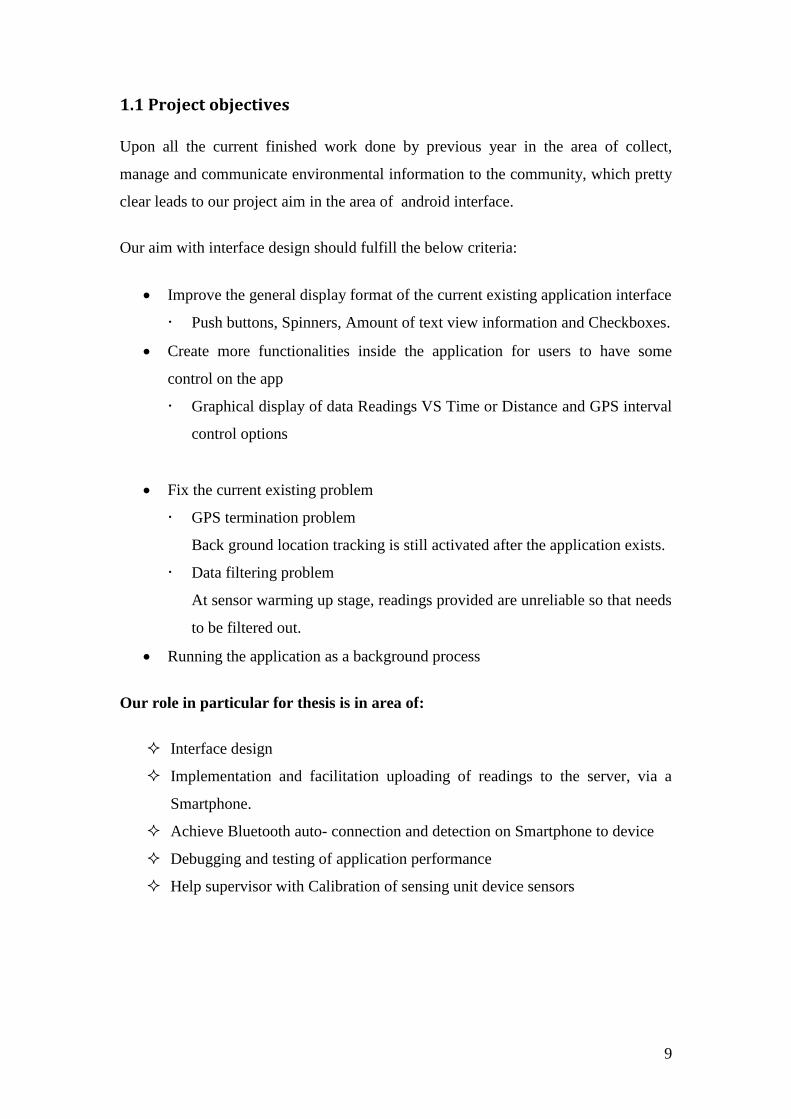
1.1 Project objectives
Upon all the current finished work done by previous year in the area of collect,
manage and communicate environmental information to the community, which pretty
clear leads to our project aim in the area of android interface.
Our aim with interface design should fulfill the below criteria:
Improve the general display format of the current existing application interface
Push buttons, Spinners, Amount of text view information and Checkboxes.
Create more functionalities inside the application for users to have some
control on the app
Graphical display of data Readings VS Time or Distance and GPS interval
control options
Fix the current existing problem
GPS termination problem
Back ground location tracking is still activated after the application exists.
Data filtering problem
At sensor warming up stage, readings provided are unreliable so that needs
to be filtered out.
Running the application as a background process
Our role in particular for thesis is in area of:
Interface design
Implementation and facilitation uploading of readings to the server, via a
Smartphone.
Achieve Bluetooth auto- connection and detection on Smartphone to device
Debugging and testing of application performance
Help supervisor with Calibration of sensing unit device sensors
10
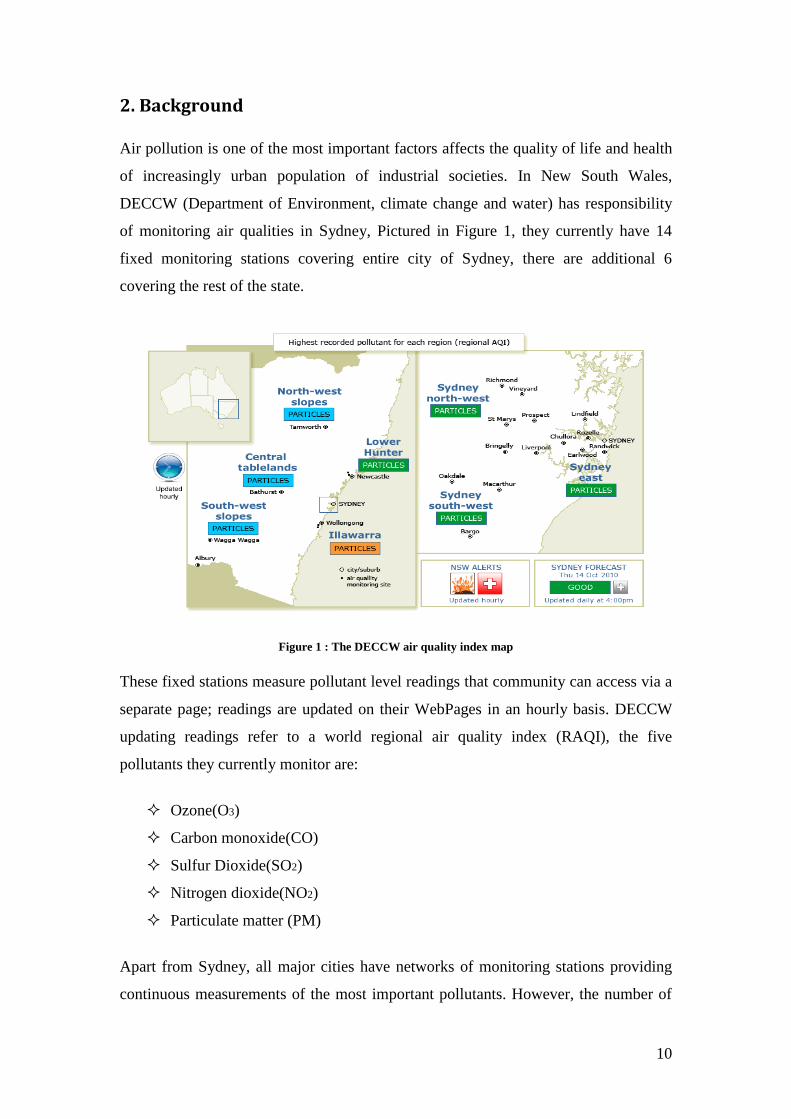
2. Background
Air pollution is one of the most important factors affects the quality of life and health
of increasingly urban population of industrial societies. In New South Wales,
DECCW (Department of Environment, climate change and water) has responsibility
of monitoring air qualities in Sydney, Pictured in Figure 1, they currently have 14
fixed monitoring stations covering entire city of Sydney, there are additional 6
covering the rest of the state.
Figure 1 : The DECCW air quality index map
These fixed stations measure pollutant level readings that community can access via a
separate page; readings are updated on their WebPages in an hourly basis. DECCW
updating readings refer to a world regional air quality index (RAQI), the five
pollutants they currently monitor are:
Ozone(O3)
Carbon monoxide(CO)
Sulfur Dioxide(SO2)
Nitrogen dioxide(NO2)
Particulate matter (PM)
Apart from Sydney, all major cities have networks of monitoring stations providing
continuous measurements of the most important pollutants. However, the number of
11
these stations is usually very small. Furthermore, currently data of the different
pollutants measured at different stations in city are aggregated to a single number, the
air quality index (AQI), that is published once a day on a website. In other words,
there is not enough data gathered to evaluate air quality in a given neighbourhood and
the publicly available information is even more deficient.
2.1 Related work--- Android operating system
Android is a software stack for mobile devices that includes an operating system,
middleware and key applications. Android's mobile operating system is based on the
Linux kernel, be known as the first truly open and integrity mobile system created for
the mobile terminal. Google and other members of the Open Handset Alliance which
includes HTC, T-mobile, Motorola, Samsung, LG and more than 30 other companies
collaborated on Android's development and release. The android is a total open
platform which been constructed with open source strategy. Manufacturer and
developer can feel free to design and produce the phone consistent with their own
needs. For now, the Android operating system is already became the world's best-
selling Smartphone platform. [Wikipedia]
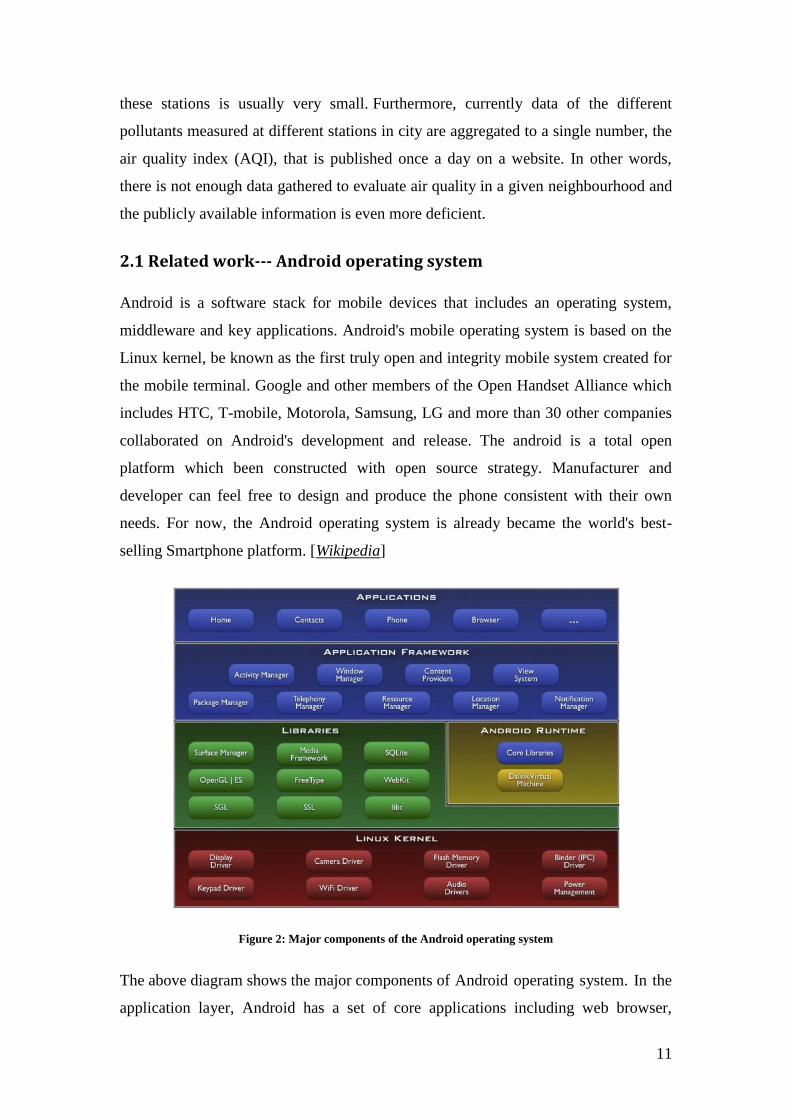
Figure 2: Major components of the Android operating system
The above diagram shows the major components of Android operating system. In the
application layer, Android has a set of core applications including web browser,

12
contacts, maps, Email, SMS program and others. All applications are written in Java
programming language. The Android SDK tools are used to compile the code along
with any data and resource files into an Android package with an .apk suffix. All the
code in a single .apk file is considered to be one application and is the file that
Android devices use to install the application.
Android includes a set of C/C++ libraries, these capabilities are exposed to developers
through the android application frame work. Some of the core libraries are shown in
Figure 2. Android also includes a set of core libraries that provide most of the
functionality available in the core libraries of the Java programming language. Every
Android application runs in its own process, with its own instance of the Dalvik
1virtual machine.
By contrast iOS 2with Android, iOS does not expose any low level Bluetooth APIs (a
requirement), whereas Android does. In most other areas, such as User Interface,
location tracking and Internet connectivity, Android interfaces are generally easier to
use as well. But more significantly, Android's openness where developers can pretty
much create and deploy anything, should make development easier, once developers
become acquainted with the system.
The few main features that mainly help our team with interface design are:
Application frame work
DVM- virtue machine help with optimization
Graphics powered by a custom 2D graphics library
Media support – image audio video support
SQLite - database
Bluetooth,3G,WI-FI and GPS
1 Dalvik is the process virtual machine (VM) in Google's Android operating system. Dalvik is thus an integral part
of Android, which is typically used on mobile devices such as mobile phones, tablet computers and notebooks.
Before execution, Android applications are converted into the compact Dalvik Executable (.dex) format, which is designed to be suitable for systems that are constrained in terms of memory and processor speed.
2 Apple's mobile operating system, originally developed for the iPhone, it has since been extended to support other Apple devices such as the iPod touch, iPad and Apple TV.

13
3. Haze watch system
The haze watch system project shares some common features, and builds on some
ideas base on other projects. Some of the existing projects are either too complicated
in functionality on each device or too general in away only collecting and visualizing
different types of data. The aim of making a haze watch system is trying to only focus
as much as possible in air pollution monitoring alone, and utilize as much as existing
hardware and communication software products nowadays for the convenience of
user needs.
3.1 Overview of the system
Figure 3: General overview of the Haze Watch System
Haze watch system consists of three essential components illustrated in Figure 3: a
mobile sensor unit, ad database server and some client applications, the design aim of
this new style measuring air pollutants system is:
Capable to collect different air pollutant levels
Manage and analyze pollutant data readings
Provide air pollution data on request via internet and various applications both
visually and as raw data format. (Nic Youdale, 102010)
The general plan of the system is, with the mobility (being attached to a vehicle and
otherwise) advantage of the sensor unit itself and the ability to collect pollutant
14
measurements, real-time pollutant measurements will be carried out. Pollutant
readings and their corresponding GPS coordinates and time stamps will be uploaded
via a 3G/Wi-Fi network to our server. In this case clients can use various applications
the system provided, to access and visualise those readings for various purposes. The
current two applications that our system can provide to users are an iPhone
application showing pollution exposure and a pollution map. (A. Chow. Haze Watch
system: Pollution Map, 2010)
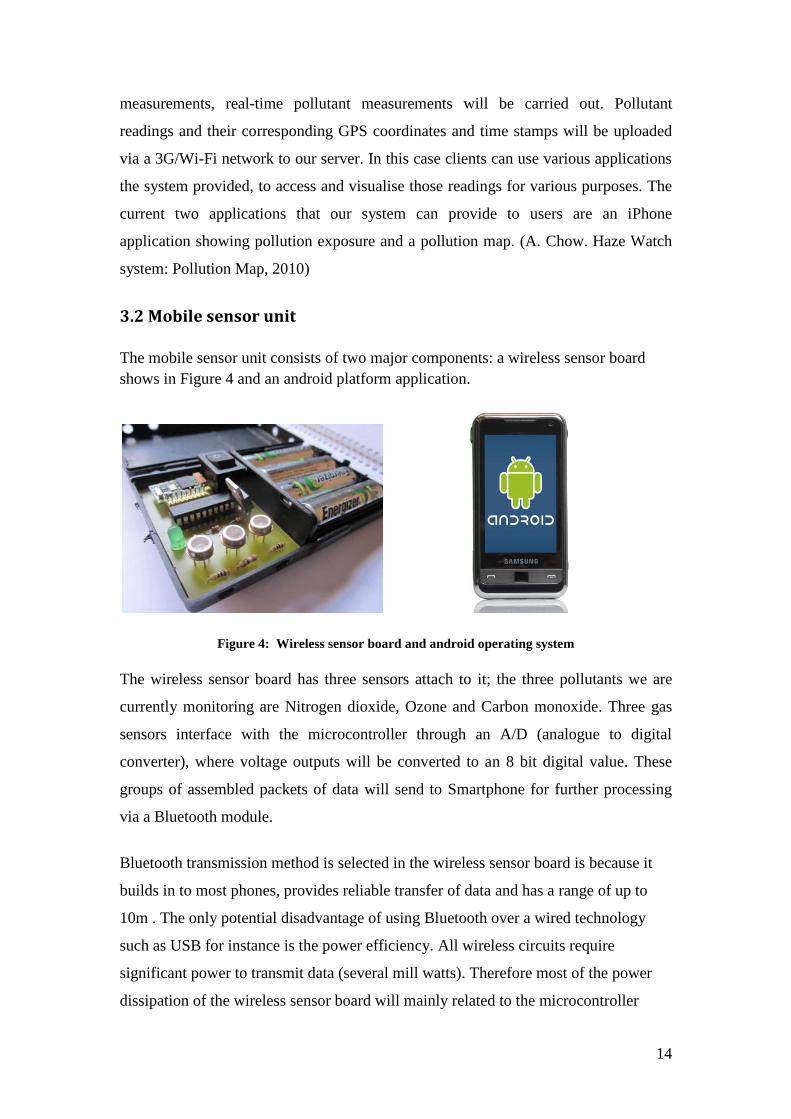
3.2 Mobile sensor unit
The mobile sensor unit consists of two major components: a wireless sensor board
shows in Figure 4 and an android platform application.
Figure 4: Wireless sensor board and android operating system
The wireless sensor board has three sensors attach to it; the three pollutants we are
currently monitoring are Nitrogen dioxide, Ozone and Carbon monoxide. Three gas
sensors interface with the microcontroller through an A/D (analogue to digital
converter), where voltage outputs will be converted to an 8 bit digital value. These
groups of assembled packets of data will send to Smartphone for further processing
via a Bluetooth module.
Bluetooth transmission method is selected in the wireless sensor board is because it
builds in to most phones, provides reliable transfer of data and has a range of up to
10m . The only potential disadvantage of using Bluetooth over a wired technology
such as USB for instance is the power efficiency. All wireless circuits require
significant power to transmit data (several mill watts). Therefore most of the power
dissipation of the wireless sensor board will mainly related to the microcontroller

15
computation and Bluetooth transmission. The data rates of currently Bluetooth
module ARF32 is up to 721kbps which is more than sufficient for the packets size of
the wireless sensor board.
The sensor wireless sensor board has been designed and built by James Carrapetta in
last year. The device is designed to be as simple and low cost as possible, therefore
which leads to utilising existing hardware present on Smartphone.
3.2.1 Message structure
For successfully communicate between the wireless sensor board and the Smartphone
a two side agreed message structure should be applied. The current message sent from
wireless sensor board contains following information:
Header indicates start if message (default 0xFFFFFFFF)
Version of the message (1 byte)
Device identification number(2 bytes)
Total number of sensors on the device board(1 byte)
Calibration equation coefficients(7 bytes)
Reference voltage for digital to analogue conversion method (2 bytes)
Number of measurement readings being sent(1 byte)
Sensor readings(2 bytes)
Checksum(Error checking)
Footer indicates end of one message(default 0xEEEEEEEE)
Figure 5: Format of Message (refer to last year thesis report)
16
As the device is built to be as simple and low cost as possible, and the mathematical
capabilities of the microcontroller PIC16F690 only handle 8-bit integer math in
hardware and has no floating – point math hardware. Therefore higher precision math
and algorithms will utilise the existing software inside the android platform as it has
high level programming language and build in libraries. (James Carrapetta, Oct 2010)
Currently the microcontroller assembles 10 readings for each sensor and sends them
all to the Smartphone in a period of 30 seconds per message packet. The Bluetooth
connection is established periodically to the Smartphone, and this stream of data will
be read and decode then displayed on the screen of the android application.
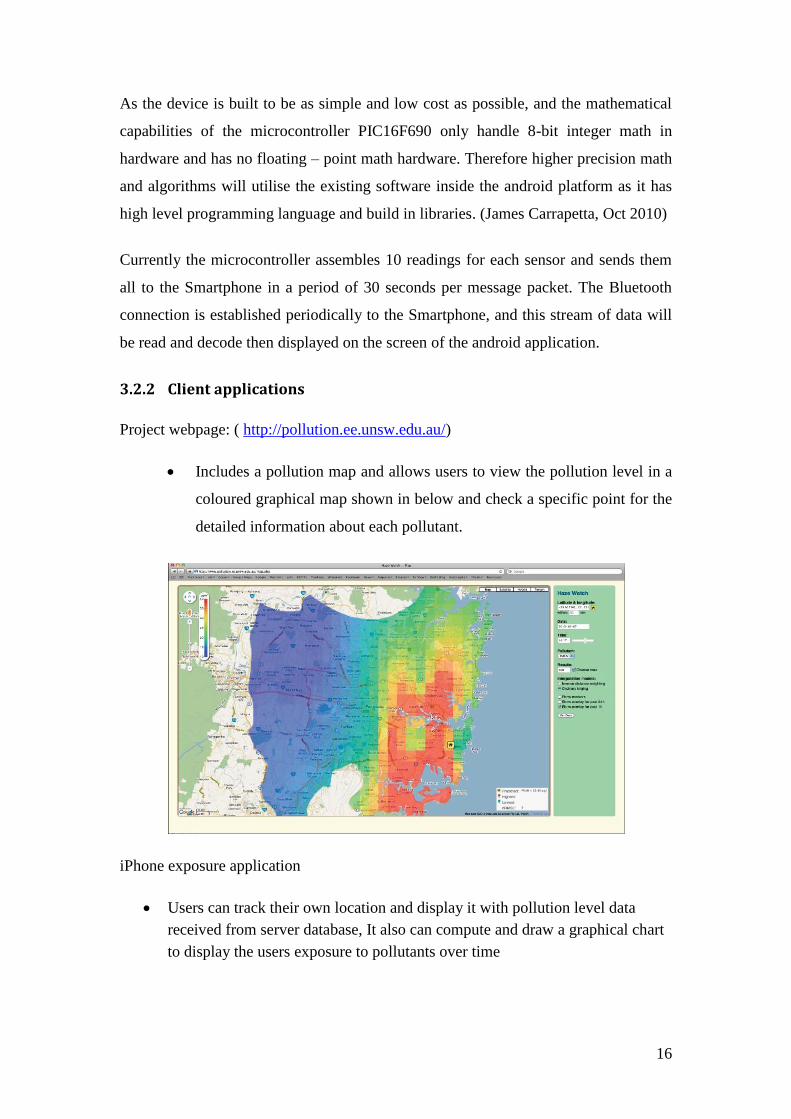
3.2.2 Client applications
Project webpage: ( http://pollution.ee.unsw.edu.au/)
Includes a pollution map and allows users to view the pollution level in a
coloured graphical map shown in below and check a specific point for the
detailed information about each pollutant.
iPhone exposure application
Users can track their own location and display it with pollution level data
received from server database, It also can compute and draw a graphical chart
to display the users exposure to pollutants over time
17
3.2.3 Previous android application interface
A key part of the overall Haze watch system is an internet connected Smartphone in
android platform. Smartphone always has build in GPS sensors as well as network
connection hardware, which eliminates difficulties of build one into mobile sensor
device.
The requirements for a Smartphone platform can use in the system are:
Bluetooth support and Internet connection
Large number of users for the Smartphone
Good application program interface and support
Build in GPS for location-based services
The role that a Smartphone plays in the system is a connection bridge between the
mobile sensor hardware and database server. The essential functions of the application
are:
Ability to pack sensor readings with their GPS coordinates and time stamp
Ability to transmit packages of readings to database server
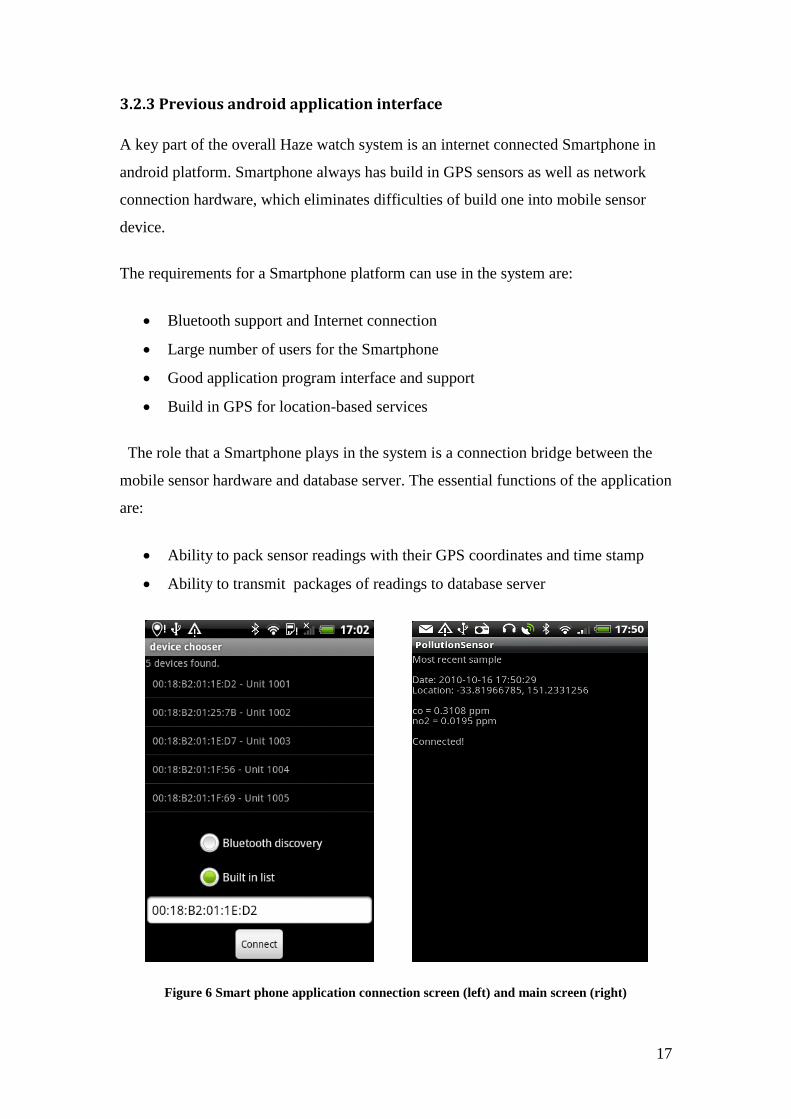
Figure 6 Smart phone application connection screen (left) and main screen (right)
18
Once you launched in to the previous application, a device chooser connection screen
will comes out in Figure 6 left. This screen allows the user to select a pollution
sensing device to connect to.
The device chooser screen has an area of listed devices in the top; those devices have
already built in into the application previously for testing purpose. The screen also
includes a field where user can scan for any Bluetooth enabled hardware nearby. The
text field at the bottom is for uses manually type in a MAC address of the Bluetooth
unit in order for the application to connect to, if the device discovery fails.
The Bluetooth hardware on the android phones allows multiple simultaneous
connections, which means the use of this application wont impact the user‘s ability to
use other Bluetooth hardware at the same time. (N.Youdale. Thesis report P41)
The main screen of the application is illustrated in the right of figure 6. It displays
status of connection, location, time and pollutant readings. All the readings are stored
in memory and later dumped to a file in CSV3 format. While each sample is being
collected, the application itself also packages those readings as XML formats and then
uploads to server.
To save battery on both the phone and the sensor hardware, the application does not
remain connected to the hardware all the time. Rather, it connects periodically to
receive the latest message, before disconnecting, sleeping for a short while, and then
reconnecting.
From now on the following chapters will go through all the new features of our
implemented interface for the air pollution monitoring system.
3 The comma-separated values (CSV) file format is a set of file formats used to store tabular data in which
numbers and text are stored in plain textual form that can be read in a text editor.

19
4. New Android mobile application interface
Figure 6: New interface overall view
4.1 Warming up message screen
The warming up screen is introduced here is due the performance of the sensors on
the sensor board, those sensors requires certain amount of time to warm up before
taking measurements which means readings taken at warming up period of sensors
makes no contribution to our pollution monitoring system.
Filtering those data process is performed inside the application program. Once the
application detects the obtained message illustrates the sensor is warming up. The
bellowed screen-shot in Figure7 will shows up to users.
It is not hard to recognise the
difference between our new created
interface shown in figure 6 and the
previous version. With all the past
text viewed information retained we
also include information fields (from
top to bottom in figure 6):
Connected Sensor board ID.
Address information. (Session
4.2)
Pollutant Bush buttons (Session
4.3) and corresponding readings.
Battery status of the sensor board.
(session 4.4)
A graphic plot of real time taken
pollutant data.(Session 4.5 )
User travel Trip time.
Number of samples being
recorded.
GPS interval. (Session 4.6)
20
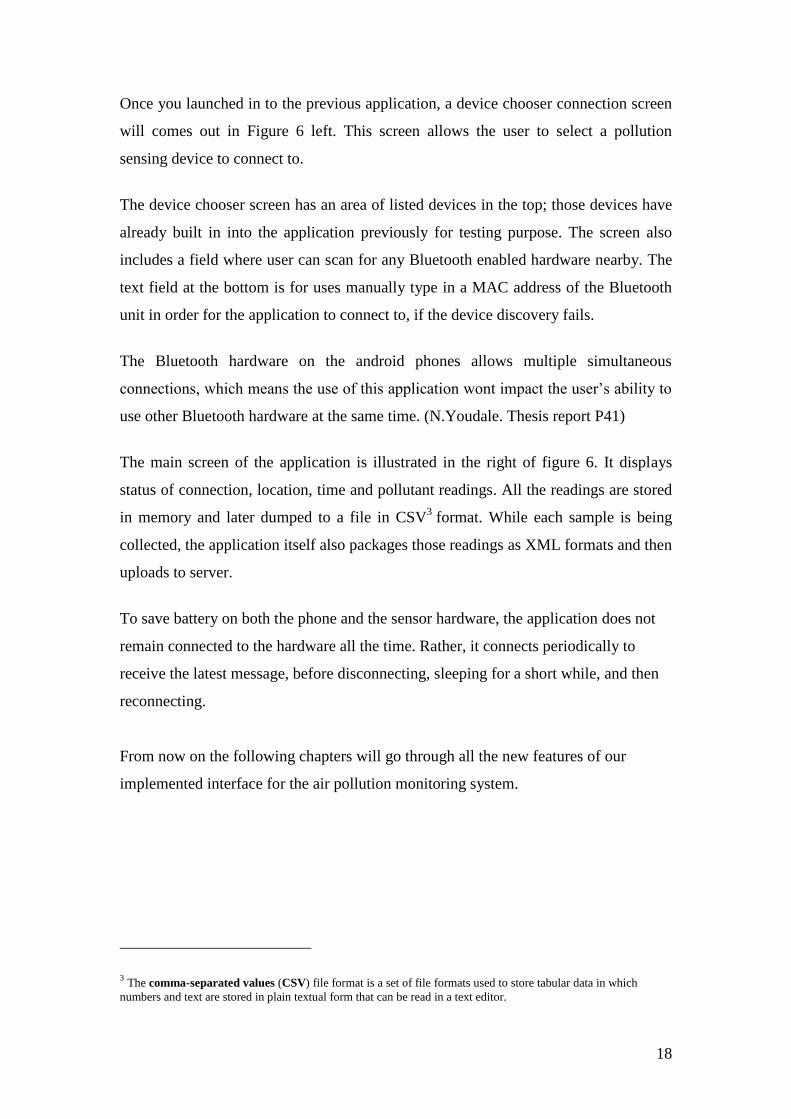
Figure 7: Warming up screen whilst sensors in hardware is warming up
The way we achieve warm up message detection is by modify the sensor readings
inside the overall message protocol (detailed protocol in session 3.2.1). simply
assigning all negative hex values in sensor values inside the protocol, during the
digestion of the application with the message, once the program detects all the sensor
readings a coincidently the same negative values, the warming up page will be
displayed.
4.2 Current location Estimation
Recall the previous interface only displayed the location information in logitude and
latitude, which is certainly accurate but not in hunman sense. We decide to include a
field in display which could show to user the street name ,suburb and other detailed
infomation about location. (See figure 6 for location display)
The way we obtaining positioning information is by using combined response of civil
GPS,Differential GPS,and assisted GPS service inside the Android platform. The
reason we using combined respose is due to it allows the strength of one to
compensate for the weakness of another to provide a more reliable and robust location
solution.
Civil GPS is the most basic positioning topology, but due to its relatively service
positioning accuracy is not very high and the error estimation can be up to 200m
21
maximum, these error will affect the location seriously, user may see a wrong location
information being displayed in the interface.
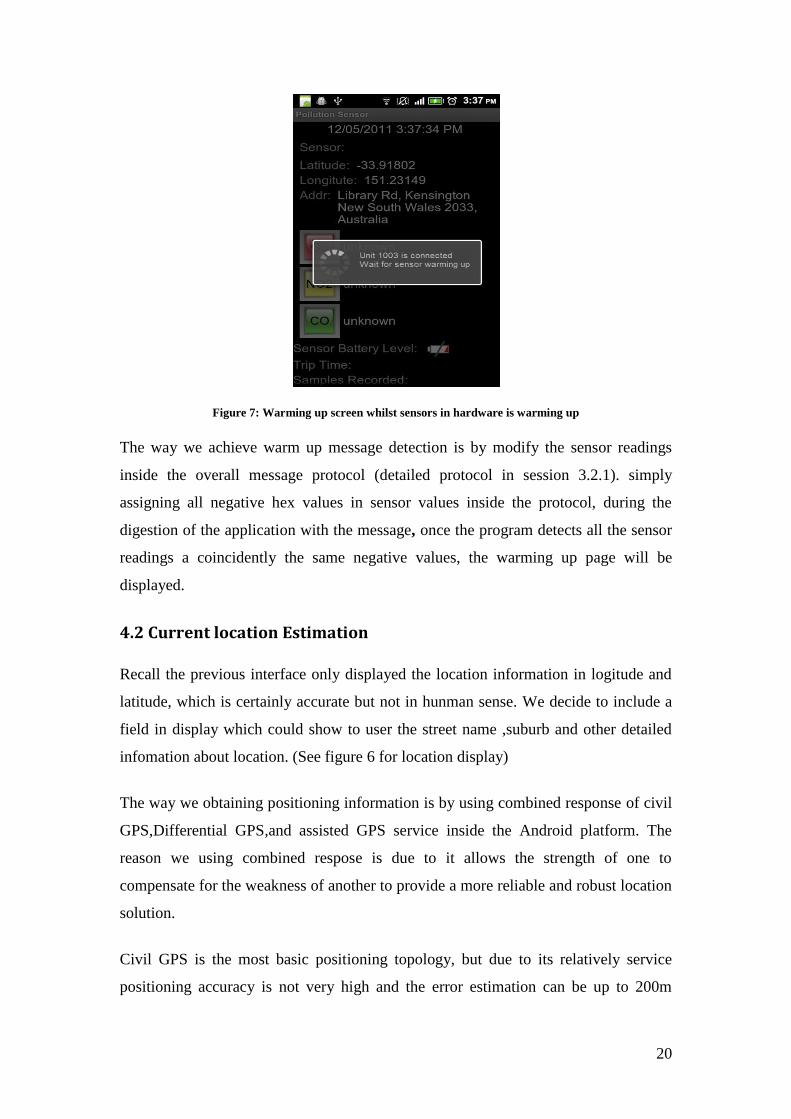
Figure 8 Differential GPS
With the help of a differential GPS which not only calculating positions depend on
satellites but also taking account the base station response (refer to Figure 8 the
reference receiver). Since we know the position of the satellite and the position of the
known receiver, we can take the difference between the real range and the pseudo
range to create a correction. We can then apply the pseudo range correction for each
satellite to the unknown or rover receiver to calculate a better position. So by using
the same techniques to apply differential corrections to the ranges we can hope for a
30 centimeter-3 meter solution. (Greg Pendleton, 16th July 2002)
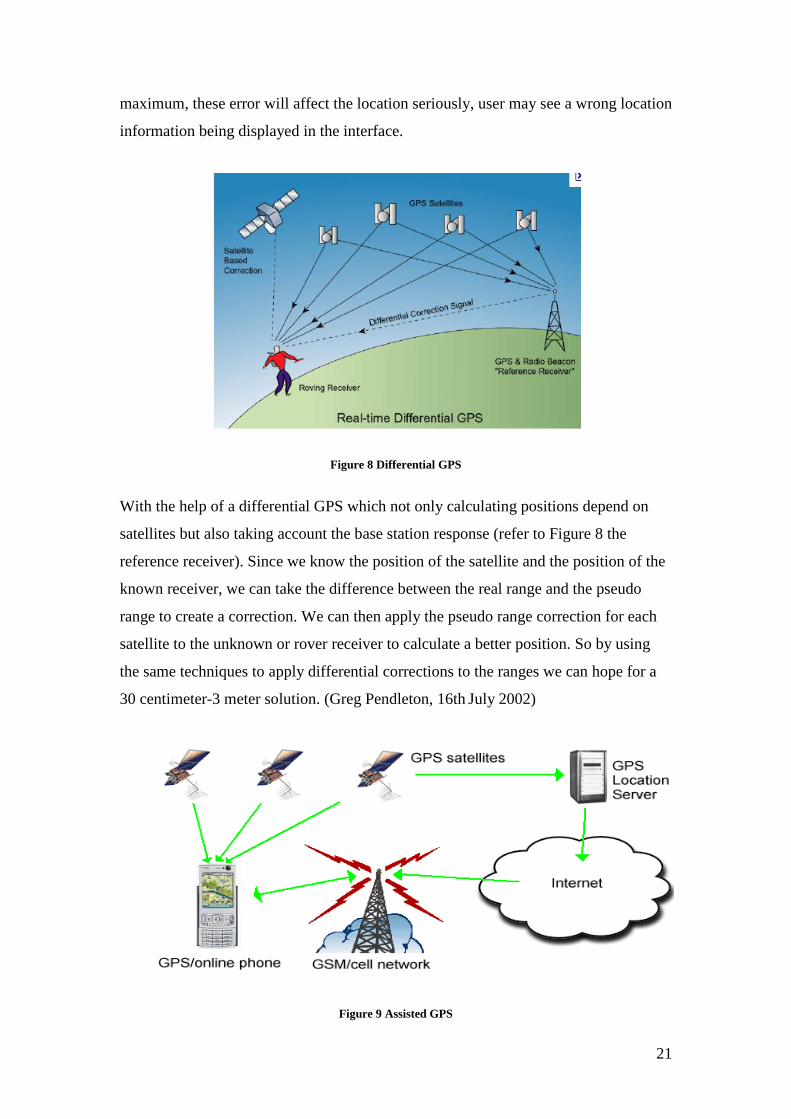
Figure 9 Assisted GPS
22
The main advantage of Assisted GPS (AGPS) for the application is that it will allow
the Smartphone‘s GPS to operate in weaker signal conditions and determine
positioning quicker than most standalone GPS receivers. AGPS also helps to save
battery power by handing off some computational duties to an assistance server.(Steve
Litchfield, 25th
June 2007 )
Once longitude and latitude being confirmed, the program itself will forward this two
data to Google map server, applying the inverse estimation using build in ―Geopoint‖
function that Google Map provides, and also under the refreshment of
―locationlistener" function updates new longitude and latitude values to Google map
server inside Android, we make an individual display system for the Location
function, So that users can observe a real time location change and also the server will
obtain the most reliable location information.
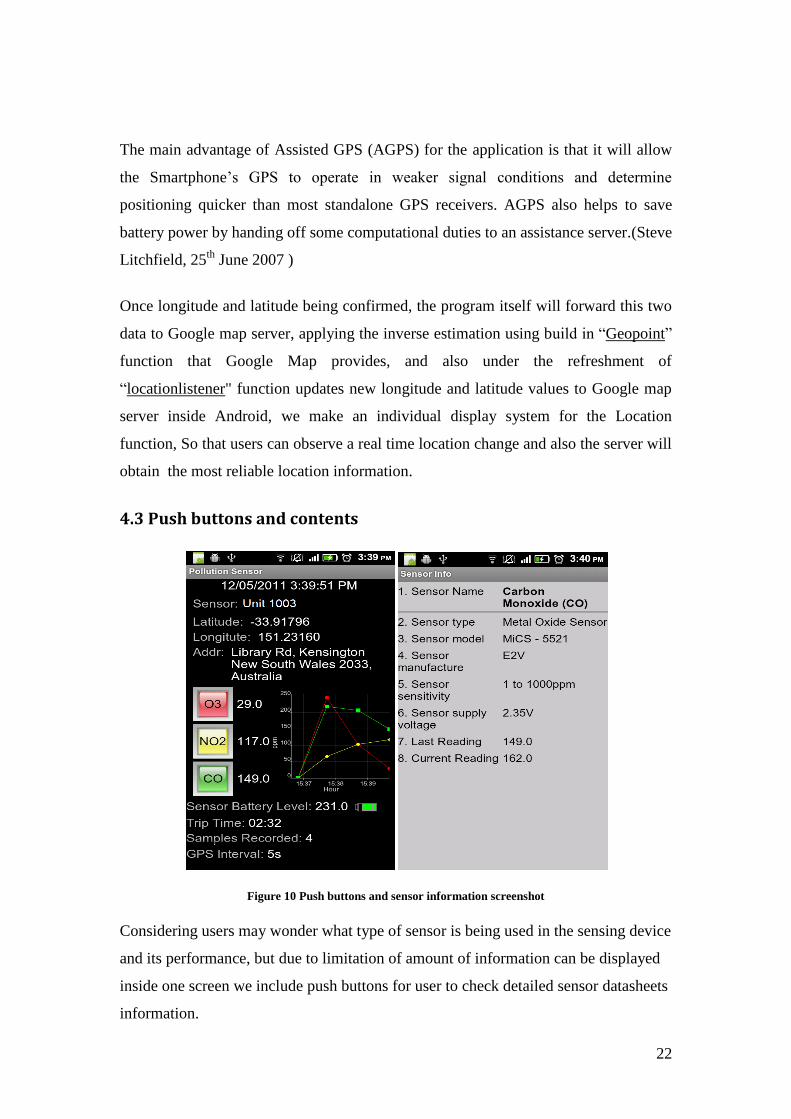
4.3 Push buttons and contents
Figure 10 Push buttons and sensor information screenshot
Considering users may wonder what type of sensor is being used in the sensing device
and its performance, but due to limitation of amount of information can be displayed
inside one screen we include push buttons for user to check detailed sensor datasheets
information.
23
Apart from what is being displayed currently, we will add the last calibration date and
duration consist in sensor information page. The reason calibration is a very important
data needs to be display is the low-cost sensors we are using each have a slightly
different performance characteristic, meaning that the conversion equation will vary
slightly in each sensor unit after a long time functioning.
4.4 Battery status of the “Sensor board”
The aim of display the battery status information of the sensor board hardware on the
Smartphone is for the convenience of user. In this way a total transparent of the
sensing device can achieve. Recall previously the battery status indication method
was only achieved on the sensor device itself by interface microcontroller with a
LED. A solid red LED flashing will warn user that batteries will run out.
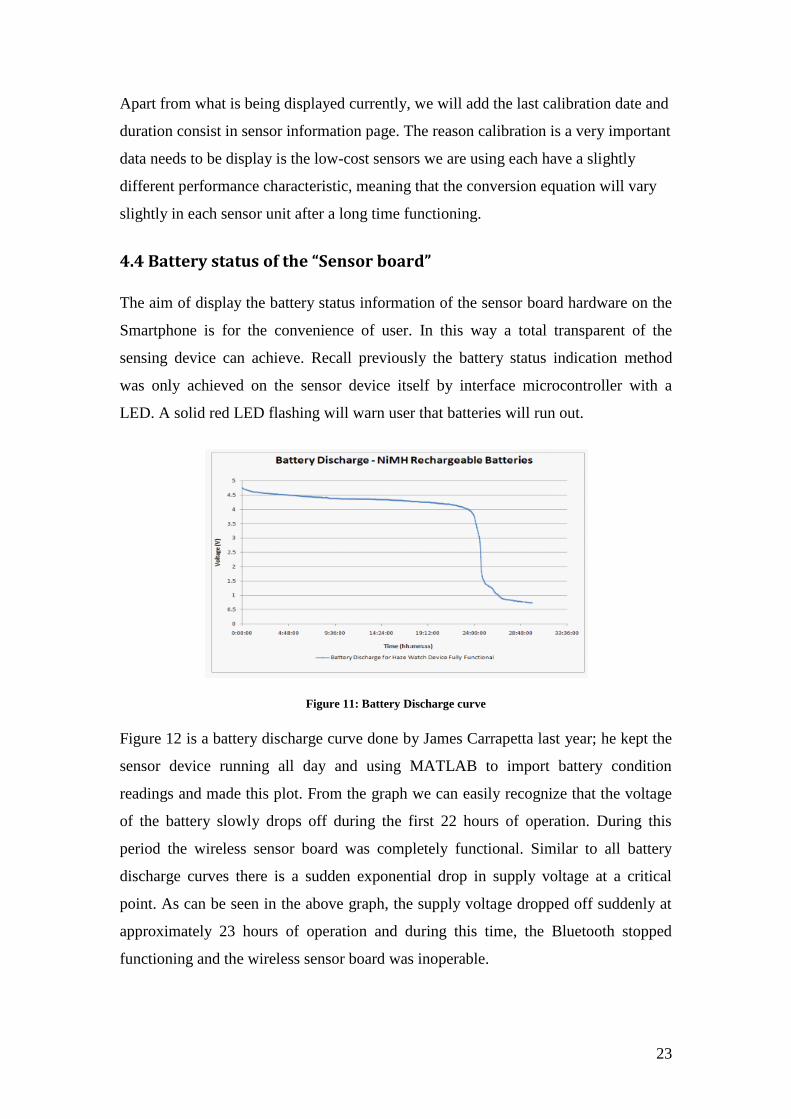
Figure 11: Battery Discharge curve
Figure 12 is a battery discharge curve done by James Carrapetta last year; he kept the
sensor device running all day and using MATLAB to import battery condition
readings and made this plot. From the graph we can easily recognize that the voltage
of the battery slowly drops off during the first 22 hours of operation. During this
period the wireless sensor board was completely functional. Similar to all battery
discharge curves there is a sudden exponential drop in supply voltage at a critical
point. As can be seen in the above graph, the supply voltage dropped off suddenly at
approximately 23 hours of operation and during this time, the Bluetooth stopped
functioning and the wireless sensor board was inoperable.
24
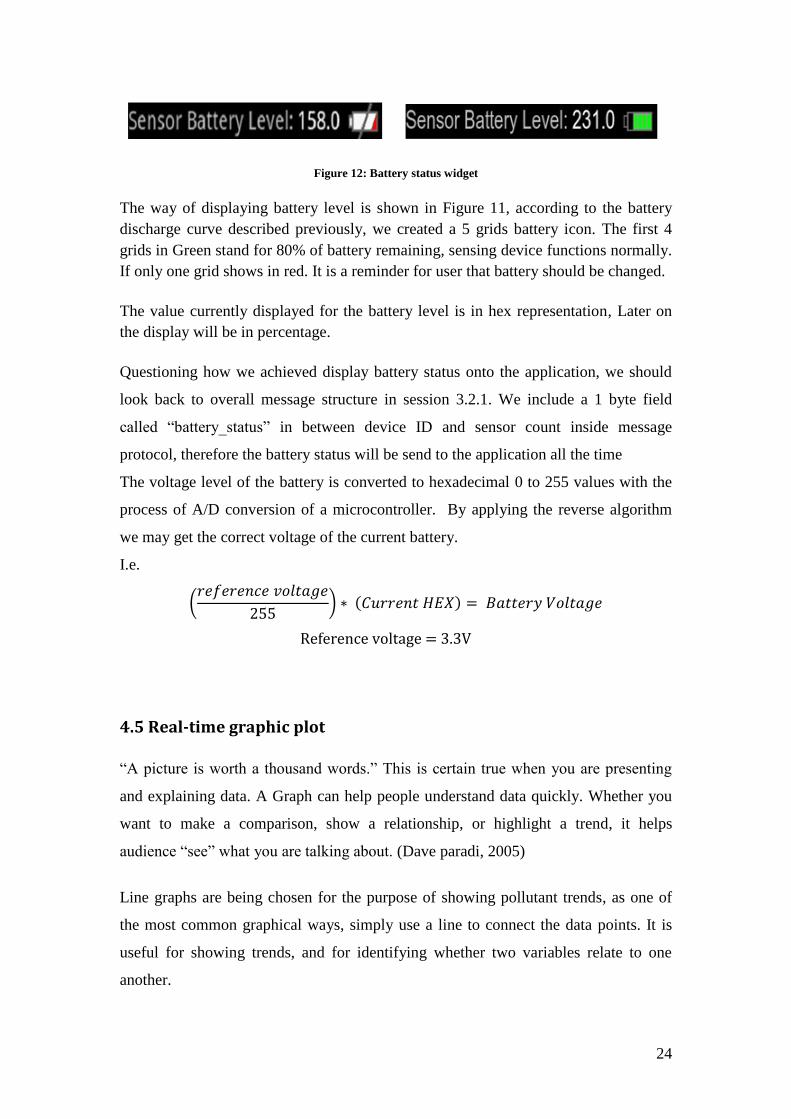
Figure 12: Battery status widget
The way of displaying battery level is shown in Figure 11, according to the battery
discharge curve described previously, we created a 5 grids battery icon. The first 4
grids in Green stand for 80% of battery remaining, sensing device functions normally.
If only one grid shows in red. It is a reminder for user that battery should be changed.
The value currently displayed for the battery level is in hex representation, Later on
the display will be in percentage.
Questioning how we achieved display battery status onto the application, we should
look back to overall message structure in session 3.2.1. We include a 1 byte field
called ―battery_status‖ in between device ID and sensor count inside message
protocol, therefore the battery status will be send to the application all the time
The voltage level of the battery is converted to hexadecimal 0 to 255 values with the
process of A/D conversion of a microcontroller. By applying the reverse algorithm
we may get the correct voltage of the current battery.
I.e.
Reference voltage = 3.3V
4.5 Real-time graphic plot
―A picture is worth a thousand words.‖ This is certain true when you are presenting
and explaining data. A Graph can help people understand data quickly. Whether you
want to make a comparison, show a relationship, or highlight a trend, it helps
audience ―see‖ what you are talking about. (Dave paradi, 2005)
Line graphs are being chosen for the purpose of showing pollutant trends, as one of
the most common graphical ways, simply use a line to connect the data points. It is
useful for showing trends, and for identifying whether two variables relate to one
another.
25
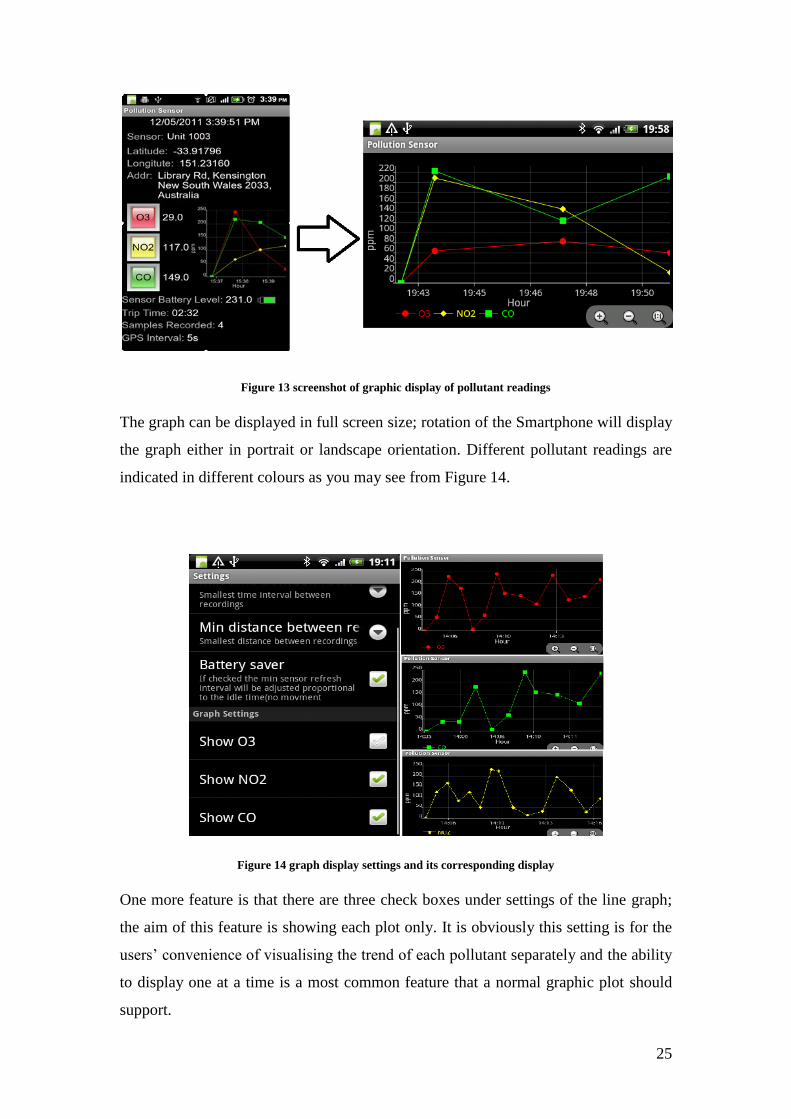
Figure 13 screenshot of graphic display of pollutant readings
The graph can be displayed in full screen size; rotation of the Smartphone will display
the graph either in portrait or landscape orientation. Different pollutant readings are
indicated in different colours as you may see from Figure 14.
Figure 14 graph display settings and its corresponding display
One more feature is that there are three check boxes under settings of the line graph;
the aim of this feature is showing each plot only. It is obviously this setting is for the
users‘ convenience of visualising the trend of each pollutant separately and the ability
to display one at a time is a most common feature that a normal graphic plot should
support.
26
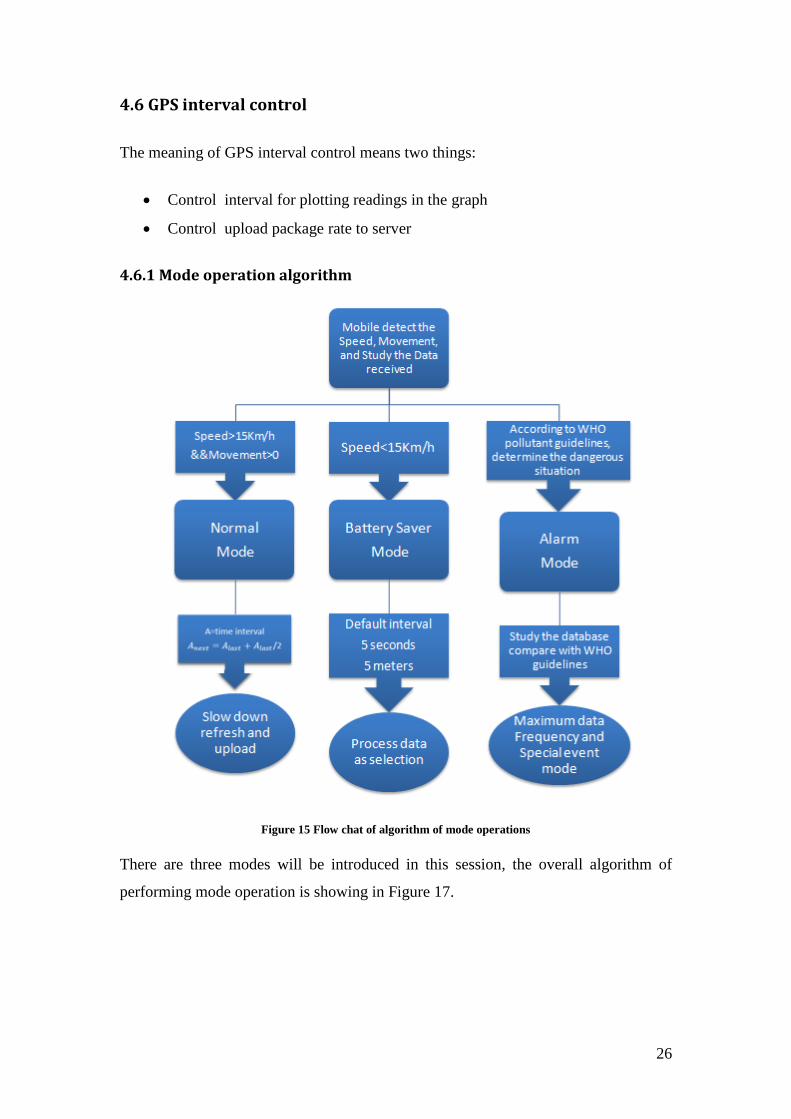
4.6 GPS interval control
The meaning of GPS interval control means two things:
Control interval for plotting readings in the graph
Control upload package rate to server
4.6.1 Mode operation algorithm
Figure 15 Flow chat of algorithm of mode operations
There are three modes will be introduced in this session, the overall algorithm of
performing mode operation is showing in Figure 17.
27
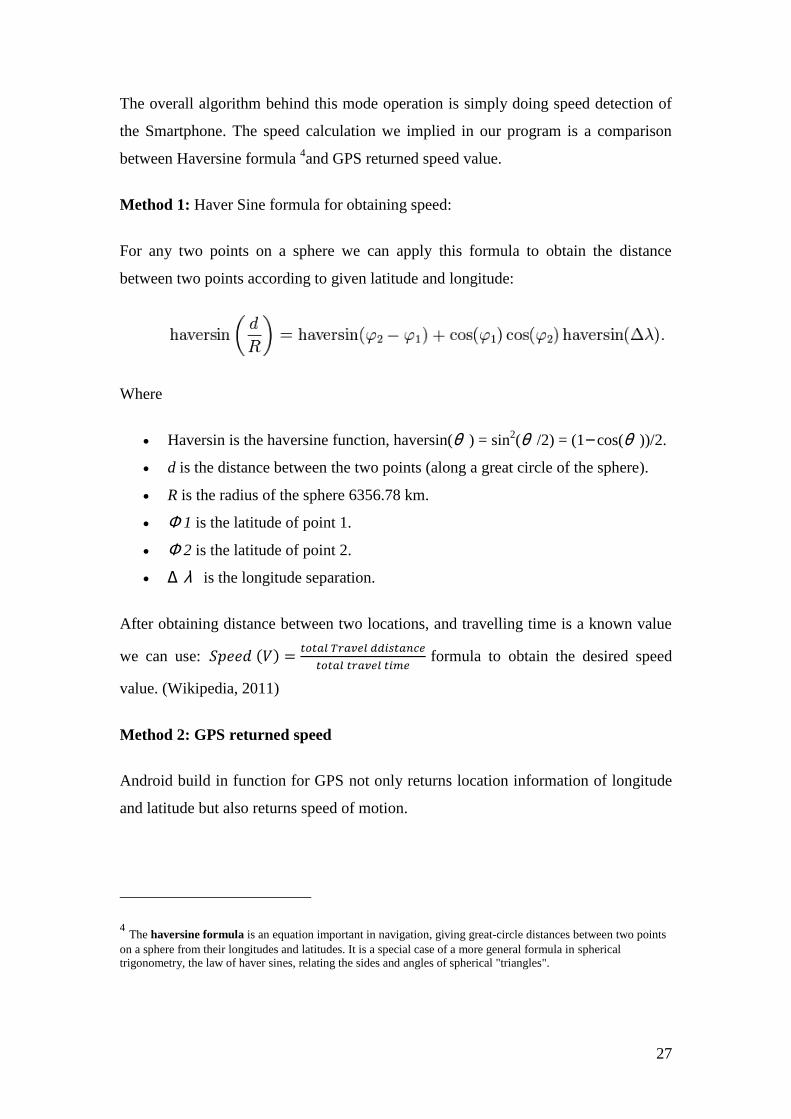
The overall algorithm behind this mode operation is simply doing speed detection of
the Smartphone. The speed calculation we implied in our program is a comparison
between Haversine formula 4and GPS returned speed value.
Method 1: Haver Sine formula for obtaining speed:
For any two points on a sphere we can apply this formula to obtain the distance
between two points according to given latitude and longitude:
Where
Haversin is the haversine function, haversin(θ ) = sin2(θ /2) = (1−cos(θ ))/2.
d is the distance between the two points (along a great circle of the sphere).
R is the radius of the sphere 6356.78 km.
Φ 1 is the latitude of point 1.
Φ 2 is the latitude of point 2.
Δ λ is the longitude separation.
After obtaining distance between two locations, and travelling time is a known value
we can use:
formula to obtain the desired speed
value. (Wikipedia, 2011)
Method 2: GPS returned speed
Android build in function for GPS not only returns location information of longitude
and latitude but also returns speed of motion.
4 The haversine formula is an equation important in navigation, giving great-circle distances between two points
on a sphere from their longitudes and latitudes. It is a special case of a more general formula in spherical trigonometry, the law of haver sines, relating the sides and angles of spherical "triangles".
28
The reason we doing double check in speed, is to verify our algorithm, while we
testing the two result of the speed in both method there is almost no difference.
4.6.2 Battery saver mode
If the speed detection results are less than 15km/h, the battery saver mode will
automatically activated.
In this mode, application still acquires data from sensing device as usual, and all data
will record inside android database, but instead of making plots too frequently, the
rate of showing readings on the graph will drop, if battery saver mode is operating for
a very long time, the next interval of showing one reading = current interval + current
interval /2, this interval changes will keep changing until speed detection jumps to
another operation mode.
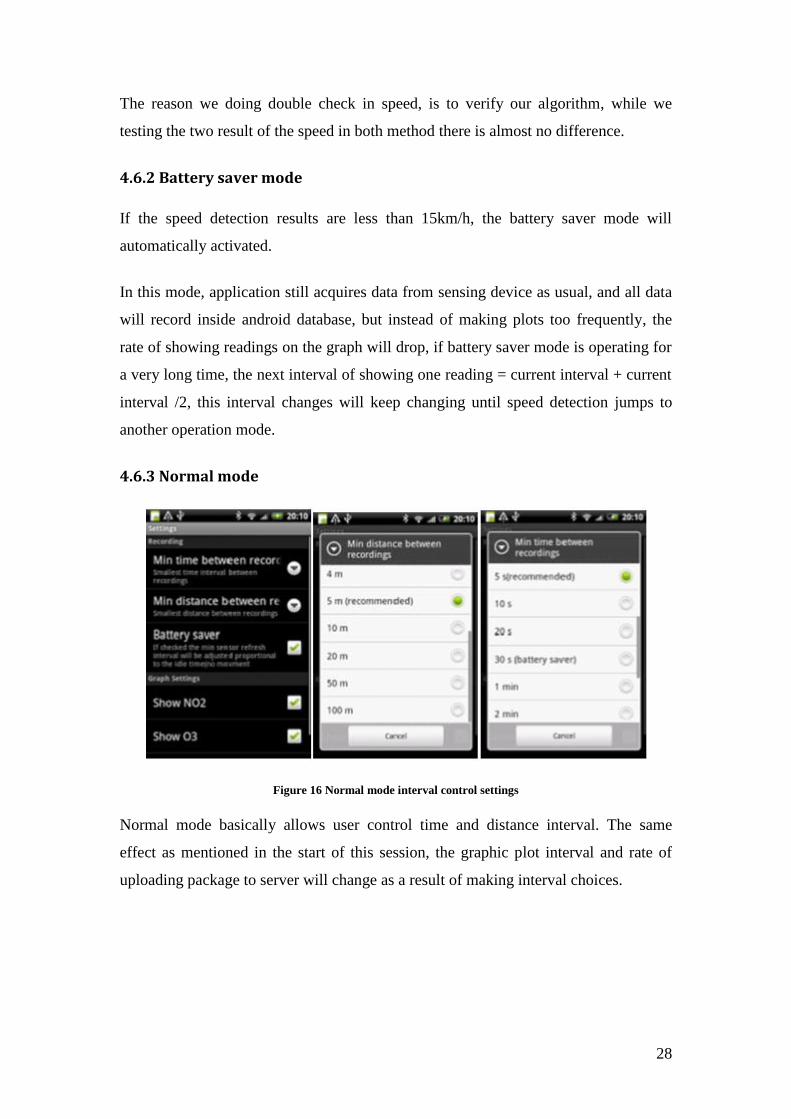
4.6.3 Normal mode
Figure 16 Normal mode interval control settings
Normal mode basically allows user control time and distance interval. The same
effect as mentioned in the start of this session, the graphic plot interval and rate of
uploading package to server will change as a result of making interval choices.
29
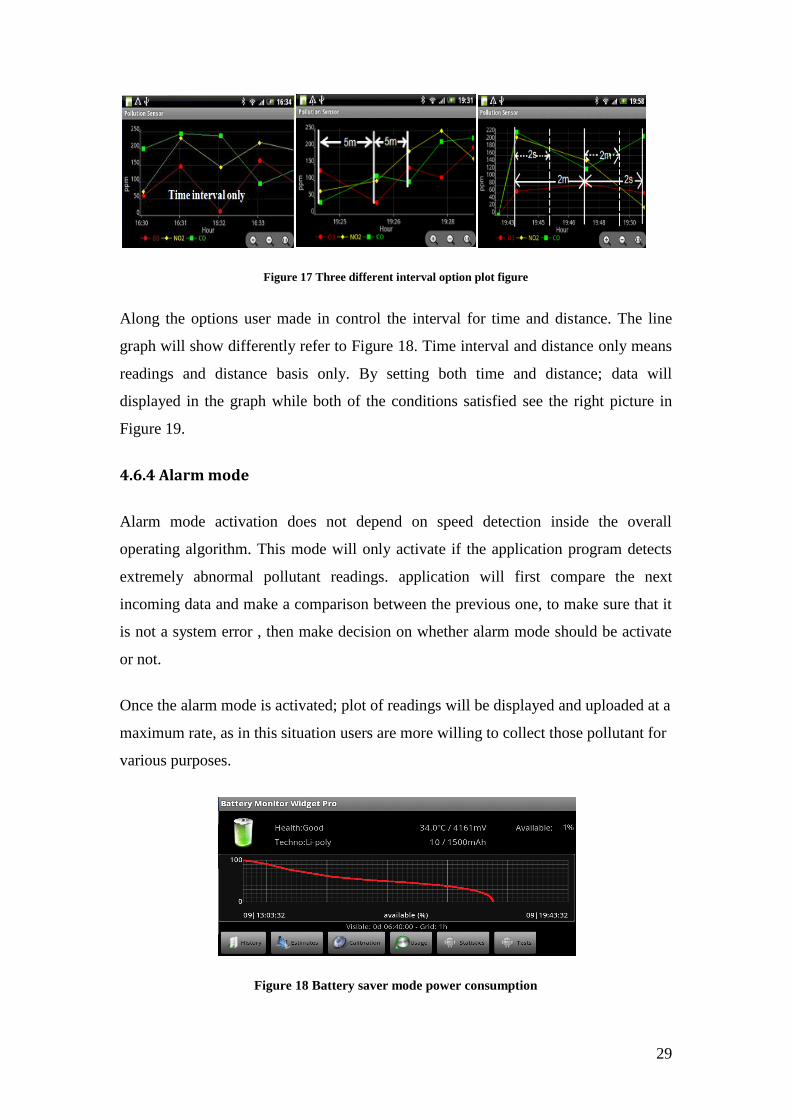
Figure 17 Three different interval option plot figure
Along the options user made in control the interval for time and distance. The line
graph will show differently refer to Figure 18. Time interval and distance only means
readings and distance basis only. By setting both time and distance; data will
displayed in the graph while both of the conditions satisfied see the right picture in
Figure 19.
4.6.4 Alarm mode
Alarm mode activation does not depend on speed detection inside the overall
operating algorithm. This mode will only activate if the application program detects
extremely abnormal pollutant readings. application will first compare the next
incoming data and make a comparison between the previous one, to make sure that it
is not a system error , then make decision on whether alarm mode should be activate
or not.
Once the alarm mode is activated; plot of readings will be displayed and uploaded at a
maximum rate, as in this situation users are more willing to collect those pollutant for
various purposes.
Figure 18 Battery saver mode power consumption
30
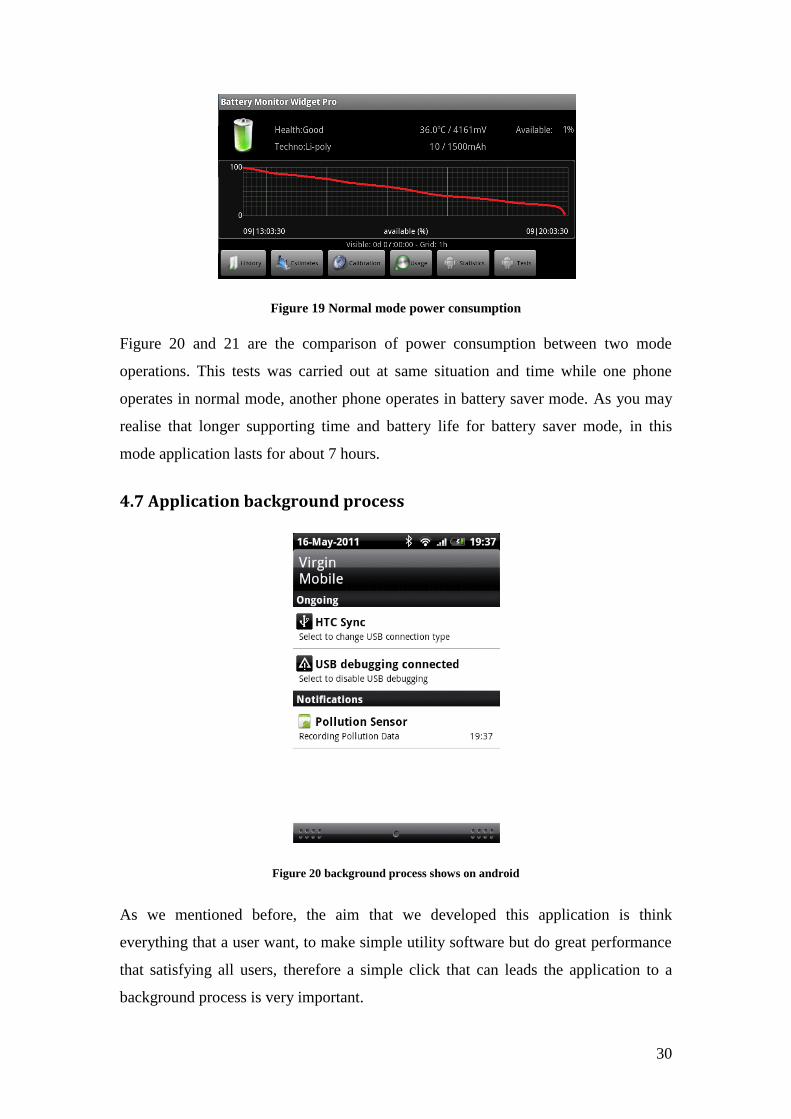
Figure 19 Normal mode power consumption
Figure 20 and 21 are the comparison of power consumption between two mode
operations. This tests was carried out at same situation and time while one phone
operates in normal mode, another phone operates in battery saver mode. As you may
realise that longer supporting time and battery life for battery saver mode, in this
mode application lasts for about 7 hours.
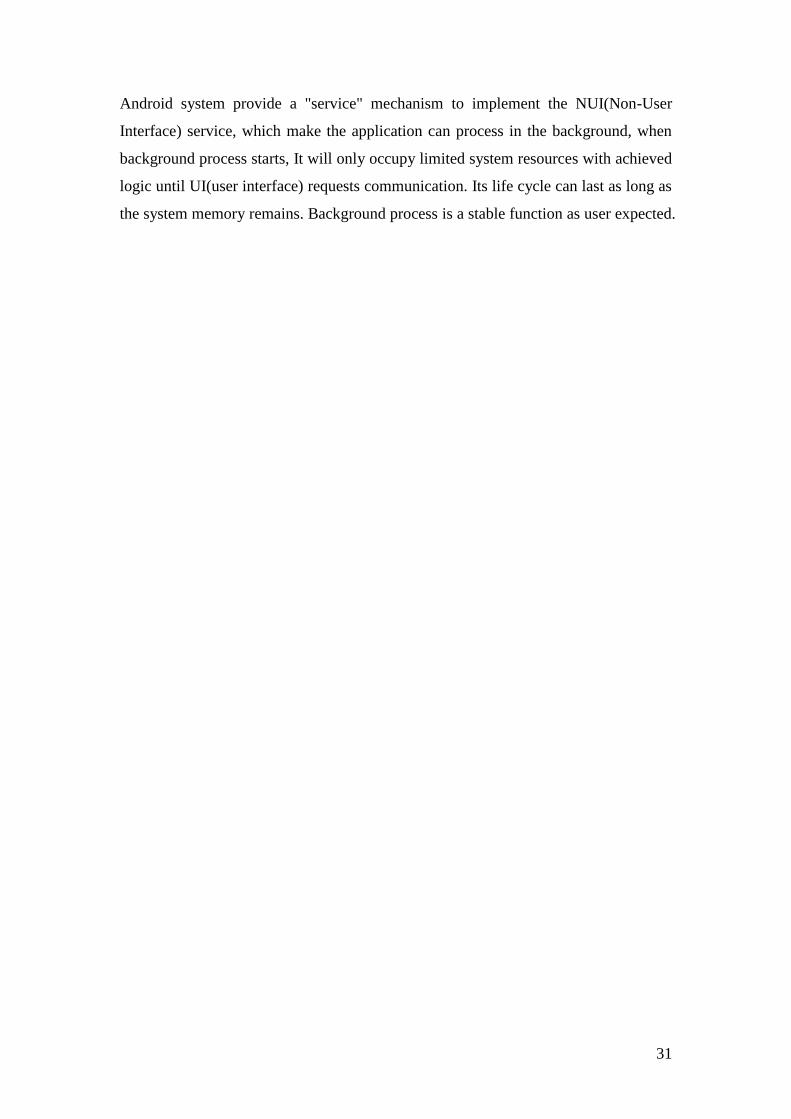
4.7 Application background process
Figure 20 background process shows on android
As we mentioned before, the aim that we developed this application is think
everything that a user want, to make simple utility software but do great performance
that satisfying all users, therefore a simple click that can leads the application to a
background process is very important.
31
Android system provide a "service" mechanism to implement the NUI(Non-User
Interface) service, which make the application can process in the background, when
background process starts, It will only occupy limited system resources with achieved
logic until UI(user interface) requests communication. Its life cycle can last as long as
the system memory remains. Background process is a stable function as user expected.
32
5. Power consumption
Due to Bluetooth, Mobile network and GPS connection always turns on once the
application being launched, which leads us to concern about power dissipation of the
Smartphone in a case of android phone's battery will drain faster than usual.
On the user side they may feel unsatisfied while running the application.
The power consuming problem inside the application is according to four main factors
in the android application:
Bluetooth connection between device and phone.
GPS communication power consumption of phone.
Frequently refreshing displayed data in the graph of the application.
Uploading package via 3G/Wi-Fi network to server.
As sensor board device sent one set of data per 5seconds to the Smartphone, we need
the Bluetooth communication between phone and device all the time along the whole
trip of gathering measurements. It‘s the same reason for GPS communication as well,
because of the location‘s accuracy is a very important factor of our application, we
want the exactly location all the time, which means we need to get the GPS
communication keep on tracking for every slight user movement.
We create a function that under some certain conditions user can actually control the
rate of display data on the graph as well the package forwarding rate to server. A
slower rate on both sides can save the android phone‘s battery, decrease the system
memory and 3G/WI-Fi network usage.
33
6. Bluetooth auto-connection
Sensing unit consists of a Smart phone and a device. Under some conditions the
device may turn off or users may take the phone away from the device, but phone
application is still running, due to connection lost, Bluetooth scanning will
periodically establish to connect device, No matter application is running in
background process or battery saver mode, battery will drop or even run out. As a
designer we don‘t want it to happen. Some algorithms and detection method need to
carry out to perfect the application.
The major task that we need to focus on in this section is establishing Bluetooth auto
searching and connecting for Smartphone. The reasons that come up with doing this
self-learning process is:
Save power. The Smartphone will end up with infinite loop of searching
device after connection lost. No matter what operation mode the application is
running on, battery will drop fast and run out soon.
Customer satisfaction. Users always expect some basic functionality in an
application, the self-learning process of Bluetooth will meet customers‘ low
level expectations. We should always put users at the centre of what we want
to achieve.
Introduce a Bluetooth self-learning auto connection process is necessary at this stage;
it perfects the application performance as well as satisfied users‘ requirement as a
fundamental feature.
34
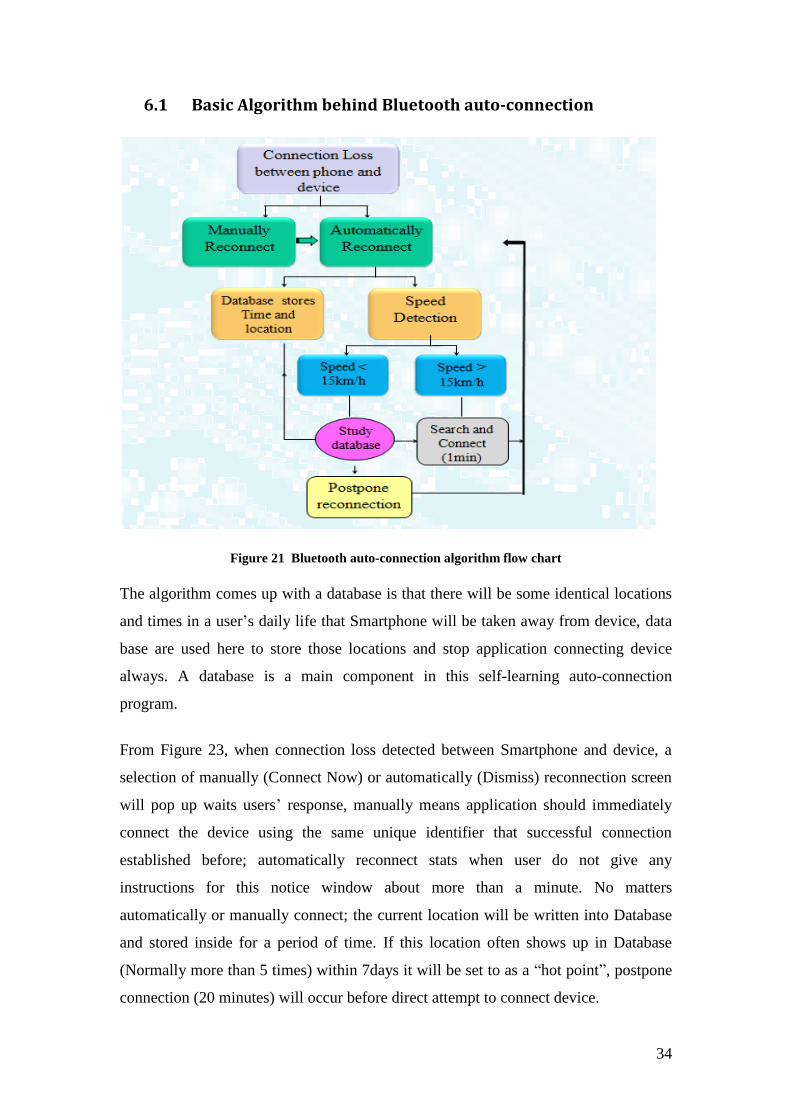
6.1 Basic Algorithm behind Bluetooth auto-connection
Figure 21 Bluetooth auto-connection algorithm flow chart
The algorithm comes up with a database is that there will be some identical locations
and times in a user‘s daily life that Smartphone will be taken away from device, data
base are used here to store those locations and stop application connecting device
always. A database is a main component in this self-learning auto-connection
program.
From Figure 23, when connection loss detected between Smartphone and device, a
selection of manually (Connect Now) or automatically (Dismiss) reconnection screen
will pop up waits users‘ response, manually means application should immediately
connect the device using the same unique identifier that successful connection
established before; automatically reconnect stats when user do not give any
instructions for this notice window about more than a minute. No matters
automatically or manually connect; the current location will be written into Database
and stored inside for a period of time. If this location often shows up in Database
(Normally more than 5 times) within 7days it will be set to as a ―hot point‖, postpone
connection (20 minutes) will occur before direct attempt to connect device.
35
Database has the ability to store and overwrite locations and time; usually locations
will be existed in database for a week time, once this location being regards as a ―hot
point‖ it will be there for a month. Speed detection is always a preliminary work in
this algorithm before choosing postpones or direct connects; it is also a wake up
signal for not need to postpone the reconnection anymore. 15km/h is a reference point
in speed detection algorithm; as this is a normal person‘s fast running speed. When
during postpone connection situation, once moving speed exceeds 15km/h,
Smartphone will start to connect not postpone anymore. Every time when connection
does not establish successfully, the overall program will loop back to speed detection
until connects to device.
6.2 Android Data storage
Data storage is one of the core functions and fundamental components in application
development; Android provides several options for developers to save persistent
application data; whether or not you want to export your application's data to others,
you need a way to store it. Android provides the following four mechanisms for
storing and retrieving data: Preferences, Files, Databases, and Network.
Shared preferences: this is a general framework that allows developer to save
and retrieve key-value pairs of primitive data types; such as Booleans, floats,
ints, longs and strings. (Android Developers,2011)
Files: this method stores files directly on the mobile device or on a removable
storage medium. By default, other applications cannot access these files.
Database: android API contains support for creating and using SQLite
databases. Each database is private to the application that creates it.
Network: developer can also use network (when it‘s available) to store and
retrieve data on your own web-based services.
Shared preference data storage mechanism mainly focuses on storing system
configuration information, such as default greeting or a text front to be loaded
whenever the application is started. Preference data storage cannot be shared across
applications. Network storage has a limitation of application must within 3G or Wi-Fi
support area; Files only record and store the data via the format of files, rather
36
creating file database other ways would be better, it seems that those kind of
mechanism is not quite suitable for our application.
Android provides full support for SQLite databases. As part of its support for the
SQLite database system, Android exposes database management functions that let
you store complex collections of data wrapped into useful objects.(Linuxtopia, 2011)
For example, Android defines a data type for contact information; it consists of many
fields including a first and last name (strings), an address and phone numbers (also
strings), a photo (bitmap image), and much other information describing a person.
Any databases user creates will be accessible by name to any class in the application,
but not outside the application. We may easily realise that creating a SQLite database
would be the best option in early age developing of Android phone application.
6.3 Distinctive features of SQLite
Zero-configuration: SQLite does not need to be ―installed‖ before it is used; there is
no ―setup‖ procedure.
Server less: most SQL databases are implemented as a separate server process.
Programs that want to access the database with the server using some kind of inter-
process communication (typically TCP) to send requests to the server and to receive
back results. SQLite does not work this way, the process that wants to access the
database reads and writes directly from the database files on disk. There is no
intermediary server process.
Compact: SQLite is a compact library. With all features enabled, the library size can
be less than 350KiB, depending on the target platform and compiler optimization
settings. Unneeded features can be disabled at compile-time to further reduce the size
of the library. SQLite generally runs faster the more memory you give it.
Nevertheless, performance is usually quite good even in low-memory environments.
Variety storage data type: SQLite relaxes the restriction that a particular data type is
only allowed to be stored in a column; SQLite allows the user to store any value of
any data type into any column regardless of the declared type of that column.
37
SQLite provides a number of enhancements that are not normally found in other
database engines. It is simple to administer, operate, embed in a large program and
maintain and customize. (SQLite, 2011) Android default Database engine is SQLite.
SQLite is a lightweight transactional database engine that occupies a small amount of
disk storage and memory, so it's a perfect choice for creating databases on many
mobile operating systems such as Android, iOS. Based on those excellent qualities,
we find that it is the most suitable database that should be associated with our
pollution application.
6.4 SQLite Implementation on Android system
SQLite on Android does not have a management interface or an application to create
and manage databases from, so we're going to create the database ourselves by code.
First, we will create a class that handles all the operations required to deal with the
database such as creating the database, creating tables, inserting and deleting records
and so on.
SQLiteOpenHelper: is a helper class in to manage database creation and version.
This class provides two methods to override to deal with the database:
onCreate: which when database is created, it helps to create tables and
columns to associated stored information.
onUpgrader: invoke when we make modifications to database such as altering,
dropping, creating new tables.
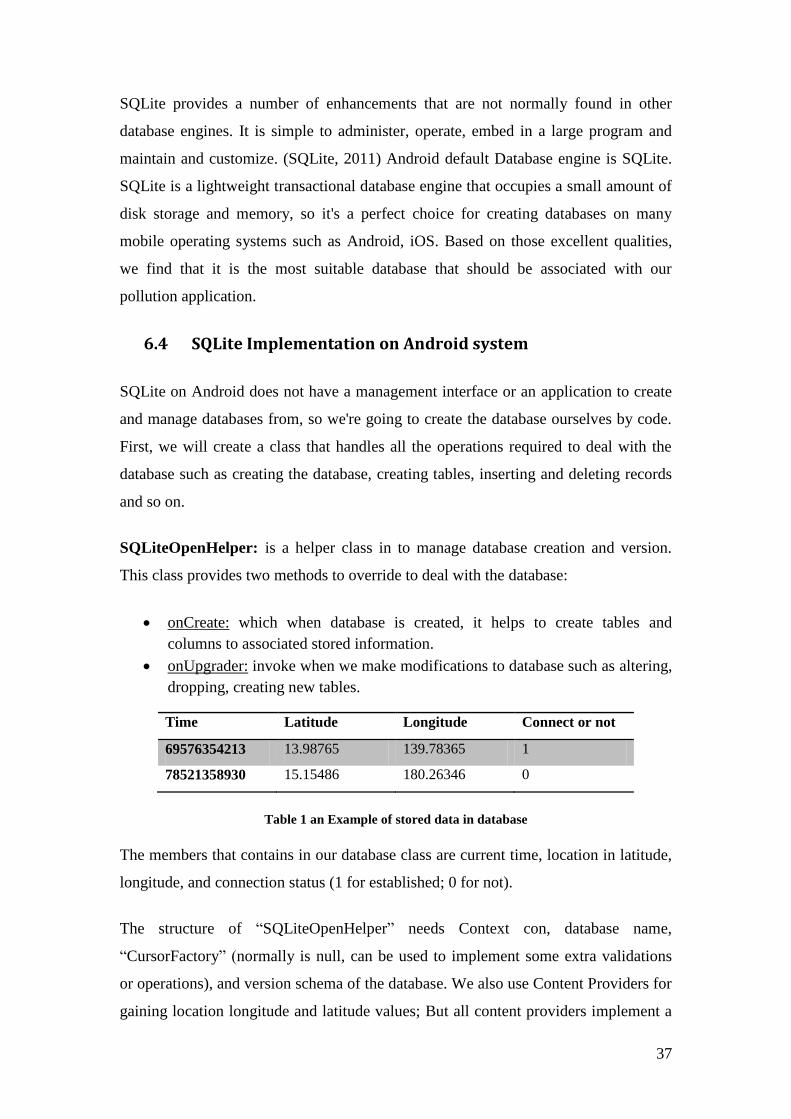
Time Latitude Longitude Connect or not
69576354213 13.98765 139.78365 1
78521358930 15.15486 180.26346 0
Table 1 an Example of stored data in database
The members that contains in our database class are current time, location in latitude,
longitude, and connection status (1 for established; 0 for not).
The structure of ―SQLiteOpenHelper‖ needs Context con, database name,
―CursorFactory‖ (normally is null, can be used to implement some extra validations
or operations), and version schema of the database. We also use Content Providers for
gaining location longitude and latitude values; But all content providers implement a

38
common interface for querying the provider and returning results — as well as for
adding, altering, and deleting data. It's an interface that developers use indirectly,
most generally through ContentResolver objects. You get a ContentResolver by
calling getContentResolver () from within the implementation of an Activity or other
application component.
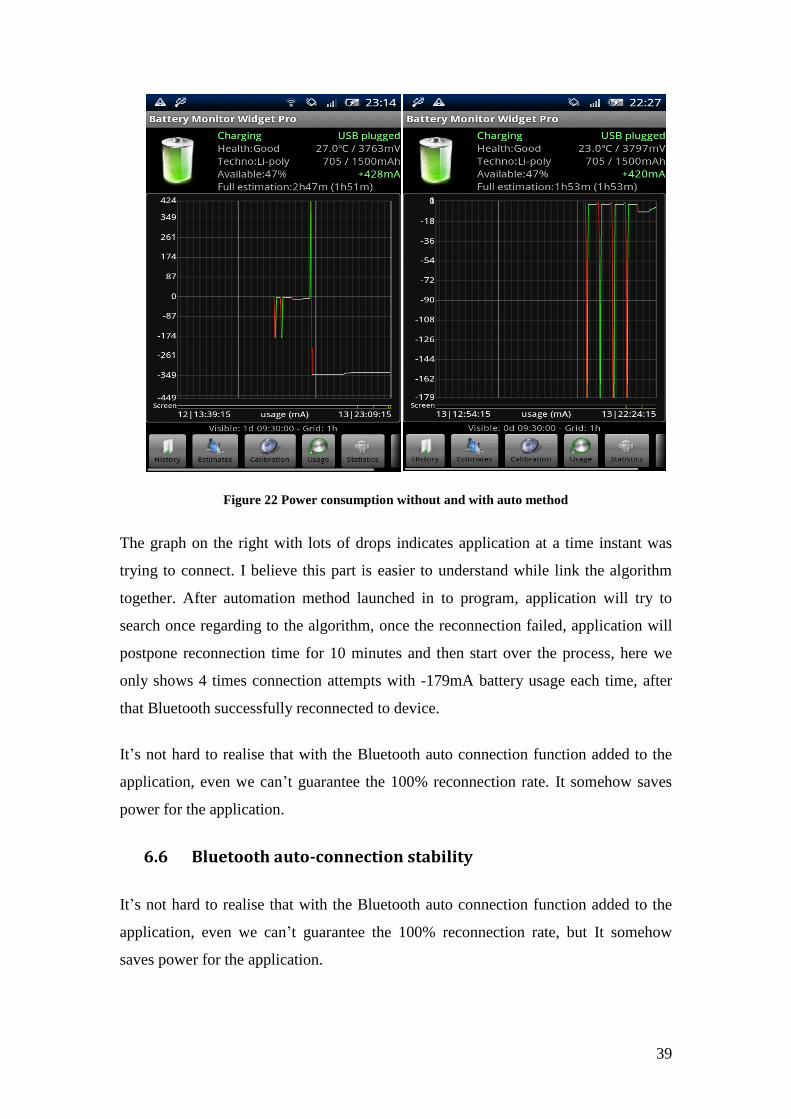
6.5 Test results
As we are aiming to implemented Bluetooth auto-connection as a background
process, it is hard to observe what is really going on in operation, but since every
Bluetooth connecting was trying to establish will definitely consume power on the
Smartphone. Detection results on power consumption while taking device away from
Smartphone so that waits phone trying to establish connection process is illustrated in
Figure 2.
Left graph is in the situation that there is no auto-Bluetooth connection function in the
program, if may be a little hard to recognise, but the actually performance of the
application is that when connection lost, Bluetooth will always search and attempt to
find device, it continues consumes power at -349MA.
39
Figure 22 Power consumption without and with auto method
The graph on the right with lots of drops indicates application at a time instant was
trying to connect. I believe this part is easier to understand while link the algorithm
together. After automation method launched in to program, application will try to
search once regarding to the algorithm, once the reconnection failed, application will
postpone reconnection time for 10 minutes and then start over the process, here we
only shows 4 times connection attempts with -179mA battery usage each time, after
that Bluetooth successfully reconnected to device.
It‘s not hard to realise that with the Bluetooth auto connection function added to the
application, even we can‘t guarantee the 100% reconnection rate. It somehow saves
power for the application.
6.6 Bluetooth auto-connection stability
It‘s not hard to realise that with the Bluetooth auto connection function added to the
application, even we can‘t guarantee the 100% reconnection rate, but It somehow
saves power for the application.
40
We have to address here that the auto-connection function was not quite successful as
what we expected. May be due to lack of experience of dealing with background
debugging or knowledge about Bluetooth connecting problem we really hope in the
future this problem can be solved.
The two reasons we are thinking brings out failure in connection would be:
Sensitivity of ―hot point‖ detection. ―hot point‖ is the location determined by the
values of longitude and latitude returned from handsets‘ GPS system, from the
research shown in figure we can see that the most precise civil GPS system
usually have an error range of 30 meters, most of the mobile errors are much more
higher than this, some situation will be worse if the handsets within indoor, tunnel,
or urban area. They limit the performance of ―hot point‖ reconnection method.
It‘s hard to detect Bluetooth loss. Currently we put packages received from device
into database first then starts running application to access database , to get
readings, the performance have to be like this as we must gather every single
package, the program running speed is not matching the incoming package speed.
Pre- stored in database is necessary. Detection method to decide if the device is
still connected or not is according to check the package protocol format. (Header
appears after Footer of last package inside database) Sensor device may occurs
situations like sending chaotic messages, application crashes before detect
connection lost is a major concern here.
41
7. Program optimization
This chapter we are more focusing on program performance and code management,
since all the work done by this year will need to pass to followers. It‘s necessary that
we ensure the performance of the application by doing debug and testing to minimise
imperfections.
A good program should fulfil the following aspects:
Simplicity: simplicity is reflected on program structure, concise code and
functions. Simplicity of organise, implement and design your algorithm.
Simplicity ensures bug free and reliable solutions.(Steve McConnel, 2010)
Readability: means that others can read your code, includes comments, to
follow conventions and pause to name variables wisely.
Modularity: good programs erect large systems from smaller ones, which are
built from even smaller building blocks. You can write a text editor with three
primitives: move, insert, and delete. And just as atoms combine in novel ways,
software components should be reusable. (Paul DiLascia, July, 2004)
Design: Take time to plan your program before you build it. Thoughts are
cheaper than debugging.
Efficiency: means your program is fast and economical. It doesn‘t hog files,
data connections, or anything else. It does what it should, but no more. It loads
and departs without fuss. At the function level, you can always optimize later,
during testing. But at high levels, you must plan for performance.
Layering: program needs layers, like file-document-view-frame. Higher layers
call ones below, which raise events back up. Lower layers should never know
what higher ones are up to.
Clarity: clarity of code, clarity of design, clarity of purpose. The fundamental
challenge of programming is managing complexity. Simplicity, readability,
modularity, layering, design, efficiency, and elegance are all time-honoured
ways to achieve clarity, which is the antidote to complexity.
Therefore, a good program code is that strikes the right balance between all of the
qualities mentioned above.
42
7.1 Program performance testing
In software development, performance testing is testing that is performed from one
perspective to determine how fast some aspect of a system performs under a particular
workload. It can also serve to validate and verify quality attributes of the system. It is
importance to optimise the program while performance testing, developer should find
out weakness and come up with remedy to solve problems.
During performance testing, it is crucial for the test conditions to be similar to the
expected actual use, however, not entirely possible in actual practice. Performance
tests in the sphere of our Android application should focus on the following two areas
at this stage:
Memory consumption: mainly about memory cost while program running. We
definitely do not expect high memory consumption of our application, as it will affect
the phone functioning.
Program Computation time test: time requirements around a single activity to verify
quality and capacity.
Other areas such as scalability; which is about how program deal with increase load
flow and perceived performance; which is user‘s personal perspective towards the
application should be carried out after the overall product is putting into market.
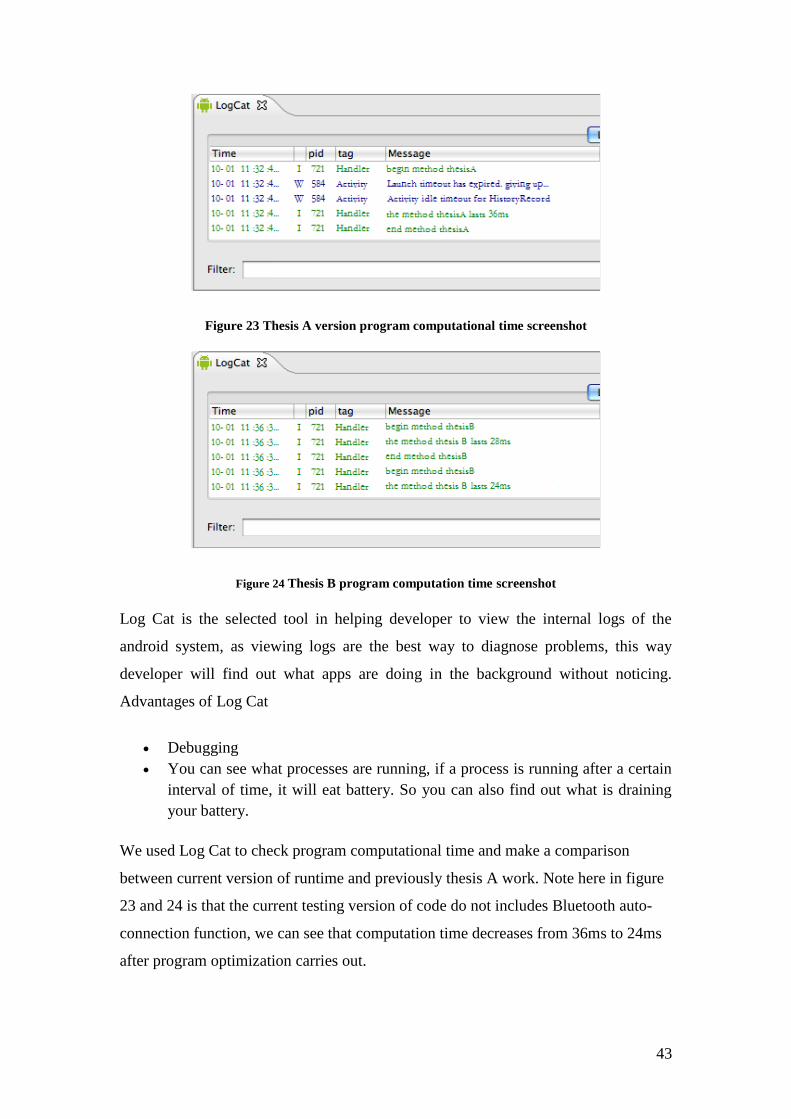
7.1.1 Program computational time test
Java language provides the ―System.currentTimeMillis()‖ function in accuracy of millisecond
returned current time for testing. Instead of put this line of code inside each function, we
introduced Proxy design pattern, apply ―java.lang.reflect.Proxy‖ class and
―java.lang.reflect.InvocationHandler‖ interface, which makes up the heart of dynamic proxy‘s
functionality.with DDMS interacts with Virtual Machine debugger, we will obtain the Log
information clearly shows time of every function executed and ended.
43
Figure 23 Thesis A version program computational time screenshot
Figure 24 Thesis B program computation time screenshot
Log Cat is the selected tool in helping developer to view the internal logs of the
android system, as viewing logs are the best way to diagnose problems, this way
developer will find out what apps are doing in the background without noticing.
Advantages of Log Cat
Debugging
You can see what processes are running, if a process is running after a certain
interval of time, it will eat battery. So you can also find out what is draining
your battery.
We used Log Cat to check program computational time and make a comparison
between current version of runtime and previously thesis A work. Note here in figure
23 and 24 is that the current testing version of code do not includes Bluetooth auto-
connection function, we can see that computation time decreases from 36ms to 24ms
after program optimization carries out.
44
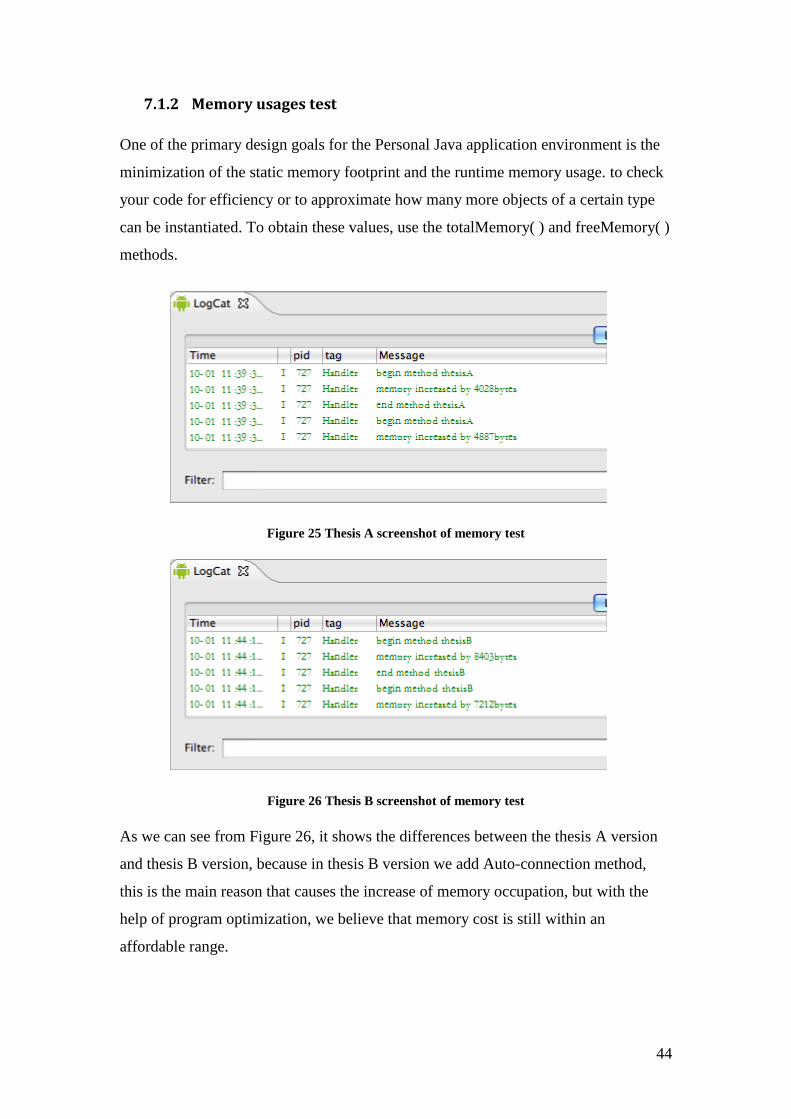
7.1.2 Memory usages test
One of the primary design goals for the Personal Java application environment is the
minimization of the static memory footprint and the runtime memory usage. to check
your code for efficiency or to approximate how many more objects of a certain type
can be instantiated. To obtain these values, use the totalMemory( ) and freeMemory( )
methods.
Figure 25 Thesis A screenshot of memory test
Figure 26 Thesis B screenshot of memory test
As we can see from Figure 26, it shows the differences between the thesis A version
and thesis B version, because in thesis B version we add Auto-connection method,
this is the main reason that causes the increase of memory occupation, but with the
help of program optimization, we believe that memory cost is still within an
affordable range.
45
8. Java Language optimization
Sometimes the biggest problem with a program is that it requires simply too many
resources, and these resources (memory, CPU cycles, network bandwidth, or a
combination) may be limited. Code fragments that occur multiple times throughout a
program are likely to be size-sensitive, while code with many execution iterations
may be speed-sensitive as well. The aim of section is the apply rules in java
programming to enhance the performance and efficiency of running application.
These are the several common optimization techniques that apply regardless of the
language being used.
Loops: almost all speed problems involve loops, and the loop itself is an easy
place to get a quick performance boost. The impact of the loop overhead
depends on how many iterations the loop executes and how much it does
during each iteration. Obviously, the more iterations and the less work done
per iteration, the greater the benefit with optimizing the loop itself.
Thread, objects, method: reduce the chance of stick inside one or two giant
thread, object and method. A method that is long and complicated is difficult
and expensive to maintain.
There are three performance optimization methods we carried out in our program
improvement:
8.1 Use Object pool pattern to boost application speed
Java is in the domain of object-oriented programming, unlike simple or primitive data
types that are just single pieces of information. Object-oriented objects are complex
types that have multiple pieces of information and specific properties. Cost of creating
and releasing an object is high; object pooling can offer a significant performance
boost in such situations.
The general idea of object pool is it lets others check out objects from a pool, when
those objects are no longer needed by their processes, they will be returned to the pool
waiting to be reused. Pooling basically means utilizing the resources efficiently, by
limiting access of the objects to only the period the client requires it. Increasing
utilization through pooling usually increases system performance.
46
In our program the maximum amount of objects we required is 7 currently, mark the
attribute of each element as ―Used‖ or ―reset‖ to indicates status, when application
requires an object, just simple reset one ideal object in pool, after it released edits
status as ―Used‖ for later purpose.
8.2 Use basic data type to replace chances of creating objects to
save space
Although creates objects seems more well-organized and nice structural in a program,
but it is not a good behaviour to use objects holding every data in a program. Objects
only requires when used expressly to package and transport a group of items when a
generalised container is inappropriate. Objects also occupy large storage spaces than
use basic data types such as int, char, and strings, therefore, used basic data type in
some instance would be better than creating objects.
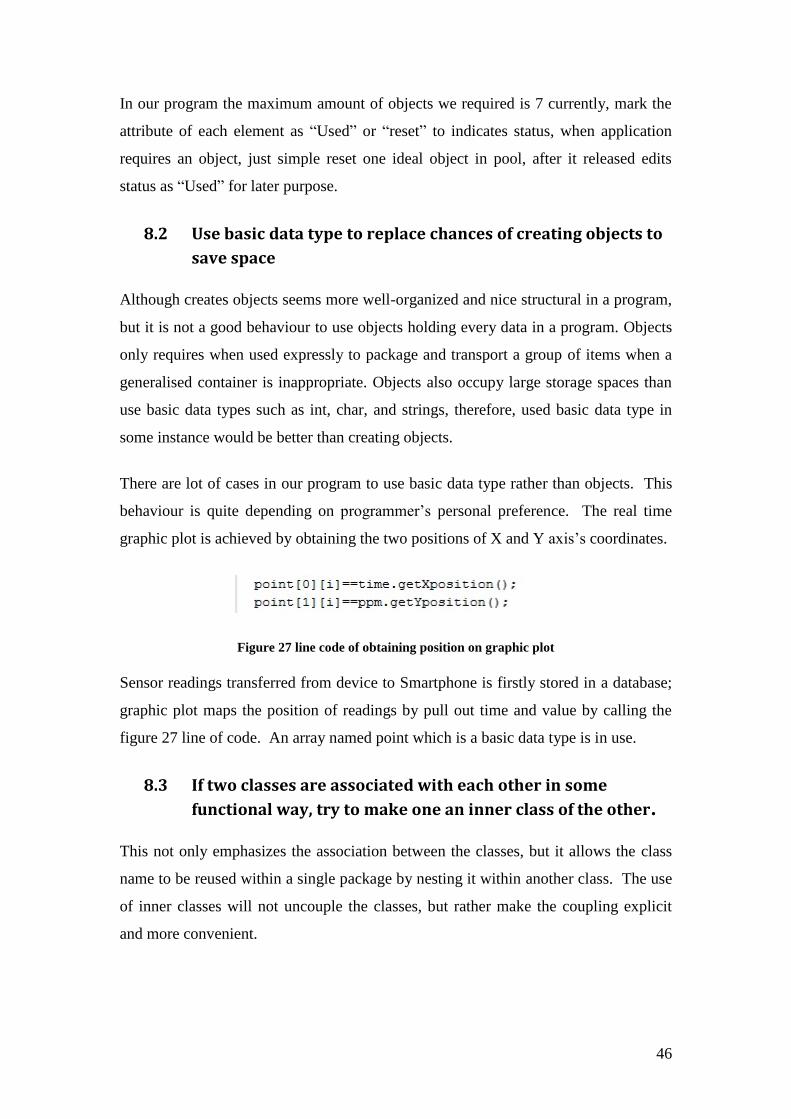
There are lot of cases in our program to use basic data type rather than objects. This
behaviour is quite depending on programmer‘s personal preference. The real time
graphic plot is achieved by obtaining the two positions of X and Y axis‘s coordinates.
Figure 27 line code of obtaining position on graphic plot
Sensor readings transferred from device to Smartphone is firstly stored in a database;
graphic plot maps the position of readings by pull out time and value by calling the
figure 27 line of code. An array named point which is a basic data type is in use.
8.3 If two classes are associated with each other in some
functional way, try to make one an inner class of the other.
This not only emphasizes the association between the classes, but it allows the class
name to be reused within a single package by nesting it within another class. The use
of inner classes will not uncouple the classes, but rather make the coupling explicit
and more convenient.
47
9. Android program optimization5
Application based on android platform must be embedded. Modern handsets are not
only a mobile phone, but also a portable laptop. Users are more expecting high
performance and efficiency applications with high battery life circles.
We need to optimize application that gives the user the most convenience. Here we
list some principles we applied to optimize the application: (David thesis, 2011)
1. Avoid creating object as far as possible:
2. Use self-function:
3. Use static instead of virtual:
4. Avoid use internal Get, Set function:
5. Carefully use ―For-each‖ Loop:
6. Avoid Enumeration:
7. Avoid floating point type:
More detailed information of optimization in this chapter please refers to David Lu‘s
report.
5 Refer David‘s thesis
48
10. Calibrations in Haze watch system:
Calibration of gas sensors poses the greatest challenge for the long term outcome of
the wireless sensor board. The method conducts last year for calibrating the sensors
on each unit cannot ensure accuracy and system integrity; wrong calibration results
will cause incorrect pollutant readings from the device and we cannot guarantee the
whole system reliability.
Calibration is a process that is done in almost every medical, industrial, commercial
product especially this product is used in measurements, it is the process of checking
machines and making sure that values used in measurements remain at standard
points, it is the process of verifying a machines work and performance within a set of
specifications. (Chandra, 2011)
The carried out experiment for performing calibration equations of the three metal
oxide sensors are comparing the measurements taken by both wireless sensor board
and the Gas Alert Micro 5 Commercial meter. The resulting equations are estimated
equations; the variations are quite large when calculating wireless sensor board output
when exposes to high concentration gases. This discrepancy lacks of degrees of
confidence about the calibration results and further investigation on calibration of
those sensors should be taken place.
When calibration is done at the right way, calibration can make your life easier and
better, it allows for faster processes and of course with lesser errors and mistakes.
During calibration, it is also important to make sure that the measurements taken
during the period is also valid. Whatever values that we have gotten during the
calibration process should be the values that are accepted to be the most accurate and
precise.
49
10.1 Method 1: Experimentally doing calibration using pure gas
cylinders
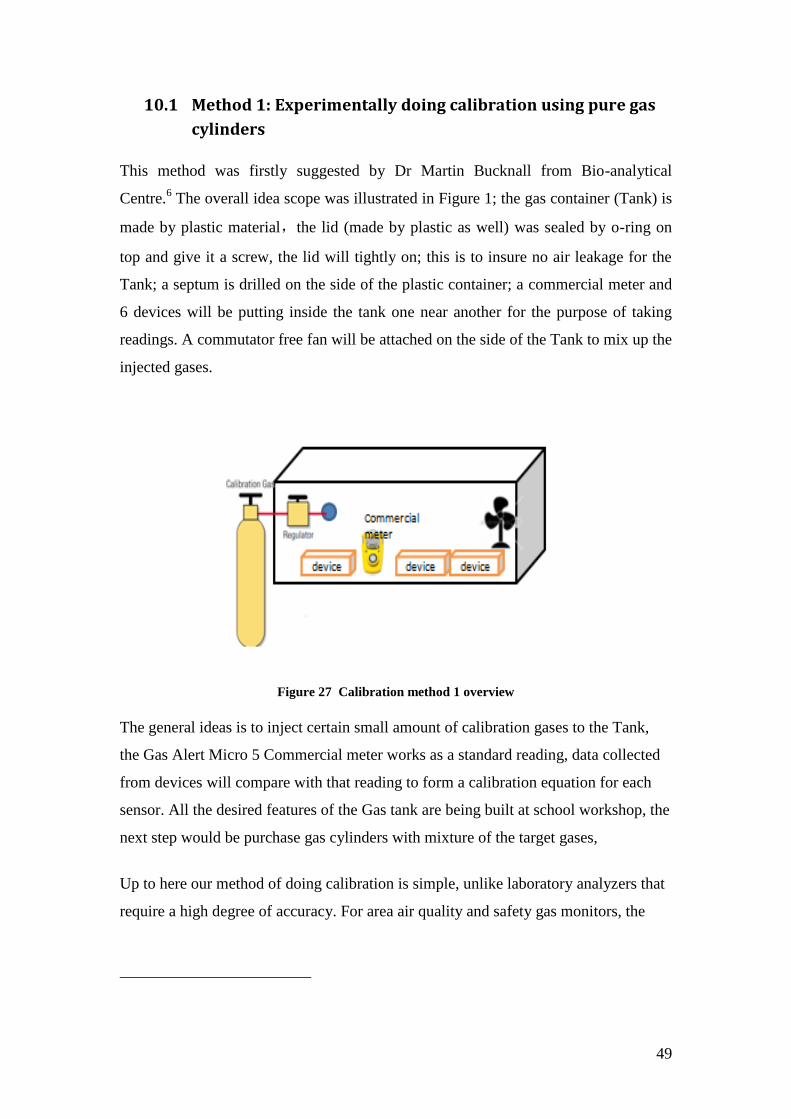
This method was firstly suggested by Dr Martin Bucknall from Bio-analytical
Centre.6 The overall idea scope was illustrated in Figure 1; the gas container (Tank) is
made by plastic material,the lid (made by plastic as well) was sealed by o-ring on
top and give it a screw, the lid will tightly on; this is to insure no air leakage for the
Tank; a septum is drilled on the side of the plastic container; a commercial meter and
6 devices will be putting inside the tank one near another for the purpose of taking
readings. A commutator free fan will be attached on the side of the Tank to mix up the
injected gases.
Figure 27 Calibration method 1 overview
The general ideas is to inject certain small amount of calibration gases to the Tank,
the Gas Alert Micro 5 Commercial meter works as a standard reading, data collected
from devices will compare with that reading to form a calibration equation for each
sensor. All the desired features of the Gas tank are being built at school workshop, the
next step would be purchase gas cylinders with mixture of the target gases,
Up to here our method of doing calibration is simple, unlike laboratory analyzers that
require a high degree of accuracy. For area air quality and safety gas monitors, the
50
requirements need to be simple, repeatable, and economical.7 The procedure should
be consistent and traceable. The calibration will be performed in the field where
sensors are installed so it can occur in any type environment. However, it is most
important to keep the calibration methods standardized and easily traceable.
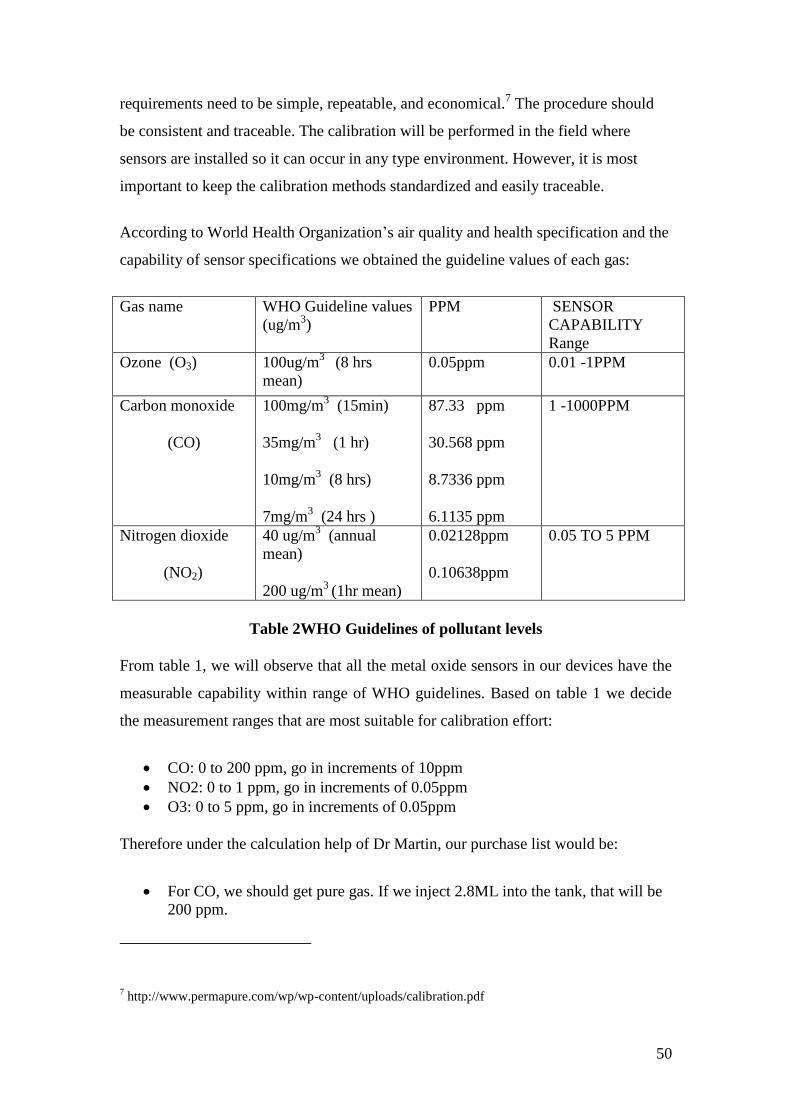
According to World Health Organization‘s air quality and health specification and the
capability of sensor specifications we obtained the guideline values of each gas:
Gas name WHO Guideline values
(ug/m3)
PPM SENSOR
CAPABILITY
Range
Ozone (O3) 100ug/m3
(8 hrs
mean)
0.05ppm 0.01 -1PPM
Carbon monoxide
(CO)
100mg/m3 (15min)
35mg/m3 (1 hr)
10mg/m3 (8 hrs)
7mg/m3 (24 hrs )
87.33 ppm
30.568 ppm
8.7336 ppm
6.1135 ppm
1 -1000PPM
Nitrogen dioxide
(NO2)
40 ug/m3 (annual
mean)
200 ug/m3
(1hr mean)
0.02128ppm
0.10638ppm
0.05 TO 5 PPM
Table 2WHO Guidelines of pollutant levels
From table 1, we will observe that all the metal oxide sensors in our devices have the
measurable capability within range of WHO guidelines. Based on table 1 we decide
the measurement ranges that are most suitable for calibration effort:
CO: 0 to 200 ppm, go in increments of 10ppm
NO2: 0 to 1 ppm, go in increments of 0.05ppm
O3: 0 to 5 ppm, go in increments of 0.05ppm
Therefore under the calculation help of Dr Martin, our purchase list would be:
For CO, we should get pure gas. If we inject 2.8ML into the tank, that will be
200 ppm.
7 http://www.permapure.com/wp/wp-content/uploads/calibration.pdf
51
For NO2, we should get 10000PPM diluted in air or nitrogen. If we inject
1.4mL into the tank, that will be 0.5 ppm.
For O3, we should get 5000 ppm diluted in air or nitrogen. If we inject 1.4ML
of this in to the tank, that will be 0.5 ppm.
All injection of sensible volumes will use syringes as suggested by Dr Martin to
ensure accuracy.
During the preparation of purchasing those gas cylinders, we get the reply from E2V
Company who manufactured the metal oxide sensors, they suggested that we may do
two point calibration method. The two point usually zero and the point of our standard
gas. For example: to calibrate CO, firstly we put the sensor in the ambient air to
record the output as the zero and then to give like 50ppm or 100ppm CO through the
sensor and then record the output. With these two points, we can get the
characterization line of the sensor, and then we can get the concentration from the
sensor output at different concentration. As sensor may drift, the intervals between
calibrations can be different from sensor to sensor. Generally, the manufacturer of the
sensor will recommend a time interval between calibrations. However, it is good
general practice to check the sensor more closely during the first 30 days after
installation. During this period, it is possible to observe how well the sensor is
adapting to its new environment.
The two companies we have contacted to purchase gas cylinders are BOC and Liquid
as suggested. We came across difficulties and concerns about not only in budget but
also about the commercial qualification after we perform the calibration process, is it
accurate of doing calibration in this way, we are not expertise in such area, we cannot
guarantee and convince others we are getting the correct data. From this point we are
thinking if there exist any company that is already qualified would able to help us
doing calibration and ensure reliability.
In this method we need to obtain values of each sensor unit via their Bluetooth
transmission. Mat lab works as a bridge between data transmission and receiving
between device and PC Bluetooth, initially we only achieved connecting one device at
a time and the common port always changes while running Mat Lab code. After some
research and spending some time on it, we are able to bind a single device unit to one
certain port so that during Mat lab running we can switch each connection in a loop to

52
obtain every device output and save in a file. Figure 28 is a screenshot of 11 devices
bind with fixed common port.
Figure 28 Bluetooth binding inside PC
10.2 Method 2: e2v Gas Sensor Evaluation Kits
Figure 29 E2v metal oxide semiconductor gas sensor evaluation kit
53
After getting response from some company that manufacture and calibrated different
sensors, we realise that once the company produce a particular product (gas sensors)
that requires calibration and adjustment, they must create the product that can do this
sort of work for people at the same time. As lots of the companies in Sydney say that
they can help us with calibration of our sensor, but since they are not the manufacture
company and we designed our own board in a way that they can‘t really guarantee the
calibration procedure will be correct. Luckily E2v Company replies with good news
that they have the evaluation kits particularly for those metal oxide sensors.
Figure 2 is the components contains in the evaluation kits, using this kit, simply attach
it to power supply and connect your PC USB port and plug in one or two gas sensors,
the software in the disk will log and control the performance of different sensors to be
assessed and makes life easier to capture performance data in a purpose of calibration.
So far the sensor unit device is self-designed and built; there exists some discrepancy
and weakness along the thesis work carried out by our group work.
ADC (analogue to digital converter) output error digital value compare to
input voltage
Message Protocol format sometimes messes up that leads to android phone
application crash
Sensor voltage output does not match pin settings in the microcontroller. For
example in session 3.2 we introduced the message format, the sensor values
are sent in format 1 (Indicates ozone) followed with readings, 2 (Indicates CO)
followed with readings, 3 (Indicates NO2) followed with readings. It is
believed that all the readings from each sensor should match its corresponding
coordinates, but currently we find out it is not.
The idea of using this evaluation kit in the future would be:
1. The evaluation kit has a JTAG header which allows advanced users to upload
their own software to the microcontroller (MSP430F2616) and make full use
of the available interfaces. Once make sure the evaluation kit could help and
easy understandable, microcontroller coding should carried out to form
message format and output it out.
2. Attach Bluetooth unit into the evaluation kit or elsewhere designed board with
the principle of evaluation kit, so that it can transmit out the message package
for Smartphone to collect the information.
54
There will definitely a lot of more difficulties will come across that we can‘t imagine,
but as long as the design is based on the evaluation kit, it would be easier to seek help
at the E2v company.
If the evaluation kit solves the weakness of the current designed board and also able
to help with the calibration, it would be a perfect choice to have this kit around with
this project。
55
11. Future work
Hardware
The most important work in future would be calibration of the hardware sensors; in
the report I have suggested two ways of doing calibration. The sensing unit device is
the most basic element in Haze watch system, without a correct functioning and
reliable outputs from the hardware device; we can‘t convince users and clients that
this overall ―Haze watch system‖ is useful and accurate. Some of the problems of
hardware device are indicated in session 10.2.
Software
There are lots factors can affect the stability of our application, like data message
format error, Location server lost or temporary shutdown in purpose of maintain, It
needs more field test and debug to improve the stability, and as there must still have
unknown factors may cause the application crash, it need a function to record the
operation statement and error, for the purpose of future development.
According to user requirements, certain features and functions still need to be adding
to application, Bluetooth loss detection and connection at this stage is not functioning
perfectly, further work should carry out as well. Mode operation only divides
conditions in terms of speed; further considerations are more expected.
Confidence level
The results of tests we conducted of location tacking are occasionally fairly poor,
indoors or on roads with many overhanging trees will lead application fails to receive
GPS signal at all. A prudent improvement for the future would be to filter out
inaccurate locations.
Privacy
Taking about collecting data, the almost-real-time location of that user is periodically
uploaded to the server. This information could be used by an eavesdropper in
nefarious ways, and is a breach of the user‘s privacy. To prevent this type of attack,
the information could be encrypted before being sent such that the server is the only
party able to decrypt the information. An RSA public/private key pair system could be
one possible solution to this problem.
56
12. Conclusion
Current systems in place to monitor air pollution levels typically have only a handful
of fixed monitoring stations distributed over an entire city. There is a need for higher
resolution, cost effective air pollution data to inform any interested members of the
general public, the proposed Haze watch system is being developed.
Using motor vehicles as a platform for our hardware, the haze watch system utilises
existing internet to enable Smartphone to act as a bridge to transmit air pollution
readings to our server.
The work undertaken at this stage about ―Haze Watch system‖ project has shown how
it works in a way to pollution monitoring. Through the use of a network of mobile air
pollution sensors, database for all pollution samples, and some applications it is
believed that, this system can help the public and society to improve in health and
environment awareness.
The main focus in this report is about interface design. Works undertaken at this stage
still lie to the fundamentals of the ―Haze watch system‖, which implies that a lot more
modifications and changes are expected in the further. The results of interface features
we have conducted so far have proven that the basic android application we set out to
implement in this phase is operational and is producing reasonable results.
57
13. Reference sheet
A. Chow ―Haze Watch System: Data modelling and visualisation using Google Maps
―Thesis report, University of New South Wales, Oct 2010
Android Developers, what is Android. [Online, accessed 15th
May 2011]
http://developer.android.com/guide/basics/what-is-android.html
Android Developers, Data storage method and implementation. [Online,accessed 8th
Oct 2011] http://developer.android.com/guide/topics/data/data-storage.html
Chandra CALDB Architecture, calibration products and process.[Online, accessed 6th
Oct 2011] http://space.mit.edu/HETG/cal_overview.html
Dave Paradi, MBA, co-author of ―Guide to power point‖, using graphs and
Tables, 2005[Online, accessed 20th
May 2011]
http://www.thinkoutsidetheslide.com/articles/using_graphs_and_tables.htm\
David Lu, ―Thesis B report of interface on air pollution monitoring system‖
Unpublished [paper]
Greg Pendleton, the fundamentals of GPS, 16th
July 2002[online, accessed 16th
May
2011] http://www.directionsmag.com/articles/the-fundamentals-of-gps/124028
Institute for software integrated systems, Mobile air quality monitoring network,
School of engineering, Vanderbilt university [Online, accessed 18th
May 2011]
http://www.isis.vanderbilt.edu/projects/maqumon
Jani Jarvinen, Javier Desalas, Jimmy Lamance. Assisted GPS: A Low-Infrastructure
approach [Online, accessed 16th
OCT 2011] http://www.gpsworld.com/gps/assisted-
gps-a-low-infrastructure-approach-734‖.
James Carrapetta ―Haze Watch system‖: design a wireless sensor board Thesis
Report, University of New South Wales, session 3.8 message structure
page20, Oct 2010
Linuxtopia, 2011, ―android development‖ [Online, accessed 15th
Oct 2011]
http://www.linuxtopia.org/online_books/android/devguide/guide/topics/data/d
ata-storage.html
SQLite Market share; database installations and deployment plans -2008. [Online,
accessed 13th
Oct 2010] http://www.mysql.com/why-mysql/marketshare/
N.Youdale ―Haze Watch System: database Server and Mobile application‖ Thesis
58
Report, University of New South Wales, Session 3 page 9, Oct 2010
New South Wales Government. (2010, Jan) Government and Health. [Online,
accessed 18th
May2011].
http://www.health.nsw.gov.au/PublicHealth/environment/air/air_pollution.asp
Paul DiLascia, July, 2004. ―what makes goof code good‖,[Online,accessed 10th
Oct
2011] http://msdn.microsoft.com/en-us/magazine/cc163962.aspx
SenSaris. [Online, accessed 14th
May 2011].http://www.sensaris.com/
Skwirk Schooling. Issue in Australian environment. Air quality [Online, accessed 10th
May 2011].http://www.skwirk.com/p-c_s-16_u-140_t-414_c-1450/air-
quality/nsw/air-quality/issues-in-australian-environments/geographical-issues-
physical-environments
SQLite,2011, ―appropriate uses for SQLite‖[Online, accessed 14th
Oct 2011]
http://www.sqlite.org/whentouse.html
Steve McConnell, 2010. Code complete, 2nd Edition, chapter 5,‖ my definition of
Good code‖. [Online, accessed 7th
Oct 2011]
http://www.developerzen.com/2008/06/26/how-do-you-define-quotgood-
codequot/
U.S. Environmental Protection Agency, Trace Atmospheric Gas Analyser (TAGA)
Bus, 21st September, 2011[Online, accessed 12
th May 2011]
http://www.epa.gov/NaturalEmergencies/flyinglab.htm#trace
Wikipedia, Android operating system, part 1 History and part2 software
development.[online, accessed 15th
May 2011]
http://en.wikipedia.org/wiki/Android_%28operating_system%29
Wikipedia, Harversine formula, part1, the law of haversine [online accessed 19th
May
2011]
http://en.wikipedia.org/wiki/Haversine_formula
World Health Organization. (2008, August) Air quality and health, Fact sheet no. 313.
[Online, accessed 10th
May 2011].
http://www.who.int/mediacentre/factsheets/fs313/en/index.html
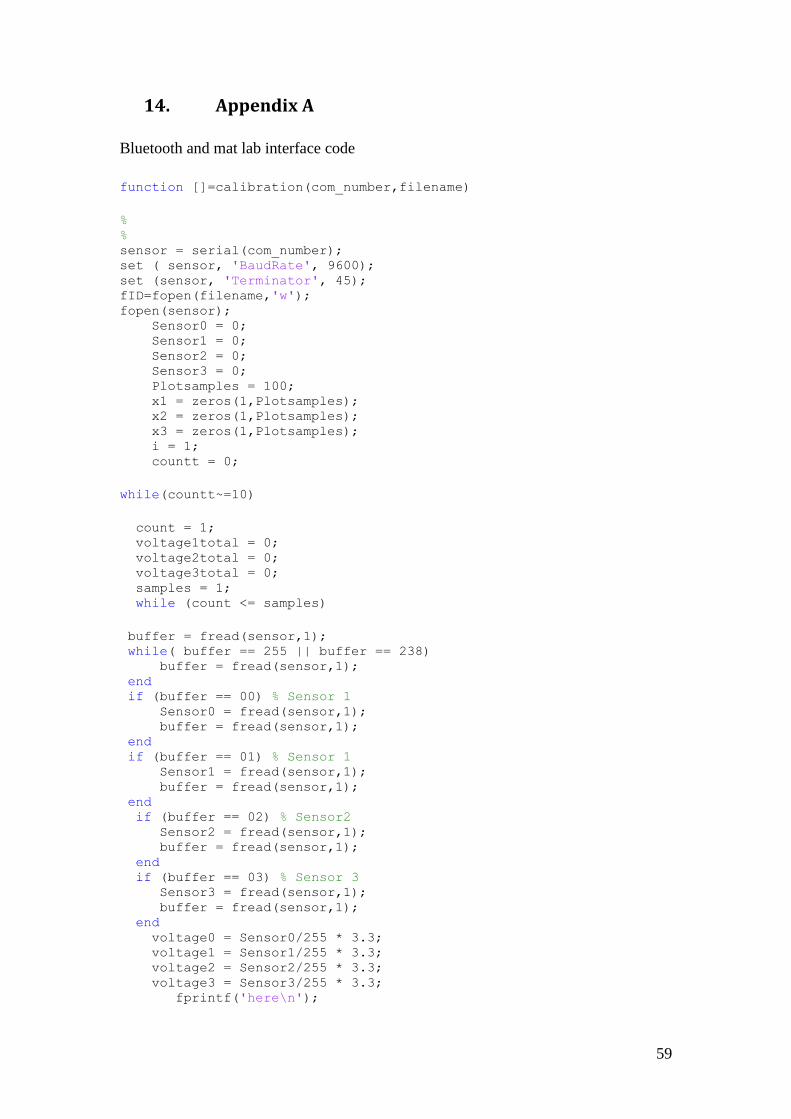
59
14. Appendix A
Bluetooth and mat lab interface code
function []=calibration(com_number,filename)
% % sensor = serial(com_number); set ( sensor, 'BaudRate', 9600); set (sensor, 'Terminator', 45); fID=fopen(filename,'w'); fopen(sensor); Sensor0 = 0; Sensor1 = 0; Sensor2 = 0; Sensor3 = 0; Plotsamples = 100; x1 = zeros(1,Plotsamples); x2 = zeros(1,Plotsamples); x3 = zeros(1,Plotsamples); i = 1; countt = 0;
while(countt~=10)
count = 1; voltage1total = 0; voltage2total = 0; voltage3total = 0; samples = 1; while (count <= samples)
buffer = fread(sensor,1); while( buffer == 255 || buffer == 238) buffer = fread(sensor,1); end if (buffer == 00) % Sensor 1 Sensor0 = fread(sensor,1); buffer = fread(sensor,1); end if (buffer == 01) % Sensor 1 Sensor1 = fread(sensor,1); buffer = fread(sensor,1); end if (buffer == 02) % Sensor2 Sensor2 = fread(sensor,1); buffer = fread(sensor,1); end if (buffer == 03) % Sensor 3 Sensor3 = fread(sensor,1); buffer = fread(sensor,1); end voltage0 = Sensor0/255 * 3.3; voltage1 = Sensor1/255 * 3.3; voltage2 = Sensor2/255 * 3.3; voltage3 = Sensor3/255 * 3.3; fprintf('here\n');

60
fprintf(fID,'%f %f %f\n',voltage1,voltage2,voltage3);
voltage1total = voltage1total + voltage1; voltage2total = voltage2total + voltage2; voltage3total = voltage3total + voltage3; count = count + 1; end
voltage1 = voltage1total/samples; voltage2 = voltage2total/samples; voltage3 = voltage3total/samples;
resistance1 = (10000*5)/(5-voltage1); resistance2 = (10000*5)/(5-voltage2); resistance3 = (10000*5)/(5-voltage3);
%pollution1 = 0; %pollution2 = 0.0405*exp(5.2621*voltage2); %pollution3 = 0.0405*exp(5.2621*voltage3);
pollution1 = voltage1; pollution2 = voltage2; pollution3 = voltage3;
count = 0; countt=countt+1; end
fclose(sensor);
end