Embed Size (px)
Citation preview
Schedule of CoRoT and Kepler
CoRoTLaunch: 27.12.2006
First image: 18.01.2007
First scientific observations:
05.02.2007
First planet detected 87 days after begin of observations
KEPLERLaunch: 07.03.2009
First image: 16.04.2009
Start of scientific operations:
13.05.2009
87 days after begin of scientific observations will be August 8th.
Searching for extrasolar planets with CoRoT
(Convection, Rotation et Transites planétaires)
Du cœur des étoiles aux planètes habitables
QuickTime™ and aTIFF (Uncompressed) decompressor
are needed to see this picture.
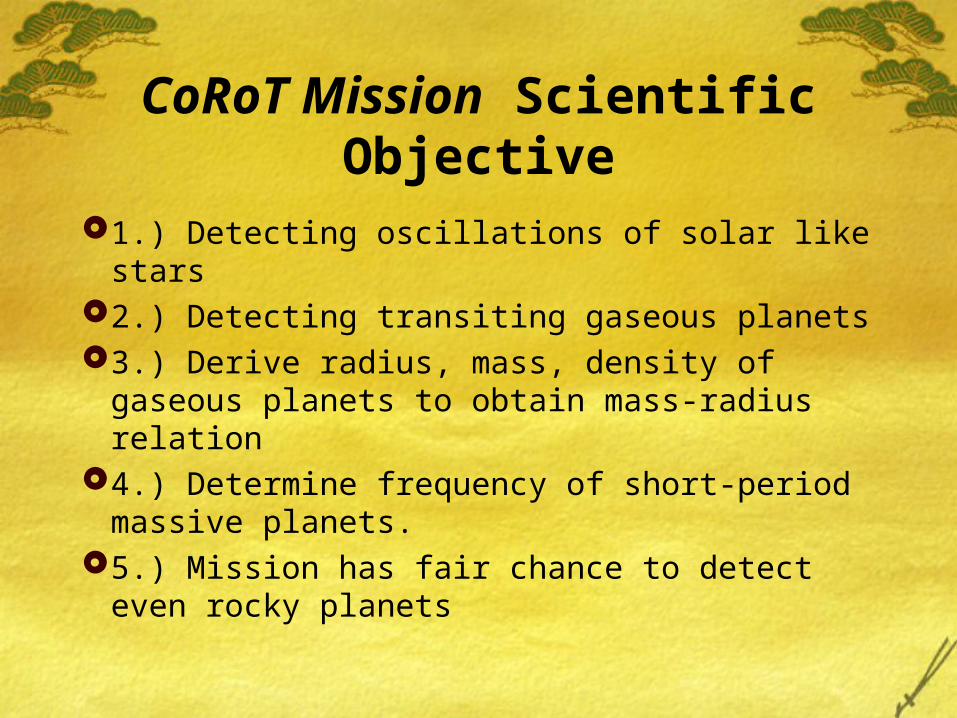
CoRoT Mission Scientific Objective
1.) Detecting oscillations of solar like stars2.) Detecting transiting gaseous planets 3.) Derive radius, mass, density of gaseous
planets to obtain mass-radius relation4.) Determine frequency of short-period
massive planets.5.) Mission has fair chance to detect even
rocky planets
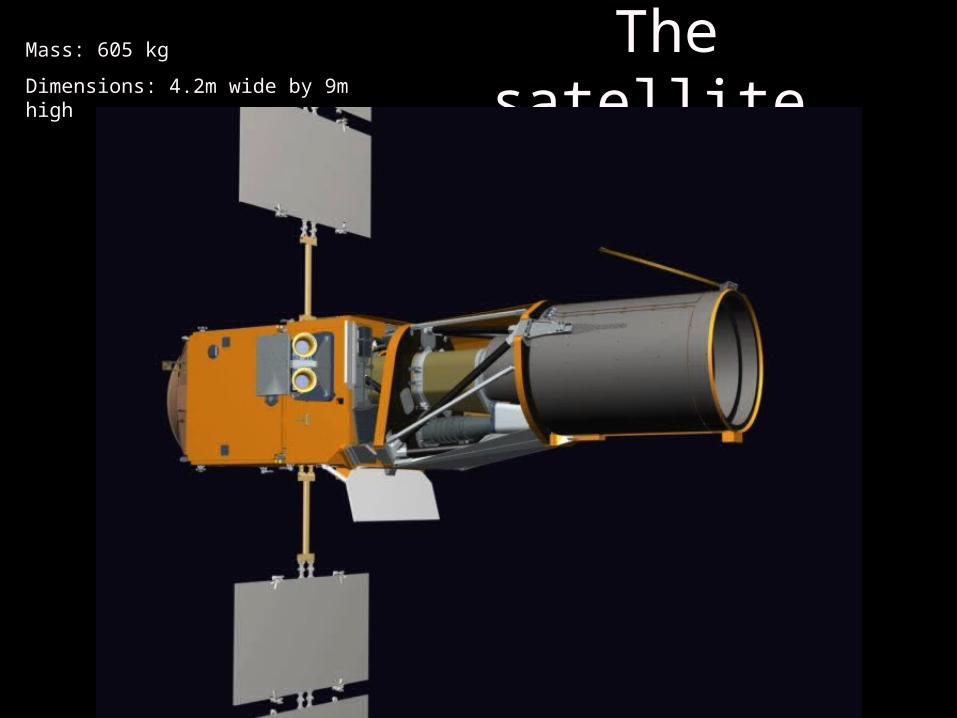
The satellite Mass: 605 kg
Dimensions: 4.2m wide by 9m high
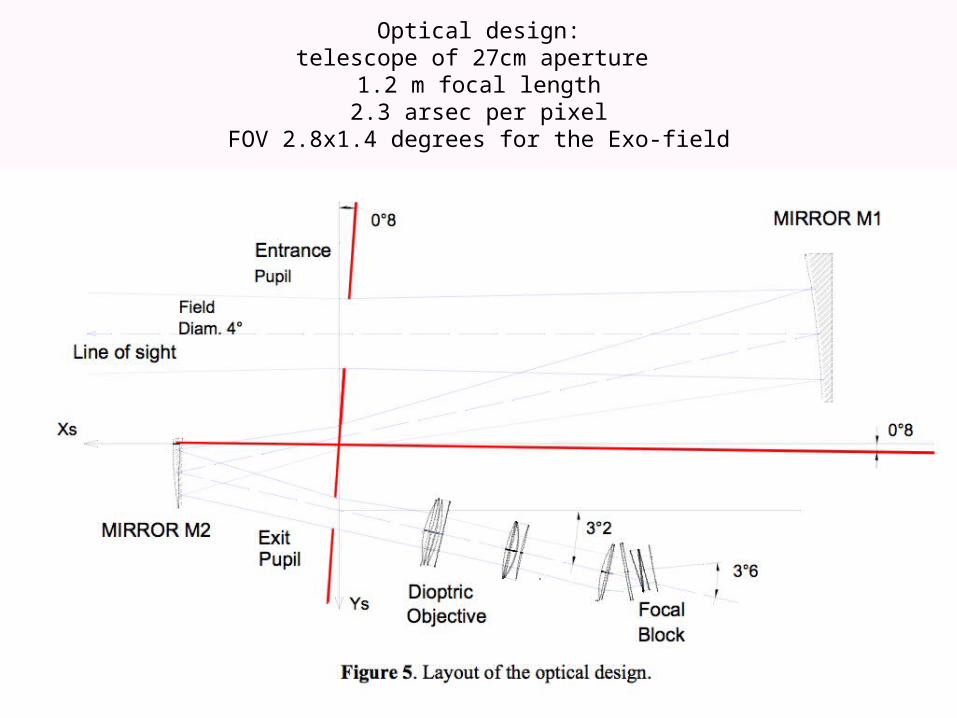
Optical design:telescope of 27cm aperture
1.2 m focal length2.3 arsec per pixel
FOV 2.8x1.4 degrees for the Exo-field

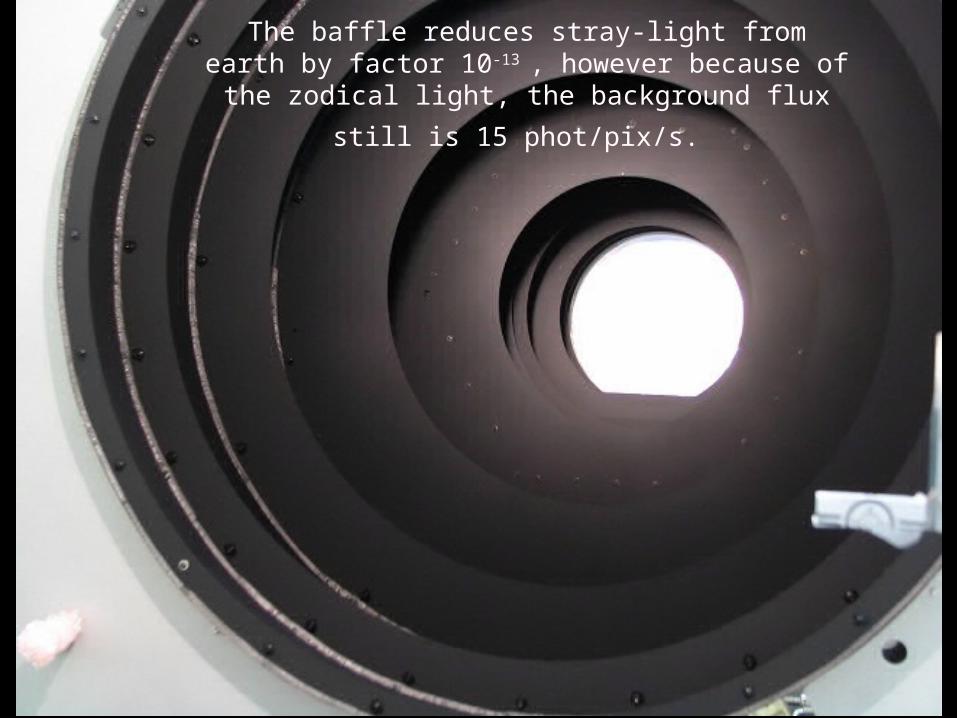
The baffle reduces stray-light from earth by factor 10-13 , however because of the zodical
light, the background flux still is 15 phot/pix/s.
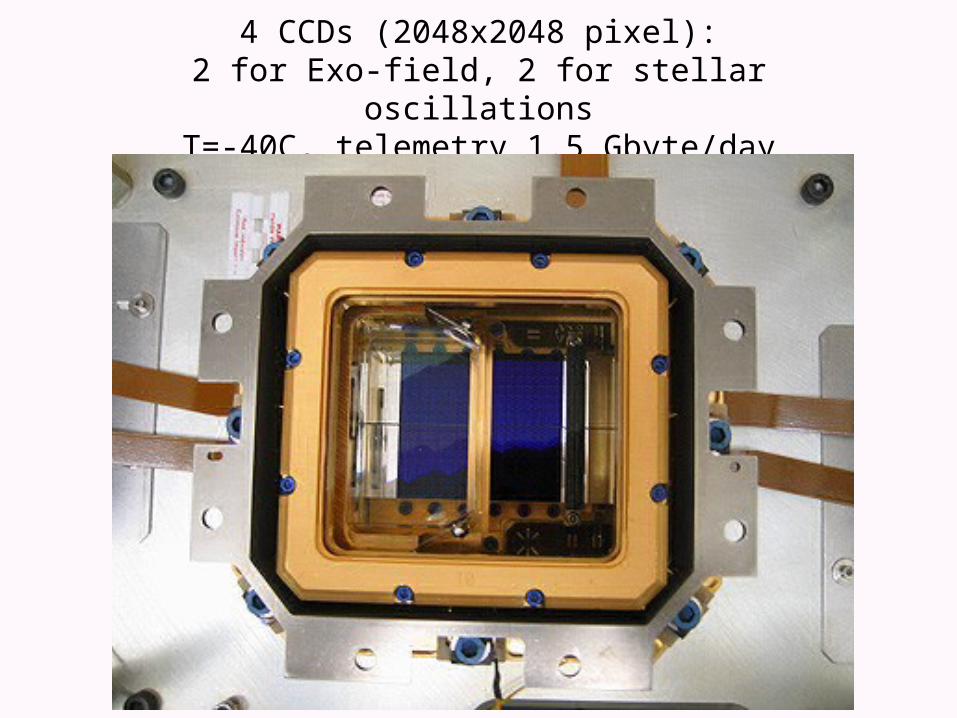
4 CCDs (2048x2048 pixel):2 for Exo-field, 2 for stellar oscillations
T=-40C, telemetry 1.5 Gbyte/day
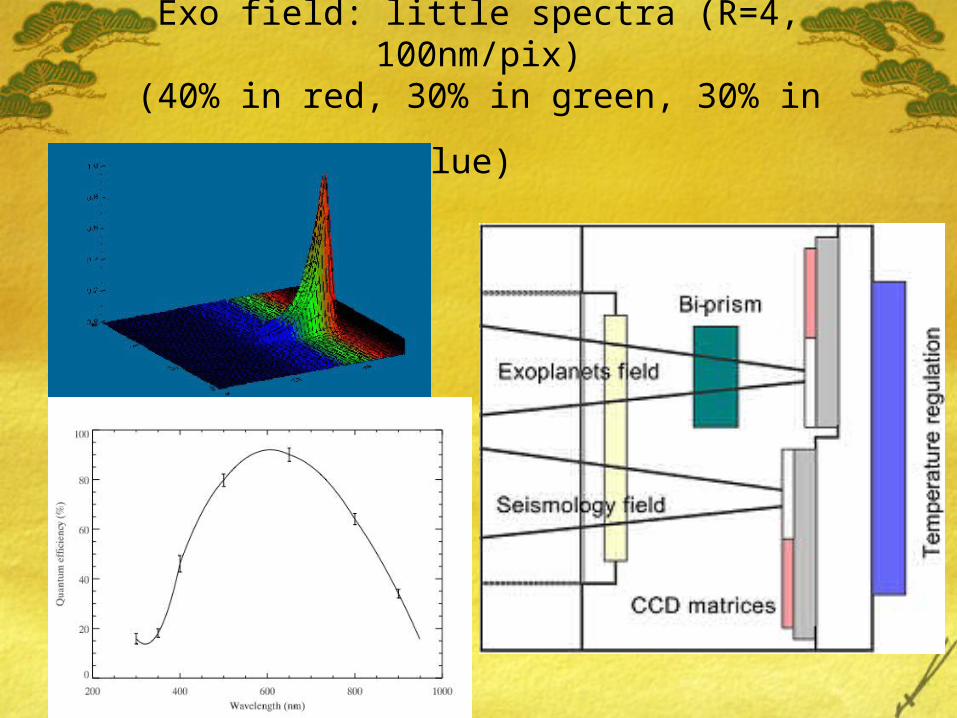
Exo field: little spectra (R=4, 100nm/pix)
(40% in red, 30% in green, 30% in blue)
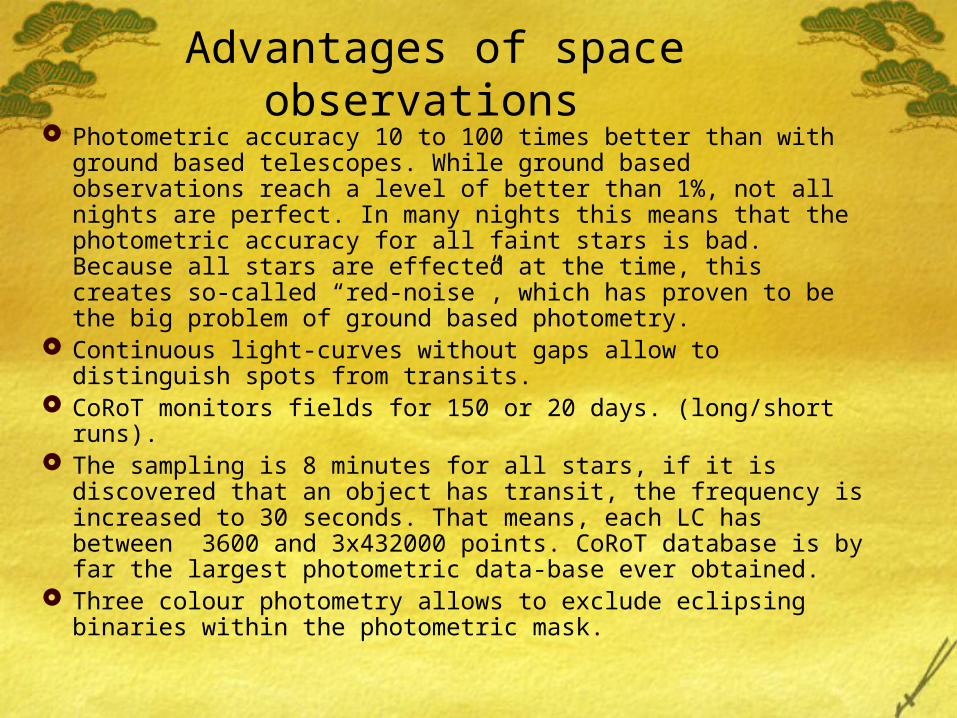
Advantages of space observations
Photometric accuracy 10 to 100 times better than with ground based telescopes. While ground based observations reach a level of better than 1%, not all nights are perfect. In many nights this means that the photometric accuracy for all faint stars is bad. Because all stars are effected at the time, this creates so-called “red-noise”, which has proven to be the big problem of ground based photometry.
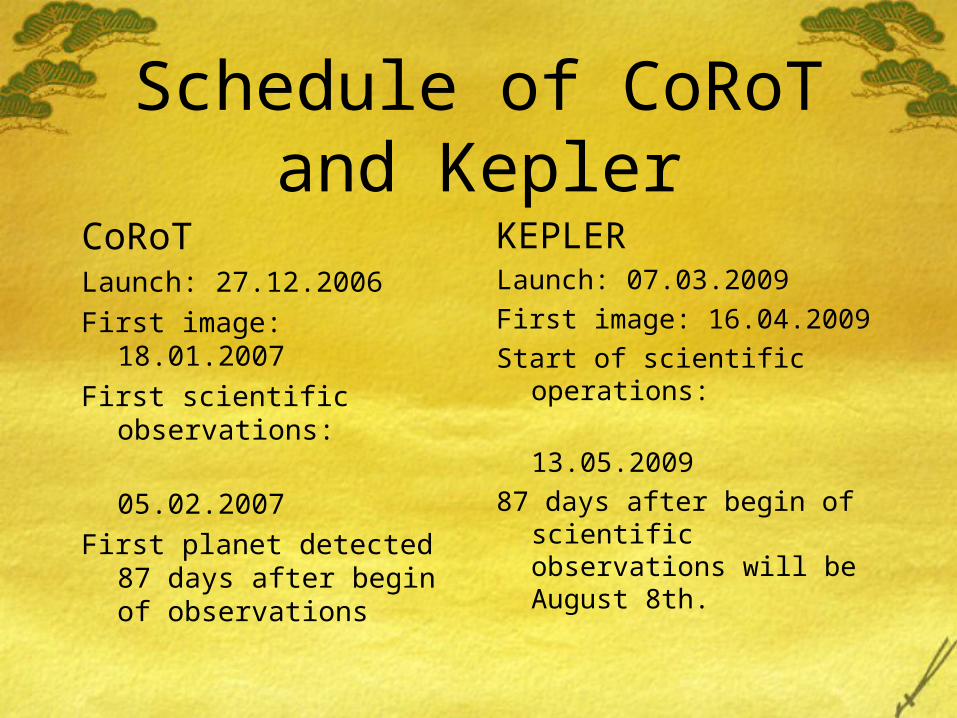
Continuous light-curves without gaps allow to distinguish spots from transits.
CoRoT monitors fields for 150 or 20 days. (long/short runs). The sampling is 8 minutes for all stars, if it is discovered that an
object has transit, the frequency is increased to 30 seconds. That means, each LC has between 3600 and 3x432000 points. CoRoT database is by far the largest photometric data-base ever obtained.
Three colour photometry allows to exclude eclipsing binaries within the photometric mask.
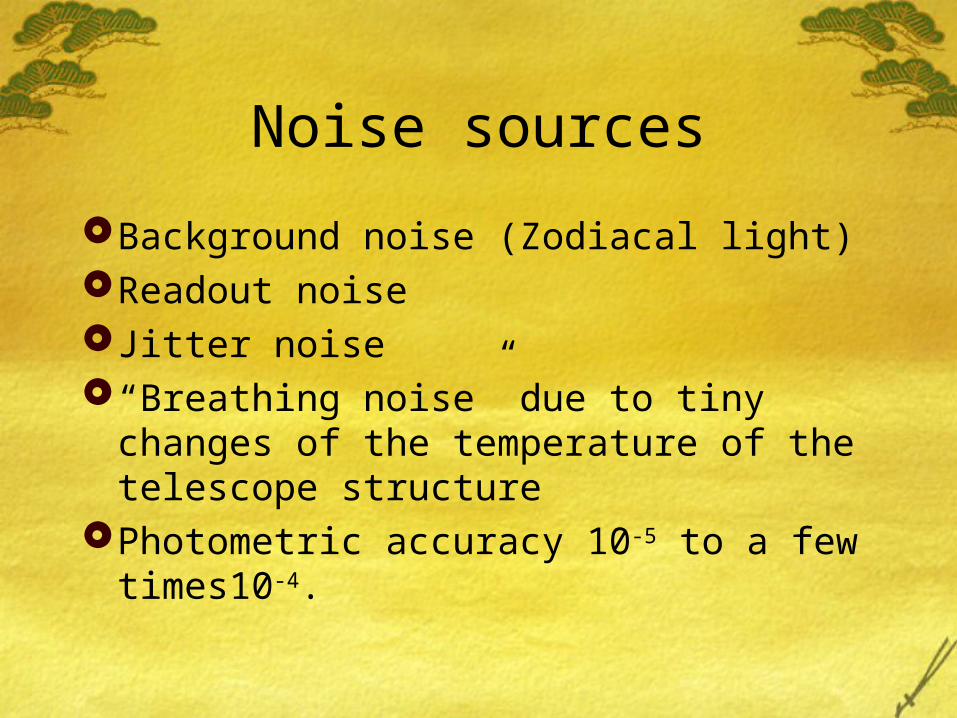
Noise sources
Background noise (Zodiacal light)Readout noiseJitter noise“Breathing noise” due to tiny changes of the
temperature of the telescope structure Photometric accuracy 10-5 to a few times10-4.
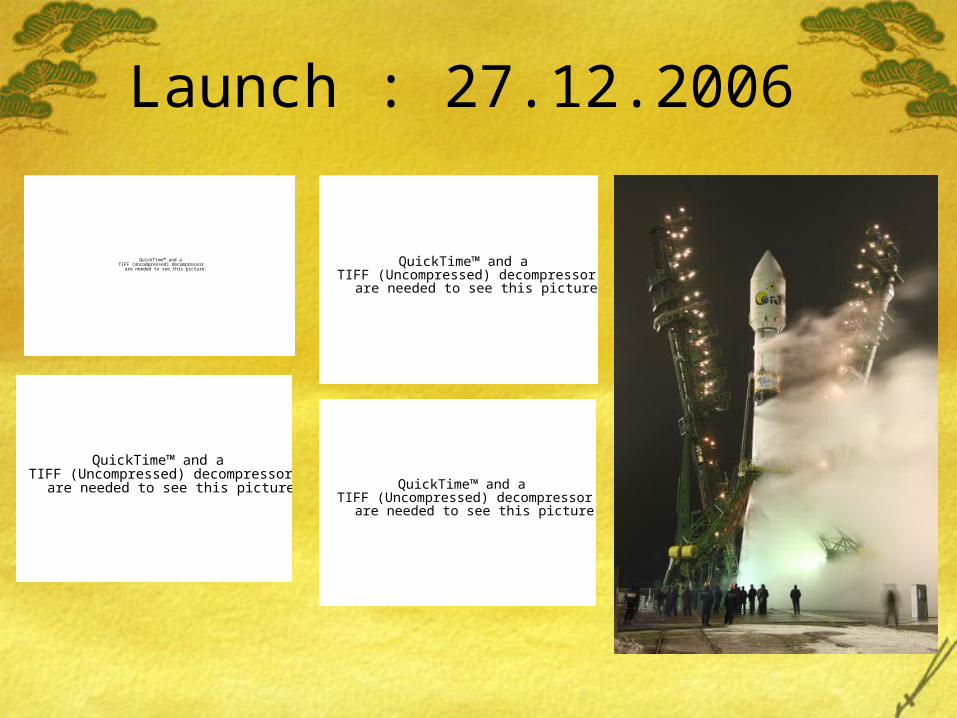
Launch : 27.12.2006
QuickTime™ and aTIFF (Uncompressed) decompressor
are needed to see this picture.
QuickTime™ and aTIFF (Uncompressed) decompressor
are needed to see this picture.
QuickTime™ and aTIFF (Uncompressed) decompressor
are needed to see this picture.
QuickTime™ and aTIFF (Uncompressed) decompressor
are needed to see this picture.
Orbital parameters
Semi major axis 7276.3 kmOrbital inclination 90 degreesEccentricity 0.00127
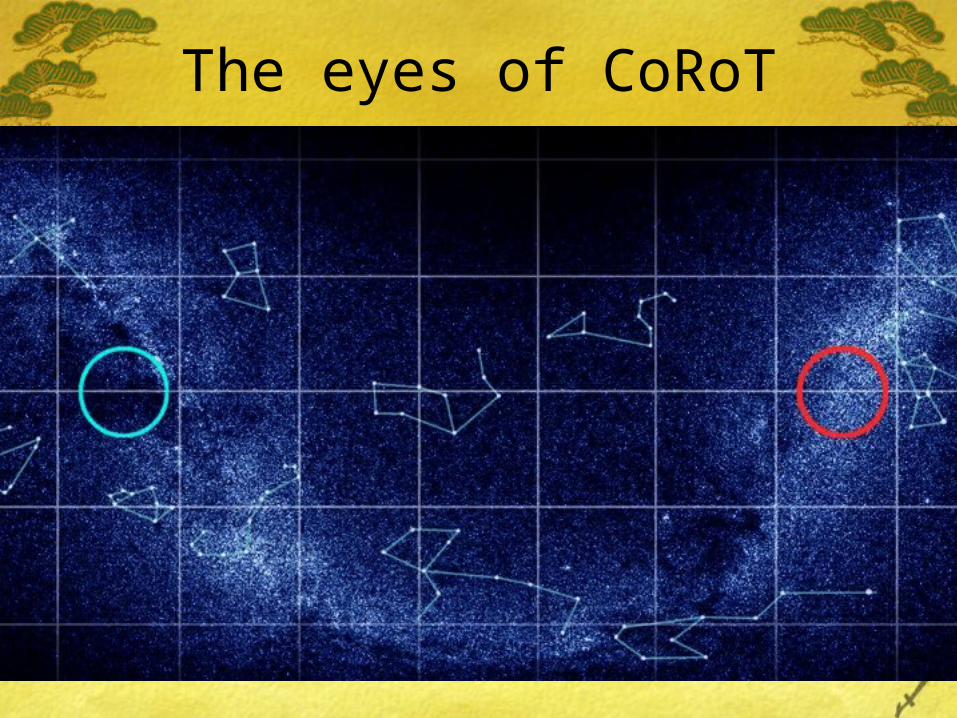
The eyes of CoRoT
Observations in pace versus ground:
Observations in space allow continuous monitoring. That means we can detect transit of planets with much longer orbital period. Here is a comparison with SuperWASP, which is located at the island of La Palma.
QuickTime™ and aTIFF (Uncompressed) decompressor
are needed to see this picture.
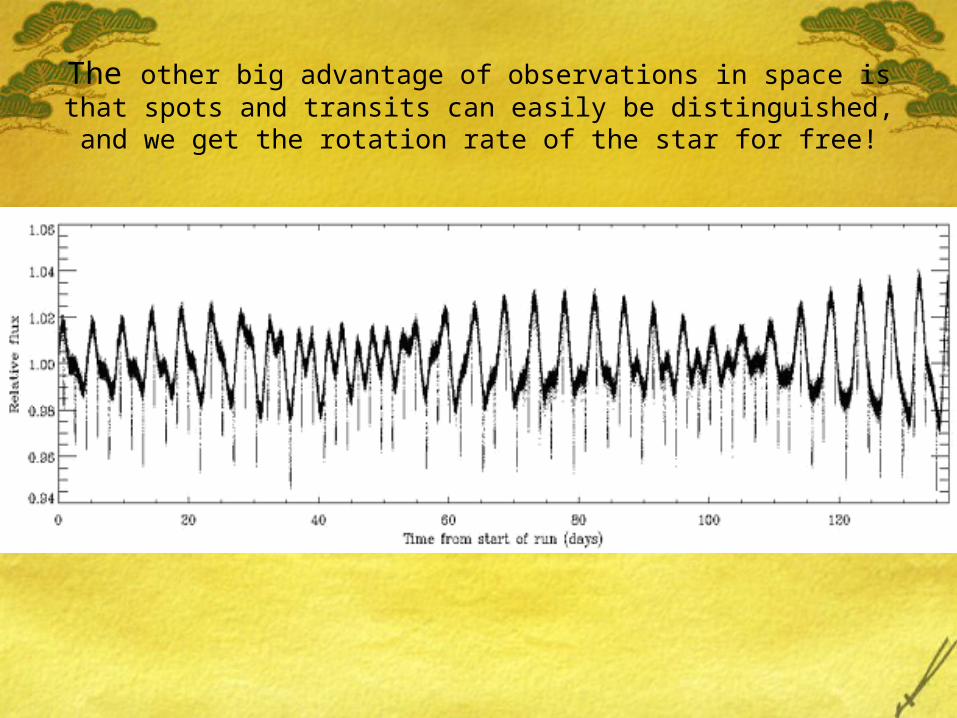
The other big advantage of observations in space is that spots and transits can easily be distinguished, and we get the rotation
rate of the star for free!
Stars that are being observed
In order to get statistically meaningful results, we have to determine the spectral types (mass) of all the stars that we are looking at.
A first analysis of the CoRoT data shows that ground based observations detect only 10% of the hot Jupiters that are in principle within reach. This is an effect of the red noise and very often also the day/night gaps of ground based observations.
How do we determine the spectral types of 1000nds of stars?
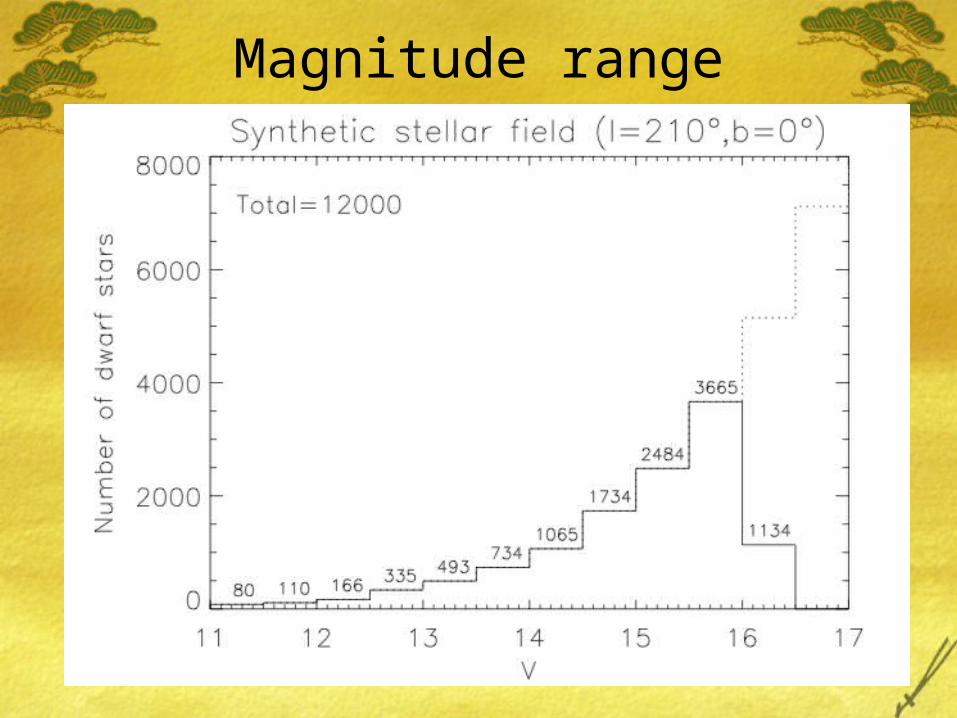
Magnitude range
The superb photometric archive created by The superb photometric archive created by CoRoTCoRoT allows us to address a large variety of different scientific allows us to address a large variety of different scientific
questions.questions.
However, for all these projects we need to know what However, for all these projects we need to know what kind of star we are looking at. kind of star we are looking at.
Teff , Lum. Class, log(g), [Fe/H], Av , RV, vsin(i), stellar Teff , Lum. Class, log(g), [Fe/H], Av , RV, vsin(i), stellar activity level, age, etc.activity level, age, etc.
Why do we need spectroscopy?Why do we need spectroscopy?
We don't want to waste time!We don't want to waste time!
Multi Object Spectroscopy (MOS)Multi Object Spectroscopy (MOS)
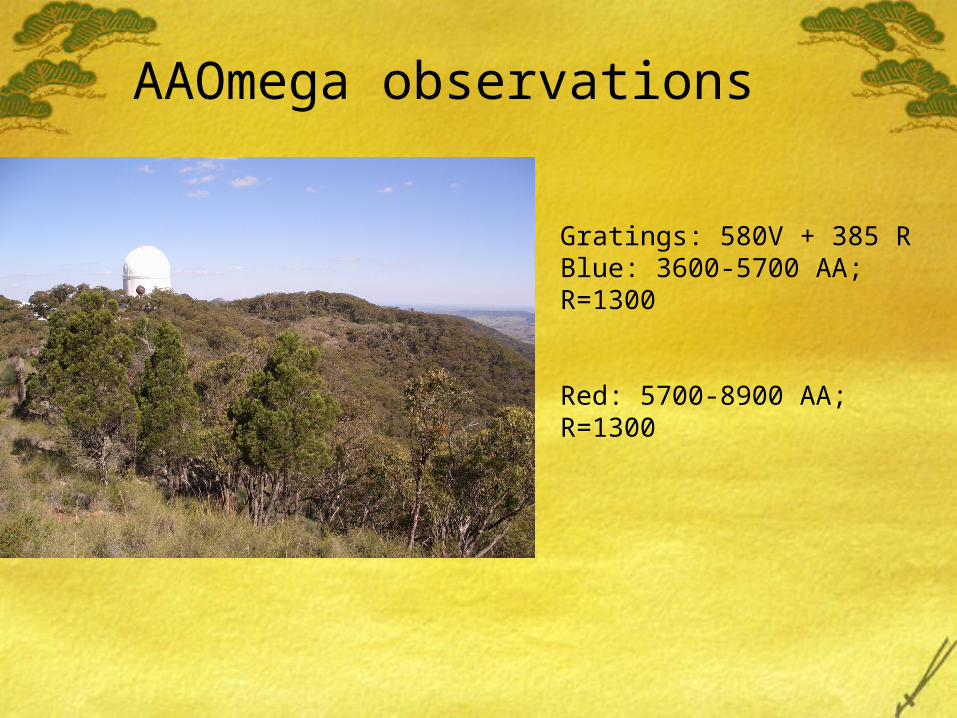
AAOmega observations
Gratings: 580V + 385 RBlue: 3600-5700 AA; R=1300
Red: 5700-8900 AA; R=1300
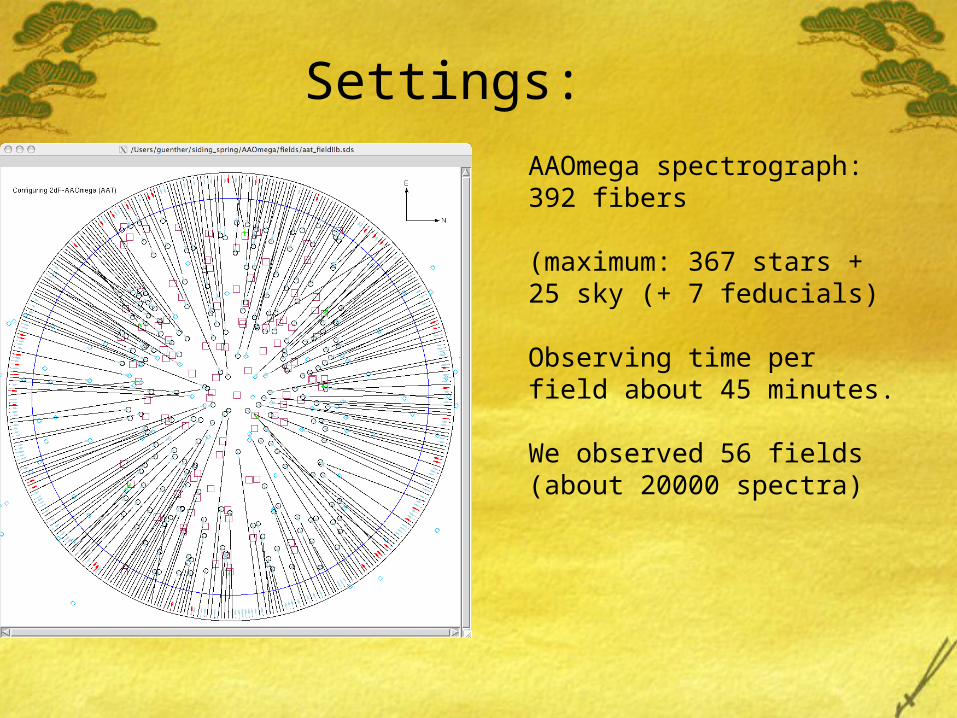
Settings: AAOmega spectrograph: 392 fibers
(maximum: 367 stars + 25 sky (+ 7 feducials)
Observing time per field about 45 minutes.
We observed 56 fields (about 20000 spectra)
How do we determine the How do we determine the Spectral Type from the low-Spectral Type from the low-
resolution spectra?resolution spectra?
– Method => we fit each observed spectrum with a suitable grid of templates, taking the amount of extinction along the line of sight into account.
– What is needed? => Library of flux-calibrated and de-reddened stellar spectra covering our spectral range.
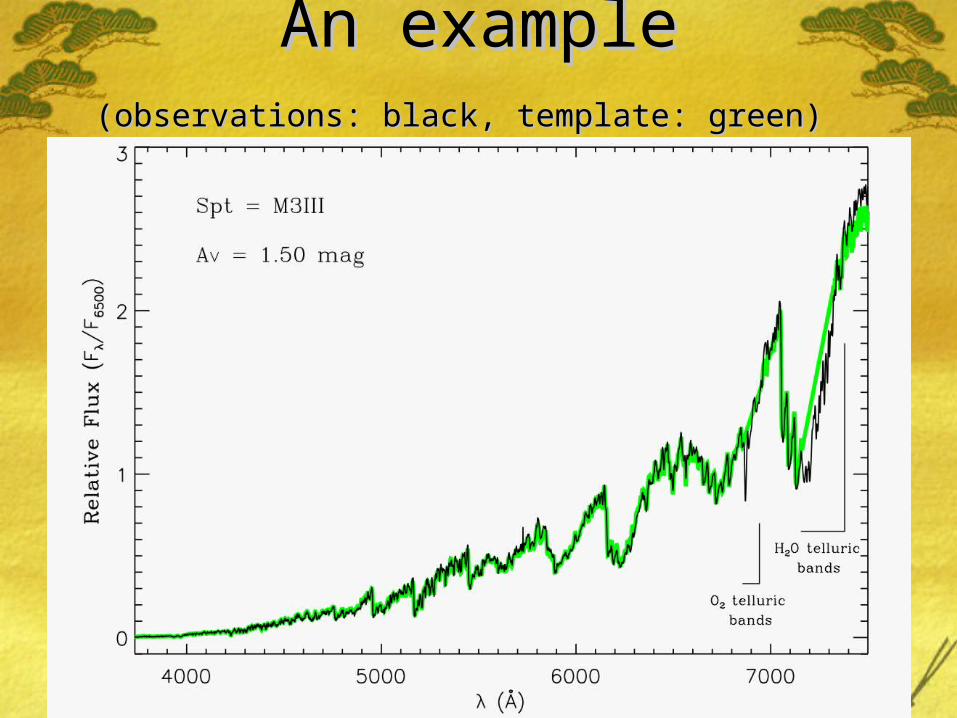
An exampleAn example(observations: black, template: green)(observations: black, template: green)

........another example............another example......
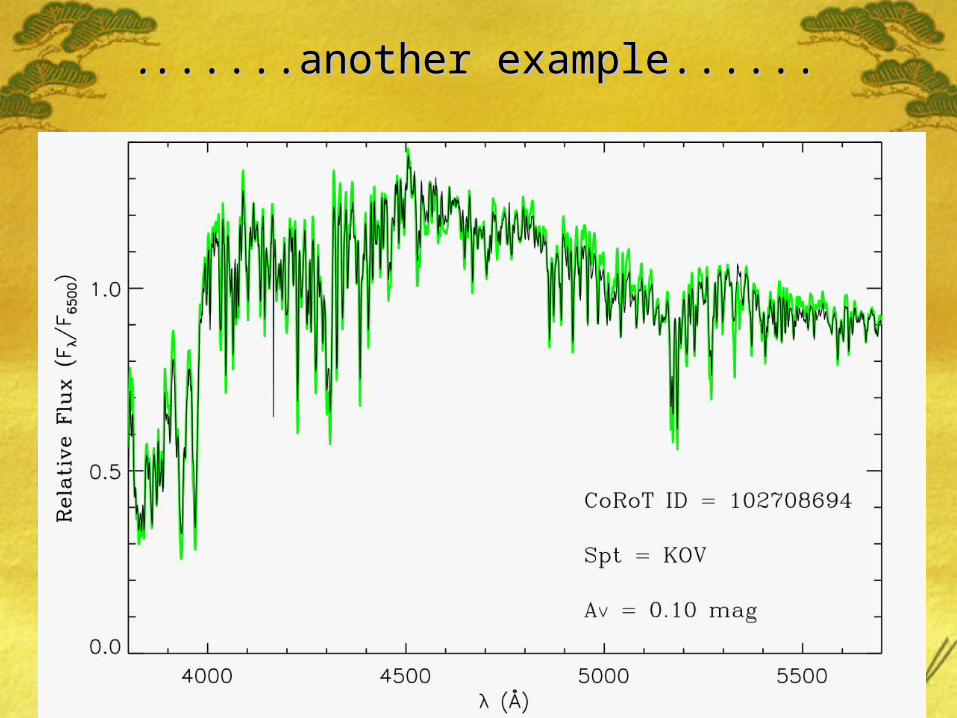
........another example............another example......
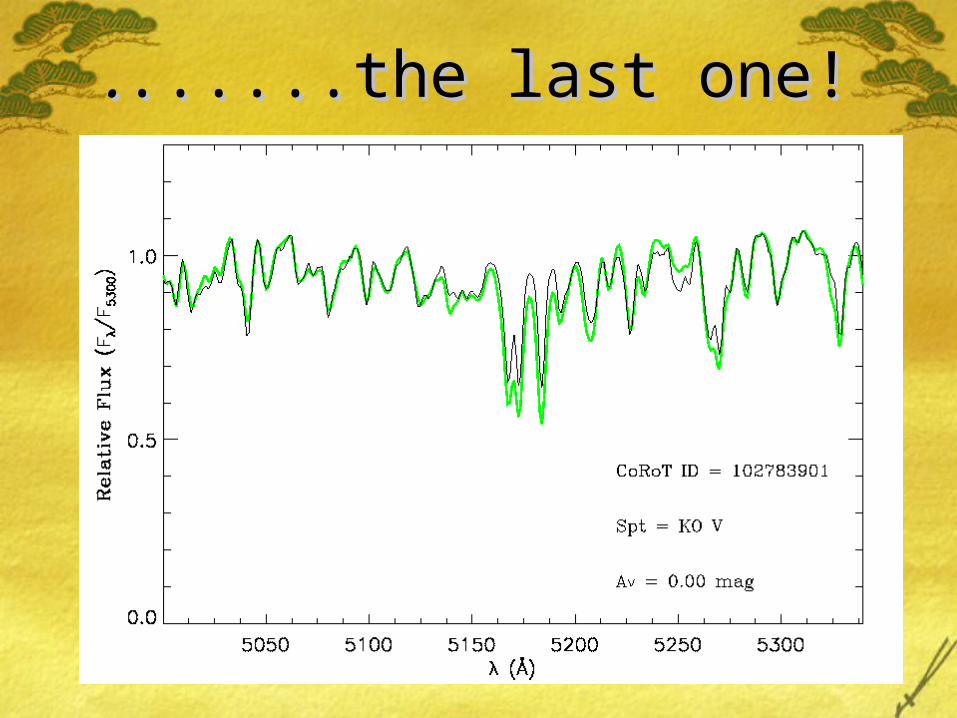
........the last one!......the last one!
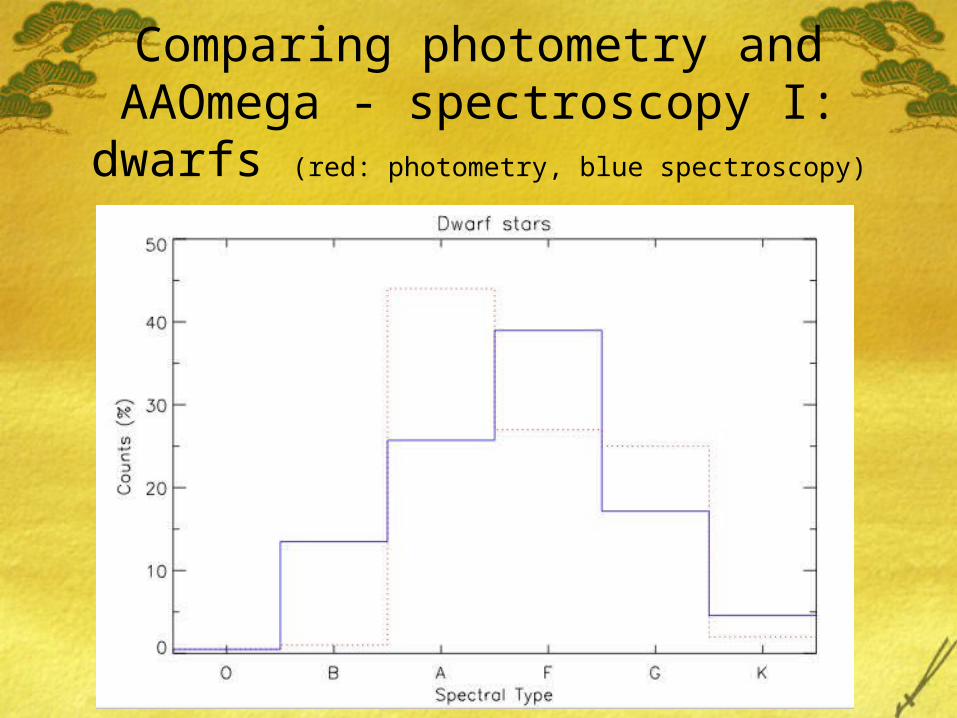
Comparing photometry and AAOmega - spectroscopy I: dwarfs (red: photometry, blue spectroscopy)
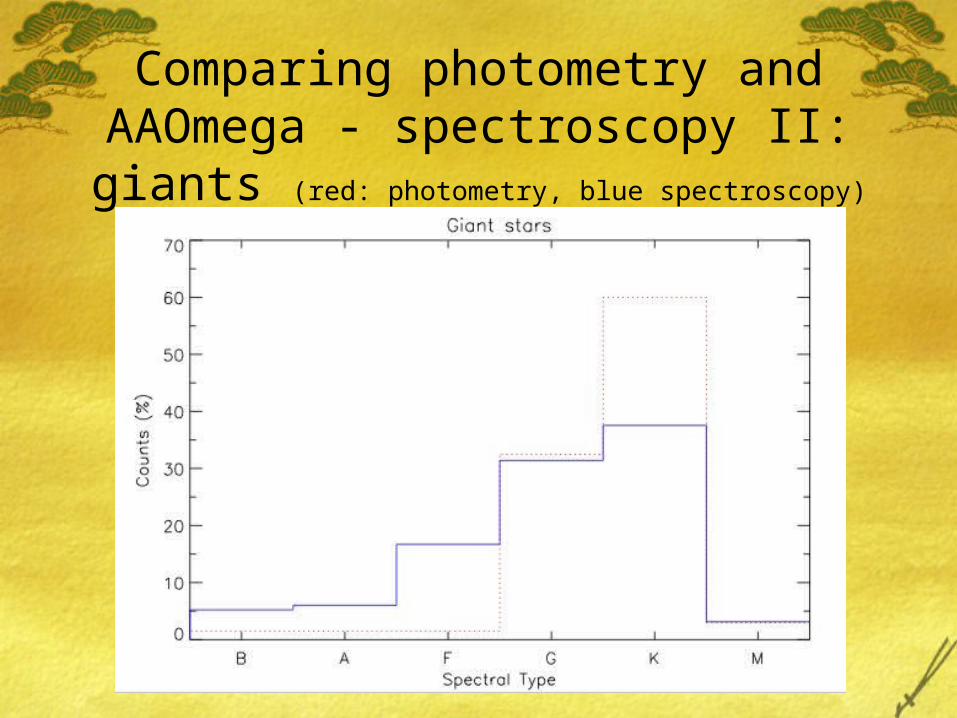
Comparing photometry and AAOmega - spectroscopy II: giants (red: photometry, blue spectroscopy)
CoRoT is a space telescope but we still need lots of observations with ground-based
telescopes:
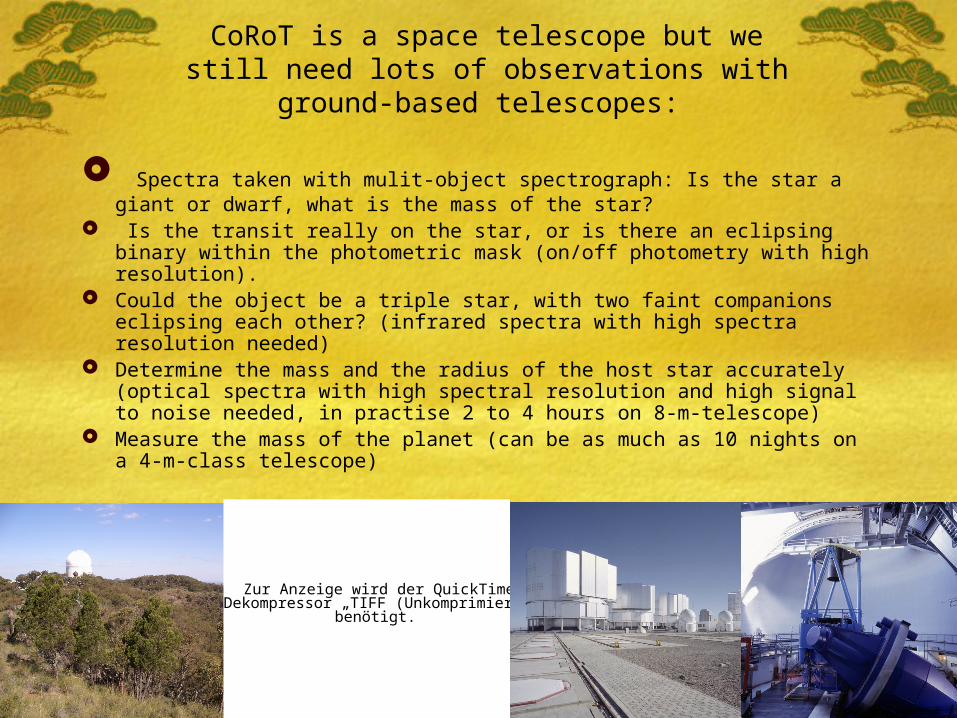
Spectra taken with mulit-object spectrograph: Is the star a giant or dwarf, what is the mass of the star?
Is the transit really on the star, or is there an eclipsing binary within the photometric mask (on/off photometry with high resolution).
Could the object be a triple star, with two faint companions eclipsing each other? (infrared spectra with high spectra resolution needed)
Determine the mass and the radius of the host star accurately (optical spectra with high spectral resolution and high signal to noise needed, in practise 2 to 4 hours on 8-m-telescope)
Measure the mass of the planet (can be as much as 10 nights on a 4-m-class telescope)
Zur Anzeige wird der QuickTime™ Dekompressor „TIFF (Unkomprimiert)“
benötigt.
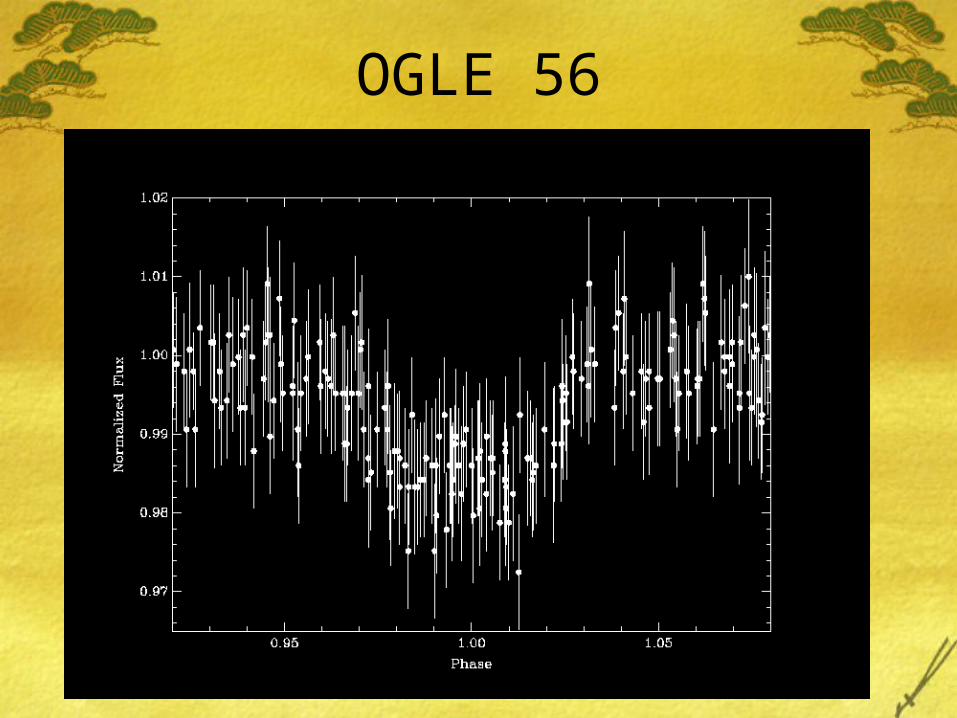
OGLE 56
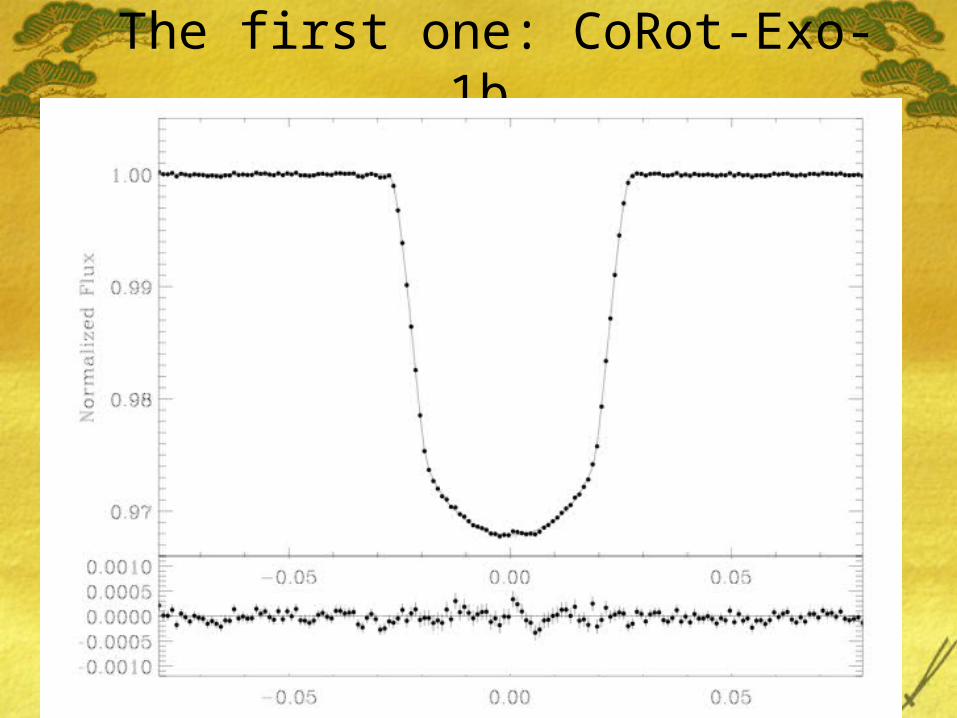
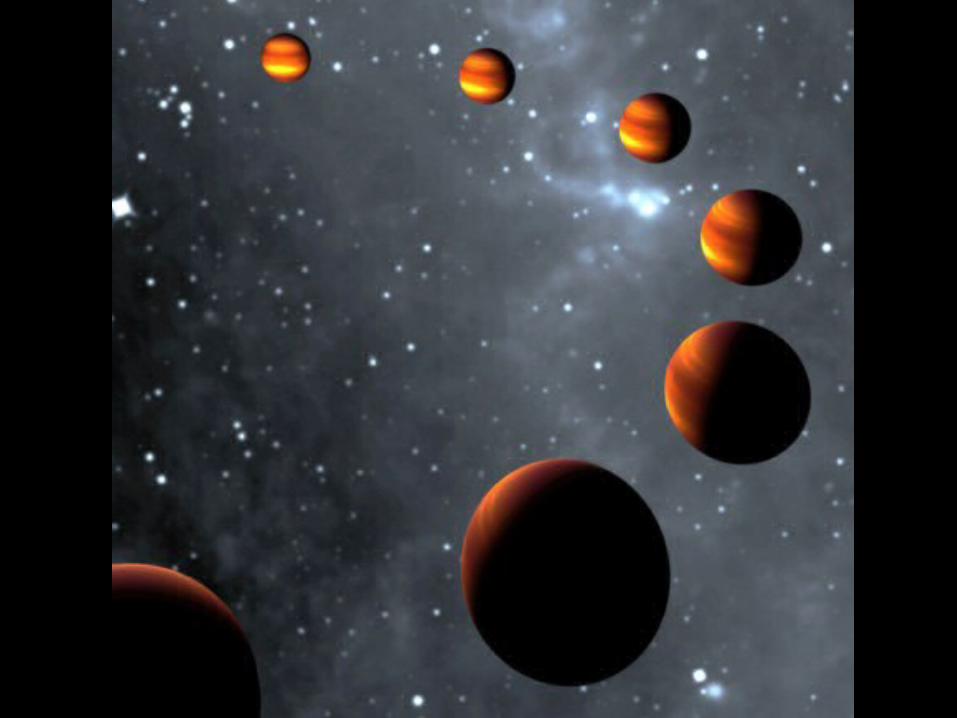
The first one: CoRot-Exo-1b
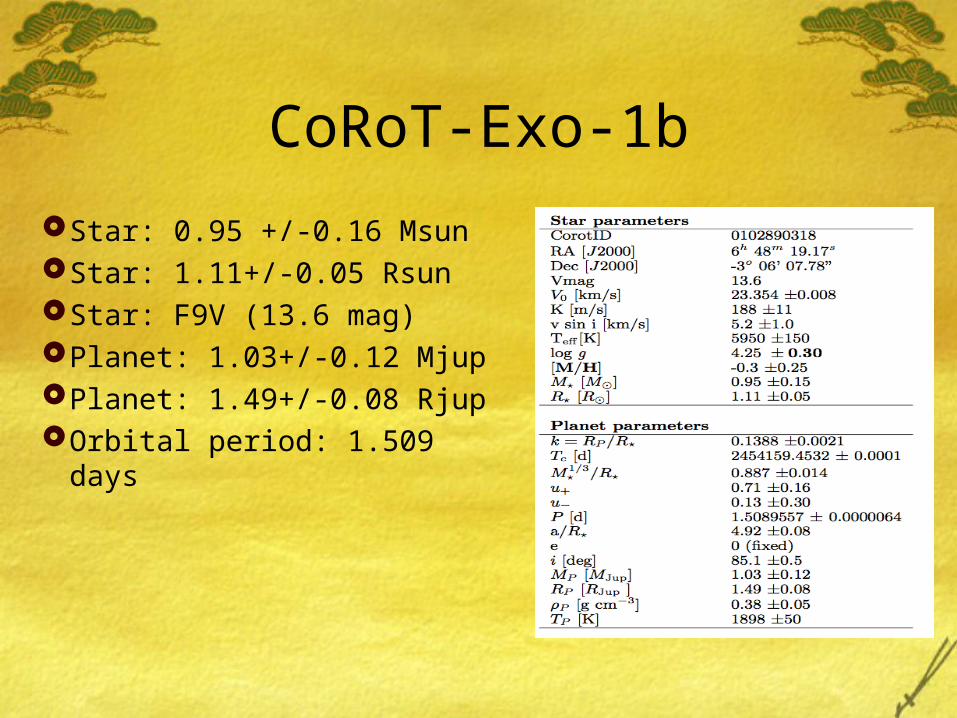
CoRoT-Exo-1b
Star: 0.95 +/-0.16 MsunStar: 1.11+/-0.05 RsunStar: F9V (13.6 mag)Planet: 1.03+/-0.12 MjupPlanet: 1.49+/-0.08 RjupOrbital period: 1.509 days
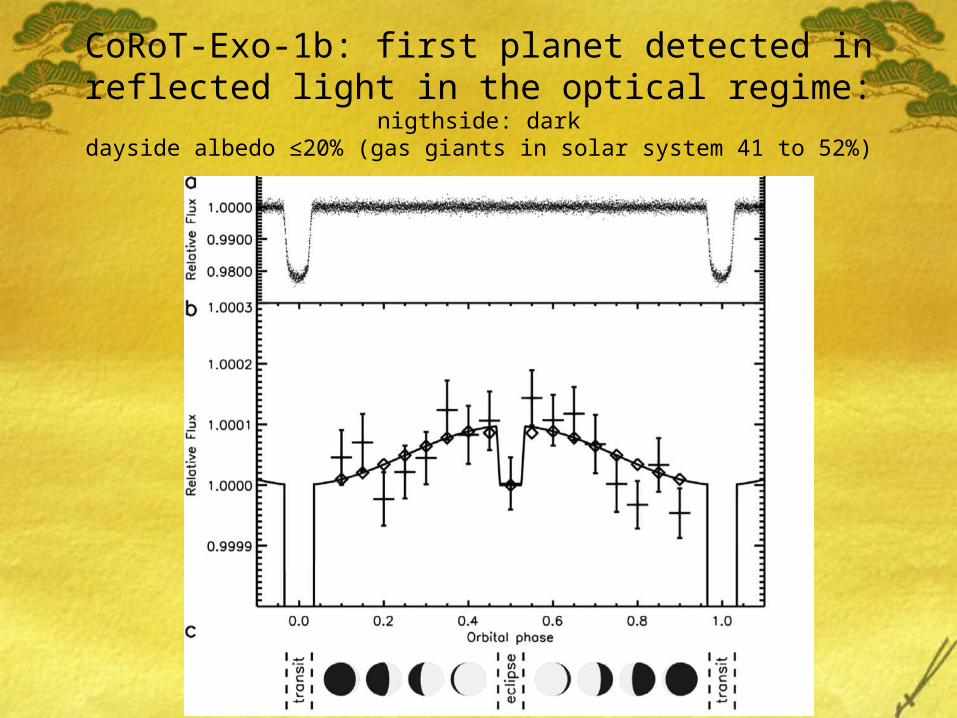
CoRoT-Exo-1b: first planet detected in reflected light in the optical regime:
nigthside: darkdayside albedo ≤20% (gas giants in solar system 41 to 52%)
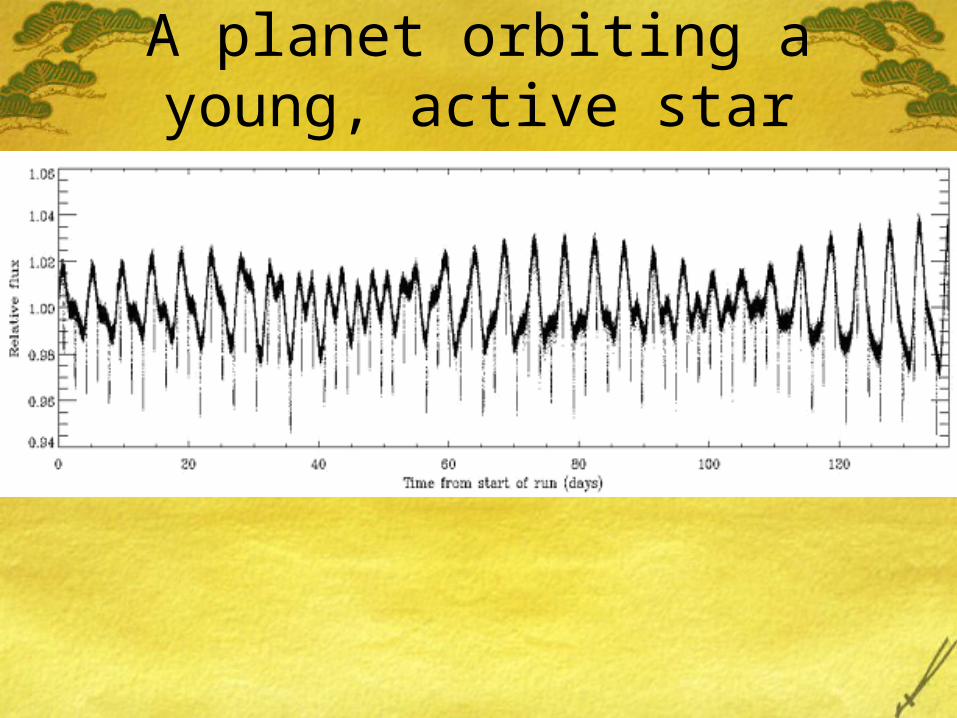
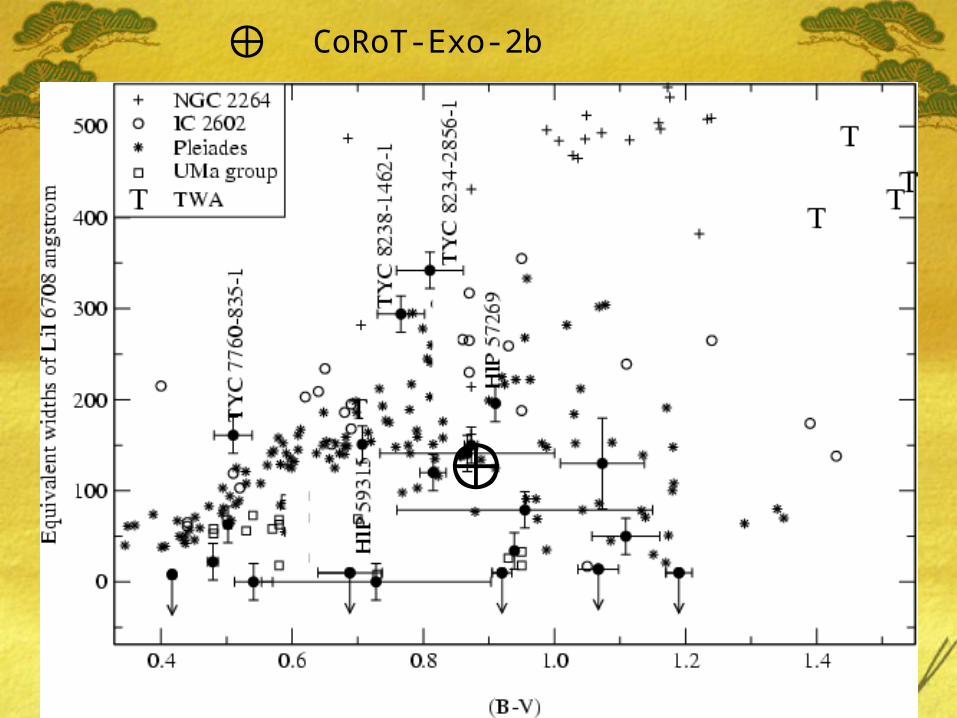
A planet orbiting a young, active star
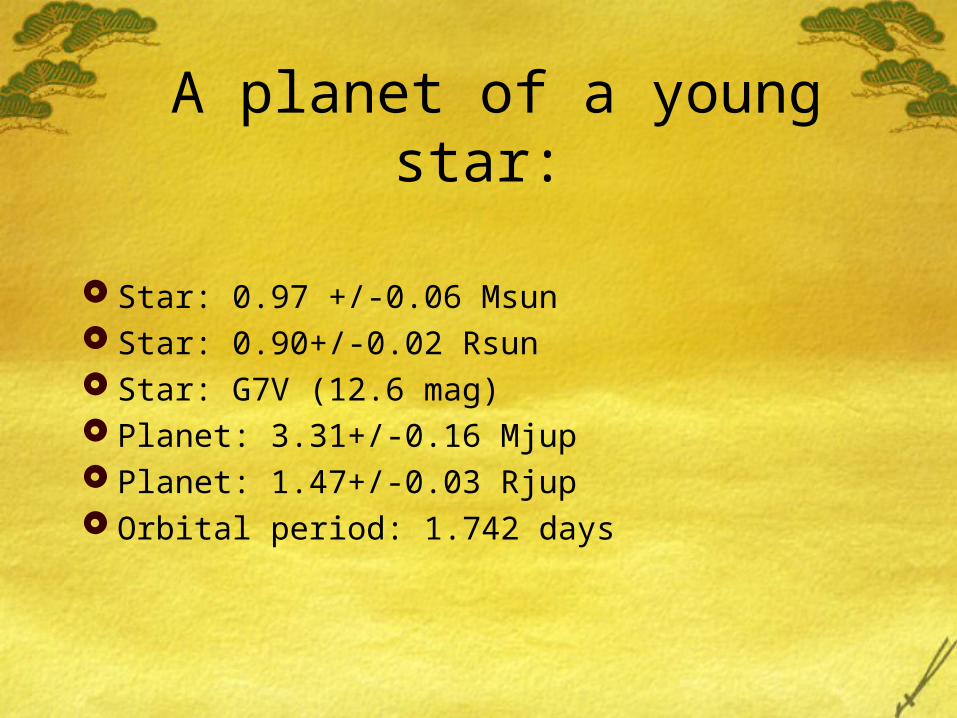
A planet of a young star:
Star: 0.97 +/-0.06 Msun Star: 0.90+/-0.02 Rsun Star: G7V (12.6 mag) Planet: 3.31+/-0.16 Mjup Planet: 1.47+/-0.03 Rjup Orbital period: 1.742 days
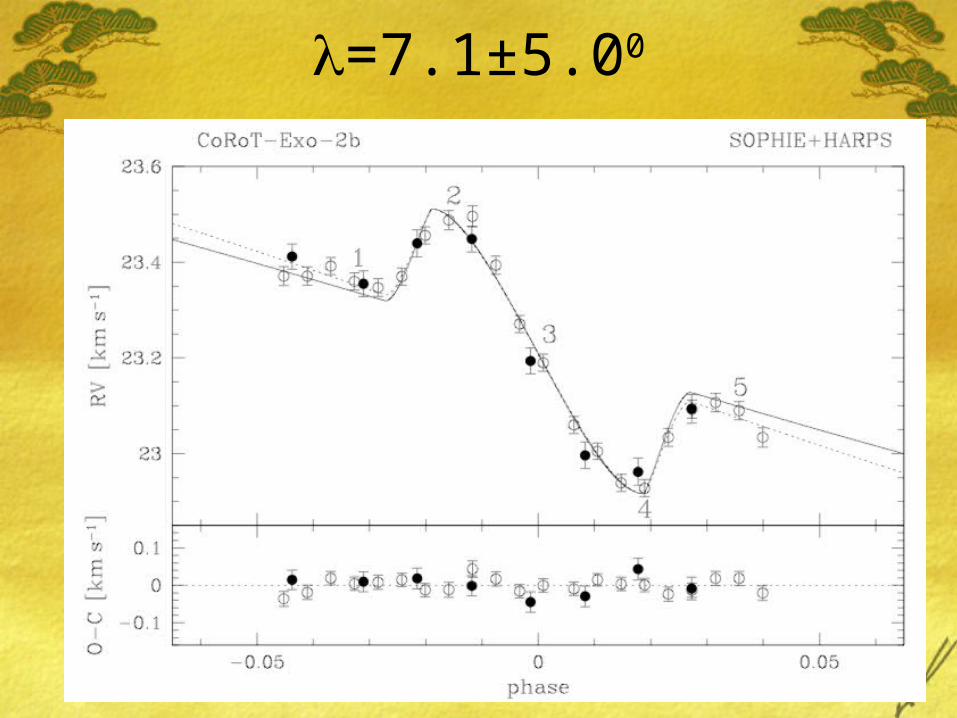
=7.1±5.00
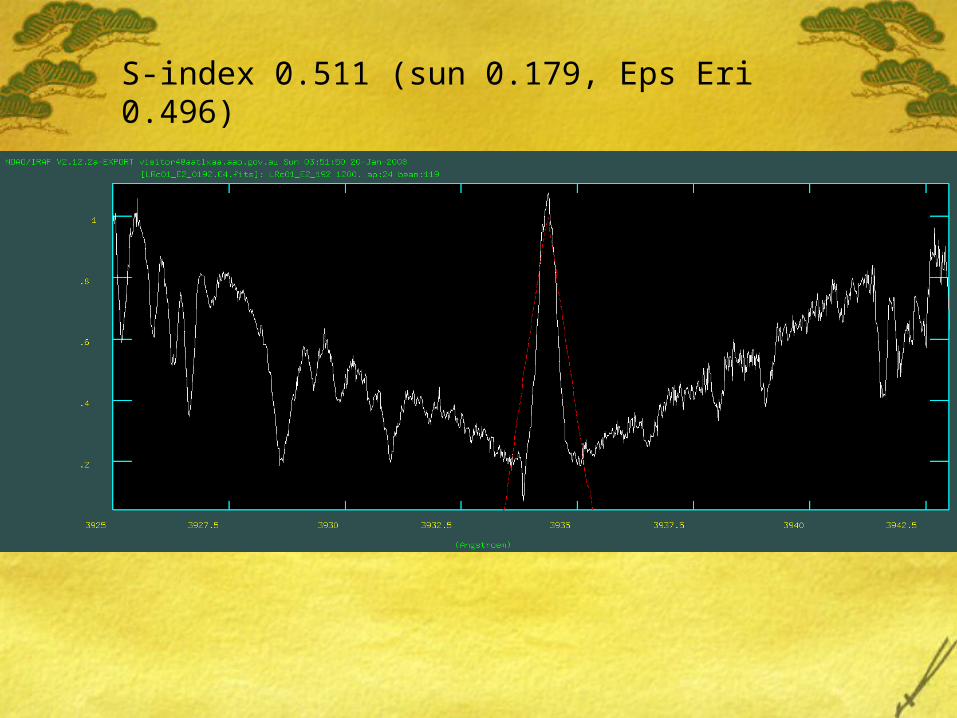
S-index 0.511 (sun 0.179, Eps Eri 0.496)
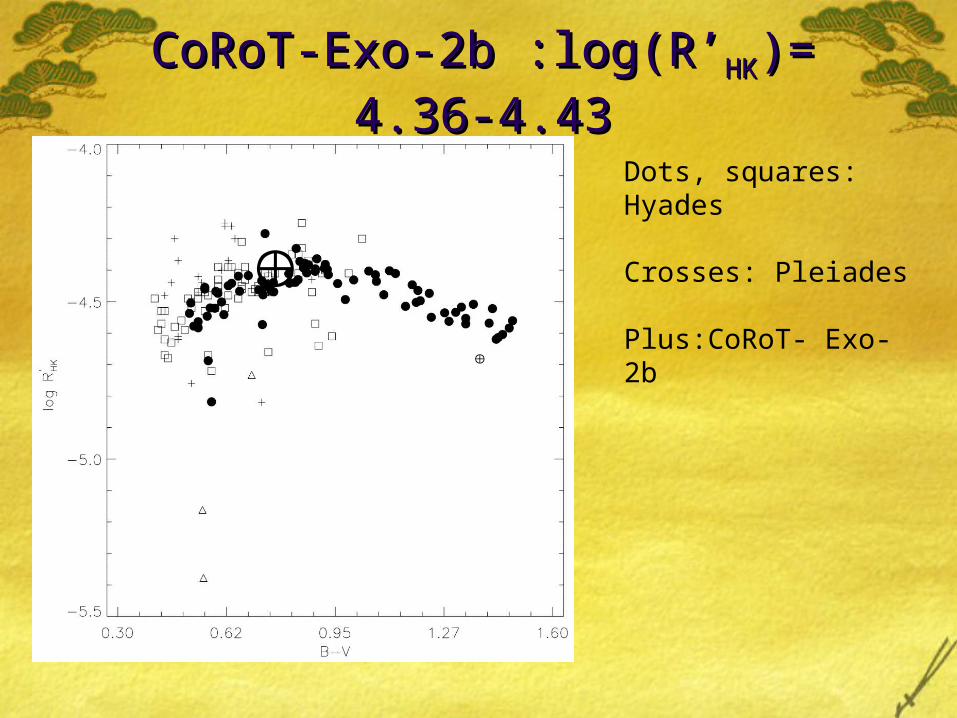
CoRoT-Exo-2b :log(R’CoRoT-Exo-2b :log(R’HKHK)= 4.36-4.43)= 4.36-4.43
Dots, squares: Hyades
Crosses: Pleiades
Plus:CoRoT- Exo-2b
€
⊕
€
⊕
€
⊕
€
⊕ CoRoT-Exo-2b
An interesting aspect:
We know that the eccentricity is very small (possibly < 0.000046)
This means that the orbit circularized very quickly. This means the tidal interaction must be very strong. The planet will spiral into the star!
QuickTime™ and aTIFF (Uncompressed) decompressor
are needed to see this picture.
NGC 2264(distance 760pc, age 3 Myr)
A brown dwarf orbiting a normal star
Star: 1.27 +/-0.05 Msun Star: 1.305+/-0.02 Rsun Star: G0V (13.3 mag) Planet: 20.2 Mjup Planet: 0.829 Rjup Orbital period: 4.25 days
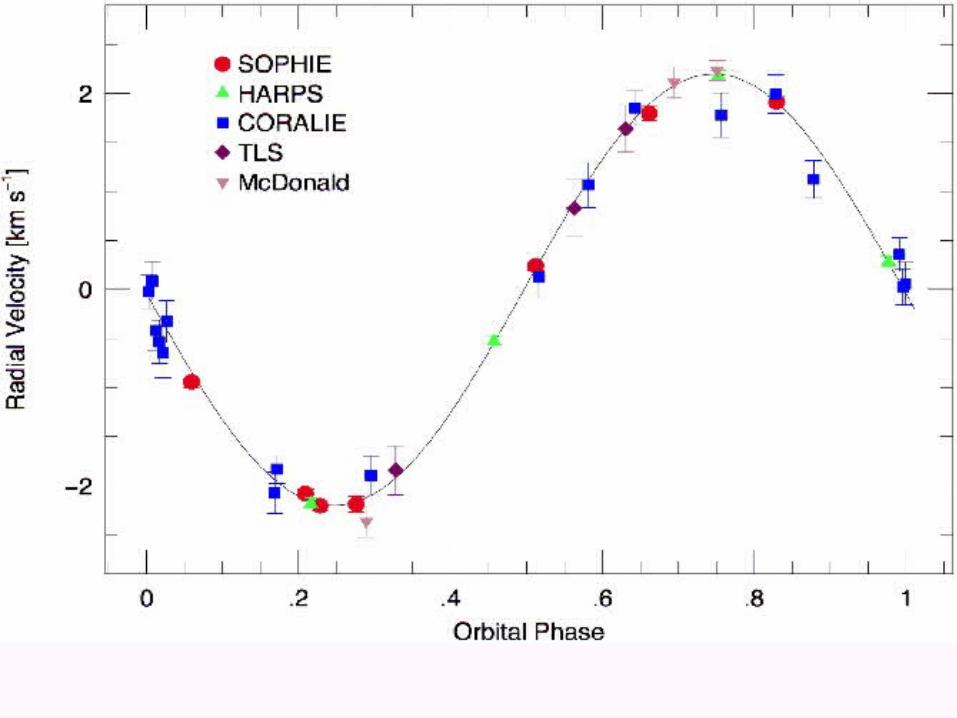
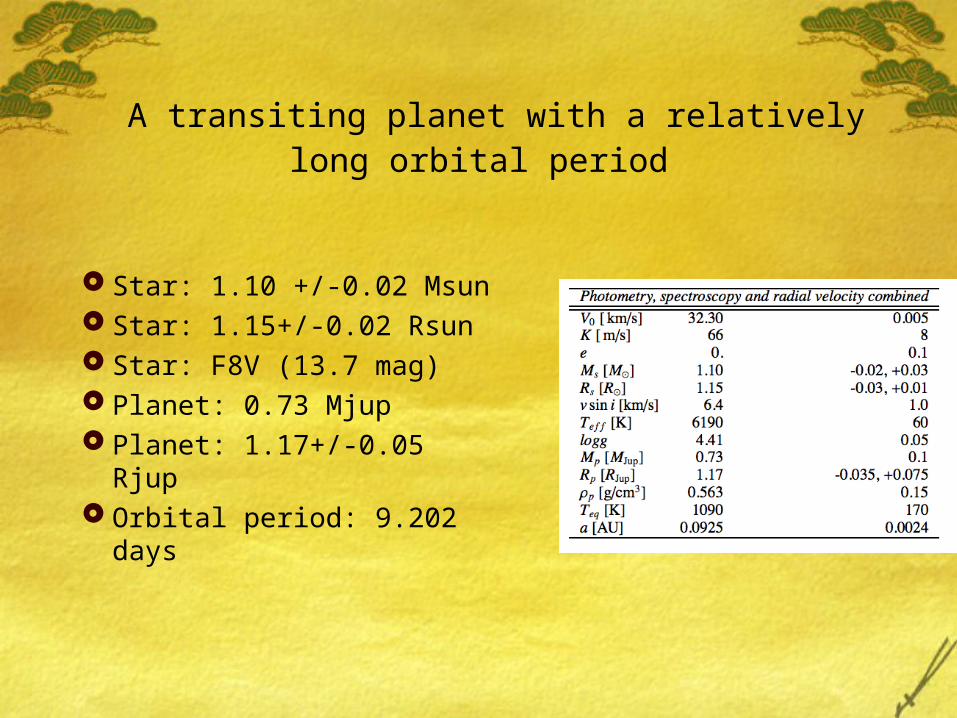
A transiting planet with a relatively long orbital period
Star: 1.10 +/-0.02 Msun Star: 1.15+/-0.02 Rsun Star: F8V (13.7 mag) Planet: 0.73 Mjup Planet: 1.17+/-0.05 Rjup Orbital period: 9.202 days
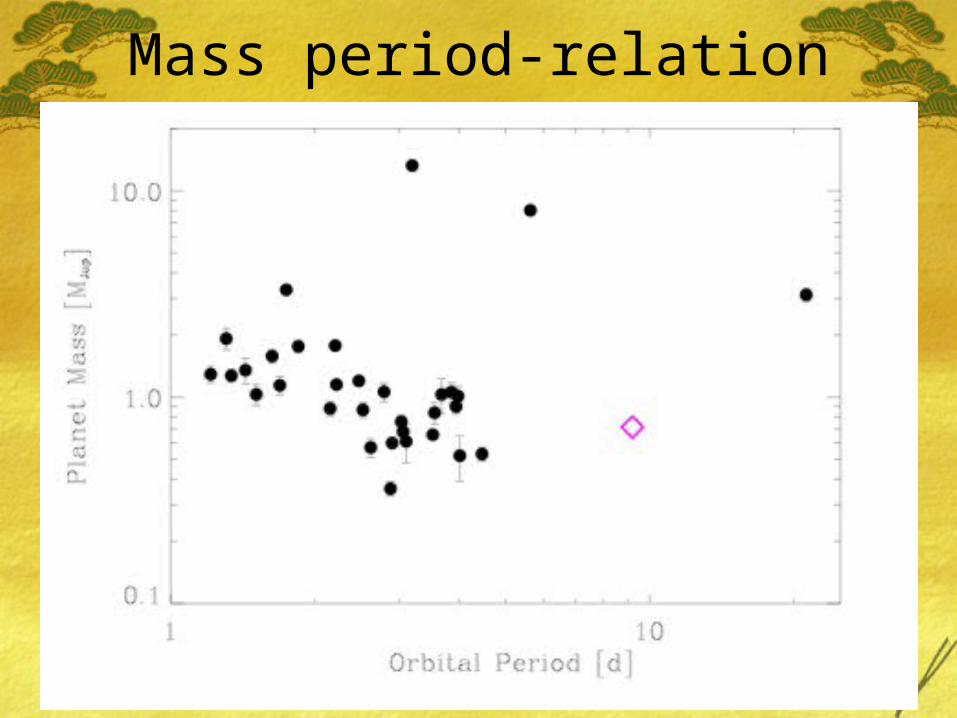
Mass period-relation
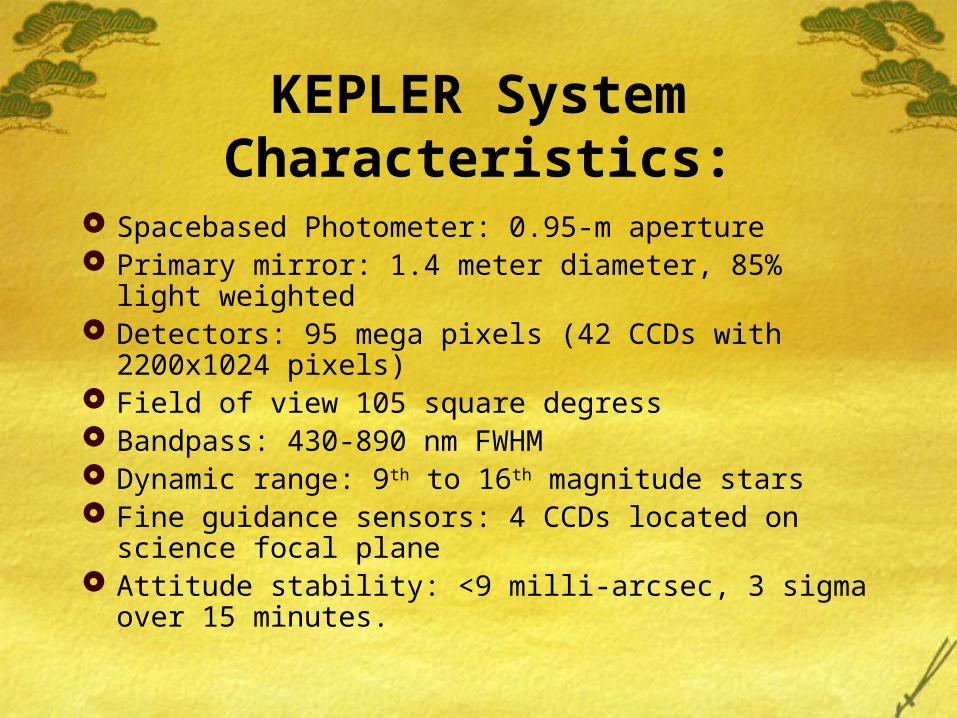
KEPLER System Characteristics:
Spacebased Photometer: 0.95-m aperture Primary mirror: 1.4 meter diameter, 85% light
weighted Detectors: 95 mega pixels (42 CCDs with
2200x1024 pixels) Field of view 105 square degress Bandpass: 430-890 nm FWHM Dynamic range: 9th to 16th magnitude stars Fine guidance sensors: 4 CCDs located on science
focal plane Attitude stability: <9 milli-arcsec, 3 sigma over 15
minutes.
QuickTime™ and aTIFF (Uncompressed) decompressor
are needed to see this picture.
QuickTime™ and aTIFF (Uncompressed) decompressor
are needed to see this picture.
QuickTime™ and aTIFF (Uncompressed) decompressor
are needed to see this picture.
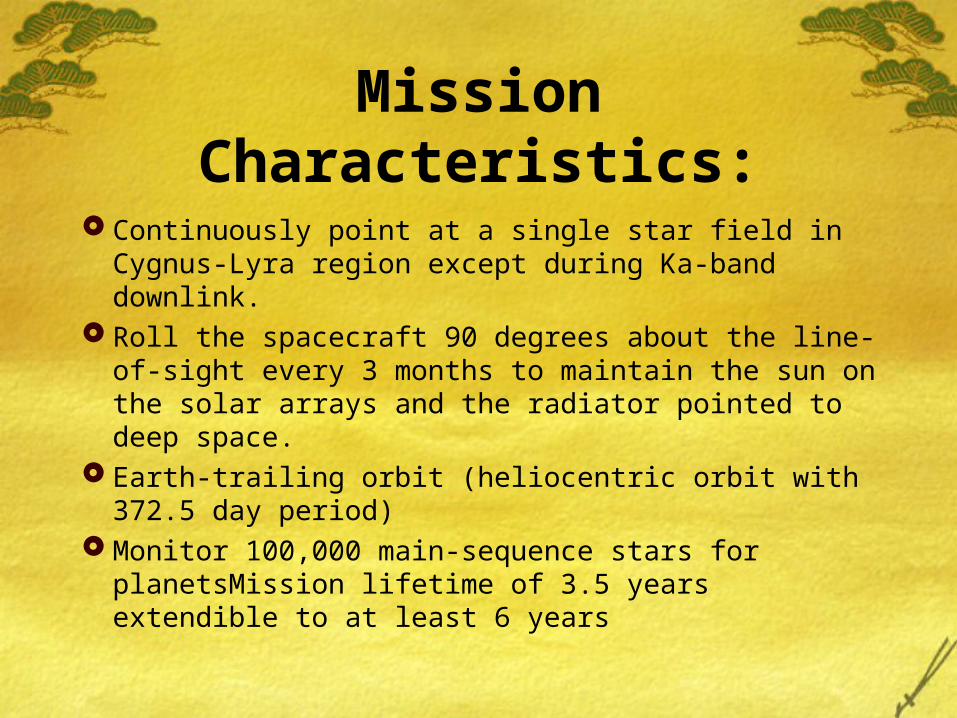
Mission Characteristics:
Continuously point at a single star field in Cygnus-Lyra region except during Ka-band downlink.
Roll the spacecraft 90 degrees about the line-of-sight every 3 months to maintain the sun on the solar arrays and the radiator pointed to deep space.
Earth-trailing orbit (heliocentric orbit with 372.5 day period)
Monitor 100,000 main-sequence stars for planetsMission lifetime of 3.5 years extendible to at least 6 years

QuickTime™ and aTIFF (Uncompressed) decompressor
are needed to see this picture.
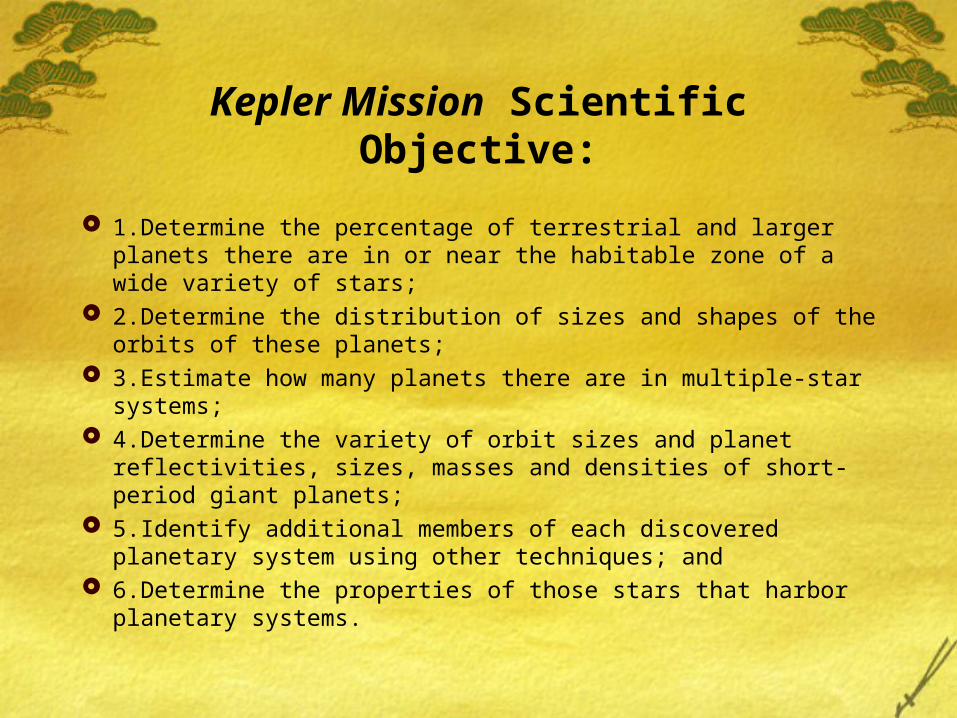
Kepler Mission Scientific Objective:
1.Determine the percentage of terrestrial and larger planets there are in or near the habitable zone of a wide variety of stars;
2.Determine the distribution of sizes and shapes of the orbits of these planets;
3.Estimate how many planets there are in multiple-star systems;
4.Determine the variety of orbit sizes and planet reflectivities, sizes, masses and densities of short-period giant planets;
5.Identify additional members of each discovered planetary system using other techniques; and
6.Determine the properties of those stars that harbor planetary systems.
Kepler: first light: March 6th 2009
QuickTime™ and aTIFF (Uncompressed) decompressor
are needed to see this picture.