Embed Size (px)
Citation preview
Astronomy & Astrophysics manuscript no. article c© ESO 2018October 26, 2018
Transiting exoplanets from the CoRoT space mission?
XVIII. CoRoT-18b: a massive hot jupiter on a prograde, nearly aligned orbit
G. Hebrard1,2, T. M. Evans3, R. Alonso4, M. Fridlund5, A. Ofir6, S. Aigrain3, T. Guillot7, J. M. Almenara8,9,M. Auvergne10, A. Baglin10, P. Barge8, A. S. Bonomo8, P. Borde11, F. Bouchy1,2, J. Cabrera12, L. Carone13,
S. Carpano5, C. Cavarroc11, Sz. Csizmadia12, H. J. Deeg9, M. Deleuil8, R. F. Dıaz1,2, R. Dvorak14,A. Erikson12, S. Ferraz-Mello15, D. Gandolfi5, N. Gibson3, M. Gillon16, E. Guenther17, A. Hatzes17,
M. Havel7, L. Jorda8, H. Lammer18, A. Leger11, A. Llebaria8, T. Mazeh6, C. Moutou8, M. Ollivier11,H. Parviainen9, M. Patzold13, D. Queloz4, H. Rauer12,19, D. Rouan10, A. Santerne8, J. Schneider20,
B. Tingley9, and G. Wuchterl17
(Affiliations can be found after the references)
Received ; accepted
ABSTRACT
We report the detection of CoRoT-18b, a massive hot jupiter transiting in front of its host star with a period of 1.9000693 ±0.0000028 days. This planet was discovered thanks to photometric data secured with the CoRoT satellite combined withspectroscopic and photometric ground-based follow-up observations. The planet has a mass Mp = 3.47 ± 0.38 MJup, a radiusRp = 1.31 ± 0.18 RJup, and a density ρp = 2.2 ± 0.8 g/cm3. It orbits a G9V star with a mass M? = 0.95 ± 0.15 M�, a radiusR? = 1.00± 0.13 R�, and a rotation period Prot = 5.4± 0.4 days. The age of the system remains uncertain, with stellar evolutionmodels pointing either to a few tens Ma or several Ga, while gyrochronology and lithium abundance point towards ages of a fewhundred Ma. This mismatch potentially points to a problem in our understanding of the evolution of young stars, with possiblysignificant implications for stellar physics and the interpretation of inferred sizes of exoplanets around young stars. We detectedthe Rossiter-McLaughlin anomaly in the CoRoT-18 system thanks to the spectroscopic observation of a transit. We measured theobliquity ψ = 20◦ ± 20◦ (sky-projected value λ = −10◦ ± 20◦), indicating that the planet orbits in the same way as the star isrotating and that this prograde orbit is nearly aligned with the stellar equator.
Key words. stars: planetary systems - techniques: photometry - techniques: radial velocities - techniques: spectroscopic
1. Introduction
Out of the ∼ 550 exoplanets known to date, more than 100transit their parent stars as seen from the Earth. This par-ticular configuration allows numerous key studies, includingaccurate radius, mass, and thus density measurements (see,e.g., Winn 2010a for a review), atmospheric studies in ab-sorption through transits and in emission through occulta-tions (e.g. Vidal-Madjar et al. 2003; Wheatley et al. 2010),dynamic analyses through possible timing variations (e.g.Holman et al. 2010), or spin-orbit alignment measurementsthanks to the Rossiter-McLaughlin effect (e.g. Bouchy etal. 2008). The power of these analyses incited numeroussearch surveys for transiting planets. Most of them werediscovered in the last five years, and the detection rate isstill increasing.
The CoRoT space mission (COnvection ROtation andplanetary Transits, Baglin et al. 2009) was launched on2006 December 27. Based on a 27-cm telescope and a2.8◦ × 2.8◦-field camera, it is designed to study asteroseis-mology and detect transiting exoplanets. The satellite al-
Send offprint requests to: G. Hebrard ([email protected])? The CoRoT space mission, launched on 2006 December 27,
has been developed and is operated by CNES, with the con-tribution of Austria, Belgium, Brazil, ESA (RSSD and ScienceProgramme), Germany and Spain.
lows several thousand stars (V = 12 − 16) to be continu-ously observed for up to 150 days with a high photometricaccuracy. CoRoT is thus well adapted to detecting tran-siting planets with small radii, such as CoRoT-7b (Legeret al. 2009; Queloz et al. 2009), or on long orbital periods,such as CoRoT-9b (Deeg et al. 2010). It can also detect hotjupiters, such as CoRoT-18b. We report its discovery here.
We describe in Sect. 2 the CoRoT observations andthe transit detection of the planetary candidate. Then, wepresent in Sect. 3 the ground-based follow-up observationsthat were needed to establish the planetary nature of theevent detected by CoRoT and also to characterize this plan-etary system. The analysis of the whole dataset and the re-sults are presented in Sect. 4, before conclusion in Sect. 5.
2. CoRoT observations and transit detection
CoRoT-18 was one of 4161 target stars observed by CoRoTfrom 2010 March 5 to 29 as part of SRa03, the third shortrun of the satellite in the Galactic anti-center direction.The coordinates, magnitudes and identifiers of CoRoT-18in various catalogs are given in Table 1. The finding chartis plotted in Fig. 1. Following the method described inGandolfi et al. (2008), the distance, d, and interstellar ex-tinction, AV, to CoRoT-18 were derived using the DENISand 2MASS magnitudes reported in Table 1 and synthetic
arX
iv:1
107.
2032
v2 [
astr
o-ph
.EP]
15
Aug
201
1

2 G. Hebrard et al.: CoRoT-18b, a massive hot jupiter on a prograde, nearly aligned orbit
Table 1. CoRoT-18 IDs, coordinates and magnitudes.
CoRoT window ID SRa03 E2 1347CoRoT ID 315211361USNO-B1 ID 0899-00921442MASS ID 06324137-0001537CMC14 063241.3-000153
Coordinates
RA (J2000) 06h 32m 41.s36Dec (J2000) −00◦ 01′ 53.′′71
MagnitudesFilter Mag ErrorB2 (USNO-B1) 15.79 -R2 (USNO-B1) 14.99 -V 15.00 0.10R (CMC14) 14.472 0.048I (DENIS) 14.051 0.030J (2MASS) 13.441 0.024H (2MASS) 13.080 0.031K (2MASS) 13.014 0.030
Fig. 1. The sky area around CoRoT-18 on the POSS redimage. The target is in the middle of the image, with theoverplot of the CoRoT photometric aperture mask.
colors from a model atmosphere with the same parametersas the star (see Sect. 4.2 and Table 3 below). We foundAV = 0.15 ± 0.15 mag and d = 870 ± 90 pc, as well asV = 15.00± 0.10 in the Johnson standard system.
The cadence for this target was 32 seconds throughoutthe CoRoT observations, resulting in 65120 exposures span-ning the wavelength range 300-1000 nm. The data were pro-cessed by the CoRoT pipeline (Auvergne et al. 2009). Thenormalized white-light curve, obtained by summing the fluxfrom the three channels and normalizing by the mean flux,is shown in the top panel of Fig. 2. It clearly shows 13planetary-like transit features, with a period of ∼ 1.9 daysand a depth of ∼ 2 %. The phase-folded light curve is plot-ted in the upper panel of Fig. 3.
To reduce computing time, the data was rebinned to512 seconds, which is the normal observing cadence forCoRoT exoplanet targets. This binned light curve is usedthroughout the rest of this paper. We checked that thisbinning does not significantly affect the parameter retrieval
Fig. 2. Top: CoRoT light curve in black with the 13 tran-sits shown in red. All epochs in this paper are given inHeliocentric Julian Date (HJDUTC; Eastman et al. 2010).The original light curve (shown in gray) contained a discon-tinuity at HJD−2450000 = 5281.62, which was correctedby subtracting 15 mmag from data taken after this date.A linear fit to the light curve has also been used to re-move any trend on timescales longer than the durationof the run. The light curve overplotted in blue is binnedto one point per orbital period of the CoRoT satellite tomake sure that no systematics from the rotation period cancome through. Bottom: Lomb-Scargle periodogram of theout-of-transit light curve (black curve in top panel) as afunction of relative improvement in χ2 compared to a con-stant flux model. It shows the stellar rotation signature at5.4± 0.4 days (solid red line), as well as its first harmonic(dashed red line). Also shown are the Gaussian fit used toestimate the uncertainty in the stellar rotation period andthe resulting 1-σ interval (dotted red lines).
by using the formalism presented by Kipping (2010b). Themean flux was 57366.4 e− per 32-second exposure, and therelative standard deviation of the binned light curve is6.9× 10−3, a factor 7.2 above the photon noise. This factorreduces to 1.6 when the transits are removed and variationson timescales longer than a day are filtered out (black linein upper panel of Fig. 2; see below Sect. 4.1).
CoRoT-18 was one of ten objects of interest identifiedsoon after the end of SRa03 observations by the “alarmmode” pipeline (Surace et al. 2008), which removes the out-liers flagged by the main pipeline, detrends the light curvesto remove long-term trends (instrumental and stellar) usinga median filter, and searches for transits using an implemen-tation of the box least squares (BLS) algorithm of Kovacs,Zucker & Mazeh (2002). A number of tests were then car-ried out to check that the CoRoT data were compatiblewith a planetary origin for the transits: full transit fits tothe white, red, green, and blue light curves using the transitformalism of Mandel & Agol (2002), check for differencesin depth between odd- and even-numbered transits, searchfor possible companion occultation at the transit antiphase,and search for ellipsoidal variations. Because this candidate
G. Hebrard et al.: CoRoT-18b, a massive hot jupiter on a prograde, nearly aligned orbit 3
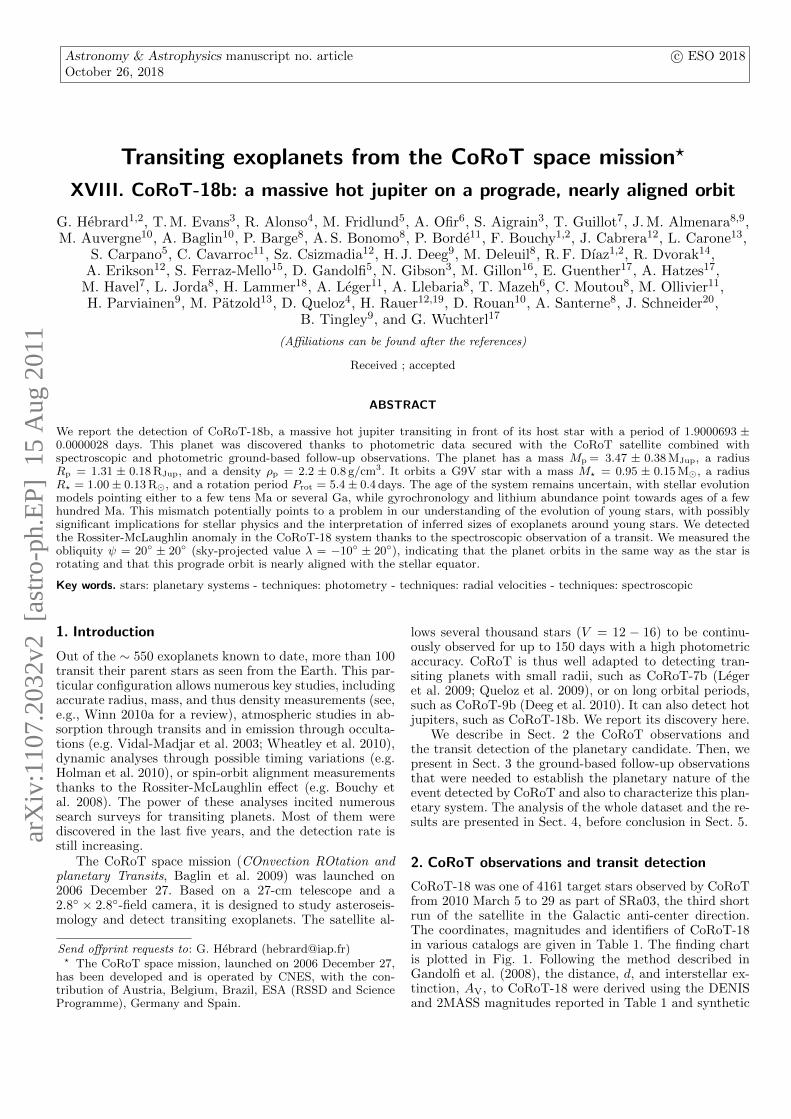
Fig. 3. Phase-folded CoRoT (top panel) and Euler (bot-tom panel) transit light curves with the best fit and theresiduals. CoRoT data cover 13 transits with a 512-secondbin and the Euler data one transit with a ∼ 3-minute bin.Both datasets are joint-fitted (see Sect. 4.1).
passed all these tests, it was put forward for follow-up ob-servations with high priority.
3. Ground-based follow-up observations
3.1. “On-off” photometry
The point spread function of CoRoT that contains 50% ofthe flux has an elongated shape of about 35′′×23′′. The pho-tometry is done through an aperture of that size. Owing tothis poor spatial resolution, a deep stellar transit diluted inthe flux of other source(s) also included in the large CoRoTaperture could mimic a shallow planetary transit. “On-off”photometry of the transit performed from the ground witha telescope allowing higher spatial resolution could identifycontaminated eclipsing binaries (Deeg et al. 2009).
“On-off” photometric observations of CoRoT-18 wereperformed in November 2010 with the ESA Optical GroundStation (OGS) 1-m telescope, located at Izana in Tenerife(Spain). Alternated short exposures of 30 seconds and longexposures of 100 seconds were taken, for a total dura-
tion of 28-min observation on-transit and 28-min obser-vation off-transit. Seven extra sources are detected in aradius of 30 ′′ around the main, brighter target. We per-formed aperture photometry of the target and neighbor-ing stars. The main target shows a transit with a depth0.03±0.01 mag, in agreement with the transit detected withCoRoT. The seven other targets show stable fluxes, withinprecisions ranging from 0.01 to 0.39 mag, depending on thetarget and the exposure time. This “on-off” observationsthus allowed us to exclude the detected transit signaturecaused by an eclipsing binary diluted in the CoRoT pointspread function.
3.2. Radial velocities
We started the spectroscopic follow-up of CoRoT-18 inOctober 2010 with the SOPHIE spectrograph at the 1.93-m telescope of Haute-Provence Observatory, France. Threemeasurements performed in three successive nights near ex-treme phases (assuming a circular orbit) showed large radialvelocity variations, in phase with the CoRoT ephemeris.The variation was on the order of 1 km s−1, indicating acompanion with a mass around 3 MJup. Thus we decidedto pursue the spectroscopic observations with SOPHIE tostrengthen the detection and to characterize the planetarysystem. We also used the HARPS spectrograph at the 3.6-m ESO telescope in La Silla, Chile, and the 2.56-m FIESspectrograph attached at the Nordic Optical Telescope inLa Palma, Spain. Having three ground-based instrumentsat different longitudes was useful for reaching a good phasecoverage for this system, which has an orbital period closeto an integer number of terrestrial days. The observa-tions were conducted up to January 2011, in good enoughweather conditions to allow satisfactory data to be securedin reasonable exposure times for this faint target.
Both SOPHIE (Bouchy et al. 2009) and HARPS (Mayoret al. 2003) are cross-dispersed, environmentally stabilizedechelle spectrographs dedicated to high-precision radial ve-locity measurements. SOPHIE data were acquired in High-Efficiency mode (resolution power R = 40 000) and HARPSdata in standard HAM mode (R = 115 000). The spectraextraction was performed using the SOPHIE and HARPSpipelines. Following the techniques described by Baranneet al. (1996) and Pepe et al. (2002), the radial veloci-ties were measured from a weighted cross-correlation ofthe spectra with a numerical mask. We used a standardG2 mask that includes more than 3500 lines. The result-ing cross-correlation functions were fitted by Gaussians toget the radial velocities and the associated photon-noise er-rors. The full width at half maximum of those Gaussians is12.6±0.2 km s−1, and its contrast is 27.7±0.8 % of the con-tinuum in the case of the HARPS data. The SOPHIE datagave similar parameters. We adjusted the number of spec-tral orders used in the cross-correlation in order to reducethe dispersion of the measurements. Indeed, some spectraldomains are noisy, so using them degrades the accuracy ofthe radial velocity measurement. We finally used the orders10 to 38 for SOPHIE, and 5 to 71 for HARPS.
Moonlight contamination was clearly visible in somespectra and in some cases at a radial velocity close to thatof the target. Such contamination can affect the radial ve-locity measurements. Following the method described inPollacco et al. (2008) and Hebrard et al. (2008), we esti-mated and corrected the Moon contamination by using the

4 G. Hebrard et al.: CoRoT-18b, a massive hot jupiter on a prograde, nearly aligned orbit
Fig. 4. Upper panel: Radial velocity measurements ofCoRoT-18 with 1-σ error bars as a function of time togetherwith their Keplerian fit (top) and residuals of the fit. Thefit is described below in Sect. 4.4. Lower panel: Same asabove but as a function of the orbital phase. The data arefrom SOPHIE (red circles), HARPS (blue diamonds), andFIES (green squares).
second optical-fiber aperture, which is targeted on the skyfor both SOPHIE and HARPS, whereas the first aperturepoints toward the target. This induces radial velocity cor-rections up to 400 m s−1.
The FIES observations were performed in January 2011under clear and stable weather conditions with seeing typi-cally in the range 0.′′8−1.′′0. We used the 1.′′3 high-resolutionfiber giving a resolving power R ' 67 000. Following theobserving strategy described in Buchhave et al. (2010),three consecutive science exposures of 20 minutes wererecorded for each observing night immediately precededand followed by one long-exposed ThAr spectrum. Data re-duction and spectra extraction were performed using stan-dard IRAF routines. Finally, the FIES radial velocity mea-surements of CoRoT-18 were derived cross-correlating thescience spectra with the spectrum of the radial velocitystandard star HD 50692 (Udry et al. 1999) observed withthe same instrument set-up.
The log of the observations and the radial velocity mea-surements are reported in Table 2. Radial velocity measure-ments have accuracies ranging between 23 and 98 m s−1
depending on the observing parameters. This table alsoshows the bisector spans that we measured on the cross-correlation functions in order to quantify the possibleshape variations of the spectral lines. One SOPHIE spec-trum was too polluted by the Moon to allow any accuratebisector measurement.
The radial velocity variations agree with Doppler shiftscaused by a planetary companion, and the transit-signaldetected from the CoRoT light curve could be interpretedas coming from a massive hot-Jupiter. We designate it asCoRoT-18b hereafter.
The measurements are displayed in Fig. 4, together withtheir circular Keplerian fit, assuming the period and tran-sit epoch determined by the CoRoT light curve and refinedwith the photometric transit observed from the ground (seeSect. 3.4). The photometric and radial velocity data showgood agreement. SOPHIE and HARPS radial velocities ob-tained with different stellar masks (F0 or K5) produce vari-ations with the same amplitude as obtained with the G2mask, so there is no indication that their variations couldbe explained by blend scenarios implying stars of differ-ent spectral types. Similarly, the cross-correlation functionbisector spans show neither variations nor trend as a func-tion of radial velocity (Fig. 5). This reinforces the conclu-sion that the radial velocity variations are not caused byspectral line profile changes due to blends.
Fig. 5. Bisector span as a function of the radial velocitieswith 1-σ error bars. The ranges have the same extents inthe x- and y-axes. The data are from SOPHIE (red circles),HARPS (blue diamonds), and FIES (green squares).
3.3. Transit spectroscopy
A transit of CoRoT-18b was observed in spectroscopy on2011 January 28. The goal was to detect the Rossiter-McLaughlin anomaly, which is an apparent distortion of

G. Hebrard et al.: CoRoT-18b, a massive hot jupiter on a prograde, nearly aligned orbit 5
the stellar lines profile because of the transit of the planetin front of the rotating star. It allows the measurementof the sky-projected angle between the planetary orbitalaxis and the stellar rotation axis, usually denoted λ (see,e.g., Bouchy et al. 2008). The spectroscopic transit was ob-served with HARPS in the EGGS mode to improve thethroughput. By comparison to the HAM mode of HARPSused in Sect. 3.2 for the orbit determination (1′′ diame-ter fiber with a scrambler, allowing the resolution powerR = 115 000 to be reached), the EGGS mode of HARPSuses a larger fiber (1.′′4) without scrambler. The spectralresolution is then reduced (R = 80 000) but the efficiencygain reaches a factor ∼ 2 improvement.
The target was continuously observed during a 5.5-hoursequence under good weather condition, with a seeing vary-ing between 0.′′7 and 1.′′0. Twelve measurements were se-cured with exposure times ranging from 1200 to 1800 sec-onds, including five within the transit. The remaining ob-servations obtained before and after the transit are manda-tory for references. The radial velocities were extracted asfor HARPS/HAM data (Sect. 3.2), but using fewer ordershere for the cross-correlation (orders 18 to 69) to reducethe dispersion of the measurements.
The HARPS/EGGS data are plotted in Fig. 6. TheRossiter-McLaughlin anomaly is detected, with an ampli-tude of ∼ 100 m s−1, as expected according the rotationof the star and the depth of the photometric transit. Thered shift during the first part of the transit and the blueshift during the second part indicate a prograde orbit. Thesymmetry of the feature agrees with an aligned system.
Fig. 6. Spectroscopic observation of the 2011 January 28transit of CoRoT-18b. Top: HARPS/EGGS radial veloc-ity measurements as a function of the orbital phase (filleddiamonds), Keplerian fit ignoring the transit (dashed line),and final fit including the model of the Rossiter-McLaughlinanomaly (solid line). The vertical dotted lines show thetimes of mid-transit, first, second, third, and fourth con-tacts. Bottom: Residuals of the final fit.
3.4. Transit photometry
A transit of CoRoT-18b was observed with the Euler1.2-m telescope on 2011 January 28 between 01:08 and05:36 UT, roughly at the same time and location asthe Rossiter-McLaughlin anomaly observed in spectroscopywith HARPS (see Sect. 3.3). The goal was to refine theephemeris. A total of 83 frames were recorded on the re-cently installed 4K×4K E2V detector, with an exposuretime of three minutes. As for the CoRoT light curve, wechecked that this binning does not significantly affect theparameter retrieval by using the formalism presented byKipping (2010b). Standard calibration images were takenon the same night. The fluxes from the target and 20 refer-ence stars were extracted using standard aperture photom-etry with custom IDL routines. An average reference starwas constructed by interactively selecting the stars that ex-hibited less real or instrumental variability. Nine stars wereselected for this purpose. The final light curve was normal-ized to the median of the flux level after the egress of thetransit. It is plotted in the lower panel of Fig. 3.
We considered shot noise as a first estimation of the ac-curacy of the measurements, which was at the level of 10−3
for this object. The accuracy level is later re-establishedby an evaluation of the reduced χ2 of the fit process totake the correlated noise present in the data into account(see Sect. 4.1). To better estimate the accuracy of the mea-surements, the dispersion of the data before and after thetransit is 1.7 × 10⁻³. The bump seen on the light curvenear phase −0.01 could hint that the planet is transiting infront of a stellar spot; however, the amplitude of this eventis within an the order of magnitude of the correlated noiseso a spot detection cannot be claimed here.
4. Analysis
4.1. Light curves analysis
4.1.1. Initial transit fit and light curve normalization
To remove the modulations in the CoRoT light curvecaused by rotating active regions on the stellar surface (seethe top panel of Fig. 2), we fit second-order polynomialsto stretches of data on either side of each transit spanningapproximately −2 to −1 and +1 to +2 times the transit du-ration. These sections were then normalized and kept forfurther light curve fitting, while flux measurements outsidewere discarded from the analysis.
A detailed investigation of the immediate surroundingsof the target (using Digital Sky Survey data) revealed that2.0±0.1% of the flux in the photometric aperture was con-tributed by background stars. This was subtracted from themedian out-of-transit flux before re-normalizing. The un-certainty in the contamination fraction translates into aneffective uncertainty on the derived radius ratio due to con-tamination of ∼ 0.0001. This is 15 times smaller than thefinal uncertainties derived below, so is negligible.
The transits were then modeled using the formalismof Mandel & Agol (2002), with quadratic limb darkeningcoefficients u1 and u2 defined according to the standardlaw of the form I(µ)/I(1) = 1 − u1(1 − µ) − u2(1 − µ)2,where I(1) and I(µ) are the specific intensities at the cen-ter of the stellar disk and at the angle θ between theline of sight and the emergent intensity, respectively, andµ = cos(θ). We performed an initial least-squares fit (us-

6 G. Hebrard et al.: CoRoT-18b, a massive hot jupiter on a prograde, nearly aligned orbit
Table 2. Radial velocities of CoRoT-18.
HJDUTC RV ±1σ Bis. span exp. time S/N p. pix. Instrument/-2 455 000 (km s−1) (km s−1) (km s−1) (sec) (at 550 nm) mode484.6704 30.132 0.041 0.029 3600 16 SOPHIE/HE485.6621 29.030 0.062 0.184 3600 13 SOPHIE/HE486.6469 30.069 0.051 -0.196 3600 11 SOPHIE/HE505.6367 30.102 0.032 -0.074 3600 15 SOPHIE/HE525.6027† 28.933 0.086 0.046 2802 8 SOPHIE/HE527.5751† 29.006 0.065 -0.128 3600 11 SOPHIE/HE529.6121† 29.178 0.065 0.117 3600 10 SOPHIE/HE557.5227† 29.077 0.096 -0.209 3600 7 SOPHIE/HE577.3831† 29.756 0.041 0.037 3600 16 SOPHIE/HE578.3721† 29.241 0.052 0.165 3600 15 SOPHIE/HE580.3673† 29.181 0.094 - 3600 13 SOPHIE/HE538.7441 28.979 0.027 -0.043 3600 11 HARPS/HAM539.7253 30.115 0.038 0.010 3600 9 HARPS/HAM547.7838 29.720 0.023 -0.011 3600 13 HARPS/HAM548.6767† 29.324 0.055 -0.005 3600 7 HARPS/HAM583.7515† 29.892 0.051 -0.072 3200 8 HARPS/HAM590.7061 29.732 0.051 -0.087 3600 7 HARPS/HAM568.4512 30.075 0.066 -0.049 3600 10 FIES569.5086 29.334 0.070 0.024 3600 8 FIES570.5516 29.881 0.076 0.031 3600 9 FIES580.5441 29.075 0.098 -0.010 3600 10 FIES581.5089 30.262 0.084 -0.044 3600 11 FIES589.5374 29.641 0.052 0.065 1200 6 HARPS/EGGS589.5542 29.719 0.042 -0.053 1500 8 HARPS/EGGS589.5721 29.583 0.046 -0.107 1500 8 HARPS/EGGS589.5897 29.616 0.048 -0.037 1500 7 HARPS/EGGS589.6074 29.727 0.051 0.046 1500 7 HARPS/EGGS589.6261 29.596 0.052 0.156 1500 7 HARPS/EGGS589.6467 29.501 0.045 -0.082 1800 8 HARPS/EGGS589.6687 29.415 0.039 0.024 1800 8 HARPS/EGGS589.6909 29.436 0.033 -0.053 1800 10 HARPS/EGGS589.7132 29.482 0.037 -0.168 1800 9 HARPS/EGGS589.7343 29.329 0.043 -0.236 1800 8 HARPS/EGGS589.7565 29.435 0.065 0.002 1800 5 HARPS/EGGS†: measurements corrected from Moonlight pollution.
ing the Levenberg-Marquardt algorithm) simultaneously toall 13 CoRoT transits, allowing the following parameters tovary: the period P , the epochs median of transit centers T0,the planet-to-star radius ratio Rp/R?, the impact param-eter b, the scaled semi-major axis a/R?, and the combina-tions of the limb darkening coefficients u1 +u2 and u1−u2.We considered a circular orbit. We discuss below the impactof possible low eccentricity on our results. The values for thelimb darkening parameters obtained from this analysis werefully consistent with the values of u1 = 0.47 and u2 = 0.21provided by Sing (2010) for a star with Teff = 5500 K,log g = 4.5, and [M/H] = −0.1 (see Sect. 4.2). For theremainder of our analysis, we fixed the limb darkening pa-rameters for the CoRoT light curve to these values.
4.1.2. Detailed transit fit
To estimate the photometric uncertainty of the CoRoTdata, we calculated the standard deviation of the out-of-transit flux values, except those within 30 minutes of theingress and egress of our initial fit. This provided an esti-mate of σ = 1.7 mmag, which was then used to performa 100 000-step Metropolis-Hastings Markov Chain MonteCarlo (MCMC) analysis with the parameters P , T0, b,
a/R?, and Rp/R? allowed to vary, using our initial best-fitvalues from above as the starting points. We adjusted thejump scales for the free parameters until a step acceptancerate of 25-35% was achieved. The photometric uncertain-ties were then scaled up to σ = 1.9 mmag to give a reducedχ2 of unity for the best-fit MCMC solution. This upwardsscaling of the photometric uncertainties can be attributedto the presence of correlated noise in the CoRoT light curve(Pont et al. 2006), often expressed as
σ2N = σ2
W /N + σ2R, (1)
where σ2N is the variance between the mean flux values of
bins containing N data points, and σW and σR representthe “white” and correlated “red” components of the noise,respectively. The uncertainty on individual flux values isthen given by σ = σN for N = 1, so that σ =
√σ2W + σ2
R.The top panel of Fig. 7 shows calculated values for σ asa function of N for the CoRoT light curve. The variationbetween the mean flux values of bins containing only a sin-gle point (N = 1) is approximately 1.9 mmag, equal to thevalue that produces a reduced χ2 of unity for the best-fitmodel. It also shows the expectation for a white-noise-onlymodel that is forced to pass through the point at N = 10.For lower values of N , the white-noise-only model is not
G. Hebrard et al.: CoRoT-18b, a massive hot jupiter on a prograde, nearly aligned orbit 7
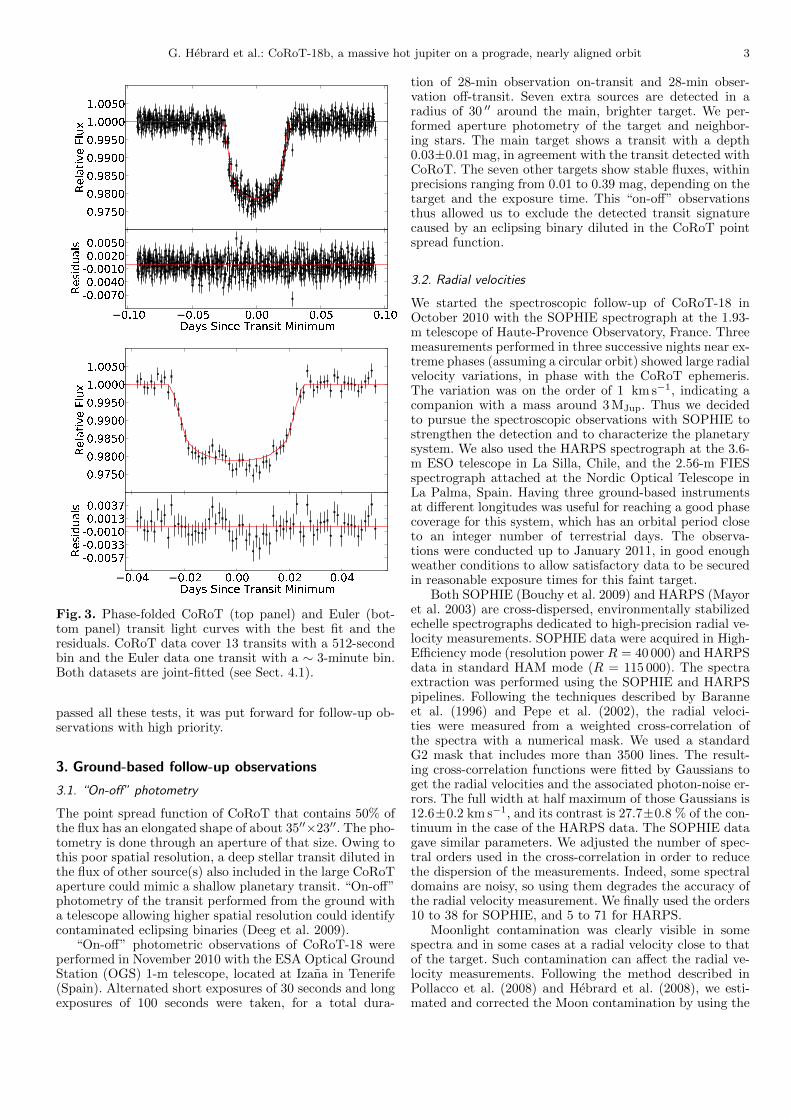
Fig. 7. The standard deviation σN of measured out-of-transit flux values as a function of the number of pointsN for the CoRoT light curve (top panel) and the Eulerlight curve (bottom panel). The dark curves indicate thebest-fit models without red noise, i.e. only white noise.
able to account for all of the variation in the data. Thisillustrates why it is necessary to scale the photometric un-certainties upwards from the standard deviation of the out-of-transit flux values.
A similar procedure was then repeated for the Eulerlight curve. We first estimated the photometric uncer-tainty to be equal to the standard deviation of the out-of-transit measured flux values, which was calculated asσ = 1.9 mmag. We then performed a 100 000-step MCMCanalysis, allowing P , T0, b, a/R?, and Rp/R? to vary. Thelimb darkening parameters u1 and u2 were also allowedto vary, but this resulted in poor chain convergence. Forthis reason, we decided to set their values to u1 = 40 andu2 = 30, as provided by Claret (2004) for a star with thesame parameters as above. To investigate the effect of fixingthe limb darkening parameters, we experimented with fix-ing them to other values provided by Claret (2004) for starswith similar properties to CoRoT-18 and then performinga least squares fit to the light curve. In all cases, the fit-ted value for Rp/R? changed, as expected, while the otherparameters remained constant within the uncertainties. In
particular, the fitted values for P and T0 were unaffected byvarying the limb darkening parameters. This is importantbecause the primary purpose of the Euler light curve is torefine the ephemeris of the orbit (see below). We also ver-ified that the choice of limb darkening parameters for theEuler light curve did not affect the derived values for theother parameters in the simultaneous fitting to the CoRoTand Euler light curves, which is described below. This wasdone by ensuring that the fitted values for Rp/R?, a/R?
and b remained the same regardless of whether the Eulerlight curve was included in the fit.
The bottom panel of Fig. 7 shows the variation betweenbinned flux values as a function of bin number for the Eulerlight curve. It shows strongly correlated noise on time scalesof ∼ 10−20 minutes (between two to five exposures ), whichdecreases significantly on longer timescales. This behavioris poorly modeled by Equation 1 above, with the solid lineshowing an illustrative fit for the white-noise-only case, i.e.σR = 0. Instead, we scaled the photometric uncertaintiesup to σ = 2.1 mmag, which was the value required to givea reduced χ2 of unity for the best-fit model.
We next performed a joint MCMC analysis on theCoRoT and Euler light curves. This was done by initiatingfive independent chains at random locations in parameterspace approximately ∼ 5σ away from the best-fit valuesdetermined from the initial fitting process. The period washeld fixed to the value determined from the initial best-fit to the CoRoT light curve, but we allowed the transitmidtimes to vary for each transit in order to investigatethe possibility of transit timing variations (see Sect. 4.1.3).Values for a/R?, Rp/R? and b were allowed to vary withthe same values across all transits, and the limb darkeningcoefficients were held fixed to the values described above.
The five chains were run in parallel for 200 000 steps.The initial 40 000 steps of each chain were then discardedto allow for the initial burn-in phase as the chains set-tled. We also checked when the χ2 first dropped below thechain’s median value, indicating the point at which the localneighborhood of the final solution had first been reached.Typically, this occurred within about 20 000 steps, imply-ing that the truncation we made at 40 000 steps is in factconservative. The Gelman-Rubin statistic was then calcu-lated using the truncated chains for each of the free param-eters and, in all cases, found to be within approximately 1%of unity, indicating good mixing and convergence (Gelman& Rubin 1992). The chains were then combined to obtainmarginalized posterior distributions for each of the free pa-rameters, with medians and 1-σ uncertainties reported inTable 3 and examples plotted in Fig. 8. The upper andlower 1σ uncertainties respectively refer to the upper andlower bounds on the intervals containing 34.1% of the chainsteps on either side of the median.
A refined estimate for the orbital period was then ob-tained by fitting a model of the form
T ′0(n) = TA + n
(TB − TA
173
), (2)
where T ′0(n) denotes the transit midtime measured for thenth orbit, TA is the epoch of the first CoRoT transit andTB is the epoch of the Euler transit, which is 173 or-bital periods later. Then we ran two 200 000-step MCMCchains (one for TA and one for TB) and calculated thecorresponding chain for the estimated period according to

8 G. Hebrard et al.: CoRoT-18b, a massive hot jupiter on a prograde, nearly aligned orbit
Fig. 8. Examples of the results of the MCMC analysis with scatter plots showing the correlations between fitted param-eters. Values corresponding to the best-fit (lowest χ2) solutions are indicated by red lines, while solid blue lines indicatethe median values obtained for each parameter, and the dashed blue lines give the upper and lower 1-σ uncertainties.The best and median solutions coincide for several parameters.
P = (TB − TA)/173. As expected from Pal (2009), thecorrelation between TA and P chains was negative, whilethe correlation between the TB and P chains was positive.We then calculated an optimal epoch using Equation 97of Pal (2009), which roughly corresponds to the mediantransit epoch, and find Topt = TA + 32 × P . The newchain for this epoch led to the following median valuefor the optimal epoch, with associated 1-σ uncertainties:T0 = Topt = 2 455 321.72412±0.00018 HJD. By comparisonto the classical computation using for example the epochof the first transit, this method with the optimal epoch al-lows the uncertainty on T0 to be decreased by 2 sec, as wellas the reduction of the correlation between T0 and P (seeFig. 8). The final ephemeris values are reported in Table 3and plotted in Fig. 8. The best-fit solution for the combineddata set has a reduced χ2 of 1.01.
Finally, we estimated the effect of introducing asmall eccentricity in the fit of the light curve. Indeed,Kipping (2010a) has shown that assuming e = 0 for aneccentric orbit could lead to underestimated uncertaintiesto a/R∗ ratio and stellar density ρ∗. We derive below theupper limit e < 0.08 at 95% confidence from the radialvelocity measurements (see Sect. 4.4). We performed newfits of the CoRoT light curve assuming this extreme eccen-
tricity, with different possible values for the longitude ω ofthe periastron. Most extreme fits could provide a/R∗ andρ∗ values at most to 2σ lower the values derived above.Thus we slightly decreased the final values on these pa-rameters and increased their uncertainties to account for asmall possible eccentricity.
4.1.3. Timing analysis
The 13 successive transits observed by CoRoT and theobservation of the additional transit with Euler offeran opportunity for transit timing variations (TTVs) re-search (Holman & Murray 2005). Figure 9 shows the TTVsmeasured by
∆T0(n) = T ′0(n)− T0, (3)
where T ′0(n) again denotes the transit midtime measuredfor the nth orbit and T0 denotes the refined transit midtimederived by fitting to the ephemeris equation, as describedabove. We obtain a reduced χ2 of 1.3 for the hypothesis thatthere are no TTVs, i.e. ∆T0(n) = 0 for n = 1, . . . , 14. Whenthe ninth transit is removed (visible as the most discrepantpoint in Fig. 9) the reduce χ2 improves to 0.98. Inspection

G. Hebrard et al.: CoRoT-18b, a massive hot jupiter on a prograde, nearly aligned orbit 9
of this particular transit reveals that neither the ingressnor the egress was sampled, which could help explain whythe measured TTV is somewhat discrepant. This is alsothe case for the fifth transit. Also, it is possible that theuncertainties in the measured transit midtimes are slightlyunderestimated because we did not account for unoccultedspots that could result in different values for the effectiveradius ratio Rp/R? being measured from transit-to-transitas the spot coverage evolves; instead, we held Rp/R? fixedfor all transits in the MCMC analysis. In either case, giventhe perfect agreement of the Euler ephemeris with all ofthe other CoRoT ephemerides, we conclude that there isno evidence of TTVs in the combined data set. Given thatthe characteristic uncertainty on our TTV measurementswas about 60 seconds, we obtain a 3-σ TTV upper limitof 180 seconds.
Fig. 9. Transit timing variation ∆T0 for each transit ofCoRoT-18b. The 13 transits observed with CoRoT (on theleft) were obtained about ten months before those observedwith Euler (on the right). The 5th and 9th CoRoT transitsdo cover neither the ingress nor egress and therefore couldconduct to erroneous timing measurements.
4.1.4. Rotation period
The CoRoT white-light curve of CoRoT-18 shown in thetop panel of Fig. 2 displays obvious signs of rotational mod-ulation of star spots, with at least two large active regionspresent on the stellar surface at any one time. To estimatethe rotation period we first cut out a section lasting twicethe transit duration around each transit, then fit a straightline to the out-of-transit light curve to remove any long-term trend. We also corrected for a discontinuity near theend of the light curve by subtracting 15 mmag from all datataken after the discontinuity. This detrending procedure isslightly different from the one presented above in Sect. 4.1.
We estimated the rotation period by fitting sinusoidsat 1000 trial periods ranging from 1 to 15 days to the cor-rected out-of-transit data. The resulting best-fit amplitudesare shown as a function of trial period in the bottom panelof Fig. 2. The dominant peak clearly corresponds to theinterval between repeat appearances of individual activeregions, hence to the rotation period. There is also signif-
icant power at the first harmonic of the rotation period.We do not expect aliases here from the CoRoT satellite or-bital period, because it is well below the Nyquist samplingfrequency of the data. We checked for that by binning thelight curve to one point per orbital period (upper panel ofFig. 2) to make sure that no systematics from the satelliterotation period can come through, and repeated the study.The results were identical.
To refine the estimate of the rotation period, we fit aGaussian to the periodogram around the main peak, shownin the lower panel of Fig. 2, and adopted the standard de-viation of the Gaussian as our period uncertainty, yieldingProt = 5.4 ± 0.4 days. This period is quite short for a lateG-type star: even at the age of the Hyades, typical rotationperiods for this spectral type are in the range of eight tonine days (Kawaler 1989).
4.1.5. Planetary occultation upper limit
We derived the depth upper limit of a possible occultationof the planet by the star by fitting a Mandel & Agol (2002)transit model at phase 0.5, with no limb darkening and atransit depth reduced by a factor Fp/F∗, where Fp is theplanetary flux and F∗ the stellar flux. All parameters werekept fixed to the best-fit values derived from the transit,except for the eclipse depth, for which we obtain a best-fitvalue of 0.05 ± 0.19 mmag, i.e. consistent with zero. Theresulting 3-σ upper limit is 0.61 mmag. This is not partic-ularly stringent, as one can expect a planetary to star fluxratio of 0.40 mmag in the optimistic case of a geometricalbedo equal to one.
4.2. Stellar analysis and classification
To determine the planetary parameters with an as high aspossible precision we need to know the physical conditionsof its host star. Seager & Mallen-Ornelas (2003), amongothers, have shown that ideally there is one stellar parame-ter, the stellar density, which can be obtained from a tran-sit light curve of sufficient photometric precision. From thisparameter, it is possible (with a number of assumptions)to derive, through modeling, other physical parameters ofthe system. Nevertheless, as pointed out in this context bye.g. Fridlund et al. (2010), high-precision photometric andspectroscopic measurements that has been carried out onother exoplanet host stars, do suggest that this rarely infersreliably to the other properties of the star – mainly becauseof flaws in stellar theory (Winn et al. 2008).
We used the two sets of HARPS observations to performthis analysis: the HARPS/HAM data (co-addition of sixspectra totaling 5.8 hours of integration, see Sect 3.2) andthe HARPS/EGGS data (co-addition of 12 spectra total-ing 5.4 hours of integration, see Sect 3.2). Due to its lowerresolution power (80 000 vs. 115 000) the HARPS/EGGSdata presents the higher signal-to-noise ratio (∼ 35 in thecontinuum at Hα). We analyzed both sets of observationsand find no significant differences in the stellar parametersbeyond the internal 1-σ error. Three observations are im-mediately made while inspecting the co-added spectra. Theappearance is that of a cool star, the line profiles are rela-tively broad (v sin i∗= 8.0±1.0 km s−1), and there is a faintabsorption (equivalent width of ∼ 40 mA) at the locationof the Li i (6707.8 A) line. There is no obvious detection of

10 G. Hebrard et al.: CoRoT-18b, a massive hot jupiter on a prograde, nearly aligned orbit
any Ca ii chromospheric emission. This v sin i∗ direct mea-surement agrees with this derived from the cross-correlationfunction following the Santos et al. (2002) methodology.
To determine the spectroscopic parameters, we usedthe Spectroscopy Made Easy (SME, version 162, February2011) software package (Valenti & Piskunov 1996; Valenti& Fischer 2005). SME calculates synthetic spectra and fitsthe observations to it. All the normal stellar parameters(Teff , log g, v sin i∗, [Fe/H], abundances, etc.) can be usedeither as input or as free parameters to solve for. A gridof stellar models (Kurucz models) was utilized in order todetermine the fundamental stellar parameters iteratively.This was achieved by fitting the observed spectrum directlyto the synthesized spectrum and minimizing the discrep-ancies using a nonlinear least-squares algorithm. SME re-quires atomic line data in order to synthesize a spectrum.We utilized input from the Vienna Atomic Line Database(Kupka et al. 1999; Piskunov et al. 1995).
Using SME and a sample of more than 1000 stars,Valenti & Fischer (2005) found uncertainties of 44 K in Teff ,0.06 dex in log g, and 0.03 dex in [M/H] per measurement.Based on the CoRoT material (stars hosting CoRoT plan-ets or candidates that have not been positively shown tohost planets), we find slightly larger errors than Valenti &Fischer (2005): 70− 100 K in Teff , depending on the signal-to-noise in the continuum of the spectrum at the locationof the Balmer lines, 0.05− 0.1 dex in log g, depending alsoon the spectral type and on which ion we used, and fi-nally 0.05 − 0.1 dex in [M/H]. However, by comparing themeasurements with model isochrones they found a larger,systematic offset of ∼ 0.1 dex and a scatter that can oc-casionally reach 0.3 dex in log g. In CoRoT-18, we find aninternal discrepancy using SME of 0.1 dex. We thereforeassign 0.1 dex as our 1-σ precision.
We found Teff = 5443K ± 100 K from the profile of theBalmer lines. We determined the metallicity and found con-sistent results from different ions indicating a star of slightlylower than Solar metallicity: [M/H] ' −0.1±0.1. The log gwas determined utilizing the lines of Ca i, Mg i and Na i,finding a consistent result of 4.4 ± 0.1. The spectroscopicparameters of CoRoT-18 are summarized in Table 3.
4.3. Stellar evolution tracks and the age problem
Altogether, CoRoT-18 seems remarkably similar to CoRoT-2 (Alonso et al. 2008): the two stars (CoRoT-18 vs.CoRoT-2) have comparable effective temperatures (5440vs. 5450 K), metallicities (−0.1 vs. 0.0), spin periods (5.4vs. 4.5 days), and v sin i∗ (8.0 vs. 12 km s−1), and they areboth active, with peak-to-peak photometric variabilities of∼ 2% and ∼ 4%, respectively. In addition CoRoT-18b andCoRoT-2b are the only known planets (transiting or not)orbiting a star colder than 6000 K and with a large v sin i∗.The other planet-host stars in this temperature range allhave v sin i∗ values in the range [0 − 5] km s−1. All theplanet-host stars having v sin i∗ ∼ 10 km s−1 or larger areF-stars – except CoRoT-18 and CoRoT-2.
However, the inferred stellar densities for CoRoT-18 andCoRoT-2 (1.35±0.25 vs. 1.814+0.050
−0.045 g cm−3 – see Gillon etal. 2010) slightly differ. As a result, the effective tempera-ture, metallicity, and density constraint for CoRoT-18 areconsistent with evolution tracks for solar-mass stars thatare either particularly young and still on the pre-main se-quence or old and towards the end of the main-sequence
evolution (see Figs. 2-4 from Guillot & Havel 2011). Weused the CESAM evolution code (Morel & Lebreton 2009)to calculate these evolution tracks. In Fig. 10 we plot thesolutions in the stellar-mass, age parameters, with col-ors that depend on their quadratic distance to the effec-tive temperature-stellar density constraints. These pointtowards either a young age, less than 30 Ma (at 3σ), oran old one, more than 8 Ga at 1σ and more than 4 Ga at3σ. The situation is thus different than for CoRoT-2, forwhich a continuum of young and late-type solutions wasfound (see Guillot & Havel 2011). For CoRoT-18, these so-lutions contradict with the other age indicators.
Fig. 10. Constraints obtained from stellar evolution modelsfor the age and mass of CoRoT-18. The colored circles cor-respond to constraints derived from stellar evolution mod-els matching the stellar density and effective temperaturewithin a certain number of standard deviations: less than1σ (green), 2σ (blue), or 3σ (yellow).
First, as for CoRoT-2, the rapid rotation of the starpoints towards a young age. Bouvier (2007) has compiledhundreds of rotational period measurements from photo-metric surveys of young open clusters with ages up to625 Ma (Hyades), and used them to model the rotationalevolution of stars in several mass bins. A range of modelsis needed to reproduce the data at any given age, and con-straints are scarce beyond 200 Ma for stars with masses be-tween 0.8 and 1 M�. However, extrapolation of the modelscalibrated at earlier ages suggests that such stars are not ex-pected to retain rates ∼ 5 times faster than the Sun (whichis the case for CoRoT-18) beyond ages of 500 - 600 Ma.
Second, the lithium equivalent width favors the latterend of this age range. According to a recent compilation ofLi depletion measurements, also from stars in young openclusters (Hillenbrand et al. 2009), the equivalent width of40 mA measured for CoRoT-18 is typical of stars of thisspectral type at the age of Ursa Majoris (500 Ma) or theHyades (625 Ma), while typical equivalent widths for similarstars in M34 and M7 (∼ 200 Ma) are about 100 mA. This
G. Hebrard et al.: CoRoT-18b, a massive hot jupiter on a prograde, nearly aligned orbit 11
would thus instead suggest an age of several hundred Mafor CoRoT-18.
Thus, for now we are unable to estimate the age ofCoRoT-18, even if it seems to be young. This illustratesthe difficulty in determining the age of stars. We adoptthe stellar mass M? = 0.95 ± 0.15 M�. The conservativeerror bar is large enough to agree with both pre-main-sequence case and old star main-sequence star. This im-plies a semi-major axis a = 0.0295±0.0016, a stellar radiusR? = 1.00 ± 0.13 R�, and thus a planetary radius Rp =1.31±0.18 RJup. The equilibrium temperature of the planetassuming an isotropic zero-albedo is Teq = 1550±90 K. Therotation period 5.4±0.4 days (Sect. 4.1.4) is consistent withthe high value v sin i∗= 8.0 ± 1.0 km s−1 and is fast for alate G-type star. Using R? = 1.00 ± 0.13 R�, this trans-lates into an inclination of the stellar rotation axis that isi∗ = 70◦ ± 20◦, so the star is seen nearly edge-on.
4.4. Radial velocities fit
We fitted the radial velocities with a Keplerian model. Theperiod and the epoch of the transit were fixed to the val-ues obtained from the light curves analysis (Sect. 4.1). Ifthe relative accuracy of the radial velocity measurements ishigh (a few tens of m s−1 here in the case of CoRoT-18),their absolute accuracy in heliocentric or barycentric framescould be ten times less good, so a radial velocity shift wasfree to vary in the fit between the three datasets used forthe orbit (SOPHIE, HARPS/HAM, and FIES), and we fi-nally obtained one systemic radial velocity for each of thethree instruments. The HARPS/EGGS data secured duringa transit do not significantly constrain the orbit, and theyare used below for the analysis of the Rossiter-McLaughlinanomaly. We found the upper limit e < 0.08 at 95% confi-dence for the eccentricity of the orbit and thus assumed acircular orbit, as usually is the case for hot jupiters. In thecase of a slightly eccentric orbit, its orientation is not wellconstrained, with the longitude of the periastron includedin the range −60◦ < ω < 100◦.
The final fit of the radial velocities is plotted in Fig. 4.The derived orbital parameters are reported in Table 3,together with error bars that were computed from χ2 vari-ations and Monte Carlo experiments. The radial velocityvariations present a semi-amplitude K = 590 ± 14 m s−1,corresponding to a planet with a mass Mp = 3.47 ±0.38 MJup. This assumes M? = 0.95± 0.15 M� for the hoststar, which here is the main source of uncertainty on Mp.
The standard deviation of the residuals to the fit isσO−C = 41.0 m s−1 for the whole dataset (35.9, 44.4, and43.0 m s−1 for SOPHIE, HARPS/HAM, and FIES, respec-tively). The reduced χ2 is 1.02 for the 22 radial veloci-ties used in the fit. We do not detect any drift over the106-day span of the radial velocity, with an upper limit of200 m s−1 a−1 at 95% confidence. We can thus exclude anyextra planet in the system with a mass higher than 3 MJup
and a period shorter than 200 days.
4.5. Planetary evolution
We have seen that CoRoT-18 and CoRoT-2 are similar forwhat concerns their stars. Their planets (CoRoT-18b vs.CoRoT-2b) are also strikingly similar, in terms of orbitalperiods (1.90 vs. 1.74 days), masses (3.4 vs. 3.7 MJup), and
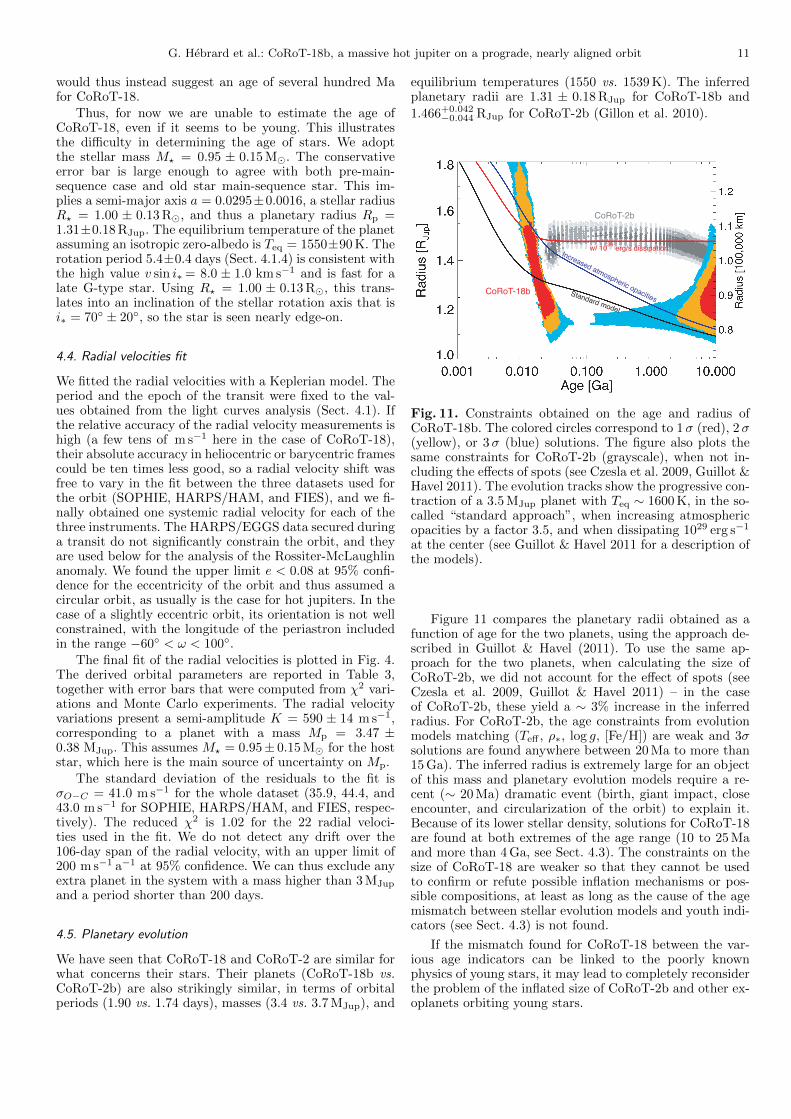
equilibrium temperatures (1550 vs. 1539 K). The inferredplanetary radii are 1.31 ± 0.18 RJup for CoRoT-18b and
1.466+0.042−0.044 RJup for CoRoT-2b (Gillon et al. 2010).
CoRoT-18b
Increased atmospheric opacitiesStandard model
CoRoT-2b
w/ 1029 erg/s dissipation
Fig. 11. Constraints obtained on the age and radius ofCoRoT-18b. The colored circles correspond to 1σ (red), 2σ(yellow), or 3σ (blue) solutions. The figure also plots thesame constraints for CoRoT-2b (grayscale), when not in-cluding the effects of spots (see Czesla et al. 2009, Guillot &Havel 2011). The evolution tracks show the progressive con-traction of a 3.5 MJup planet with Teq ∼ 1600 K, in the so-called “standard approach”, when increasing atmosphericopacities by a factor 3.5, and when dissipating 1029 erg s−1
at the center (see Guillot & Havel 2011 for a description ofthe models).
Figure 11 compares the planetary radii obtained as afunction of age for the two planets, using the approach de-scribed in Guillot & Havel (2011). To use the same ap-proach for the two planets, when calculating the size ofCoRoT-2b, we did not account for the effect of spots (seeCzesla et al. 2009, Guillot & Havel 2011) – in the caseof CoRoT-2b, these yield a ∼ 3% increase in the inferredradius. For CoRoT-2b, the age constraints from evolutionmodels matching (Teff , ρ∗, log g, [Fe/H]) are weak and 3σsolutions are found anywhere between 20 Ma to more than15 Ga). The inferred radius is extremely large for an objectof this mass and planetary evolution models require a re-cent (∼ 20 Ma) dramatic event (birth, giant impact, closeencounter, and circularization of the orbit) to explain it.Because of its lower stellar density, solutions for CoRoT-18are found at both extremes of the age range (10 to 25 Maand more than 4 Ga, see Sect. 4.3). The constraints on thesize of CoRoT-18 are weaker so that they cannot be usedto confirm or refute possible inflation mechanisms or pos-sible compositions, at least as long as the cause of the agemismatch between stellar evolution models and youth indi-cators (see Sect. 4.3) is not found.
If the mismatch found for CoRoT-18 between the var-ious age indicators can be linked to the poorly knownphysics of young stars, it may lead to completely reconsiderthe problem of the inflated size of CoRoT-2b and other ex-oplanets orbiting young stars.

12 G. Hebrard et al.: CoRoT-18b, a massive hot jupiter on a prograde, nearly aligned orbit
4.6. Rossiter-McLaughlin anomaly analysis
The radial velocity measured during the 2011 January 28transit were fitted in order to derive the sky-projected angleλ between the planetary orbital axis and the stellar rota-tion axis. We applied the analytical approach developedby Ohta et al. (2005) to model the Rossiter-McLaughlinanomaly shape, which use here ten parameters: the stel-lar limb-darkening linear coefficient ε, the transit param-eters Rp/R∗, a/R∗ and i, the parameters of the circularorbit (P , T0, and K), the HARPS/EGGS systemic radialvelocity, and finally v sin i∗ and λ. We adopted ε = 0.722computed by Claret (2004) in the g′ filter correspondingto the HARPS wavelength range. The transit and orbitalparameters were determined above from the light curvesand radial velocity fits, and their uncertainties are negligi-ble for the fit of the Rossiter-McLaughlin anomaly shape,according the uncertainties of the HARPS/EGGS radial ve-locities. The main parameters that play a role in this fit arethe systemic velocity, λ, and v sin i∗. As these parametersare correlated in the Rossiter-McLaughlin fit, we computedthe χ2 of the fit on a three-dimensional grid scanning theirpossible values.
The systemic velocity we obtained for the transit ob-served with HARPS/EGGS, 29.550 ± 0.016, is similar tothis obtained in Sect. 4.4 for the orbit observed withHARPS/HAM. It is constrained thanks to the observationssecured immediately before and after the transit. The con-fidence interval contours estimated from χ2 variations forthe λ and v sin i∗ are plotted in Fig. 12. We thus obtainedλ = −10◦±20◦ and v sin i∗= 8.5±2.5 km s−1. The best fitis plotted in Fig. 6. The dispersion of the residuals to thefit is 46.5 m s−1. This agrees with the expected error barson the radial velocities, and this is similar to the dispersionof the residuals to the fit of the orbit presented in Sect. 4.4.
Fig. 12. χ2 isocontours for our modeling of the Rossiter-McLaughlin effect as a function of λ and v sin i∗. The dia-mond shows the lowest-χ2 value.
The Rossiter-McLaughlin anomaly detection onlystands on a few points; however, the shape of the ra-dial velocity variations during the transit agree with aRossiter-McLaughlin feature, with λ ' 0◦ and the ex-
pected amplitude. As a statistical test for the Rossiter-McLaughlin anomaly detection, we computed the χ2 overthe 12 measurements secured during the transit night, andwe get 12.5 and 24.7 for the fits including or not theRossiter-McLaughlin anomaly, respectively. Including theRossiter-McLaughlin model in the fit thus implies a fac-tor two improvement in the χ2, for basically two extrafree parameters (λ and v sin i∗, which mainly constraintsthe Rossiter-McLaughlin shape). We performed an F-testwhich indicates there is a probability > 70% that the χ2
improvement actually is due to the Rossiter-McLaughlinanomaly detection.
Usually only the sky-projected value λ of the obliq-uity ψ could be measured because the inclination i∗ ofthe stellar rotation axis remains unknown. Here we esti-mated i∗ = 70◦ ± 20◦ (Sect. 4.2), so the sky-projected λcould be translated into the actual obliquity. We obtainψ = 20◦ ± 20◦. This value remains inaccurate, due to thesignificant uncertainties on λ and i∗. It allows, however, theconclusion that the orbit of CoRoT-18b is prograde andnearly aligned. This additionnaly reinforces the similaritybetween the CoRoT-18 and CoRoT-2 planetary systems,since CoRoT-2b is also prograde and aligned (Bouchy etal. 2008).
The v sin i∗ value obtained from this fit agrees with thisobtained in Sect. 4.2 from spectral analysis, v sin i∗= 8.0±1.0 km s−1. As discussed by, e.g., Hirano et al. (2010) andSimpson et al. (2011), modeling the Rossiter-McLaughlinanomaly could produce biased v sin i∗ measurements whenrotational broadening of the stellar lines is significantlylarger than the instrument resolution. We do not see thateffect here, possibly because of the long exposure times ofeach exposure.
5. Conclusion
We reported the detection of the 18th transiting exoplanetdetected by the CoRoT project. This giant planet wasdiscovered thanks to the high-accuracy, continuous pho-tometry obtained by the CoRoT satellite and the photo-metric and spectroscopic follow-up performed on ground-based telescopes. CoRoT-18b is a massive hot jupiter or-biting a faint G9V star. Its mass is Mp = 3.47± 0.38 MJup,and its radius Rp = 1.31 ± 0.18 RJup, implying a densityρp = 2.2 ± 0.8 g/cm3. The period of the circular orbit is1.9000693 ± 0.0000028 days. It is known with an accuracybetter than 0.25 seconds and the mean mid-transit epochwith an accuracy of 20 seconds. The mass of the host staris M? = 0.95±0.15 M� and its radius R? = 1.00±0.13 R�.The parameters of this system are summarized in Table 3.
The parameters of CoRoT-18b are similar to those ofCoRoT-2b (Alonso 2008; Gillon et al. 2010), and to a lesserextent to those of CoRoT-11b (Gandolfi 2010) and CoRoT-17b (Csizmadia et al. 2011), the other massive hot jupitersfound with CoRoT. Interestingly CoRoT-18b is found to beeither particularly young (a few tens of Ma) or old (> 4 Ga)from stellar evolution models matching the star’s effectivetemperature and inferred density, but according both toits lithium abundance and to its relatively fast rotation,it would be expected to be modestly young (several hun-dred Ma). This mismatch potentially points to a problemin our understanding of the evolution of young stars, withpossibly significant implications for stellar physics and theinterpretation of inferred sizes of exoplanets around young
G. Hebrard et al.: CoRoT-18b, a massive hot jupiter on a prograde, nearly aligned orbit 13
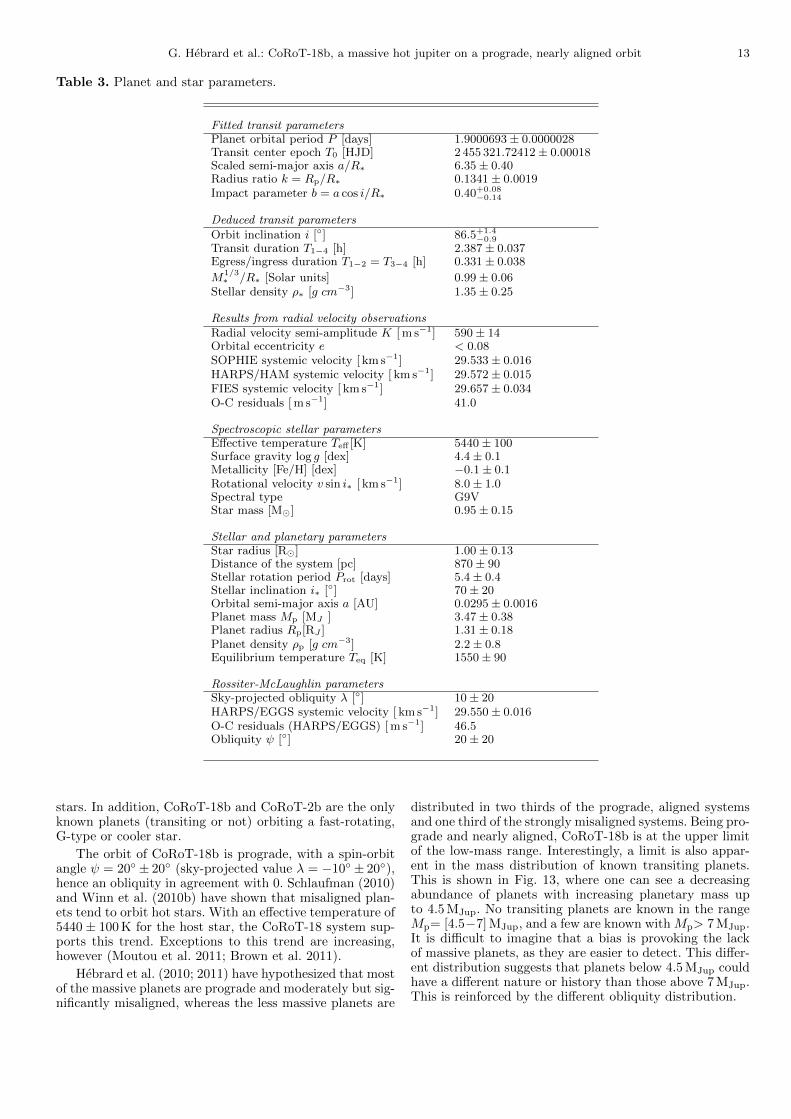
Table 3. Planet and star parameters.
Fitted transit parametersPlanet orbital period P [days] 1.9000693± 0.0000028Transit center epoch T0 [HJD] 2 455 321.72412± 0.00018Scaled semi-major axis a/R∗ 6.35± 0.40Radius ratio k = Rp/R∗ 0.1341± 0.0019Impact parameter b = a cos i/R∗ 0.40+0.08
−0.14
Deduced transit parametersOrbit inclination i [◦] 86.5+1.4
−0.9
Transit duration T1−4 [h] 2.387± 0.037Egress/ingress duration T1−2 = T3−4 [h] 0.331± 0.038
M1/3∗ /R∗ [Solar units] 0.99± 0.06
Stellar density ρ∗ [g cm−3] 1.35± 0.25
Results from radial velocity observationsRadial velocity semi-amplitude K [ m s−1] 590± 14Orbital eccentricity e < 0.08SOPHIE systemic velocity [ km s−1] 29.533± 0.016HARPS/HAM systemic velocity [ km s−1] 29.572± 0.015FIES systemic velocity [ km s−1] 29.657± 0.034O-C residuals [ m s−1] 41.0
Spectroscopic stellar parametersEffective temperature Teff [K] 5440± 100Surface gravity log g [dex] 4.4± 0.1Metallicity [Fe/H] [dex] −0.1± 0.1Rotational velocity v sin i∗ [ km s−1] 8.0± 1.0Spectral type G9VStar mass [M�] 0.95± 0.15
Stellar and planetary parametersStar radius [R�] 1.00± 0.13Distance of the system [pc] 870± 90Stellar rotation period Prot [days] 5.4± 0.4Stellar inclination i∗ [◦] 70± 20Orbital semi-major axis a [AU] 0.0295± 0.0016Planet mass Mp [MJ ] 3.47± 0.38Planet radius Rp[RJ ] 1.31± 0.18Planet density ρp [g cm−3] 2.2± 0.8Equilibrium temperature Teq [K] 1550± 90
Rossiter-McLaughlin parametersSky-projected obliquity λ [◦] 10± 20HARPS/EGGS systemic velocity [ km s−1] 29.550± 0.016O-C residuals (HARPS/EGGS) [ m s−1] 46.5Obliquity ψ [◦] 20± 20
stars. In addition, CoRoT-18b and CoRoT-2b are the onlyknown planets (transiting or not) orbiting a fast-rotating,G-type or cooler star.
The orbit of CoRoT-18b is prograde, with a spin-orbitangle ψ = 20◦ ± 20◦ (sky-projected value λ = −10◦ ± 20◦),hence an obliquity in agreement with 0. Schlaufman (2010)and Winn et al. (2010b) have shown that misaligned plan-ets tend to orbit hot stars. With an effective temperature of5440± 100 K for the host star, the CoRoT-18 system sup-ports this trend. Exceptions to this trend are increasing,however (Moutou et al. 2011; Brown et al. 2011).
Hebrard et al. (2010; 2011) have hypothesized that mostof the massive planets are prograde and moderately but sig-nificantly misaligned, whereas the less massive planets are
distributed in two thirds of the prograde, aligned systemsand one third of the strongly misaligned systems. Being pro-grade and nearly aligned, CoRoT-18b is at the upper limitof the low-mass range. Interestingly, a limit is also appar-ent in the mass distribution of known transiting planets.This is shown in Fig. 13, where one can see a decreasingabundance of planets with increasing planetary mass upto 4.5 MJup. No transiting planets are known in the rangeMp= [4.5−7] MJup, and a few are known with Mp> 7 MJup.It is difficult to imagine that a bias is provoking the lackof massive planets, as they are easier to detect. This differ-ent distribution suggests that planets below 4.5 MJup couldhave a different nature or history than those above 7 MJup.This is reinforced by the different obliquity distribution.

14 G. Hebrard et al.: CoRoT-18b, a massive hot jupiter on a prograde, nearly aligned orbit
Fig. 13. Histogram of the number of known transit-ing planets as a function of their mass (data fromhttp://exoplanet.eu).
Acknowledgements. The French teams are grateful to the CNES forits constant support and the funding of AB, JMA, CC. IAP/OHPteam acknowledges support of French National Research Agency(ANR-08-JCJC-0102-01). The team at the IAC acknowledges sup-port by grants ESP2007-65480-C02-02 and AYA2010-20982-C02-02of the Spanish Ministry of Science and Innovation (MICINN). TheGerman CoRoT Team (TLS and University of Cologne) acknowl-edges DLR grants 50OW0204, 50OW0603, and 50QM1004. We aregrateful to N. Piskunov of the Uppsala Astronomical Observatoryfor continuing to make SME available to us and for answering ques-tions about its implementation and operation. SOPHIE observations(program 10B.PNP.MOUT) were done on the 1.93-m telescope atObservatoire de Haute-Provence (CNRS), France. HARPS observa-tions (program 184.C-0639) were done on the 3.6-m telescope at theESO La Silla Paranal observatory, Chile. FIES observations (programP42-216) were done on the Nordic Optical Telescope, operated on theisland of La Palma jointly by Denmark, Finland, Iceland, Norway, andSweden, in the Spanish Observatorio del Roque de los Muchachos ofthe Instituto de Astrofisica de Canarias.
References
Alonso, R., Auvergne, M., Baglin, A., et al. 2008, A&A, 482, L21Auvergne, M., Bodin, P., Boisnard, L., et al. 2009, A&A, 506, 411Baglin, A., Auvergne, M., Barge, P., et al. 2009, Transiting Planets,
Proc. IAU Symp., 253, 71Baranne, A., Queloz, D., Mayor, M., et al. 1994, A&AS, 119, 373Bouchy, F., Queloz, D., Deleuil, M., et al. 2008, A&A, 482, L25Bouchy, F., Hebrard, G., Udry, S., et al. 2009, A&A, 505, 853Bouvier, J. 2007, IAU Symposium 243 [arXiv:0712.2988]Brown, D. J. A., Collier Cameron, A., Anderson, D. R., et al. 2011,
submitted to MNRASBuchhave, L. A., Bakos, G. A, Hartman, J., et al. 2010, ApJ, 720, 1118Claret, A., 2004, A&A, 428, 1001Csizmadia, Sz., Moutou, C., Deleuil, M., et al. 2011, A&A, 531, A41Czesla, S., Huber, K. F., Wolter, U., Schroter, S., Schmitt, J. H. M. M.
2009, A&A, 505, 1277Deeg, H. J., Gillon, M., Shporer, A., et al. 2009, A&A, 506, 343Deeg, H. J., Moutou, C., Erikson, A., et al. 2010, Nature, 464, 384Eastman, J., Siverd, R., Gaudi, B. S. 2010, PASP, 122, 935Fridlund, M., Hebrard, G., Alonso, R., et al. 2010, A&A, 512, A14Gandolfi, D., Alcala, J.M., Leccia, S., et al. 2008, ApJ, 687, 1303Gandolfi, D., Hebrard, G., Alonso, R., et al. 2010, A&A, 524, A55Gelman, A., Rubin, D. B. 1992, Statistical Science, 7, 457Gibson, N. P., Pollacco, D., Simpson, E. K., et al. 2008, A&A, 492, 603Gillon, M., Lanotte, A. A., Barman, T., et al. 2010, A&A, 511, A3Guillot, T., Havel, M. 2011, A&A, 527, A20Hebrard, G., Bouchy, F., Pont, F., et al. 2008, A&A, 481, 52
Hebrard, G., Dessert, J.-M, Dıaz, R. F., et al. 2010, A&A, 516, A95Hebrard, G., Ehrenreich, D., Bouchy, F., et al. 2011, A&A, 527, L11Hillenbrand, L., Mamajek, E., Stauffer, J., et al. 2009, American
Institute of Physics Conference Series, 1094 [arXiv: 0812.1262]Hirano, T., Suto, Y., Taruya, A., et al. 2010, ApJ, 709, 458Holman, M. J., Murray, N. W. 2005, Science, 307, 1288Holman, M. J., Fabrycky, D. C., Ragozzine, D., et al. 2010, Science,
330, 51Kawaler, S. D. 1989, ApJ, 343, L65Kipping, D. M. 2010a, MNRAS, 407, 301Kipping, D. M. 2010b, MNRAS, 408, 1758Kovacs, G., Zucker, S., Mazeh, T. 2002, A&A, 391, 369Kupka, F., Piskunov, N., Ryabchikova, T., et al. 1999, A&AS, 138, 119Leger, A., Rouan, D., Schneider, J., et al. 2009, A&A, 506, 287Mandel, K., Agol, E. 2002, ApJ, 580, L171Mayor, M., Pepe, F., Queloz, D., et al. 2003, Msngr., 114, 20Morel, P., Lebreton, Y. 2008, Ap&SS, 316, 61Moutou, C., Dıaz, R. F., Udry, S., et al. 2011, submitted to A&AOhta, Y., Taruya, A, Suto, Y. 2005, ApJ, 622, 1118Pal, A. 2009, PhD Thesis Eotvos Lorand University, 2009Pepe, F., Mayor, M., Galland, F., et al. 2002, A&A, 388, 632Pollacco, D., Skillen, I., Collier Cameron, A., et al. 2007, MNRAS,
385, 1576Pont, F., Zucker, S., Queloz, D. 2006, MNRAS, 373, 231Piskunov, N. E., Kupka, F., Ryabchikova, T. A., Weiss, W. W.,
Jeffery, C. S. 1995, A&AS, 112, 525Queloz, D., Bouchy, F., Moutou, C., et al. 2009, A&A, 506, 303Santos, N. C., Mayor, M., Naef, D., et al. 2002, A&A, 392, 215Schlaufman, K. C. 2010, ApJ, 719, 602Seager, S. Mallen-Ornelas, G. 2003, ApJ, 585, 1038Simpson, E. K., Pollacco, D., Collier Cameron, A., et al. 2011,
MNRAS, 414, 3023Sing, D. K. 2010, A&A, 510, A21Soderblom, D., Jones, B., Balachandran, S., et al. 1993, AJ, 106, 1059Surace, C., Alonso, R., Barge, P., et al. 2008, in SPIE Conf., 7019Udry, S., Mayor, M., Queloz, D. 1999, ASPC, 185, 367Valenti, J. A., Fischer, D. A. 2005, ApJS, 159, 141Valenti, J. A., Piskunov, N. 1996, A&AS, 118, 595
Vidal-Madjar, A., Lecavelier des Etangs, A., Desert, et al. 2003,Nature, 422, 143
Wheatley, P. J., Collier Cameron, A., Harrington, J., et al. 2010, ApJ,submitted [arXiv:1004.0836]
Winn, J. N., Holman, M. J., Torres, G., et al. 2008, ApJ, 683,1076Winn, J. N. 2010a, arXiv:1001.2010Winn, J. N., Fabrycky, D., Albrecht, S., Johnson, J. A. 2010b, ApJ,
718, L145
1 Institut d’Astrophysique de Paris, UMR7095 CNRS,Universite Pierre & Marie Curie, 98bis boulevard Arago,75014 Paris, France e-mail: [email protected]
2 Observatoire de Haute-Provence, CNRS/OAMP, 04870Saint-Michel-l’Observatoire, France
3 Department of Physics, Denys Wilkinson Building KebleRoad, Oxford, OX1 3RH, UK
4 Observatoire de l’Universite de Geneve, 51 chemin desMaillettes, 1290 Sauverny, Switzerland
5 Research and Scientific Support Department, EuropeanSpace Agency, Keplerlaan1, NL-2200AG, Noordwijk,The Netherlands
6 School of Physics and Astronomy, Raymond and BeverlySackler Faculty of Exact Sciences, Tel Aviv University, TelAviv, Israel
7 Observatoire de la Cote d’Azur, Laboratoire Cassiopee, BP4229, 06304 Nice Cedex 4, France
8 Laboratoire d’Astrophysique de Marseille, 38 rue FredericJoliot-Curie, 13388 Marseille cedex 13, France
9 Instituto de Astrofısica de Canarias, and Universidadde La Laguna, Dept. de Astrofısica, 38205 La Laguna,Tenerife, Spain
10 LESIA, Observatoire de Paris, Place J. Janssen, 92195Meudon cedex, France
11 Institut d’Astrophysique Spatiale, Universite Paris XI, 91405Orsay, France

G. Hebrard et al.: CoRoT-18b, a massive hot jupiter on a prograde, nearly aligned orbit 15
12 Institute of Planetary Research, German Aerospace Center,Rutherfordstrasse 2, 12489 Berlin, Germany
13 Rheinisches Institut fur Umweltforschung an der Universitatzu Koln, Aachener Strasse 209, 50931, Germany
14 University of Vienna, Institute of Astronomy,Turkenschanzstr. 17, 1180 Vienna, Austria
15 IAG, Universidade de Sao Paulo, Brazil16 University of Liege, Allee du 6 aout 17, Sart Tilman,
Liege 1, Belgium17 Thuringer Landessternwarte Tautenburg, Sternwarte 5,
07778 Tautenburg, Germany18 Space Research Institute, Austrian Academy of Science,
Schmiedlstr. 6, 8042 Graz, Austria19 Center for Astronomy and Astrophysics, TU Berlin,
Hardenbergstr. 36, 10623 Berlin, Germany20 LUTH, Observatoire de Paris, CNRS, Universite Paris
Diderot; 5 place Jules Janssen, 92195 Meudon, France


![Transiting exoplanets from the CoRoT space mission. - arXiv · 2018. 9. 5. · arXiv:1504.01532v2 [astro-ph.EP] 30 Jun 2015 Astronomy&Astrophysicsmanuscript no. corot28b29b c ESO](https://img.pdfslide.us/doc/110x75/60db972d1079b31824798877/transiting-exoplanets-from-the-corot-space-mission-arxiv-2018-9-5-arxiv150401532v2.jpg)