Embed Size (px)
Citation preview

CoRoT and Kepler time seriesFocus session on time domain astronomy
IVOA Interoperability meeting, Heidelberg, 12-17 May, 2013
J. DebosscherInstituut voor Sterrenkunde, KULeuven, Belgium

CoRoT Kepler
● Polar orbit● 27 cm mirror telescope● visual light ● 4 2k x 2k CCD imagers● Several observed fields (each about 3 x 3 deg)
● Earth trailing orbit● 0.95 m mirror telescope● visual light ● 42 2k x 1k CCD imagers● 1 observed field (105 deg2)
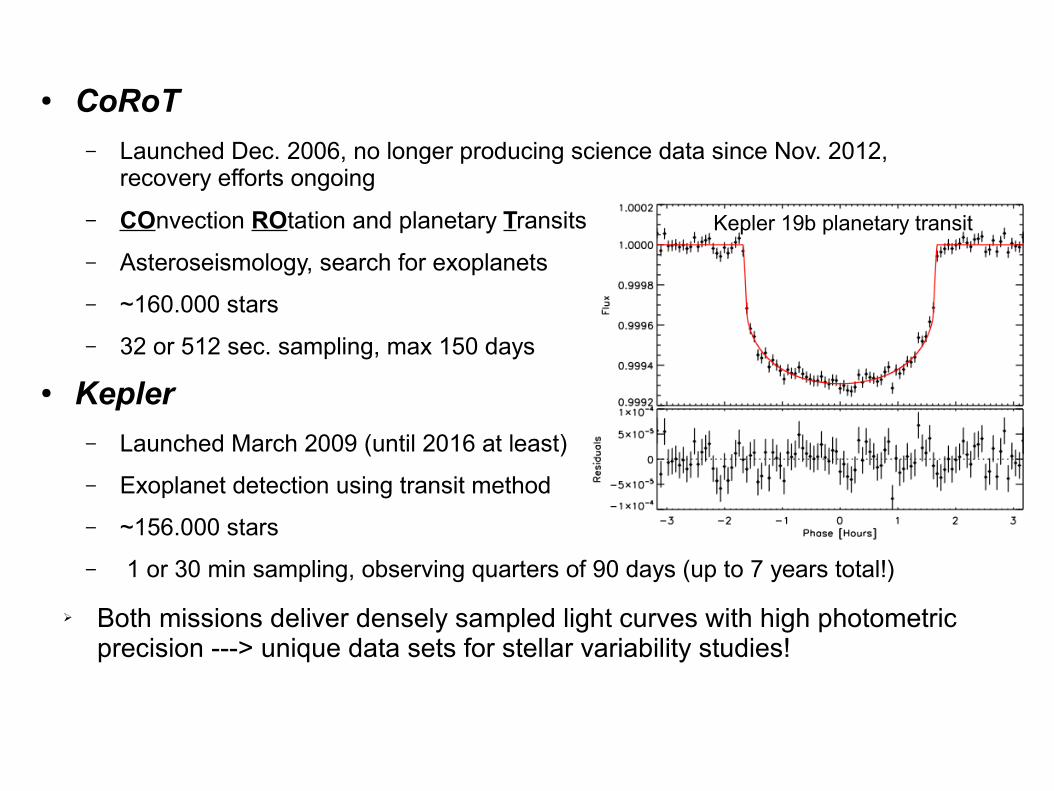
● CoRoT– Launched Dec. 2006, no longer producing science data since Nov. 2012,
recovery efforts ongoing– COnvection ROtation and planetary Transits – Asteroseismology, search for exoplanets – ~160.000 stars– 32 or 512 sec. sampling, max 150 days
● Kepler– Launched March 2009 (until 2016 at least)– Exoplanet detection using transit method– ~156.000 stars– 1 or 30 min sampling, observing quarters of 90 days (up to 7 years total!)
➢ Both missions deliver densely sampled light curves with high photometric precision ---> unique data sets for stellar variability studies!
Kepler 19b planetary transit


Time series (light curve) data● Data volumes (minimum): ~1TB for CoRoT, ~ 10TB for Kepler
(will be much more for e.g. LSST and Gaia!) ● Minimal data delivery for users: target ID, coordinates, stellar
flux time series (ASCII or FITS format)● Often more information is needed (usually present in FITS
files headers)– Instrument parameters (e.g. to identify artifacts in the data)– Data reduction information, e.g. background flux, noise levels,
quality flags...– Additional time columns, e.g. barycentric or heliocentric Julian
dates– Additional flux columns (different data reduction or extraction)– Complementary data from other databases & higher level
metadata

CoRoT Data Center at IAS: http://idoc-corot.ias.u-psud.fr/ Downloading CoRoT light curves per observed run
Tar archives with FITS files, format depends on type of light curves (some are multi-colour)

Selection based on classification results obtained from the light curves
Selection based on target properties such as spectral type, from other than CoRoT data
Selecting light curves based on their properties and/or target properties obtained from external observations

Higher level data products: light curve classification
Results from an automated supervised light curve classifier, very useful for selecting science targets!
Debosscher et al., 2007, 2009

/ γ Dor
Light curve classification example

CoRoT data tools at the Spanish VOhttp://sdc.cab.inta-csic.es/corotfa/
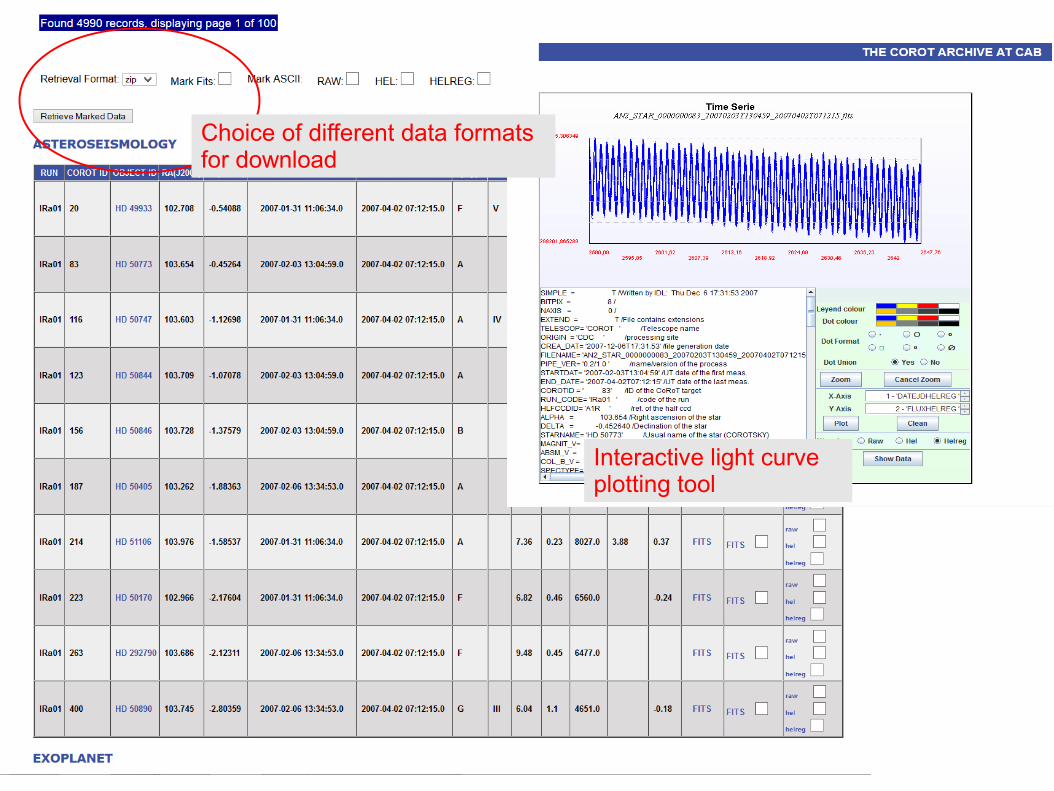
Interactive light curve plotting tool
Choice of different data formats for download

Kepler data at KASOC (Kepler Asteroseismic Science Operations Center)
http://kasoc.phys.au.dk/
-Target query (using identifiers or based on observed properties)-Light curve and Fourier amplitude spectrum visualization tools

Kepler data at the MAST archivehttp://archive.stsci.edu/kepler/data_search/search.php

Extended light curve data products: Kepler pixel data
Small image of CCD pixels covering the target, for each measurement (in stead of just one summed flux value)
Aperture mask, determines which pixels are summed to produce the light curve

How can VO help for stellar variability studies?
● Time series data (single bandpass) are not sufficient to fully characterize and study stars!➔ Use VO to complement time series with other
observational and higher level data, such as high-resolution spectroscopy, photometry in other bands, temperatures, gravities, parallaxes...
Combining CoRoT light curves and spectroscopy(Sarro et al., 2013)
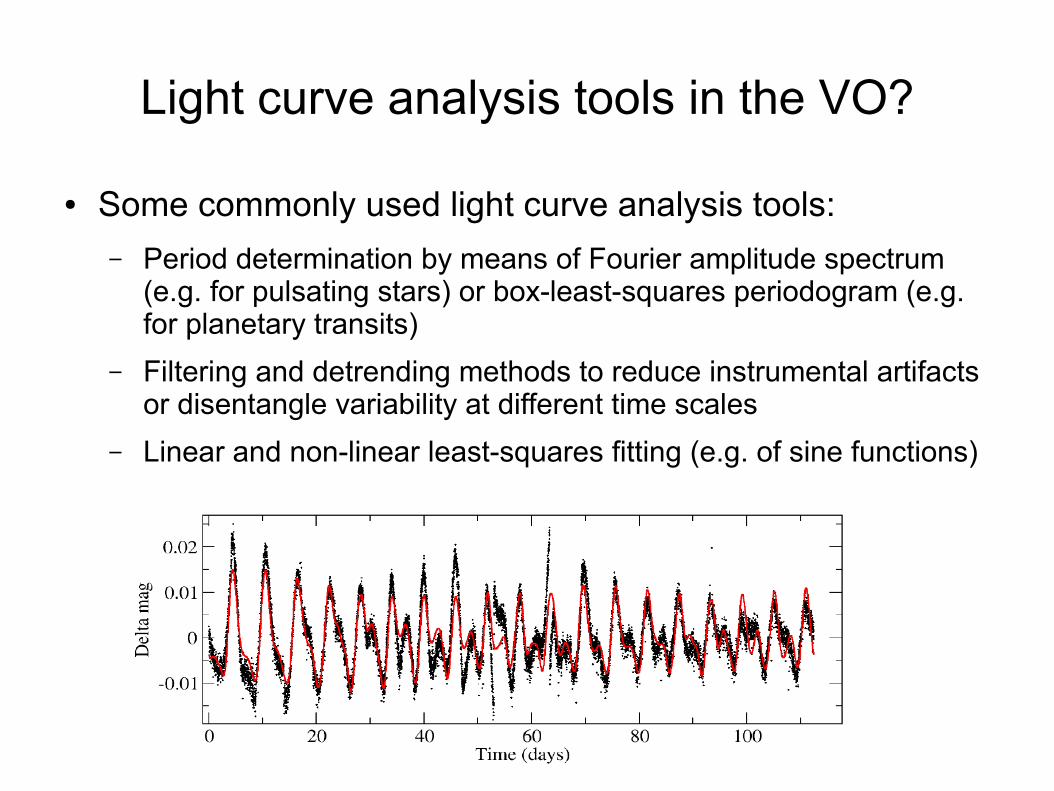
Light curve analysis tools in the VO?
● Some commonly used light curve analysis tools:– Period determination by means of Fourier amplitude spectrum
(e.g. for pulsating stars) or box-least-squares periodogram (e.g. for planetary transits)
– Filtering and detrending methods to reduce instrumental artifacts or disentangle variability at different time scales
– Linear and non-linear least-squares fitting (e.g. of sine functions)

Stellar variability data mining and the VO● Combining large observational data sets for data mining
purposes, constructing training sets for light curve classifiers● Data mining tools such as dimensionality reduction and
clustering techniques in the VO?– scalability of methods with future data amounts in mind


![IVOA Spectrum Data Model - arxiv.org · arXiv:1204.3055v1 [astro-ph.IM] 13 Apr 2012 IVOA Spectrum Data Model Version 1.1 IVOA Recommendation 20 November 2011 This version (Recommendation](https://img.pdfslide.us/doc/110x75/5f236e7d91a04e743274ef3f/ivoa-spectrum-data-model-arxivorg-arxiv12043055v1-astro-phim-13-apr-2012.jpg)