Embed Size (px)
Citation preview
University of Maryland Technical Report UMIACS-TR-2009-16
Scaling Single-Program Performance on Large-Scale
Chip Multiprocessors
Meng-Ju Wu and Donald Yeung
Department of Electrical and Computer Engineering
University of Maryland at College Park
{mjwu,yeung}@umd.edu
Abstract
Due to power constraints, computer architects will exploit TLP instead of ILP for future per-
formance gains. Today, 4–8 state-of-the-art cores or 10s of smaller cores can fit on a single die.
For the foreseeable future, the number of cores will likely double with each successive processor gen-
eration. Hence, CMPs with 100s of cores–so-called large-scale chip multiprocessors (LCMPs)–will
become a reality after only 2 or 3 generations.
Unfortunately, simply scaling the number of on-chip cores alone will not guarantee improved
performance. In addition, effectively utilizing all of the cores is also necessary. Perhaps the greatest
threat to processor utilization will be the overhead incurred waiting on the memory system, especially
as on-chip concurrency scales to 100s of threads. In particular, remote cache bank access and
off-chip bandwidth contention are likely to be the most significant obstacles to scaling memory
performance.
This paper conducts an in-depth study of CMP scalability for parallel programs. We assume a
tiled CMP in which tiles contain a simple core along with a private L1 cache and a local slice of
a shared L2 cache. Our study considers scaling from 1–256 cores and 4–128MB of total L2 cache,
and addresses several issues related to the impact of scaling on off-chip bandwidth and on-chip
1
communication. In particular, we find off-chip bandwidth increases linearly with core count, but
the rate of increase reduces dramatically once enough L2 cache is provided to capture inter-thread
sharing. Our results also show for the range 1–256 cores, there should be ample on-chip bandwidth
to support the communication requirements of our benchmarks. Finally, we find that applications
become off-chip limited when their L2 cache miss rates exceed some minimum threshold. Moreover,
we expect off-chip overheads to dominate on-chip overheads for memory intensive programs and
LCMPs with aggressive cores.
1 Introduction
Due to power budget constraints, computer architects now scale the number of cores on a chip,
relying on thread-level parallelism (TLP) instead of instruction-level parallelism (ILP) for future
performance improvements. This requires sufficient TLP exists in the first place to effectively
utilize the available cores. Not surprisingly, workloads exhibiting TLP “out of the box”–e.g.,
multiprogrammed and transaction processing workloads–have been the primary sources of TLP to
date. But as programmers and compilers become more proficient at exposing TLP in sequential
codes, parallel programs will increase in importance. This will enable single-program performance,
in addition to system throughput, to benefit from chip multiprocessor (CMP) scaling.
The performance benefits from program parallelization are potentially significant due to the large
number of cores that will become available in future CMPs. Today, 4–8 state-of-the-art cores or 10s
of smaller cores [1, 2] can fit on a single die. Since Moore’s law scaling is expected to continue at
historic rates for the foreseeable future [3], the number of cores will likely double with each successive
processor generation. CMPs with 100s of cores–so-called large-scale CMPs (LCMPs) [4, 5]–will
become a reality after only 2 or 3 generations. While not all programs will be able to exploit
LCMPs, many applications in emerging domains, such as data mining [6], bioinformatics [7], and
machine learning [8], exhibit abundant TLP. For these applications, LCMPs offer the potential for
2
unprecendented performance gains.
Unfortunately, simply scaling the number of on-chip cores alone will not guarantee improved
performance for parallel programs. In addition, effectively utilizing all of the cores is also necessary.
Perhaps the greatest threat to achieving high processor utilization will be the overhead incurred
waiting on the memory system, especially as concurrency reaches 100s of threads. Hence, the
scalability of the memory hierarchy will be critical to realizing performance on LCMPs.
Two sources of memory overhead are most likely to limit scalability. One of them is remote cache
access. To keep up with the enormous volume of memory requests generated by 100s of cores, the
on-chip cache in an LCMP will be aggressively banked and distributed across the die. Banking
gives rise to non-uniform cache access due to each core’s varying proximity to the different cache
banks [9], resulting in higher latency and greater on-chip communication traffic. Data replication
and migration techniques [10, 11, 12] can help bring a core’s working set into nearby banks, but their
effectiveness can be limited. As core count and cache capacity scale, the volume of and distance to
remotely situated data will likely increase, exascerbating the remote cache access problem.
Another scaling limitation is contention for off-chip bandwidth. As more and more cores are
integrated, the number of simultaneous requests to off-chip memory will increase. However, due
to packaging constraints, off-chip bandwidth is expected to grow much more slowly than core
count [13], potentially creating a bottleneck at the off-chip interface. Even for uniprocessors [14]
and small-scale CMPs [15], the off-chip bandwidth bottleneck can already be severe. The problem
will become worse for LCMPs.
Understanding the limits on CMP scaling for parallel programs, particularly due to remote cache
access and contention for off-chip bandwidth, is crucial to the design of future LCMPs. Despite
its importance, surprisingly little is known about this problem. While there have been numerous
studies to mitigate remote cache accesses [16, 17, 18, 19, 20, 12, 21, 22], none of them have considered
3
CMPs with more than 16 cores. Hence, there is no experience with remote cache access at the LCMP
scale. In comparison, more is known about off-chip bandwidth contention. Several researchers have
studied contention effects at 100s of threads [23, 4, 15, 13, 5]. However, these studies focused on
throughput workloads only, providing no insight for parallel programs. Moreoever, none of them
considered last-level caches with more than 32MB–large by today’s standards, but potentially small
for future LCMPs.
This paper improves the state-of-the-art understanding of LCMPs by conducting an in-depth
study on their scalability for parallel programs. Our study assumes a tiled CMP [11] in which tiles
contain a simple core along with a private L1 cache, a local slice of a shared L2 cache, and a switch
for a 2-D on-chip mesh network. We develop a simulator that employs a very simple core model,
but accurately simulates the memory hierarchy to enable detailed evaluation of its scaling. Using
this simulator, we evaluate LCMPs with up to 256 cores/tiles and 128MB of total L2 cache.
Our work addresses three major questions. First, how does off-chip bandwidth vary with thread
and cache capacity scaling? We characterize the variation in off-chip bandwidth across the complete
cross product of CMPs containing 1-256 cores and 4-128MB of L2 cache. We find off-chip bandwidth
varies significantly across different applications, suggesting the right amount of off-chip bandwidth
that future LCMPs should provide is highly application dependent. Our results also show off-
chip bandwidth often increases linearly with core count; however, for parallel programs with data
sharing, the rate of bandwidth increase reduces dramatically once enough L2 cache is provided to
capture inter-thread data sharing.
Second, how does on-chip communication vary with thread scaling? We examine the fraction of
L2 references destined to remote tiles for the same CMP design space mentioned above. For our
shared L2 cache, we find the total on-chip communication scales as P3
2 , where P is the number
of cores. We also find for the range 1–256 cores, there is ample on-chip bandwidth to support
4
the communication requirements for all our benchmarks. And lastly, what is the relative impact
of the off-chip and on-chip memory overheads on overall scalability? We conduct performance
simulations to quantify the contribution of both sources of memory overhead to IPC. Our results
show when the L2 miss rate is larger (smaller) than a break-even miss rate, the off-chip (on-chip)
overhead dominates. For our benchmarks, both off-chip and on-chip overheads are significant, with
the former being slightly more dominant. Given larger problem sizes and more aggressive cores, we
expect the off-chip bottleneck will become even more dominant.
The remainder of this paper is organized as follows. Section 2 discusses related work. Then,
Section 3 presents our experimental methodology. Next, Sections 4 and 5 study scaling’s impact
on off-chip bandwidth and on-chip communication, respectively, and Section 6 shows their relative
impact on overall performance. Finally, Section 7 concludes the paper.
2 Related Work
Several researchers have conducted CMP design space explorations [23, 4, 15, 24, 25, 13, 5].
Our work is closely related to these previous studies. Like them, we vary core count and on-chip
cache capacity, quantifying the impact these parameters have on off-chip bandwidth and overall
performance. But to our knowledge, we are the first to investigate CMPs with up to 256 cores and
128MB last-level caches (LLCs). Early studies considered much smaller CMPs–up to 32 cores and
32MB LLCs [24, 25]. Other studies considered larger CMPs in terms of cores–up to 128 [4, 15]–
but still assumed fairly small LLCs–up to 32MB. Still other studies considered CMTs with up to
34 cores [23, 5], but studied large-scale parallelism–up to 240 threads–when factoring in per-core
multithreading. But these studies also employed relatively small LLCs–up to 18MB.
Compared to previous research, our work looks much farther down the scaling roadmap, par-
ticularly in the amount of on-chip cache (32MB LLCs are soon-to-be, if not already, realizable).
Perhaps more importantly, previous work only sampled a limited number of CMP configurations,
5
whereas our study explores the complete cross product of 1-256 cores and 4-128MB LLCs, shed-
ding light on the entire design space. One recent study does look at a design space comparable to
ours [13], but they report analytical results only. In contrast, our study provides simulation results.
Another key difference is previous studies focused primarily on throughput workloads–in par-
ticular, multiprogrammed [15, 24, 13] and transaction processing workloads [23, 4, 5]. Instead,
we consider parallel programs, so our results reflect the impact of LCMPs on single-program per-
formance. As such, sharing plays a greater role in our work. (While transaction processing does
exhibit sharing, previous studies [4, 5] employed trace-driven simulation that assumed 0% shar-
ing between per-thread traces). In terms of workloads, our study is closest to [25] which also
investigated parallel programs. But as mentioned earlier, this study only considers 32 cores.
Our work is also closely related to research on LLC organization and the related techniques to
improve on-chip physical locality. Large LLCs are typically banked, where the banks are managed
as shared or private with respect to cores. Shared caches permit flexible use of the aggregate
cache capacity, resulting in low miss rate, whereas private caches keep each core’s data physically
close, resulting in low access time. Significant research has tried to combine shared and private
schemes to inherit benefits from both. Some techniques start from a shared organization, but permit
migration [10, 17, 19] or replication [11] to bring cache blocks closer to their referencing core(s).
Other techniques start from a private organization, but allow some sharing by pushing victims
into neighboring banks exhibiting less capacity pressure [16, 26, 27]. Because these techniques are
performed at the cache block level, they require changes to the cache lookup and/or coherence
protocol hardware. To mitigate hardware complexity, there has also been significant research on
page-based techniques [28, 18, 12, 20]. These techniques start from a shared organization, but
perform intelligent placement, migration, and replication of pages in the OS to improve physical
locality.
6
Similar to this prior research, our work also addresses cache utilization and physical locality
issues for banked LLCs. But rather than develop new techniques, we focus on characterizing
the utilization and locality issues when scaling to 100s of cores. We study the scheme with the
smallest hardware requirement (and also the best cache utilization)–a basic shared cache without
migration or replication–as this approach has the greatest chance for scaling to 100s of cores.
Our goal is to quantify how severe the on-chip physical locality problem becomes for this simple
approach, especially in comparison to off-chip overheads. To our knowledge, our work is the first
to consider physical locality issues for 256 cores–previous research on LLC locality management
has not considered more than 16 cores–and to examine the relative importance of on-chip versus
off-chip memory overheads at this large scale.
Finally, our work investigates performance scaling only; we do not consider how power scales. A
small number of previous CMP studies have looked at power scaling [24, 25], but the majority have
not. Understanding the limitations on scaling LCMPs due to power constraints is critical, and an
important direction for future work.
3 Experimental Methodology
This section presents our experimental methodology. Section 3.1 discusses architectural assump-
tions. Then, Section 3.2 presents our simulator, and Section 3.3 describes our benchmarks.
3.1 Tiled CMPs
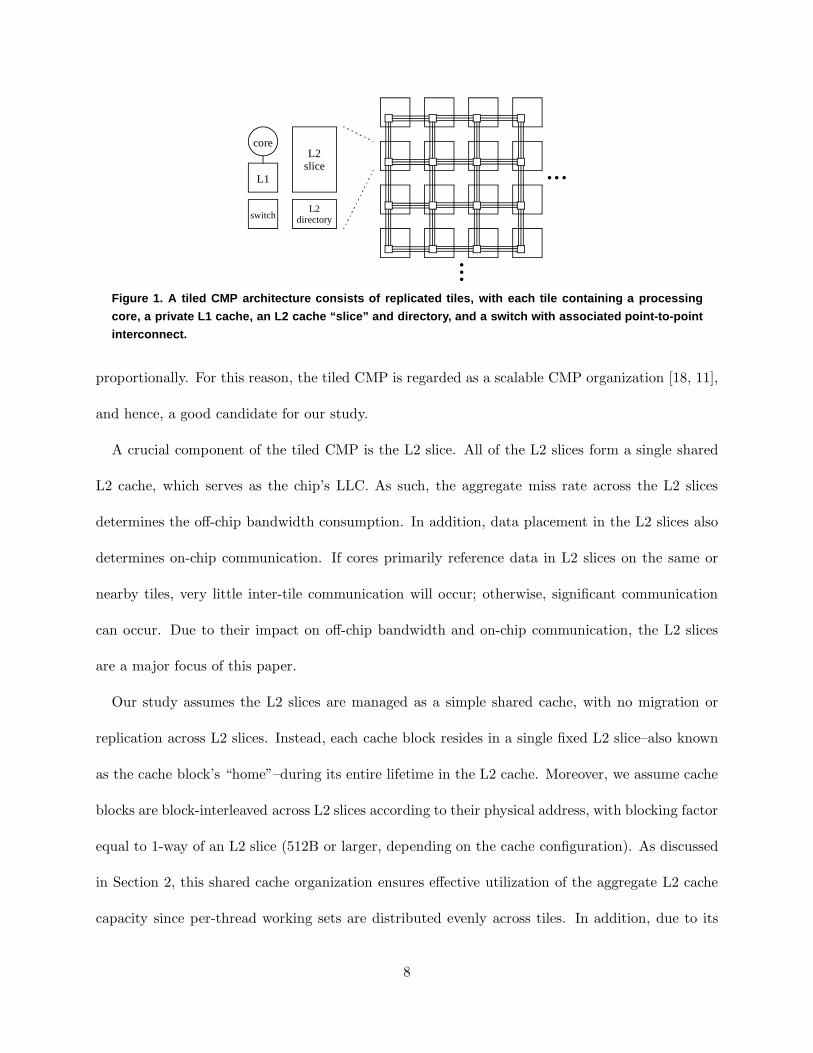
All experiments performed in this paper assume a tiled CMP architecture, illustrated in Figure 1.
In a tiled CMP, multiprocessor hardware resources are grouped into tiles, which are replicated given
the available chip area to form the overall CMP. In particular, the tile (or replication unit) includes
a processing core, a private L1 cache, an L2 cache “slice” and cache coherence directory, as well
as a switch with associated point-to-point interconnect for a 2-dimensional mesh on-chip network.
As tiles are replicated, all CMP resources–including cores, cache, and communication–increase
7
core
L1
L2slice
switchL2
directory
...
...
Figure 1. A tiled CMP architecture consists of replicated ti les, with each tile containing a processing
core, a private L1 cache, an L2 cache “slice” and directory, a nd a switch with associated point-to-point
interconnect.
proportionally. For this reason, the tiled CMP is regarded as a scalable CMP organization [18, 11],
and hence, a good candidate for our study.
A crucial component of the tiled CMP is the L2 slice. All of the L2 slices form a single shared
L2 cache, which serves as the chip’s LLC. As such, the aggregate miss rate across the L2 slices
determines the off-chip bandwidth consumption. In addition, data placement in the L2 slices also
determines on-chip communication. If cores primarily reference data in L2 slices on the same or
nearby tiles, very little inter-tile communication will occur; otherwise, significant communication
can occur. Due to their impact on off-chip bandwidth and on-chip communication, the L2 slices
are a major focus of this paper.
Our study assumes the L2 slices are managed as a simple shared cache, with no migration or
replication across L2 slices. Instead, each cache block resides in a single fixed L2 slice–also known
as the cache block’s “home”–during its entire lifetime in the L2 cache. Moreover, we assume cache
blocks are block-interleaved across L2 slices according to their physical address, with blocking factor
equal to 1-way of an L2 slice (512B or larger, depending on the cache configuration). As discussed
in Section 2, this shared cache organization ensures effective utilization of the aggregate L2 cache
capacity since per-thread working sets are distributed evenly across tiles. In addition, due to its
8
simplicity, it is easy to scale in terms of hardware complexity. However, it does not attempt to
colocate cores with their referenced data, exascerbating remote cache accesses.
To help address remote cache accesses, we manage the L1 caches as private caches, permitting
replication of data in each core’s local L1. Coherence across L1 caches is maintained via directory-
based cache coherence using a MESI protocol. We assume each cache block’s directory entry is
colocated with its associated data, i.e. on the cache block’s home tile. Moreover, we assume full-map
directories, with each slice of the directory containing an entry for every cache block in its associated
L2 slice. This approach can lead to large directories. However, much lower directory overhead can
be achieved by maintaining the directory as a cache since the number of active directory entries
grows with the total chip-wide L1 capacity and not the L2 capacity. We do not evaluate such an
optimization in this paper.
3.2 Simulator
For our experiments, we use the M5 simulator [29], modified to model the tiled CMP described
in Section 3.1. Specifically, we implemented a directory-based cache coherence protocol, and added
a 2-dimensional point-to-point mesh network. In addition to the changes for tiled CMPs, we also
significantly modified M5’s memory sub-system model to support multiple DRAM channels (4 in
our case), each associated with a memory controller placed on a special “memory tile” at the
periphery of the on-chip mesh network. In our simulator, we place the memory controllers on
the north and south faces of the chip, evenly spaced part. In total, we model 32 GB/sec off-chip
bandwidth.
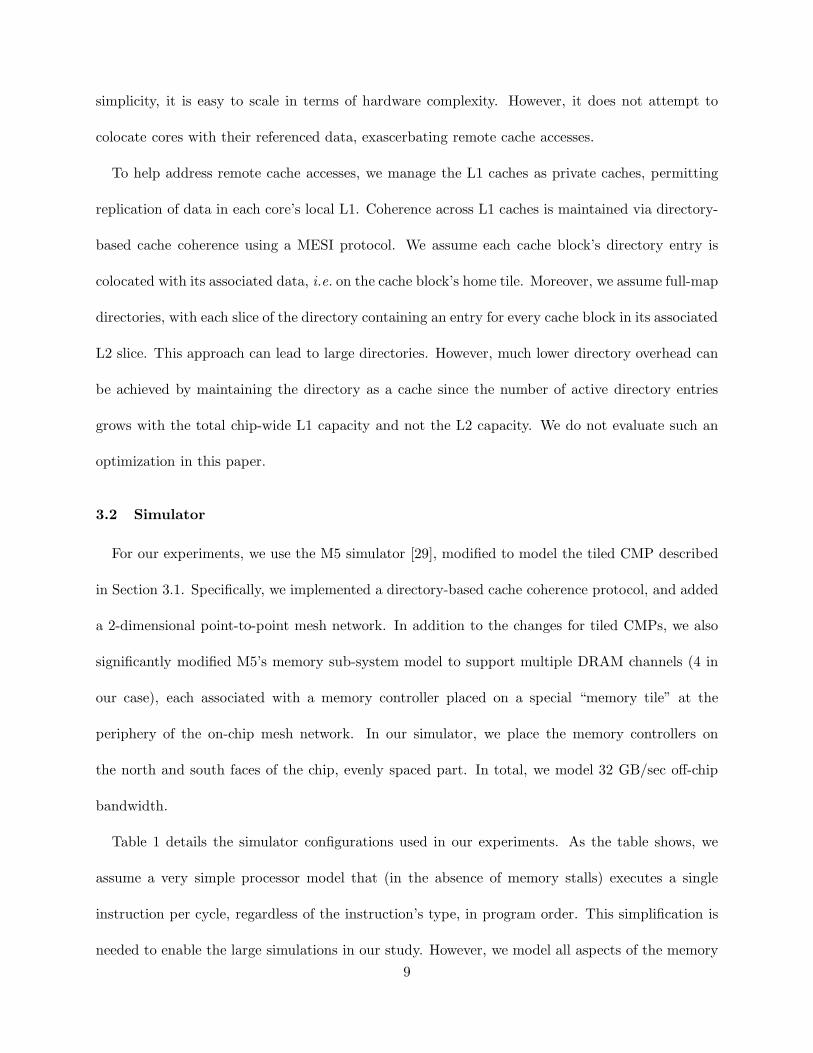
Table 1 details the simulator configurations used in our experiments. As the table shows, we
assume a very simple processor model that (in the absence of memory stalls) executes a single
instruction per cycle, regardless of the instruction’s type, in program order. This simplification is
needed to enable the large simulations in our study. However, we model all aspects of the memory
9
Number of Tiles 1 – 256Core Type Single issue, In-order, CPI = 1, clock speed = 2GHzIL1/DL1 32KB/32KB, 64B block, 4-way, 1 cycle
Total L2 Cache Size 4MB – 128MB, L2 Slice: 64B blocks, 32-way, 10 cycles2DMesh 3 cycles per-hop, bi-directional channels, 256-bit wide links
Memory channels latency: 300-CPU cycles, bandwidth: 4x8B/cycle with bus speed = 1GHz
Table 1. Simulator parameters used in the experiments.
hierarhcy accurately. In particular, we account for all latencies, including L1 access, hops through
the on-chip network, L2 slice access, and DRAM access. The latter includes latency for the first
word and transfer of remaining words. In addition to these latencies, we also account for queuing
delays at the on-chip network switches as well as the memory controllers during DRAM accesses.
In Sections 4 and 5, we consider a large design space, consisting of the cross product of tiled
CMPs with 1–256 cores and 4–128MB of total L2 cache. When scaling the L2 cache, we always
assume the total capacity is evenly divided amongst tiles; hence, the size of each L2 slice is always
the total L2 size divided by the number of tiles. These experiments only consider total traffic,
either to off-chip memory or across the on-chip network, and thus do not account for latency. In
Section 6, we conduct simulations that additionally account for latency to quantify the impact
of the on-chip/off-chip traffic on performance. All of our experiments only consider execution of
application code without any operating system code (i.e., the OS is emulated) due to the difficulty
of performing full-system simulations at 256 cores.
In addition to the above simulator modifications, we also created a basic user-level threading
library that provides support for thread creation/termination and lock/barrier synchronization.
The synchronization primitives are implemented on top of shared memory, with all the associated
shared memory overheads accurately simulated.
10
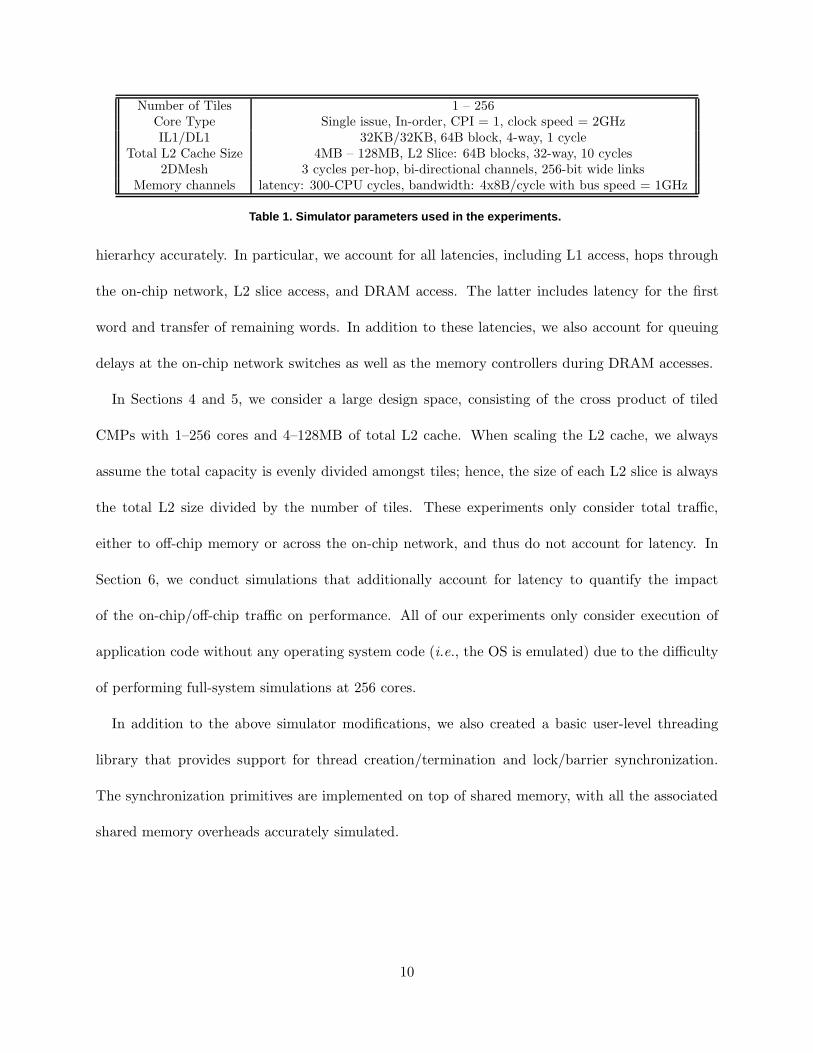
Benchmark Problem Size Insts(Billions) Simulation Region
MADD 4,096 x 2,048 0.101 whole programFFT 222 elements 2.61 whole programLU 4,096 x 4,096 26.90 first 8 iterationsKMeans 1,238,650 Objects, 16 features 9.31 1 timestepBlackScholes 3,145,728 options 4.52 1 timestepBarnes 524,288 particles 55.22 1 timestep
Table 2. Parallel benchmarks used to drive the simulations.
3.3 Benchmarks
Table 2 lists the benchmarks used in our study. We employ 6 parallel programs in total: matrix
add (MADD), FFT, LU decomposition, KMeans, BlackScholes, and Barnes-Hut. FFT, LU, and
Barnes are from the SPLASH2 suite [30], while KMeans is from the NU-MineBench suite [6] and
BlackScholes is from the PARSEC suite [31]. MADD is our own implementation of matrix add.
The second column of Table 2 indicates the problem size used for each benchmark. In all our
simulations, we execute the initialization portion of each program on a single core. (For all of our
benchmarks, initialization is performed sequentially). After simulation of the initialization code,
we clear statistics, and simulate the parallel region for the number of instructions reported in the
third column of Table 2. For MADD and FFT, the parallel regions we simulate represent the entire
program. For KMeans, BlackScholes, and Barnes, we simulate 1 timestep of the algorithm. This
is indicated in the last column of Table 2. For all of our results, we report the statistics only from
the parallel region.
4 Scaling Impact on Off-Chip Bandwidth
We begin our study by investigating off-chip bandwidth requirements. Section 4.1 introduces
our bandwidth metric, P-way bytes/instruction (PBI), and uses it to quantify off-chip bandwidth.
Then, Section 4.2 introduces our analysis on constant-PBI contours. Lastly, Section 4.3 continues
this analysis, accounting for what we call “small-slope regions” in our CMP design space.
11
MADD FFT LU KMeans BlackScholes Barnes
8C/4MB 16.01 1.85 0.32 0.16 0.15 0.09032C/16MB 63.20 (3.9) 7.52 (4.1) 1.22 (3.8) 0.65 (4.1) 0.53 (3.5) 0.33 (3.7)128C/64MB 236.47 (3.7) 27.38 (3.6) 4.36 (3.6) 2.53 (3.9) 1.77 (3.3) 0.75 (2.3)256C/128MB 354.73 (1.5) 33.40 (1.2) 1.84 (0.42) 1.41 (0.56) 1.71 (0.97) 0.20 (0.27)256C/64MB 477.39 56.68 7.87 4.96 3.51 1.45256C/32MB 501.27 63.48 8.03 5.21 4.18 2.38
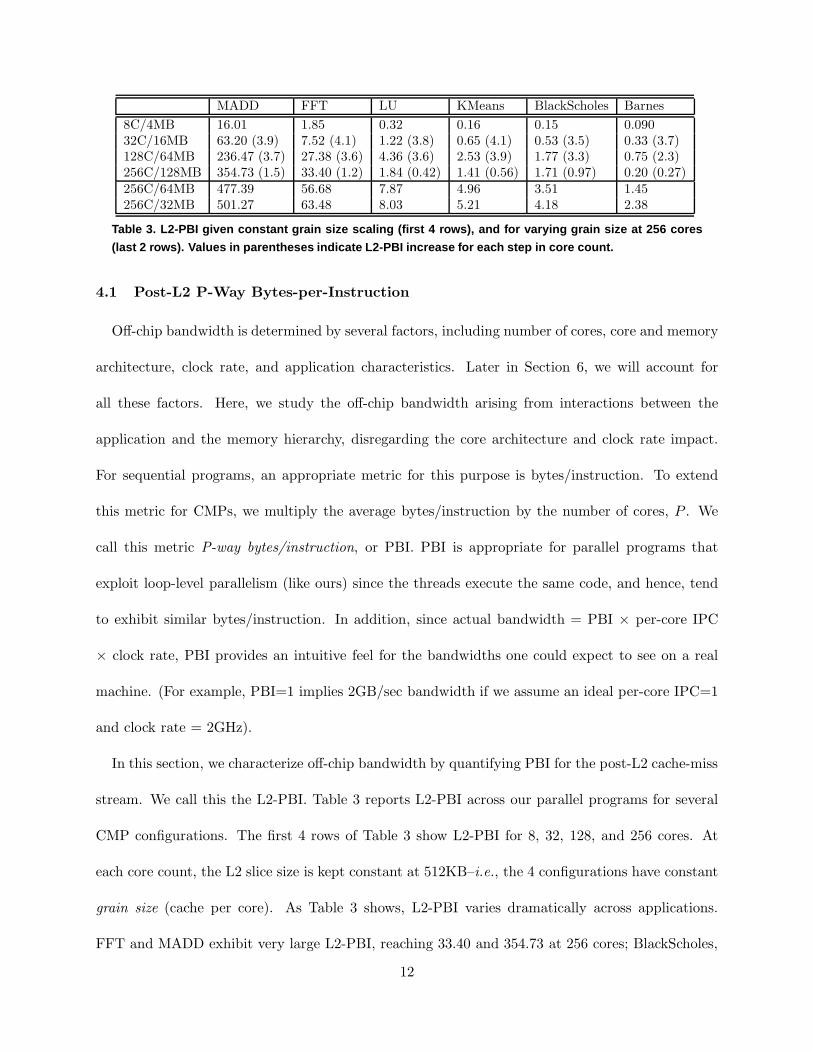
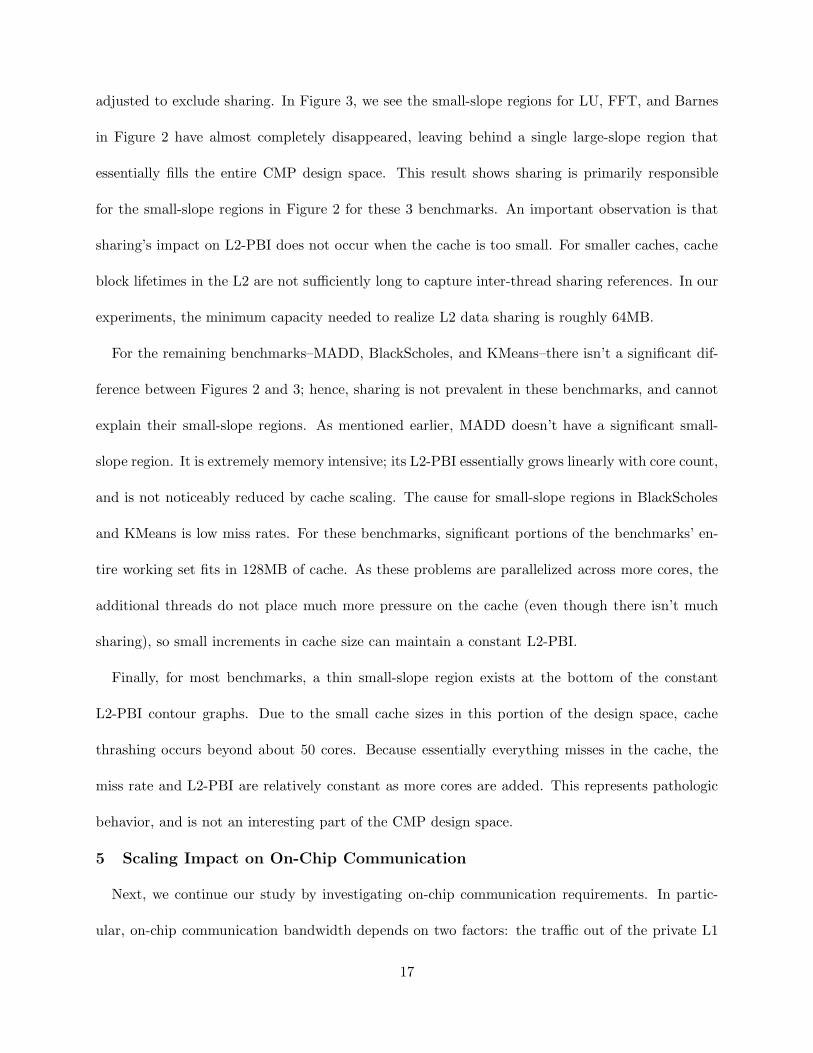
Table 3. L2-PBI given constant grain size scaling (first 4 row s), and for varying grain size at 256 cores
(last 2 rows). Values in parentheses indicate L2-PBI increa se for each step in core count.
4.1 Post-L2 P-Way Bytes-per-Instruction
Off-chip bandwidth is determined by several factors, including number of cores, core and memory
architecture, clock rate, and application characteristics. Later in Section 6, we will account for
all these factors. Here, we study the off-chip bandwidth arising from interactions between the
application and the memory hierarchy, disregarding the core architecture and clock rate impact.
For sequential programs, an appropriate metric for this purpose is bytes/instruction. To extend
this metric for CMPs, we multiply the average bytes/instruction by the number of cores, P . We
call this metric P-way bytes/instruction, or PBI. PBI is appropriate for parallel programs that
exploit loop-level parallelism (like ours) since the threads execute the same code, and hence, tend
to exhibit similar bytes/instruction. In addition, since actual bandwidth = PBI × per-core IPC
× clock rate, PBI provides an intuitive feel for the bandwidths one could expect to see on a real
machine. (For example, PBI=1 implies 2GB/sec bandwidth if we assume an ideal per-core IPC=1
and clock rate = 2GHz).
In this section, we characterize off-chip bandwidth by quantifying PBI for the post-L2 cache-miss
stream. We call this the L2-PBI. Table 3 reports L2-PBI across our parallel programs for several
CMP configurations. The first 4 rows of Table 3 show L2-PBI for 8, 32, 128, and 256 cores. At
each core count, the L2 slice size is kept constant at 512KB–i.e., the 4 configurations have constant
grain size (cache per core). As Table 3 shows, L2-PBI varies dramatically across applications.
FFT and MADD exhibit very large L2-PBI, reaching 33.40 and 354.73 at 256 cores; BlackScholes,
12
KMeans, and LU exhibit much smaller–but still significant–L2-PBI, reaching 1.77, 2.53, and 4.36,
respectively, at 128 cores; and Barnes has very small L2-PBI, reaching only 0.75 at 128 cores. This
high L2-PBI variation demonstrates our application suite has very diverse locality characteristics,
and suggests the amount of off-chip bandwidth necessary for LCMPs in the future will be highly
application dependent.
Table 3 also shows L2-PBI increases with core count in most cases, but not uniformly. When
scaling from 8 to 32 cores–a 4x increase–the applications exhibit a roughly 4x L2-PBI increase as
well (except for BlackScholes). However, when scaling from 32 to 128 cores–the next 4x increase–the
applications exhibit a noticeably smaller 2.3–3.7x L2-PBI increase (except for KMeans). And for
the last 2x scaling from 128 to 256 cores, FFT and MADD’s L2-PBI increase by only 1.2x and 1.5x,
respectively, while the L2-PBI for LU, KMeans, BlackScholes, and Barnes actually decrease. This
non-linear L2-PBI growth has significant implications for CMP scalability, and will be explained
later in Section 4.2.
The last 2 rows in Table 3 report L2-PBI for 256-core machines as the L2 slice size is varied from
512KB down to 256KB and 128KB (thus also reducing total L2 cache). Not surprisingly, L2-PBI
increases significantly as cache is reduced, especially when going from 512KB to 128KB L2 slices.
This highlights the importance of the LLC in mitigating off-chip bandwidth.
4.2 Constant L2-PBI Contours
Section 4.1 shows L2-PBI generally increases with core scaling and decreases with cache capacity
scaling; this was demonstrated for a few CMP configurations. In this section, we study a much
larger CMP design space to extract more insight on core-vs-capacity scaling. For each application,
we simulate the complete cross product of 1–256 cores and 4–128MB of L2 cache, stepping by
powers of 2 along each scaling dimension, and measure the L2-PBI each time. By interpolating
between the simulated values, we obtain an “L2-PBI surface” across our entire CMP design space.
13
50
100
150
200
250
300
350
400
450
500
Number of Cores
L2 S
ize
(MB
ytes
)
50 100 150 200 250
20406080
100120
MADD
0.5
1 1.5 2
2.5
3 3.5
44.
55
5.5
6
Number of Cores
L2 S
ize
(MB
ytes
)
50 100 150 200 250
20406080
100120
LU
0.25
0.5
0.75 1 1.25
1.51.752
Number of Cores
L2 S
ize
(MB
ytes
)
50 100 150 200 250
20406080
100120
BlackScholes
4 8 1216 20 24 28 32 36
4044
48525660
Number of Cores
L2 S
ize
(MB
ytes
)
50 100 150 200 250
20406080
100120
FFT
0.25 0.5
0.75 1 1.25
1.51.752
Number of CoresL2
Siz
e (M
Byt
es)
50 100 150 200 250
20406080
100120
KMeans
0.15 0.3
0.45
0.6
0.75
0.9
Number of Cores
L2 S
ize
(MB
ytes
)
50 100 150 200 250
20406080
100120
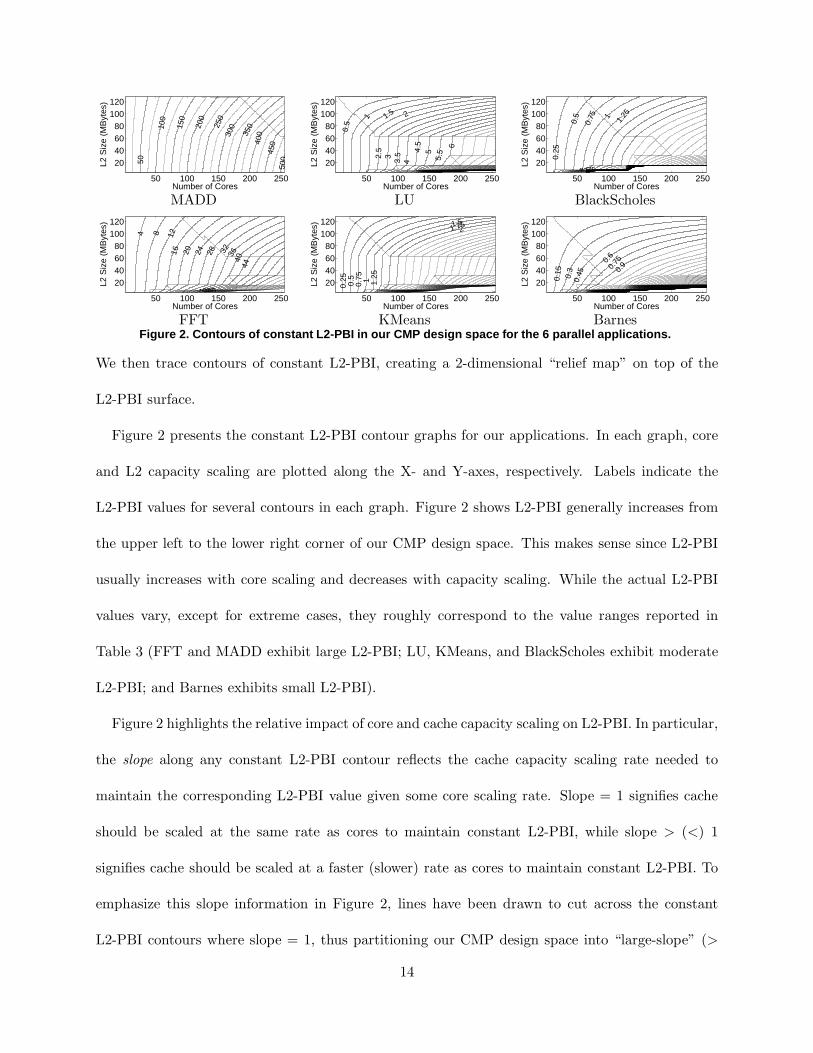
BarnesFigure 2. Contours of constant L2-PBI in our CMP design space for the 6 parallel applications.
We then trace contours of constant L2-PBI, creating a 2-dimensional “relief map” on top of the
L2-PBI surface.
Figure 2 presents the constant L2-PBI contour graphs for our applications. In each graph, core
and L2 capacity scaling are plotted along the X- and Y-axes, respectively. Labels indicate the
L2-PBI values for several contours in each graph. Figure 2 shows L2-PBI generally increases from
the upper left to the lower right corner of our CMP design space. This makes sense since L2-PBI
usually increases with core scaling and decreases with capacity scaling. While the actual L2-PBI
values vary, except for extreme cases, they roughly correspond to the value ranges reported in
Table 3 (FFT and MADD exhibit large L2-PBI; LU, KMeans, and BlackScholes exhibit moderate
L2-PBI; and Barnes exhibits small L2-PBI).
Figure 2 highlights the relative impact of core and cache capacity scaling on L2-PBI. In particular,
the slope along any constant L2-PBI contour reflects the cache capacity scaling rate needed to
maintain the corresponding L2-PBI value given some core scaling rate. Slope = 1 signifies cache
should be scaled at the same rate as cores to maintain constant L2-PBI, while slope > (<) 1
signifies cache should be scaled at a faster (slower) rate as cores to maintain constant L2-PBI. To
emphasize this slope information in Figure 2, lines have been drawn to cut across the constant
L2-PBI contours where slope = 1, thus partitioning our CMP design space into “large-slope” (>
14
1) and “small-slope” (< 1) regions.
In general, one would expect constant L2-PBI contours to exhibit large slope due to the added
cache pressure that core scaling induces. As mentioned earlier, our parallel programs exploit loop-
level parallelism, so threads execute the same code and tend to have similarly sized working sets. If
per-thread working sets are mostly non-overlapping, the aggregate chip-wide working set size will
grow proportionally as core count increases. To maintain constant miss rate (and bytes/instruction),
cache capacity must usually grow faster than increase in working set size (one common assumption
is quadratic growth [13]). To maintain constant P-way bytes/instruction, cache capacity must grow
even faster.
Indeed, a significant portion of each constant L2-PBI contour in Figure 2 resides in a large-slope
region. Below some core count, the large-slope regions span the majority of cache sizes. This
occurs at around 50 cores for all applications except MADD; for MADD, it occurs closer to 200
cores. Beyond this point, the large-slope regions span cache sizes up to about 64MB. (Barnes, and
to some extent BlackScholes, do not exhibit this second large-slope region). CMPs in these large-
slope regions exhibit inefficient scaling since any additional chip area would need to be apportioned
mostly for cache rather than for cores to avoid off-chip bandwidth bottlenecks.
Interestingly, contrary to the expected behavior, a large portion of our CMP design space also
lies within small-slope regions. As Figure 2 shows, the constant L2-PBI contours “flatten” towards
the upper right corner, creating a significant small-slope region in most benchmarks. With the
exception of MADD which doesn’t have much of a small-slope region, our benchmarks exhibit
small-slope regions above roughly 64MB of L2 cache and beyond about 50 cores. The small-slope
regions in Barnes and BlackScholes are even larger, spanning all cache sizes at larger core counts.
CMPs in these small-slope regions exhibit efficient scaling since any additional chip area could be
apportioned mostly for cores rather than for cache without incurring significantly higher off-chip
15
50 100
150
200
250
300
350
400
450
500
Number of Cores
L2 S
ize
(MB
ytes
)
50 100 150 200 250
20406080
100120
MADD
1 2 3 45 6
Number of Cores
L2 S
ize
(MB
ytes
)
50 100 150 200 250
20406080
100120
LU
0.25
0.5
0.75 1
1.25 1.5
1.75
2
Number of Cores
L2 S
ize
(MB
ytes
)
50 100 150 200 250
20406080
100120
BlackScholes
48 12 16 20
24 28 32 36 4044 48
5256
60
Number of Cores
L2 S
ize
(MB
ytes
)
50 100 150 200 250
20406080
100120
FFT
0.25 0.5
0.75 1
1.25 1.51.752
Number of CoresL2
Siz
e (M
Byt
es)
50 100 150 200 250
20406080
100120
KMeans
0.25 0.5
0.75 1
1.25 1.5
1.75
2
Number of Cores
L2 S
ize
(MB
ytes
)
50 100 150 200 250
20406080
100120
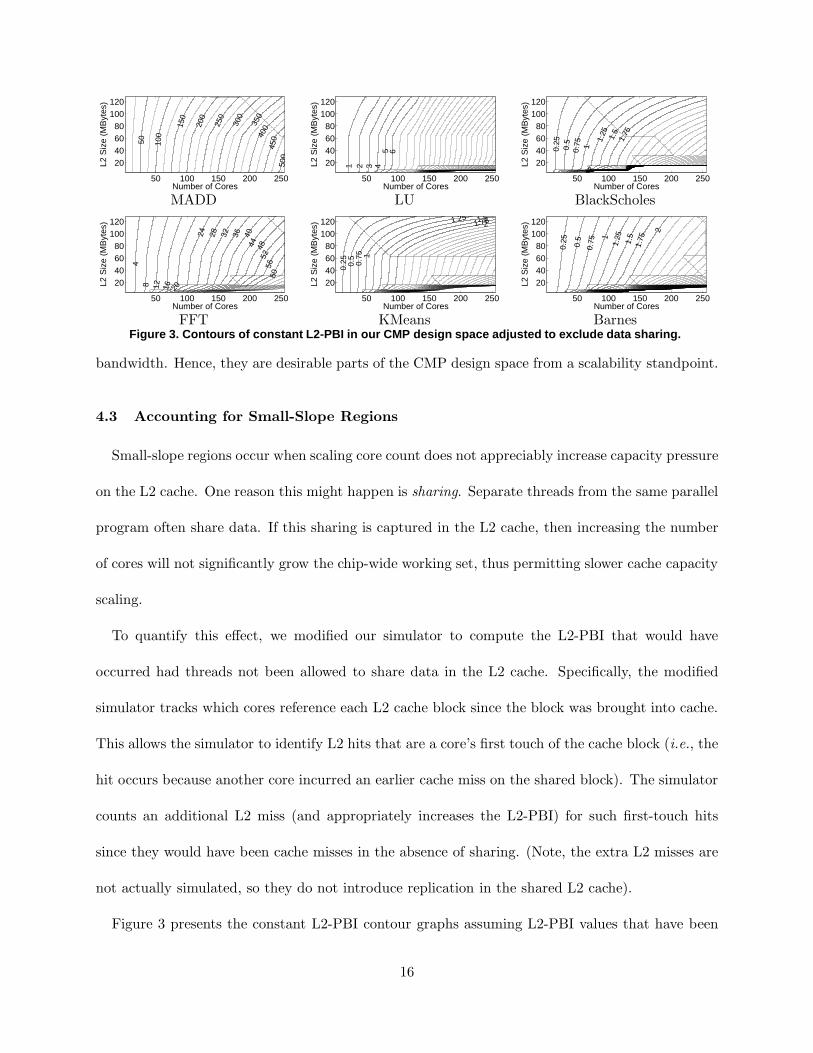
BarnesFigure 3. Contours of constant L2-PBI in our CMP design space adjusted to exclude data sharing.
bandwidth. Hence, they are desirable parts of the CMP design space from a scalability standpoint.
4.3 Accounting for Small-Slope Regions
Small-slope regions occur when scaling core count does not appreciably increase capacity pressure
on the L2 cache. One reason this might happen is sharing. Separate threads from the same parallel
program often share data. If this sharing is captured in the L2 cache, then increasing the number
of cores will not significantly grow the chip-wide working set, thus permitting slower cache capacity
scaling.
To quantify this effect, we modified our simulator to compute the L2-PBI that would have
occurred had threads not been allowed to share data in the L2 cache. Specifically, the modified
simulator tracks which cores reference each L2 cache block since the block was brought into cache.
This allows the simulator to identify L2 hits that are a core’s first touch of the cache block (i.e., the
hit occurs because another core incurred an earlier cache miss on the shared block). The simulator
counts an additional L2 miss (and appropriately increases the L2-PBI) for such first-touch hits
since they would have been cache misses in the absence of sharing. (Note, the extra L2 misses are
not actually simulated, so they do not introduce replication in the shared L2 cache).
Figure 3 presents the constant L2-PBI contour graphs assuming L2-PBI values that have been
16
adjusted to exclude sharing. In Figure 3, we see the small-slope regions for LU, FFT, and Barnes
in Figure 2 have almost completely disappeared, leaving behind a single large-slope region that
essentially fills the entire CMP design space. This result shows sharing is primarily responsible
for the small-slope regions in Figure 2 for these 3 benchmarks. An important observation is that
sharing’s impact on L2-PBI does not occur when the cache is too small. For smaller caches, cache
block lifetimes in the L2 are not sufficiently long to capture inter-thread sharing references. In our
experiments, the minimum capacity needed to realize L2 data sharing is roughly 64MB.
For the remaining benchmarks–MADD, BlackScholes, and KMeans–there isn’t a significant dif-
ference between Figures 2 and 3; hence, sharing is not prevalent in these benchmarks, and cannot
explain their small-slope regions. As mentioned earlier, MADD doesn’t have a significant small-
slope region. It is extremely memory intensive; its L2-PBI essentially grows linearly with core count,
and is not noticeably reduced by cache scaling. The cause for small-slope regions in BlackScholes
and KMeans is low miss rates. For these benchmarks, significant portions of the benchmarks’ en-
tire working set fits in 128MB of cache. As these problems are parallelized across more cores, the
additional threads do not place much more pressure on the cache (even though there isn’t much
sharing), so small increments in cache size can maintain a constant L2-PBI.
Finally, for most benchmarks, a thin small-slope region exists at the bottom of the constant
L2-PBI contour graphs. Due to the small cache sizes in this portion of the design space, cache
thrashing occurs beyond about 50 cores. Because essentially everything misses in the cache, the
miss rate and L2-PBI are relatively constant as more cores are added. This represents pathologic
behavior, and is not an interesting part of the CMP design space.
5 Scaling Impact on On-Chip Communication
Next, we continue our study by investigating on-chip communication requirements. In partic-
ular, on-chip communication bandwidth depends on two factors: the traffic out of the private L1
17
MADD FFT LU KMeans BlackScholes Barnes
8C/4MB 32.09 7.29 1.29 0.33 4.47 4.4332C/16MB 116.85 (3.6) 29.18 (4.1) 5.34 (4.1) 1.33 (4.0) 18.00 (4.0) 18.33 (4.1)128C/64MB 509.36 (4.4) 116.45 (4.0) 23.23 (4.4) 9.17 (6.9) 72.02 (4.0) 76.12 (4.2)256C/128MB 1012.67 (2.0) 232.51 (2.0) 49.95 (2.2) 18.54 (2.0) 144.00 (2.0) 146.77 (1.9)256C/64MB 1013.01 232.58 50.09 18.61 144.14 148.23256C/32MB 960.04 232.29 50.41 18.72 145.32 148.02
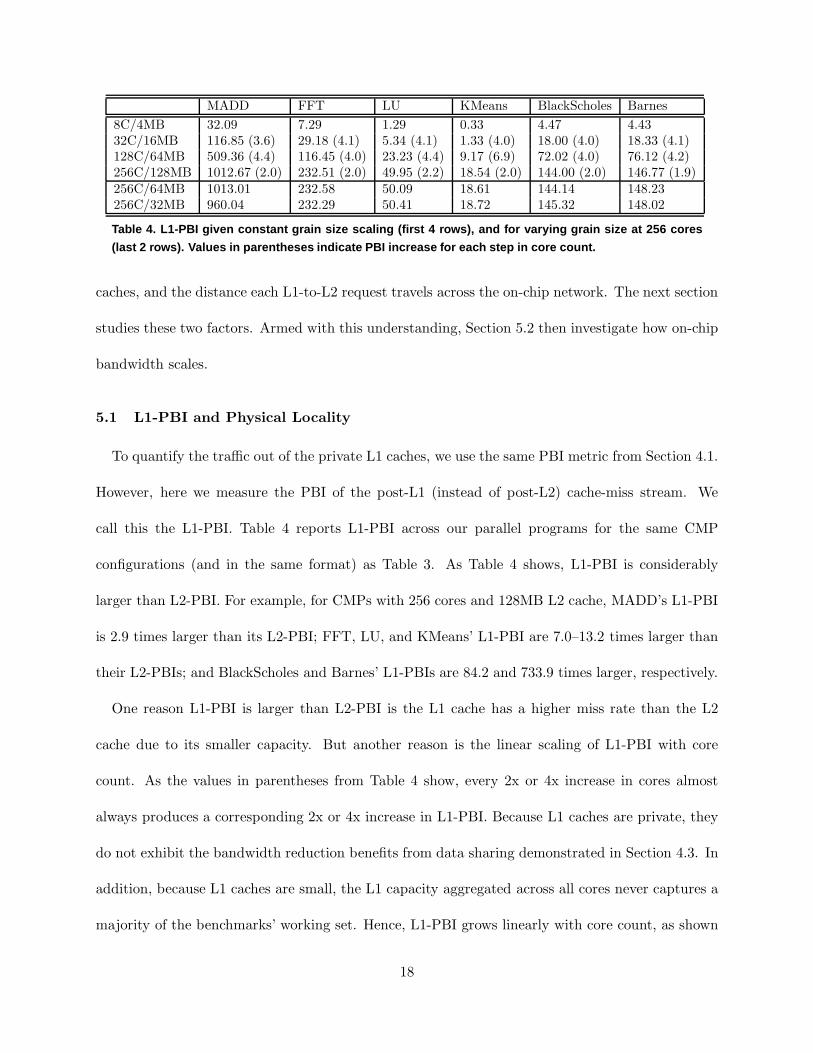
Table 4. L1-PBI given constant grain size scaling (first 4 row s), and for varying grain size at 256 cores
(last 2 rows). Values in parentheses indicate PBI increase f or each step in core count.
caches, and the distance each L1-to-L2 request travels across the on-chip network. The next section
studies these two factors. Armed with this understanding, Section 5.2 then investigate how on-chip
bandwidth scales.
5.1 L1-PBI and Physical Locality
To quantify the traffic out of the private L1 caches, we use the same PBI metric from Section 4.1.
However, here we measure the PBI of the post-L1 (instead of post-L2) cache-miss stream. We
call this the L1-PBI. Table 4 reports L1-PBI across our parallel programs for the same CMP
configurations (and in the same format) as Table 3. As Table 4 shows, L1-PBI is considerably
larger than L2-PBI. For example, for CMPs with 256 cores and 128MB L2 cache, MADD’s L1-PBI
is 2.9 times larger than its L2-PBI; FFT, LU, and KMeans’ L1-PBI are 7.0–13.2 times larger than
their L2-PBIs; and BlackScholes and Barnes’ L1-PBIs are 84.2 and 733.9 times larger, respectively.
One reason L1-PBI is larger than L2-PBI is the L1 cache has a higher miss rate than the L2
cache due to its smaller capacity. But another reason is the linear scaling of L1-PBI with core
count. As the values in parentheses from Table 4 show, every 2x or 4x increase in cores almost
always produces a corresponding 2x or 4x increase in L1-PBI. Because L1 caches are private, they
do not exhibit the bandwidth reduction benefits from data sharing demonstrated in Section 4.3. In
addition, because L1 caches are small, the L1 capacity aggregated across all cores never captures a
majority of the benchmarks’ working set. Hence, L1-PBI grows linearly with core count, as shown
18
MADD FFT LU KMeans BlackScholes Barnes
8C/4MB 1.75 1.77 1.75 1.76 1.74 1.7232C/16MB 3.88 3.98 3.99 3.85 4.00 3.87128C/64MB 7.99 8.05 7.94 8.07 8.09 7.94256C/128MB 10.62 10.58 10.59 11.34 10.85 10.81256C/64MB 10.60 10.33 10.58 10.60 10.56 10.72256C/32MB 10.63 10.54 10.61 11.02 10.33 10.64
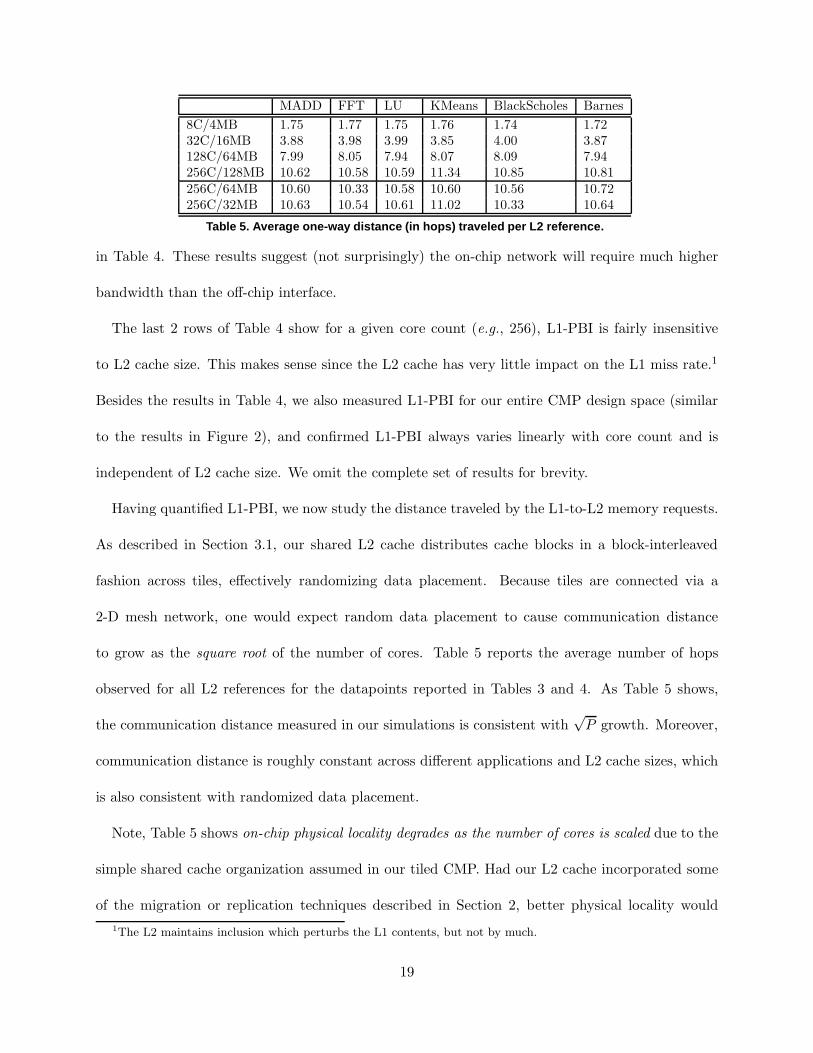
Table 5. Average one-way distance (in hops) traveled per L2 r eference.
in Table 4. These results suggest (not surprisingly) the on-chip network will require much higher
bandwidth than the off-chip interface.
The last 2 rows of Table 4 show for a given core count (e.g., 256), L1-PBI is fairly insensitive
to L2 cache size. This makes sense since the L2 cache has very little impact on the L1 miss rate.1
Besides the results in Table 4, we also measured L1-PBI for our entire CMP design space (similar
to the results in Figure 2), and confirmed L1-PBI always varies linearly with core count and is
independent of L2 cache size. We omit the complete set of results for brevity.
Having quantified L1-PBI, we now study the distance traveled by the L1-to-L2 memory requests.
As described in Section 3.1, our shared L2 cache distributes cache blocks in a block-interleaved
fashion across tiles, effectively randomizing data placement. Because tiles are connected via a
2-D mesh network, one would expect random data placement to cause communication distance
to grow as the square root of the number of cores. Table 5 reports the average number of hops
observed for all L2 references for the datapoints reported in Tables 3 and 4. As Table 5 shows,
the communication distance measured in our simulations is consistent with√
P growth. Moreover,
communication distance is roughly constant across different applications and L2 cache sizes, which
is also consistent with randomized data placement.
Note, Table 5 shows on-chip physical locality degrades as the number of cores is scaled due to the
simple shared cache organization assumed in our tiled CMP. Had our L2 cache incorporated some
of the migration or replication techniques described in Section 2, better physical locality would
1The L2 maintains inclusion which perturbs the L1 contents, but not by much.
19
50 100 150 200 2500
100
200
300
400
500
600
Number of Cores
Bis
ectio
n B
andw
idth
(P
BI o
r by
tes/
cycl
e)
MADDFFTLUKMeansBlackScholesBarneswidth:16Bwidth:32B
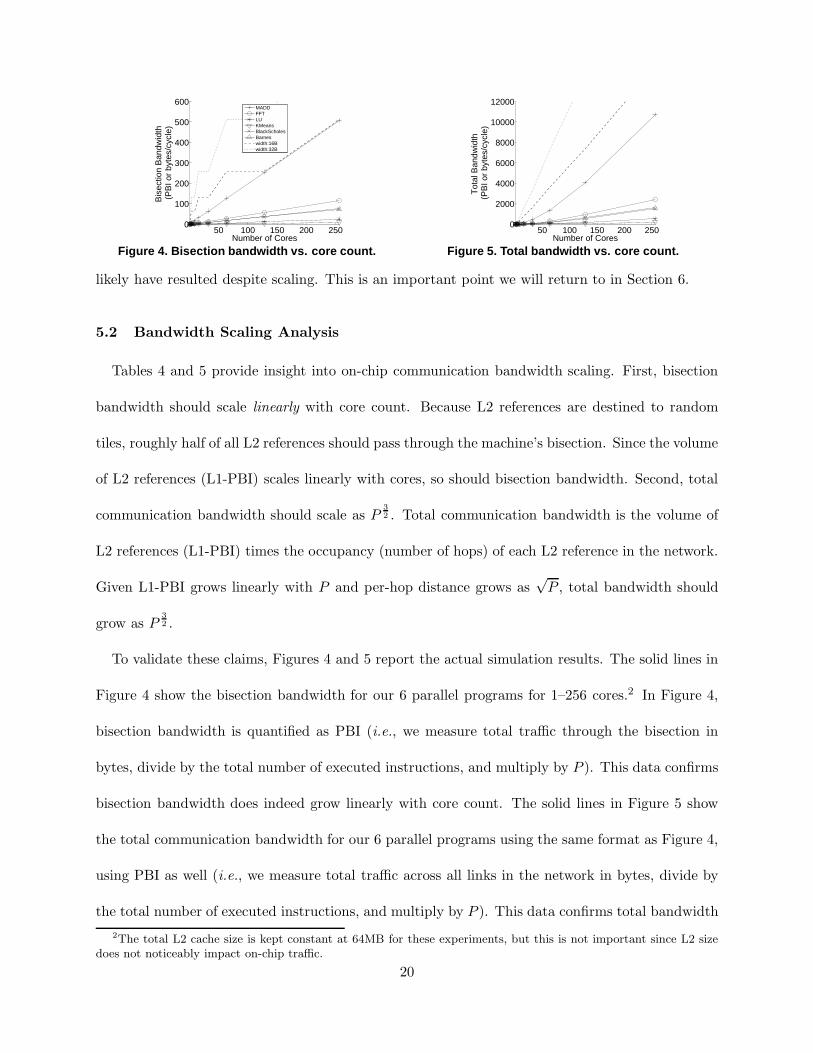
Figure 4. Bisection bandwidth vs. core count.
50 100 150 200 2500
2000
4000
6000
8000
10000
12000
Number of Cores
Tot
al B
andw
idth
(P
BI o
r by
tes/
cycl
e)
Figure 5. Total bandwidth vs. core count.
likely have resulted despite scaling. This is an important point we will return to in Section 6.
5.2 Bandwidth Scaling Analysis
Tables 4 and 5 provide insight into on-chip communication bandwidth scaling. First, bisection
bandwidth should scale linearly with core count. Because L2 references are destined to random
tiles, roughly half of all L2 references should pass through the machine’s bisection. Since the volume
of L2 references (L1-PBI) scales linearly with cores, so should bisection bandwidth. Second, total
communication bandwidth should scale as P3
2 . Total communication bandwidth is the volume of
L2 references (L1-PBI) times the occupancy (number of hops) of each L2 reference in the network.
Given L1-PBI grows linearly with P and per-hop distance grows as√
P , total bandwidth should
grow as P3
2 .
To validate these claims, Figures 4 and 5 report the actual simulation results. The solid lines in
Figure 4 show the bisection bandwidth for our 6 parallel programs for 1–256 cores.2 In Figure 4,
bisection bandwidth is quantified as PBI (i.e., we measure total traffic through the bisection in
bytes, divide by the total number of executed instructions, and multiply by P ). This data confirms
bisection bandwidth does indeed grow linearly with core count. The solid lines in Figure 5 show
the total communication bandwidth for our 6 parallel programs using the same format as Figure 4,
using PBI as well (i.e., we measure total traffic across all links in the network in bytes, divide by
the total number of executed instructions, and multiply by P ). This data confirms total bandwidth
2The total L2 cache size is kept constant at 64MB for these experiments, but this is not important since L2 size
does not noticeably impact on-chip traffic.
20
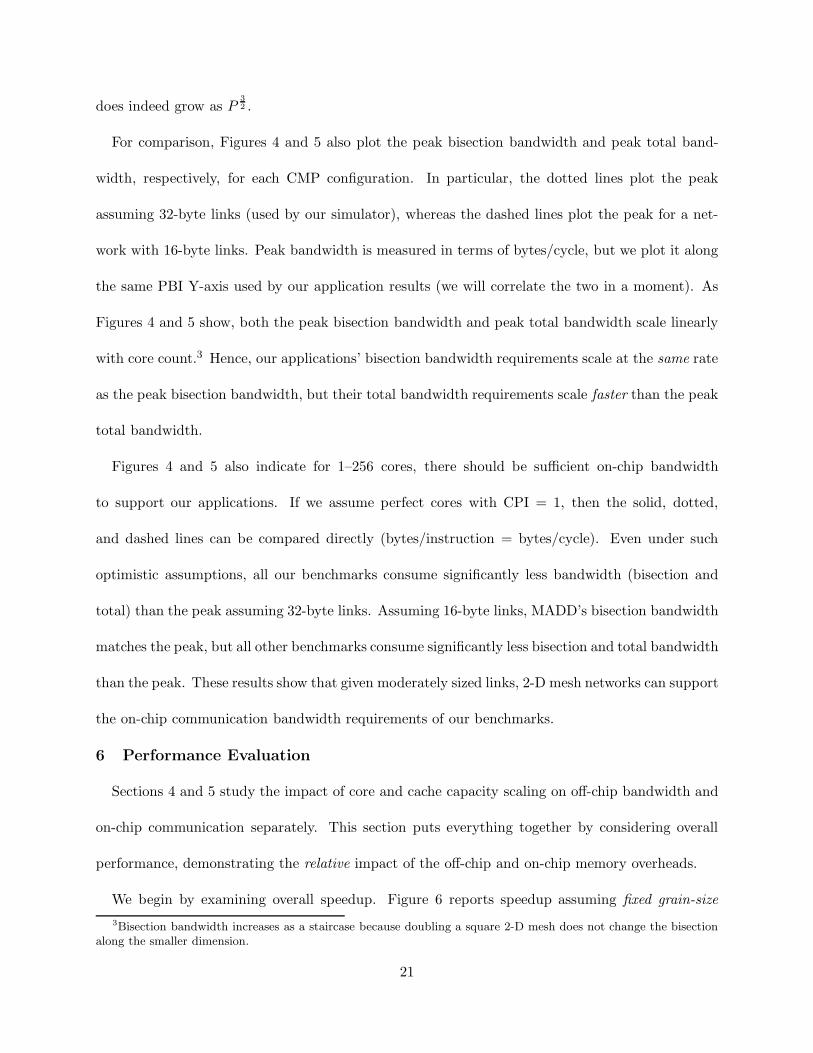
does indeed grow as P3
2 .
For comparison, Figures 4 and 5 also plot the peak bisection bandwidth and peak total band-
width, respectively, for each CMP configuration. In particular, the dotted lines plot the peak
assuming 32-byte links (used by our simulator), whereas the dashed lines plot the peak for a net-
work with 16-byte links. Peak bandwidth is measured in terms of bytes/cycle, but we plot it along
the same PBI Y-axis used by our application results (we will correlate the two in a moment). As
Figures 4 and 5 show, both the peak bisection bandwidth and peak total bandwidth scale linearly
with core count.3 Hence, our applications’ bisection bandwidth requirements scale at the same rate
as the peak bisection bandwidth, but their total bandwidth requirements scale faster than the peak
total bandwidth.
Figures 4 and 5 also indicate for 1–256 cores, there should be sufficient on-chip bandwidth
to support our applications. If we assume perfect cores with CPI = 1, then the solid, dotted,
and dashed lines can be compared directly (bytes/instruction = bytes/cycle). Even under such
optimistic assumptions, all our benchmarks consume significantly less bandwidth (bisection and
total) than the peak assuming 32-byte links. Assuming 16-byte links, MADD’s bisection bandwidth
matches the peak, but all other benchmarks consume significantly less bisection and total bandwidth
than the peak. These results show that given moderately sized links, 2-D mesh networks can support
the on-chip communication bandwidth requirements of our benchmarks.
6 Performance Evaluation
Sections 4 and 5 study the impact of core and cache capacity scaling on off-chip bandwidth and
on-chip communication separately. This section puts everything together by considering overall
performance, demonstrating the relative impact of the off-chip and on-chip memory overheads.
We begin by examining overall speedup. Figure 6 reports speedup assuming fixed grain-size
3Bisection bandwidth increases as a staircase because doubling a square 2-D mesh does not change the bisection
along the smaller dimension.
21
50 100 150 200 2500
50
100
150
200
250
Number of Cores
Spe
ed U
p
MADDFFTLUKMeansBlackScholesBarnes
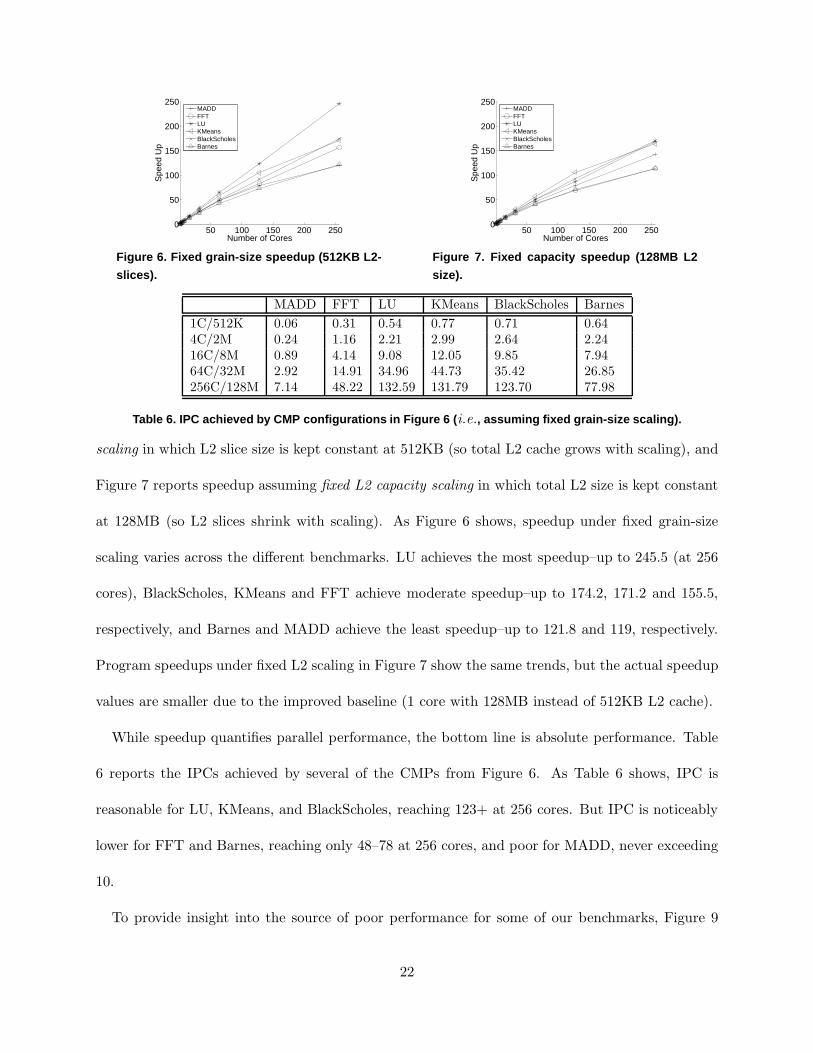
Figure 6. Fixed grain-size speedup (512KB L2-
slices).
50 100 150 200 2500
50
100
150
200
250
Number of Cores
Spe
ed U
p
MADDFFTLUKMeansBlackScholesBarnes
Figure 7. Fixed capacity speedup (128MB L2
size).
MADD FFT LU KMeans BlackScholes Barnes
1C/512K 0.06 0.31 0.54 0.77 0.71 0.644C/2M 0.24 1.16 2.21 2.99 2.64 2.2416C/8M 0.89 4.14 9.08 12.05 9.85 7.9464C/32M 2.92 14.91 34.96 44.73 35.42 26.85256C/128M 7.14 48.22 132.59 131.79 123.70 77.98
Table 6. IPC achieved by CMP configurations in Figure 6 ( i.e., assuming fixed grain-size scaling).
scaling in which L2 slice size is kept constant at 512KB (so total L2 cache grows with scaling), and
Figure 7 reports speedup assuming fixed L2 capacity scaling in which total L2 size is kept constant
at 128MB (so L2 slices shrink with scaling). As Figure 6 shows, speedup under fixed grain-size
scaling varies across the different benchmarks. LU achieves the most speedup–up to 245.5 (at 256
cores), BlackScholes, KMeans and FFT achieve moderate speedup–up to 174.2, 171.2 and 155.5,
respectively, and Barnes and MADD achieve the least speedup–up to 121.8 and 119, respectively.
Program speedups under fixed L2 scaling in Figure 7 show the same trends, but the actual speedup
values are smaller due to the improved baseline (1 core with 128MB instead of 512KB L2 cache).
While speedup quantifies parallel performance, the bottom line is absolute performance. Table
6 reports the IPCs achieved by several of the CMPs from Figure 6. As Table 6 shows, IPC is
reasonable for LU, KMeans, and BlackScholes, reaching 123+ at 256 cores. But IPC is noticeably
lower for FFT and Barnes, reaching only 48–78 at 256 cores, and poor for MADD, never exceeding
10.
To provide insight into the source of poor performance for some of our benchmarks, Figure 9
22
50 100 150 200 2500
0.05
0.1
0.15
0.2
Number of Cores
Bre
ak−
even
Mis
s R
ate
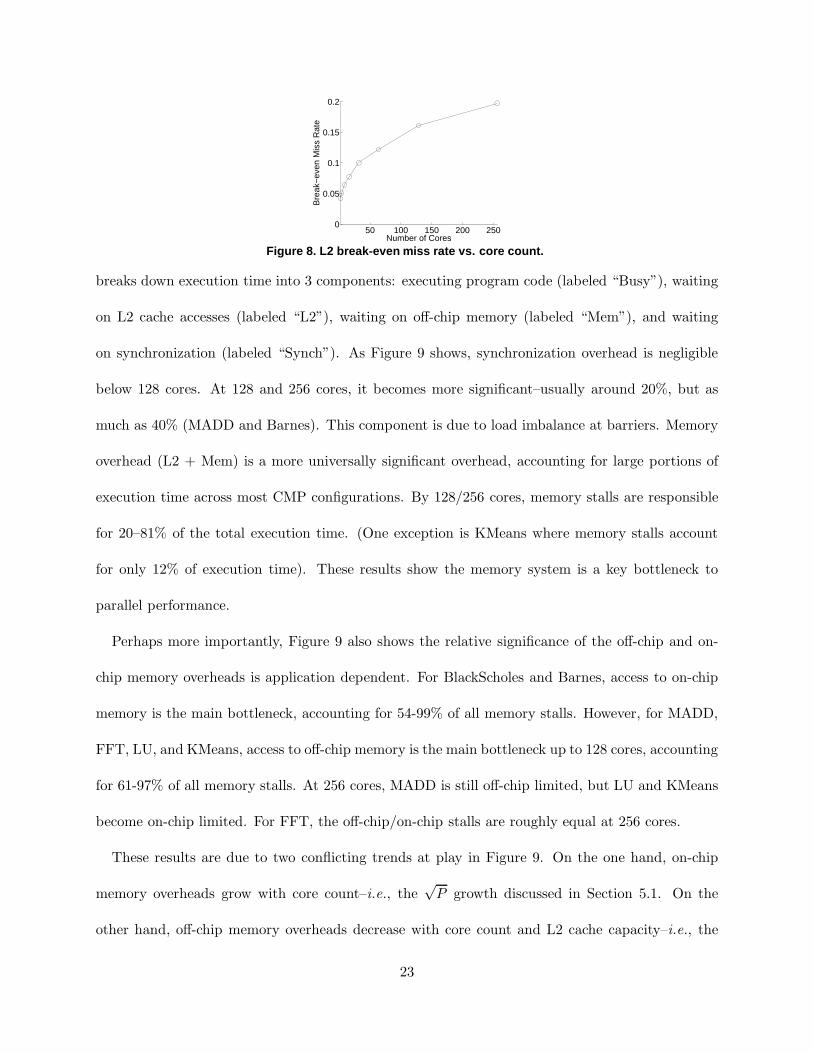
Figure 8. L2 break-even miss rate vs. core count.
breaks down execution time into 3 components: executing program code (labeled “Busy”), waiting
on L2 cache accesses (labeled “L2”), waiting on off-chip memory (labeled “Mem”), and waiting
on synchronization (labeled “Synch”). As Figure 9 shows, synchronization overhead is negligible
below 128 cores. At 128 and 256 cores, it becomes more significant–usually around 20%, but as
much as 40% (MADD and Barnes). This component is due to load imbalance at barriers. Memory
overhead (L2 + Mem) is a more universally significant overhead, accounting for large portions of
execution time across most CMP configurations. By 128/256 cores, memory stalls are responsible
for 20–81% of the total execution time. (One exception is KMeans where memory stalls account
for only 12% of execution time). These results show the memory system is a key bottleneck to
parallel performance.
Perhaps more importantly, Figure 9 also shows the relative significance of the off-chip and on-
chip memory overheads is application dependent. For BlackScholes and Barnes, access to on-chip
memory is the main bottleneck, accounting for 54-99% of all memory stalls. However, for MADD,
FFT, LU, and KMeans, access to off-chip memory is the main bottleneck up to 128 cores, accounting
for 61-97% of all memory stalls. At 256 cores, MADD is still off-chip limited, but LU and KMeans
become on-chip limited. For FFT, the off-chip/on-chip stalls are roughly equal at 256 cores.
These results are due to two conflicting trends at play in Figure 9. On the one hand, on-chip
memory overheads grow with core count–i.e., the√
P growth discussed in Section 5.1. On the
other hand, off-chip memory overheads decrease with core count and L2 cache capacity–i.e., the
23
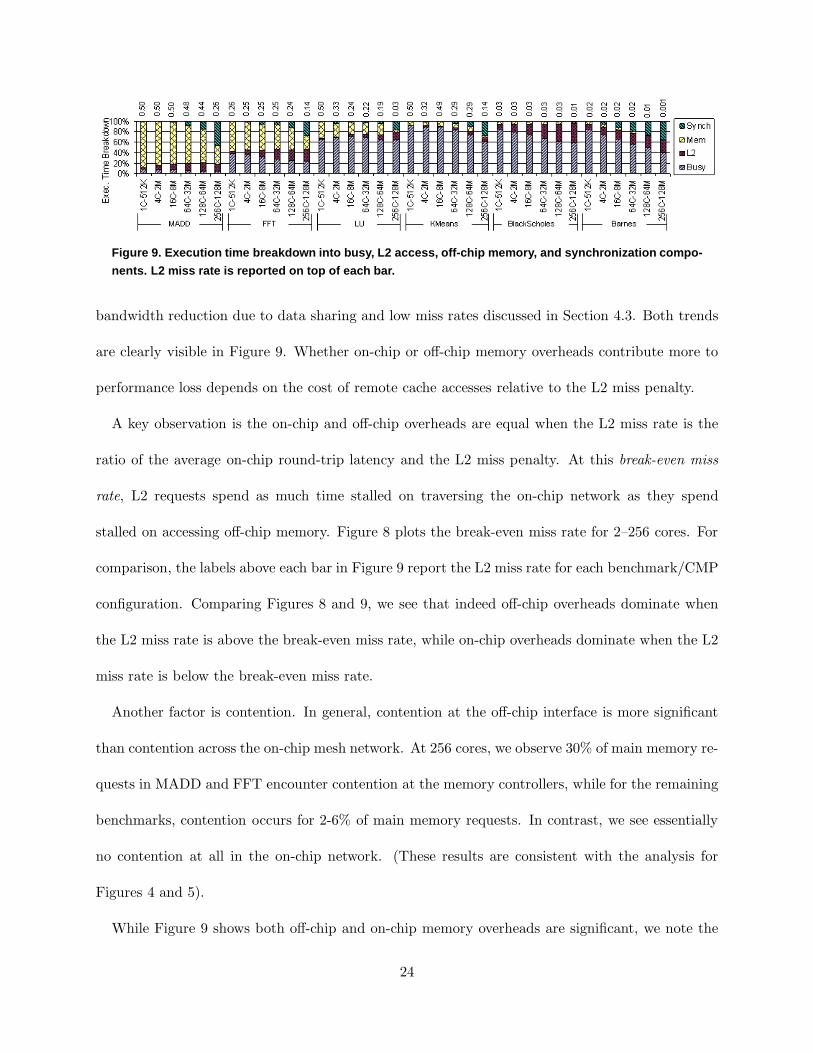
Figure 9. Execution time breakdown into busy, L2 access, off -chip memory, and synchronization compo-
nents. L2 miss rate is reported on top of each bar.
bandwidth reduction due to data sharing and low miss rates discussed in Section 4.3. Both trends
are clearly visible in Figure 9. Whether on-chip or off-chip memory overheads contribute more to
performance loss depends on the cost of remote cache accesses relative to the L2 miss penalty.
A key observation is the on-chip and off-chip overheads are equal when the L2 miss rate is the
ratio of the average on-chip round-trip latency and the L2 miss penalty. At this break-even miss
rate, L2 requests spend as much time stalled on traversing the on-chip network as they spend
stalled on accessing off-chip memory. Figure 8 plots the break-even miss rate for 2–256 cores. For
comparison, the labels above each bar in Figure 9 report the L2 miss rate for each benchmark/CMP
configuration. Comparing Figures 8 and 9, we see that indeed off-chip overheads dominate when
the L2 miss rate is above the break-even miss rate, while on-chip overheads dominate when the L2
miss rate is below the break-even miss rate.
Another factor is contention. In general, contention at the off-chip interface is more significant
than contention across the on-chip mesh network. At 256 cores, we observe 30% of main memory re-
quests in MADD and FFT encounter contention at the memory controllers, while for the remaining
benchmarks, contention occurs for 2-6% of main memory requests. In contrast, we see essentially
no contention at all in the on-chip network. (These results are consistent with the analysis for
Figures 4 and 5).
While Figure 9 shows both off-chip and on-chip memory overheads are significant, we note the
24
break-even miss rates in Figure 8 are not large, reaching only 20% for 256 cores. This implies
memory-intensive programs will most certainly be off-chip limited. Even for our benchmarks, the
majority of CMP configurations are off-chip limited, not on-chip limited–and this would be the
case even more so had we chosen larger input problem sizes. Moreover, with more aggressive cores
(e.g., out-of-order execution and/or prefetching) creating greater memory bandwidth pressure, the
imbalance between off-chip and on-chip contention would likely be further amplified, again making
off-chip overheads relatively more significant. We find this is a surprising result, especially given
the simple shared L2 cache we assume and its poor scaling of on-chip physical locality with core
count.
7 Conclusion
This paper conducts an in-depth study of LCMP scalability for parallel programs, providing
insight into the impact of core count and cache capacity scaling on off-chip bandwidth and on-chip
communication. Our results show off-chip bandwidth often increases linearly with core count; how-
ever, for parallel programs with data sharing, the rate of bandwidth increase reduces dramatically
once enough L2 cache is provided to capture the inter-thread sharing references. In addition, our
results also show for the range 1–256 cores, there should be ample on-chip bandwidth to support the
communication requirements for all our benchmarks given moderately-sized network links. Finally,
we find that when an application’s L2 miss rate is larger (smaller) than a break-even miss rate, it
becomes off-chip (on-chip) limited. For memory-intensive programs and LCMPs with aggressive
cores, we expect off-chip memory overheads to dominate on-chip memory overheads, even when the
LLC provides no explicit on-chip locality management.
References
[1] A. Agarwal, L. Bao, J. Brown, B. Edwards, M. Mattina, C.-C. Miao, C. Ramey, and D. Wentzlaff, “TileProcessor: Embedded Multicore for Networking and Multimedia,” in Proceedings of the 19th Symposiumon High Performance Chips, (Stanford, CA), August 2007.
25
[2] Y. Hoskote, S. Vangal, N. Borkar, and S. Borkar, “Teraflop Prototype Processor with 80 Cores,” inProceedings of the 19th Symposium on High Performance Chips, (Stanford, CA), August 2007.
[3] “Silicon Industry Association Technology Roadmap.” 2009.
[4] L. Hsu, R. Iyer, S. Makineni, S. Reinhardt, and D. Newell, “Exploring the Cache Design Space for LargeScale CMPs,” SIGARCH Computer Architecture News, vol. 33, 2005.
[5] L. Zhao, R. Iyer, S. Makineni, J. Moses, R. Illikkal, and D. Newell, “Performance, Area and Band-width Implications on Large-Scale CMP Cache Design,” in Proceedings of the 2nd Workshop on ChipMultiprocessor Memory Systems and Interconnect, 2007.
[6] R. Narayanan, B. Ozisikyilmaz, J. Zambreno, G. Memik, and A. Choudhary, “MineBench: A Bench-mark Suite for Data Mining Workloads,” in Proceedings of the International Symposium on WorkloadCharacterization, October 2006.
[7] K. Albayraktaroglu, A. Jaleel, X. Wu, M. Franklin, B. Jacob, C.-W. Tseng, and D. Yeung, “BioBench:A Benchmark Suite of Bioinformatics Applications,” in Proceedings of the 2005 IEEE InternationalSymposium on Performance Analysis of Systems and Software, (Austin, TX), March 2008.
[8] P. Dubey, “Recognition, Mining and Synthesis Moves Computers to the Era of Tera,” Technology @Intel Magazine, pp. 1–10, February 2005.
[9] C. Kim, D. Burger, and S. W. Keckler, “An Adaptive, Non-Uniform Cache Structure for Wire-DelayDominated On-Chip Caches,” in Proceedings of the 10th International Conference on ArchitecturalSupport for Programming Languages and Operating Systems, (San Jose, CA), ACM, October 2002.
[10] B. M. Beckman and D. A. Wood, “Managing Wire Delay in Large Chip-Multiprocessor Caches,” inProceedings of the 37th International Symposium on Microarchitecture, (Portland, OR), pp. 319–330,December 2004.
[11] M. Zhang and K. Asanovic, “Victim Replication: Maximizing Capacity while Hiding Wire Delay in TiledChip Multiprocessors,” in Proceedings of the 32nd International Symposium on Computer Architecture,(Madison, WI), June 2005.
[12] L. Jin and S. Cho, “SOS: A Software-Oriented Distributed Shared Cache Management Approach forChip Multiprocessors,” in Proceedings of the 18th International Conference on Parallel Architecturesand Compilation Techniques, (Raleigh, NC), September 2009.
[13] B. Rogers, A. Krishna, G. Bell, K. Vu, X. Jiang, and Y. Solihin, “Scaling the Bandwidth Wall: Chal-lenges in and Avenues for CMP Scaling,” in Proceedings of the 36th International Symposium on Com-puter Architecture, June 2009.
[14] D. Burger, J. R. Goodman, and A. Kagi, “Memory Bandwidth Limitations of Future Microprocessors,”in Proceedings of the 23rd Annual International Symposium on Computer Architecture, (Philadelphia,PA), pp. 78–89, ACM, May 1996.
[15] J. Huh, S. W. Keckler, and D. Burger, “Exploring the Design Space of Future CMPs,” in Proceedingsof the 2001 International Conference on Parallel Architectures and Compilation Techniques, ACM,September 2001.
[16] J. Chang and G. S. Sohi, “Cooperative Caching for Chip Multiprocessors,” in Proceedings of the 33rdInternational Symposium on Computer Architecture, June 2006.
[17] Z. Guz, I. Keidar, A. Kolodny, and U. C. Weiser, “Utilizing Shared Data in Chip Multiprocessors withthe Nahalal Architecture,” in Proceedings of the International Symposium on Parallelism in Algorithmsand Architectures, (Munich, Germany), June 2008.
[18] N. Hardavellas, M. Ferdman, B. Falsafi, and A. Ailamaki, “Reactive NUCA: Near-Optimal Block Place-ment and Replication in Distributed Caches,” in Proceedings of the International Symposium on Com-puter Architecture, (Austin, TX), pp. 184–195, June 2009.
26
[19] J. Huh, C. Kim, H. Shafi, L. Zhang, D. Burger, and S. W. Keckler, “A NUCA Substrate for FlexibleCMP Cache Sharing,” in Proceedings of the International Conference on Supercomputing, (Boston, MA),June 2005.
[20] L. Jin, H. Lee, and S. Cho, “A Flexible Data to L2 Cache Mapping Approach for Future MulticoreProcessors,” in Proceedings of the 2006 ACM SIGPLAN Workshop on Memory System Performanceand Correctness, October 2006.
[21] T. Sherwood, B. Calder, and J. Emer, “Reducing Cache Misses Using Hardware and Software PagePlacement,” in Proceedings of the International Conference on Supercomputing, June 1999.
[22] D. Tam, R. Azimi, L. Soares, and M. Stumm, “Managing Shared L2 Caches on Multicore Systems inSoftware,” in Proceedings of the Workshop on the Interaction between Operating Systems and ComputerArchitecture, June 2007.
[23] J. D. Davis, J. Laudon, and K. Olukotun, “Maximizing CMP Throughput with Mediocre Cores,” inProceedings of the International Conference on Parallel Architectures and Compilation Techniqiues,2006.
[24] Y. Li, B. Lee, D. Brooks, Z. Hu, and K. Skadron, “CMP Design Space Exploration Subject to Physi-cal Constraints,” in Proceedings of the 12th International Symposium on High Performance ComputerArchitecture, February 2006.
[25] J. Li and J. F. Martinez, “Power-Performance Implications of Thread-level Parallelism on Chip Mul-tiprocessors,” in Proceedings of the International Symposium on Performance Analysis of Systems andSoftware, (Austin, TX), March 2005.
[26] Z. Chishti, M. D. Powell, and T. N. Vijaykumar, “Optimizing Replication, Communication, and Capac-ity Allocation in CMPs,” in Proceedings of the 32nd International Symposium on Computer Architecture,(Madison, WI), June 2005.
[27] E. Herrero, J. Gonzalez, and R. Canal, “Distributed Cooperative Caching,” in Proceedings of the Inter-national Conference on Parallel Architectures and Compilation Techniques, (Toronto, Canada), October2008.
[28] S. Cho and L. Jin, “Managing Distributed, Shared L2 Caches through OS-Level Page Allocation,” inProceedings of the 39th International Symposium on Microarchitecture, December 2006.
[29] N. L. Binkert, R. G. Dreslinski, L. R. Hsu, K. T. Lim, A. G. Saidi, and S. K. Reinhardt, “The M5Simulator: Modeling Networked Systems,” IEEE Micro, vol. 26, pp. 52–60, July/August 2006.
[30] S. C. Woo, M. Ohara, E. Torrie, J. P. Singh, and A. Gupta, “The SPLASH-2 Programs: Characterizationand Methodological Considerations,” in Proceedings of the 22nd International Symposium on ComputerArchitecture, (Santa Margherita Ligure, Italy), June 1995.
[31] C. Bienia, S. Kumar, J. P. Singh, and K. Li, “The PARSEC Benchmark Suite: Characterization and Ar-chitectural Implications,” in Proceedings of the 17th International Conference on Parallel Architecturesand Compilation Techniques, October 2008.
27