Embed Size (px)
Citation preview
Port Risk Assessment Sault Ste. Marie, MI
Sault Ste. Marie, MI Workshop Report
Introduction A Port Risk Assessment Workshop was conducted for Sault Ste. Marie 23 – 24 May, 2000. This workshop report provides the following information:
Brief description of the process used for the assessment; • • • •
List of participants; Numerical results from the Analytic Hierarchy Process (AHP); and Summary of risks and mitigations discussion.
Strategies for reducing unmitigated risks will be the subject of a separate report. Assessment Process The risk assessment process is a structured approach to obtaining expert judgments on the level of waterway risk. The process also addresses the relative merit of specific types of Vessel Traffic Management (VTM) improvements for reducing risk in the port. Based on the Analytic Hierarchy Process (AHP)1, the port risk assessment process uses a select group of experts/stakeholders in each port to evaluate waterway risk factors and the effectiveness of various VTM improvements. The process requires the participation of local Coast Guard officials before and throughout the workshops. Thus the process is a joint effort involving waterway user experts, stakeholders, and the agencies/entities responsible for implementing selected risk mitigation measures. This methodology employs a generic model of port risk that was conceptually developed by a National Dialog Group on Port Risk and then translated into computer algorithms by the Volpe National Transportation Systems Center. In that model, risk is defined as the sum of the probability of a casualty and its consequences. Consequently, the model includes variables associated with both the causes and the effects of vessel casualties. Because the risk factors in the model do NOT contribute equally to overall port risk, the first session of each workshop is devoted to obtaining expert opinion about how to weight the relative contribution of each variable to overall port risk. The experts then are asked to establish scales to measure each variable. Once the parameters have been established for each risk-inducing factor, each port's risk is estimated by putting into the computer risk model specific values for that port for each variable. The computer model allows comparison of relative risk and the potential efficacy of various VTM improvements between different ports.
1 Developed by Dr. Thomas L. Saaty, et al, to structure complex decision making, to provide scaled measurements, and to synthesize many factors having different dimensions.
1
Port Risk Assessment Sault Ste. Marie, MI
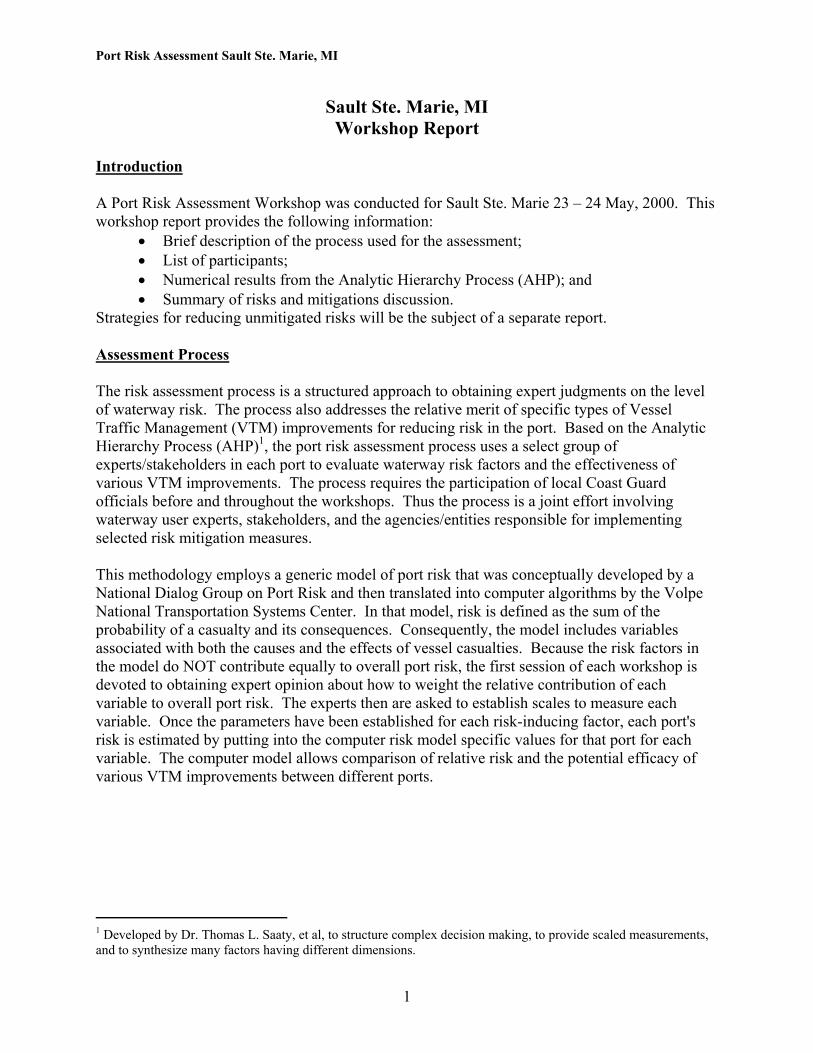
Participants The following is a list of stakeholders/experts that participated in the process:
Participant Organization Phone Email
Ross Armstrong Upper Lakes Group, Inc. (905) 682-2236 [email protected]
Richard Back Lake Superior State University (906) 635-2153 [email protected]
Richard Brawley Soo Locks Boat Tours (906) 632-2512 N/A
Tim Dayton Interlake Steamship Company (216) 272-6937 N/A
Duane Dembny American Steamship Company (800) 828-7230 [email protected]
Bob DenBoer USCG Auxiliary/Recreational Boater (906) 297-2610 [email protected]
Rosaire Desgagnes Transport Desgagnes, Inc. (418) 692-1000 [email protected]
CWO4 Randy Elliott USCGC BUCKTHORN (906) 635-3288 [email protected]
LTJG Kevin Hall USCG Group Sault Ste. Marie (906) 635-3310 [email protected]
Ed Harris Western Great Lakes Pilots Assoc. (906) 297-3906 [email protected]
Steve Kelley USS Great Lakes Fleet (800) 535-2321 [email protected]
LCDR Jack Kenyon USCG Marine Safety Office (PRAO) (906) 635-3220 [email protected]
Charles Lampman U.S. Army Corps of Engineers (906) 635-3445 [email protected]
Charles Malue Cleveland Tankers (216) 771-1999 N/A
LCDR Joe McGuiness USCG 9th District (216) 902-6065 [email protected]
Neil Olsen Algoma Central Marine (905) 708-3800 [email protected]
Nelson Raphael Desgagnes Tankers (418) 580-2343 [email protected]
Michael Ripley Chippewa-Ottawa Treaty Fisheries Management Authority (906) 632-0072 [email protected]
LCDR Mike Ryan USCGC KATMAI BAY (906) 635-3285 [email protected]
Robert Schallip, Jr. Neebish Island Ferry Service (906) 635-0941 [email protected]
Kevin Sprague U.S. Army Corps of Engineers (906) 635-3458 [email protected]
John Wellington Wellington Marine (906) 632-8801 N/A
Donald Willecke Western Great Lakes Pilots Assoc. (715) 392-5200 [email protected]
Facilitation Team Members Organization Phone Email
Mike Sollosi USCG Commandant (G-MWV) (202) 267-1539 [email protected]
Dave Murk USCG Commandant (G-MWV) (202) 267-1539 [email protected]
Doug Perkins Potomac Management Group, Inc. (703) 836-1037 [email protected]
Kris Higman Potomac Management Group, Inc. (757) 838-5296 [email protected]
Chuck Klingler Soza & Company, Ltd. (703) 560-9477 [email protected]
2
Port Risk Assessment Sault Ste. Marie, MI
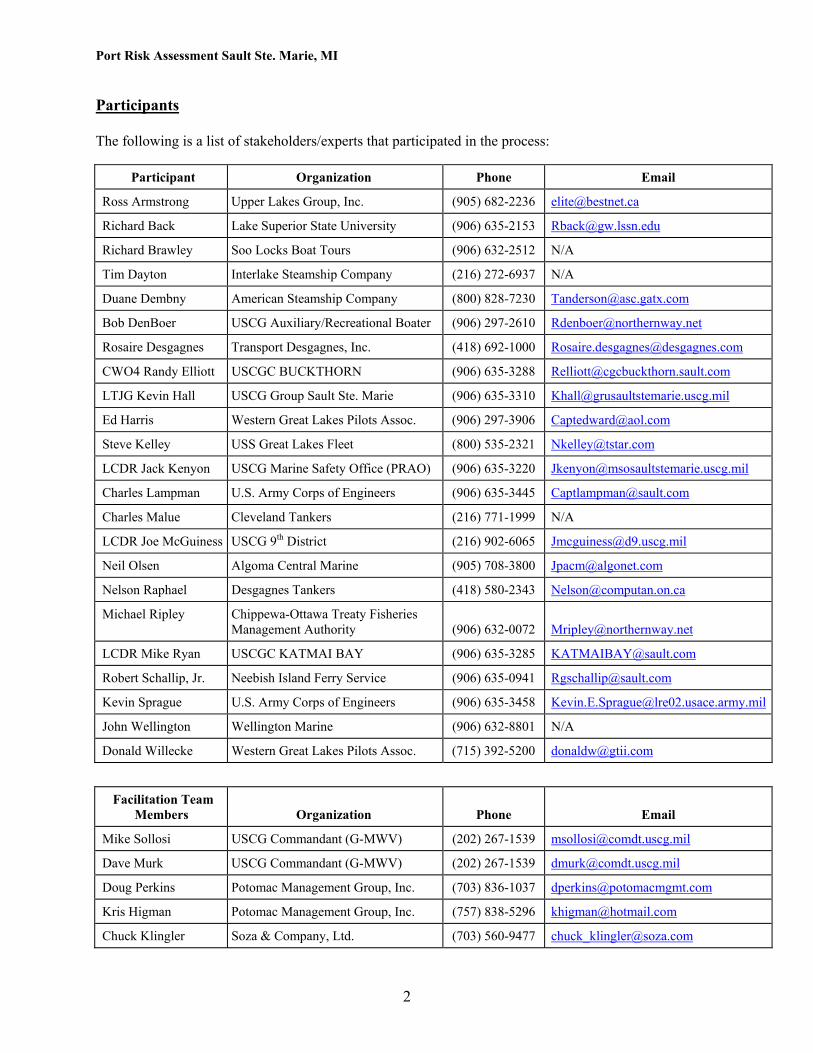
Numerical Results Book 1 – Risk Categories (Generic Weights Sum to 100)
Fleet Composition
5.3
Traffic Conditions
11.7
Navigational Conditions
28.9
Waterway Configuration
21.5
Short-term Consequences
14.4
Long-term Consequences
18.2
Analysis: Book 1 begins the process of weighting the national port risk model. The participant teams contribute their knowledge, using the AHP process, to provide weights to the six major risk categories. The contribution to the national model by the Sault Ste. Marie participants is as listed above. These participants felt that Navigational Conditions was the largest driver of risk. Fleet Composition was a significantly lower influence. Book 2 - Risk Factors (Generic Weights)
Fleet Composition
5.3
Traffic Conditions
11.7
Navigational Conditions
28.9
Waterway Configuration
21.5
Short-term Consequences
14.4
Long-term Consequences
18.2
% High Risk Deep Draft
4.1
Volume Deep Draft
2.8
Wind Conditions
4.5
Visibility Obstructions
3.5
Volume of Passengers
3.4
Economic Impacts
2.3
% High Risk Shallow Draft
1.2
Volume Shallow Draft
1.4
Visibility Conditions
16.3
Passing Arrangements
6.8
Volume of Petroleum
5.0
Environmental Impacts
5.4
Vol. Fishing & Pleasure
Craft
0.9
Current, Rivers, &
Tides
2.1
Channel & Bottom
5.2
Volume of Chemicals
6.0
Health & Safety Impacts
10.5
Traffic Density
6.6
Ice Conditions
6.0
Waterway Complexity
6.0
3
Port Risk Assessment Sault Ste. Marie, MI
Analysis: Book 2 further refines the weighting for the national port risk model. The participants examined the importance to port safety for each of the 20 risk factors and provided the above results to the national model. They determined that the following factors contributed the most to overall risk under each of the six major categories:
• Fleet Composition: High-Risk Deep Draft Vessels contribute a moderately high number. • Traffic Conditions: Traffic Density contributes the greatest amount of risk to a
waterway. • Navigational Conditions: Visibility Conditions contributes a significantly high value. • Waterway Configuration: Passing Arrangements is the most important contributor to
risk. • Short-term Consequences: Volume of Chemicals is the most important contributor to
risk. • Long-term Consequences: Health and Safety Impacts are the most important contributor
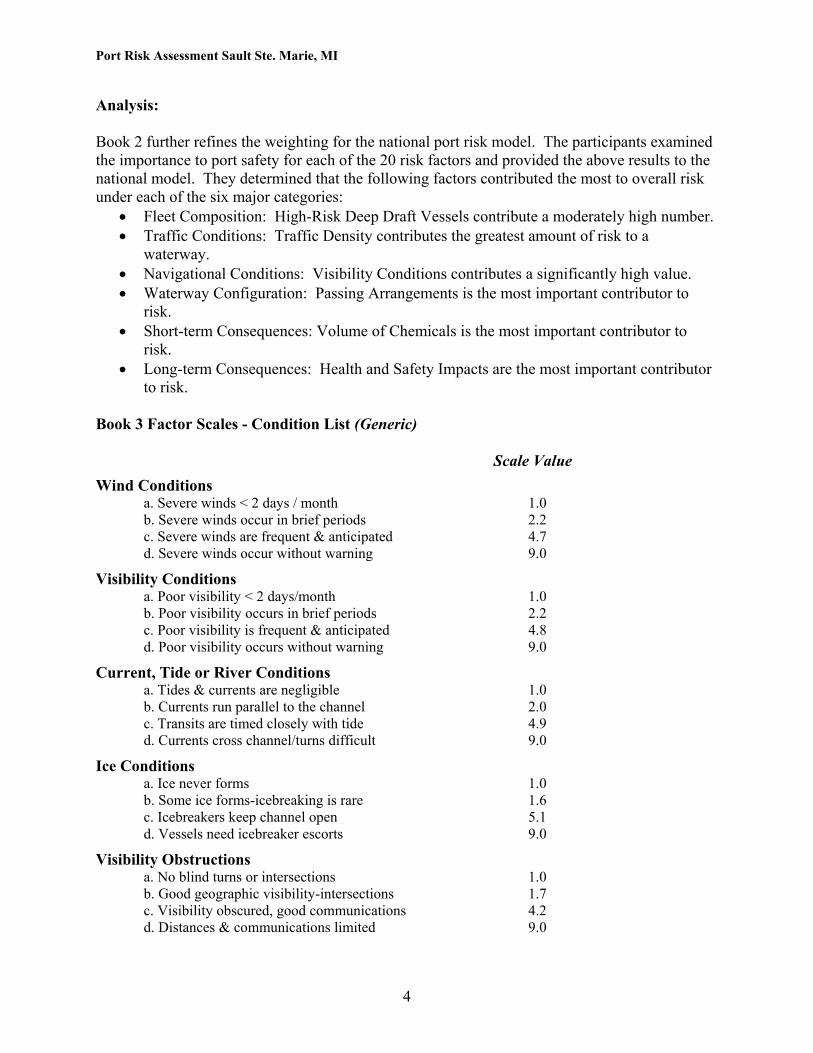
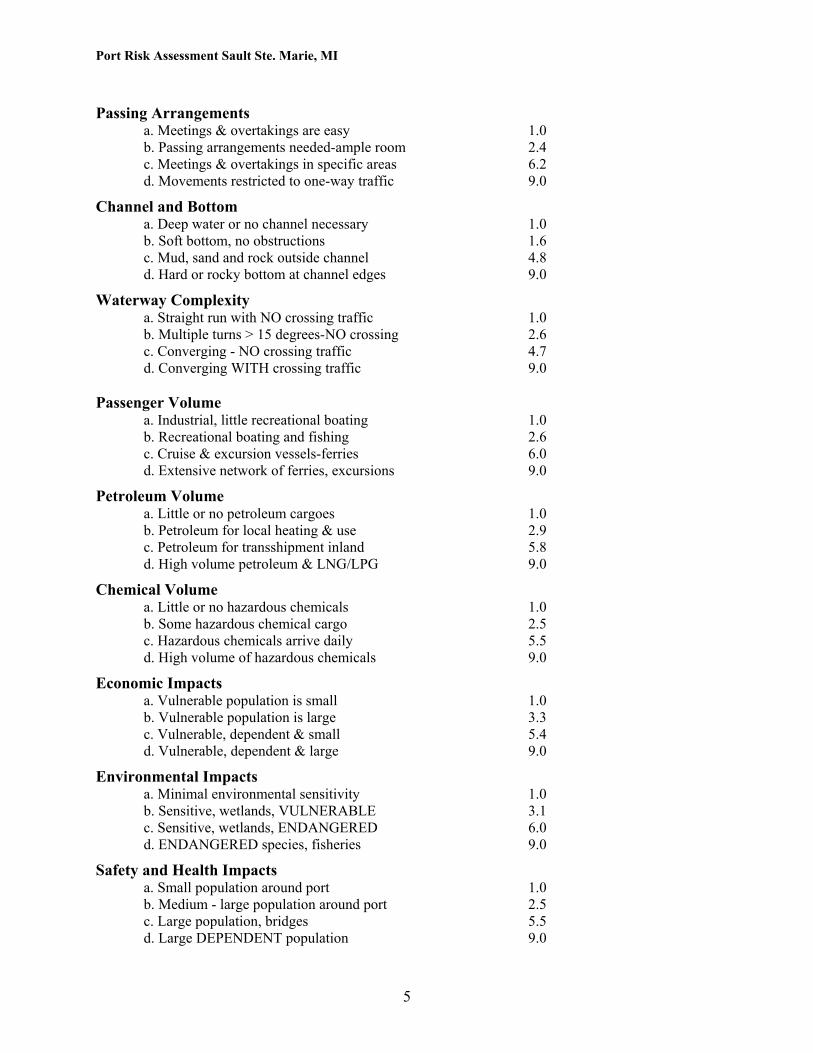
to risk. Book 3 Factor Scales - Condition List (Generic) Scale Value Wind Conditions a. Severe winds < 2 days / month 1.0 b. Severe winds occur in brief periods 2.2 c. Severe winds are frequent & anticipated 4.7 d. Severe winds occur without warning 9.0 Visibility Conditions a. Poor visibility < 2 days/month 1.0 b. Poor visibility occurs in brief periods 2.2 c. Poor visibility is frequent & anticipated 4.8 d. Poor visibility occurs without warning 9.0 Current, Tide or River Conditions a. Tides & currents are negligible 1.0 b. Currents run parallel to the channel 2.0 c. Transits are timed closely with tide 4.9 d. Currents cross channel/turns difficult 9.0 Ice Conditions a. Ice never forms 1.0 b. Some ice forms-icebreaking is rare 1.6 c. Icebreakers keep channel open 5.1 d. Vessels need icebreaker escorts 9.0 Visibility Obstructions a. No blind turns or intersections 1.0 b. Good geographic visibility-intersections 1.7 c. Visibility obscured, good communications 4.2 d. Distances & communications limited 9.0
4
Port Risk Assessment Sault Ste. Marie, MI
Passing Arrangements a. Meetings & overtakings are easy 1.0 b. Passing arrangements needed-ample room 2.4 c. Meetings & overtakings in specific areas 6.2 d. Movements restricted to one-way traffic 9.0 Channel and Bottom a. Deep water or no channel necessary 1.0 b. Soft bottom, no obstructions 1.6 c. Mud, sand and rock outside channel 4.8 d. Hard or rocky bottom at channel edges 9.0 Waterway Complexity a. Straight run with NO crossing traffic 1.0 b. Multiple turns > 15 degrees-NO crossing 2.6 c. Converging - NO crossing traffic 4.7 d. Converging WITH crossing traffic 9.0 Passenger Volume a. Industrial, little recreational boating 1.0 b. Recreational boating and fishing 2.6 c. Cruise & excursion vessels-ferries 6.0 d. Extensive network of ferries, excursions 9.0 Petroleum Volume a. Little or no petroleum cargoes 1.0 b. Petroleum for local heating & use 2.9 c. Petroleum for transshipment inland 5.8 d. High volume petroleum & LNG/LPG 9.0 Chemical Volume a. Little or no hazardous chemicals 1.0 b. Some hazardous chemical cargo 2.5 c. Hazardous chemicals arrive daily 5.5 d. High volume of hazardous chemicals 9.0 Economic Impacts a. Vulnerable population is small 1.0 b. Vulnerable population is large 3.3 c. Vulnerable, dependent & small 5.4 d. Vulnerable, dependent & large 9.0 Environmental Impacts a. Minimal environmental sensitivity 1.0 b. Sensitive, wetlands, VULNERABLE 3.1 c. Sensitive, wetlands, ENDANGERED 6.0 d. ENDANGERED species, fisheries 9.0 Safety and Health Impacts a. Small population around port 1.0 b. Medium - large population around port 2.5 c. Large population, bridges 5.5 d. Large DEPENDENT population 9.0
5
Port Risk Assessment Sault Ste. Marie, MI
Analysis:
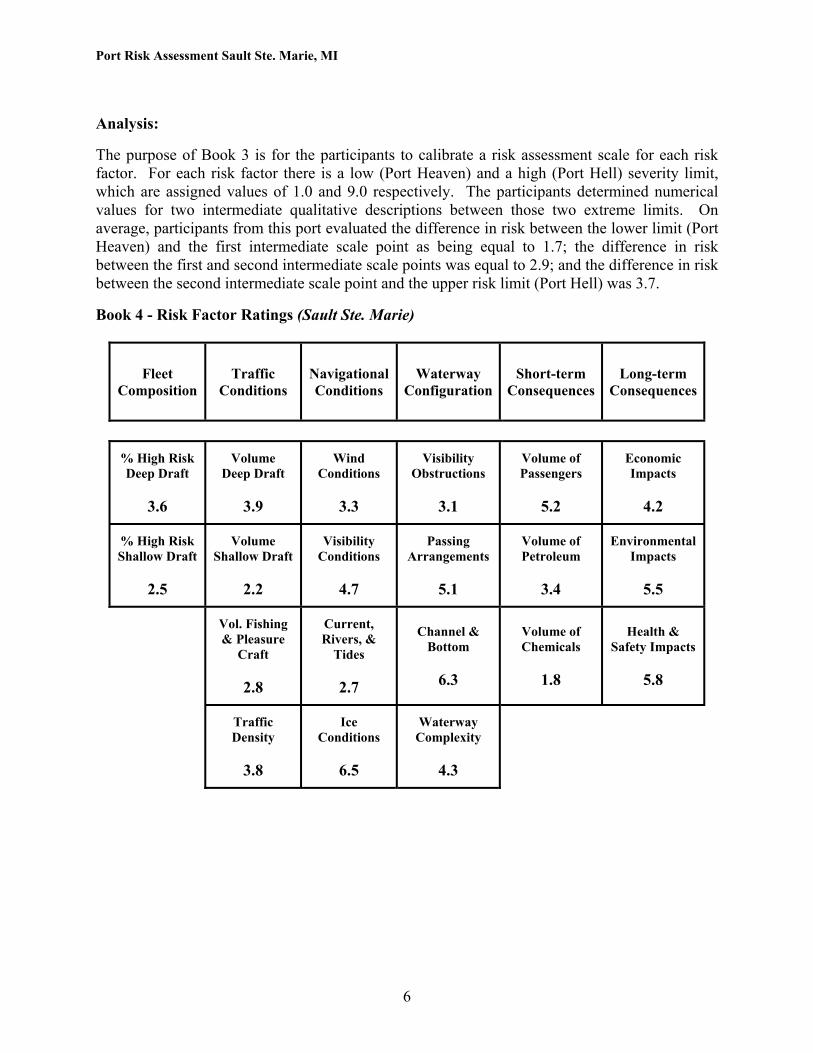
The purpose of Book 3 is for the participants to calibrate a risk assessment scale for each risk factor. For each risk factor there is a low (Port Heaven) and a high (Port Hell) severity limit, which are assigned values of 1.0 and 9.0 respectively. The participants determined numerical values for two intermediate qualitative descriptions between those two extreme limits. On average, participants from this port evaluated the difference in risk between the lower limit (Port Heaven) and the first intermediate scale point as being equal to 1.7; the difference in risk between the first and second intermediate scale points was equal to 2.9; and the difference in risk between the second intermediate scale point and the upper risk limit (Port Hell) was 3.7.
Book 4 - Risk Factor Ratings (Sault Ste. Marie)
Fleet Composition
Traffic Conditions
Navigational Conditions
Waterway Configuration
Short-term Consequences
Long-term Consequences
% High Risk Deep Draft
3.6
Volume Deep Draft
3.9
Wind Conditions
3.3
Visibility Obstructions
3.1
Volume of Passengers
5.2
Economic Impacts
4.2
% High Risk Shallow Draft
2.5
Volume Shallow Draft
2.2
Visibility Conditions
4.7
Passing Arrangements
5.1
Volume of Petroleum
3.4
Environmental Impacts
5.5
Vol. Fishing & Pleasure
Craft
2.8
Current, Rivers, &
Tides
2.7
Channel & Bottom
6.3
Volume of Chemicals
1.8
Health & Safety Impacts
5.8
Traffic Density
3.8
Ice Conditions
6.5
Waterway Complexity
4.3
6
Port Risk Assessment Sault Ste. Marie, MI
Analysis: This is the point in the workshop when the process begins to address local port risks. The participants use the scales developed in Book 3 to assess the absolute level of risk in their port for each of the 20 risk factors. The values shown in the preceding table do NOT add up to 100. Based on the input from the participants, the following are the top risks to port safety in Sault Ste. Marie (in order of importance):
1. Ice Conditions 2. Channel & Bottom 3. Health & Safety Impacts 4. Environmental Impacts 5. Volume of Passengers 6. Passing Arrangements
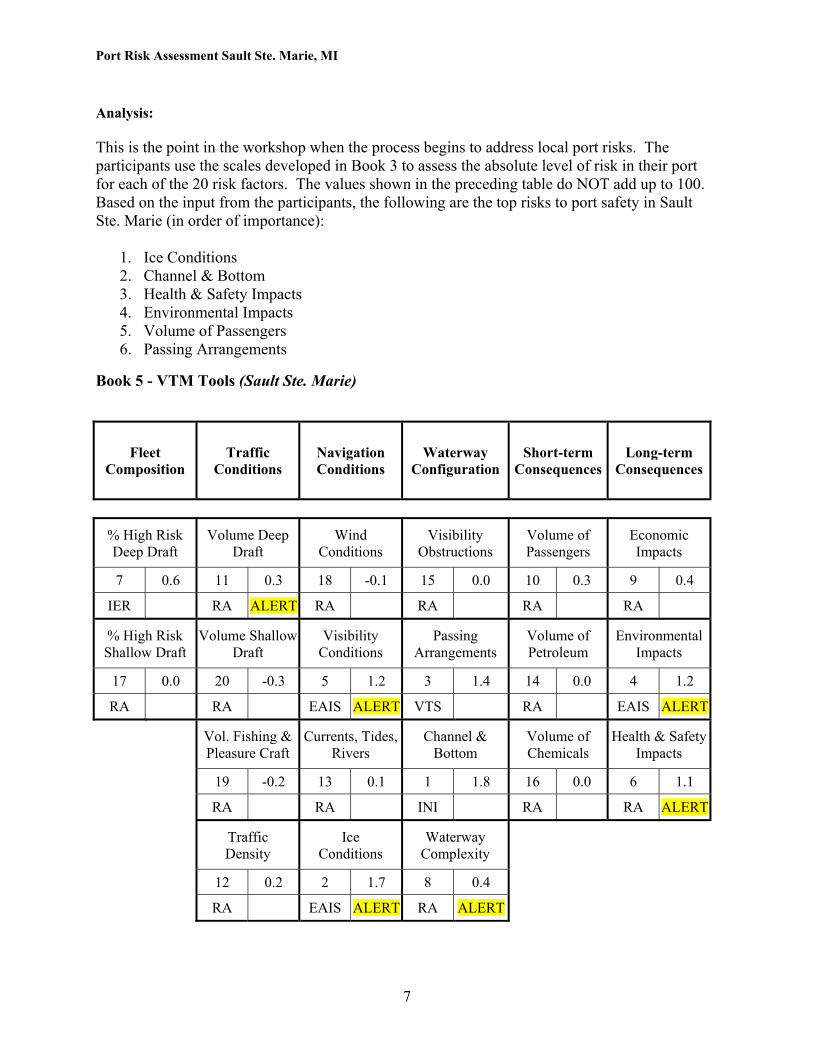
Book 5 - VTM Tools (Sault Ste. Marie)
Fleet Composition
Traffic Conditions
Navigation Conditions
Waterway Configuration
Short-term Consequences
Long-term Consequences
% High Risk Deep Draft
Volume Deep Draft
Wind Conditions
Visibility Obstructions
Volume of Passengers
Economic Impacts
7 0.6 11 0.3 18 -0.1 15 0.0 10 0.3 9 0.4
IER RA ALERT RA RA RA RA
% High Risk Shallow Draft
Volume Shallow Draft
Visibility Conditions
Passing Arrangements
Volume of Petroleum
Environmental Impacts
17 0.0 20 -0.3 5 1.2 3 1.4 14 0.0 4 1.2
RA RA EAIS ALERT VTS RA EAIS ALERT
Vol. Fishing & Pleasure Craft
Currents, Tides, Rivers
Channel & Bottom
Volume of Chemicals
Health & Safety Impacts
19 -0.2 13 0.1 1 1.8 16 0.0 6 1.1
RA RA INI RA RA ALERT
Traffic Density
Ice Conditions
Waterway Complexity
12 0.2 2 1.7 8 0.4
RA EAIS ALERT RA ALERT
7
Port Risk Assessment Sault Ste. Marie, MI
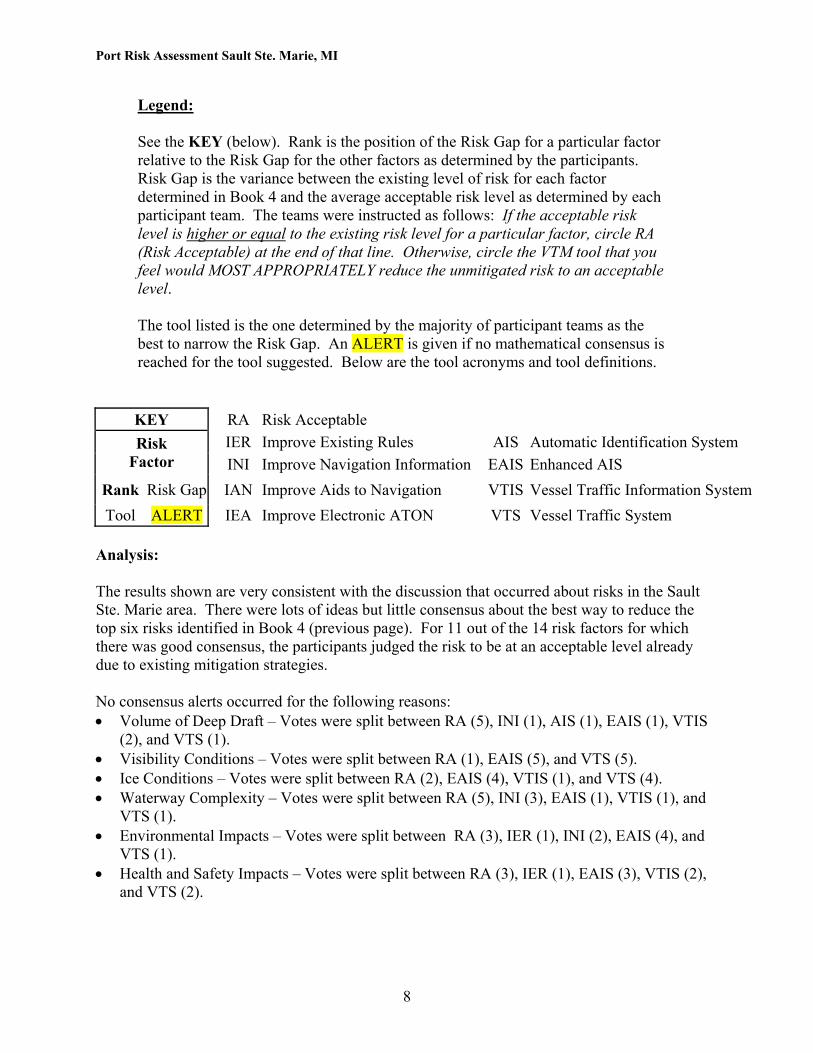
Legend: See the KEY (below). Rank is the position of the Risk Gap for a particular factor relative to the Risk Gap for the other factors as determined by the participants. Risk Gap is the variance between the existing level of risk for each factor determined in Book 4 and the average acceptable risk level as determined by each participant team. The teams were instructed as follows: If the acceptable risk level is higher or equal to the existing risk level for a particular factor, circle RA (Risk Acceptable) at the end of that line. Otherwise, circle the VTM tool that you feel would MOST APPROPRIATELY reduce the unmitigated risk to an acceptable level. The tool listed is the one determined by the majority of participant teams as the best to narrow the Risk Gap. An ALERT is given if no mathematical consensus is reached for the tool suggested. Below are the tool acronyms and tool definitions. KEY RA Risk Acceptable
IER Improve Existing Rules AIS Automatic Identification System Risk Factor INI Improve Navigation Information EAIS Enhanced AIS
Rank Risk Gap IAN Improve Aids to Navigation VTIS Vessel Traffic Information System Tool ALERT IEA Improve Electronic ATON VTS Vessel Traffic System
Analysis: The results shown are very consistent with the discussion that occurred about risks in the Sault Ste. Marie area. There were lots of ideas but little consensus about the best way to reduce the top six risks identified in Book 4 (previous page). For 11 out of the 14 risk factors for which there was good consensus, the participants judged the risk to be at an acceptable level already due to existing mitigation strategies. No consensus alerts occurred for the following reasons: • Volume of Deep Draft – Votes were split between RA (5), INI (1), AIS (1), EAIS (1), VTIS
(2), and VTS (1). • Visibility Conditions – Votes were split between RA (1), EAIS (5), and VTS (5). • Ice Conditions – Votes were split between RA (2), EAIS (4), VTIS (1), and VTS (4). • Waterway Complexity – Votes were split between RA (5), INI (3), EAIS (1), VTIS (1), and
VTS (1). • Environmental Impacts – Votes were split between RA (3), IER (1), INI (2), EAIS (4), and
VTS (1). • Health and Safety Impacts – Votes were split between RA (3), IER (1), EAIS (3), VTIS (2),
and VTS (2).
8
Port Risk Assessment Sault Ste. Marie, MI
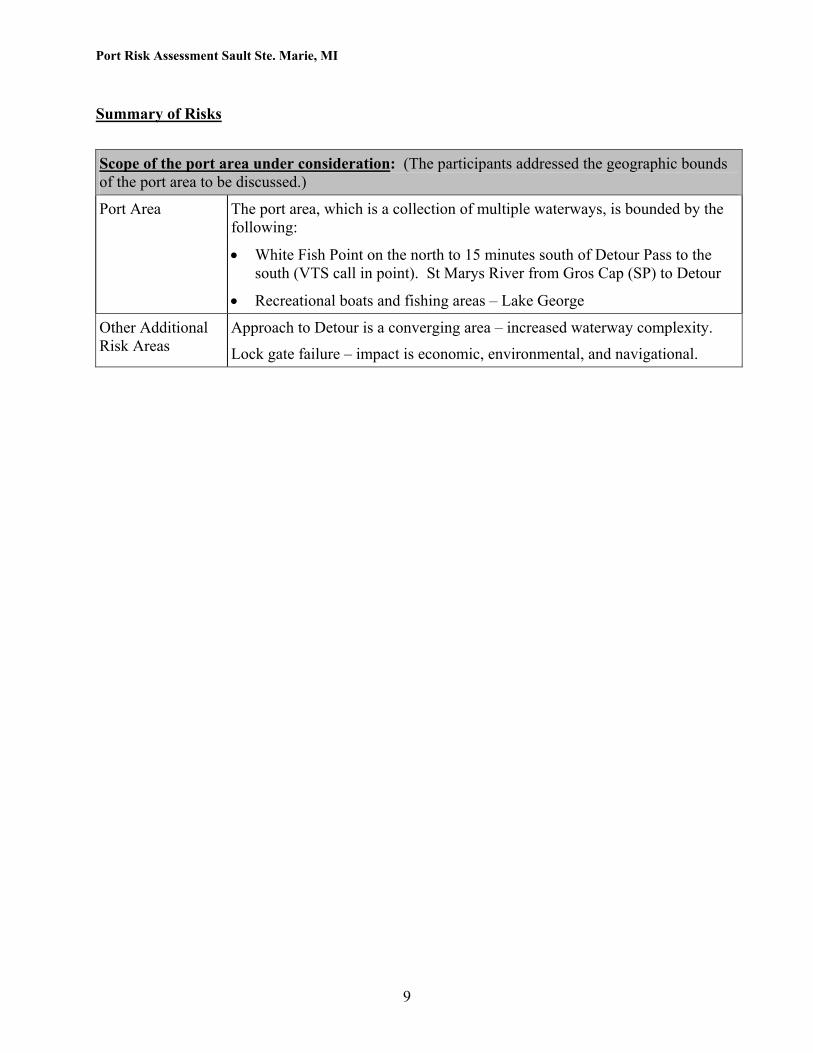
Summary of Risks
Scope of the port area under consideration: (The participants addressed the geographic bounds of the port area to be discussed.)
Port Area The port area, which is a collection of multiple waterways, is bounded by the following:
• White Fish Point on the north to 15 minutes south of Detour Pass to the south (VTS call in point). St Marys River from Gros Cap (SP) to Detour
• Recreational boats and fishing areas – Lake George
Other Additional Risk Areas
Approach to Detour is a converging area – increased waterway complexity.
Lock gate failure – impact is economic, environmental, and navigational.
9
Port Risk Assessment Sault Ste. Marie, MI
RISK FACTORS RISKS MITIGATIONS
Fleet Composition
% High Risk Deep Draft Cargo & Passenger Vessels
(Defined in terms of maintenance, accidents, quality of crew)
Low percentage fall into high risk – about 4 - 5 percent. This includes:
• Laker vessels – Canadian and US flag
• Ocean (foreign – 10 - 12%) vessels, size
1. Must meet seaway inspection.
2. USCG does not inspect foreign flag because transiting.
3. Less than 10% fall into Category 1 designations.
4. 30% problems (Categories 1 and 2)…different crew (language).
5. From brand new to real dogs.
6. Problems with winches and persons operating those winches.
• Integrated Tug and Barge (ITB) – concern about the licensing and manning requirements are different than for the deep draft ships and may carry the same cargo. Maintenance quality is not required at same level as deep draft ships.
Trends:
• Eastern European crews are replacing Philippine, quality is getting worse. More coming from Soviet block counties.
• More multinational crews.
No existing mitigation discussed.
Consider following mitigation:
• Crew Competency, particularly with foreign vessels - pilot onboard at Precautionary Area mitigates risk…have local knowledge.
• Port State Control program keeps the high-risk vessels from coming in.
• USCG does operational tests of crews.
• Take advantage of statistics and look at screening process.
• Continue to have all pilot state licensed with local knowledge.
% High Risk Shallow Draft Cargo & Passenger Vessels
Low risk
All domestic shallow draft, includes the following:
• Tugs and barges
1. Go slow, only make 3-4 mph – obstruct channel.
2. Small in number and impact.
• Recreational boats
1. Not much of a presence on St. Marys, yet more fishing when salmon begin to run – mid August.
2. 125 boats in Detour reef light area. 3. Expertise is lacking in safe boating – when
take course, admit learning things. 5. Only problems with people fishing in the
channel middle.
No existing mitigation discussed.
New mitigation:
• Consider a licensing program to ensure proper knowledge level of recreational boat operators.
• Consider establishing power to tonnage ratios.
Continued Next Page
10
Port Risk Assessment Sault Ste. Marie, MI
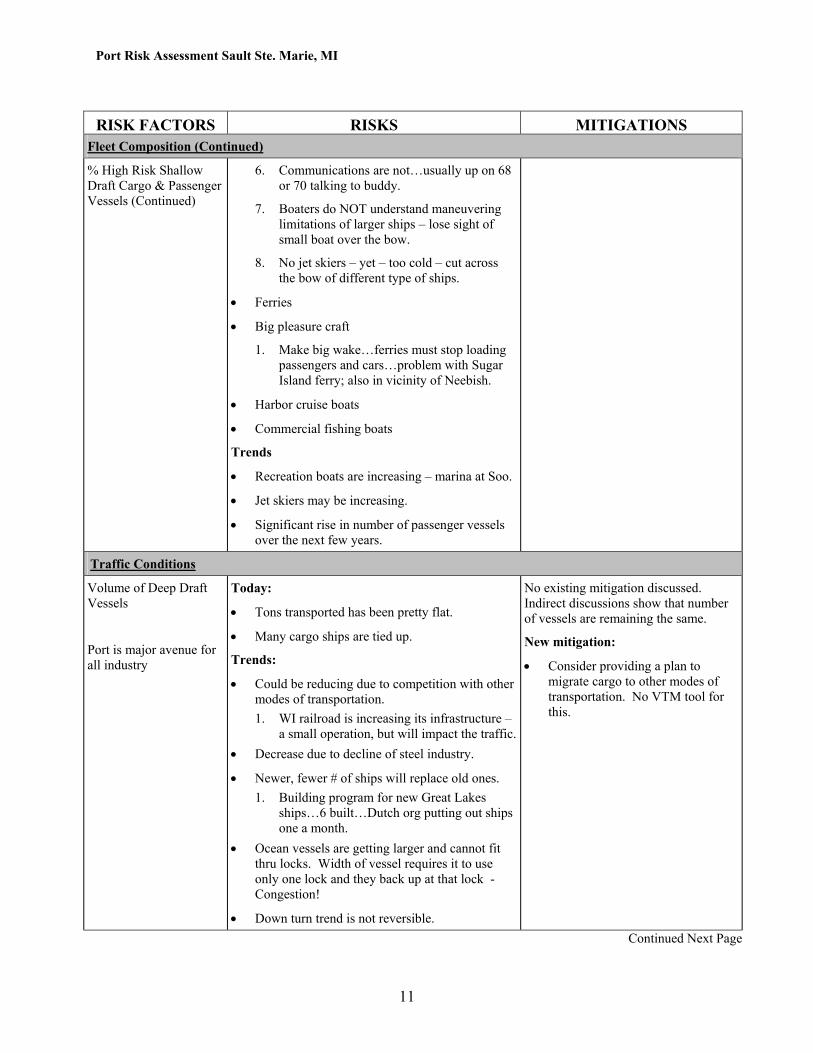
RISK FACTORS RISKS MITIGATIONS Fleet Composition (Continued)
% High Risk Shallow Draft Cargo & Passenger Vessels (Continued)
6. Communications are not…usually up on 68 or 70 talking to buddy.
7. Boaters do NOT understand maneuvering limitations of larger ships – lose sight of small boat over the bow.
8. No jet skiers – yet – too cold – cut across the bow of different type of ships.
• Ferries
• Big pleasure craft
1. Make big wake…ferries must stop loading passengers and cars…problem with Sugar Island ferry; also in vicinity of Neebish.
• Harbor cruise boats
• Commercial fishing boats
Trends
• Recreation boats are increasing – marina at Soo.
• Jet skiers may be increasing.
• Significant rise in number of passenger vessels over the next few years.
Traffic Conditions
Volume of Deep Draft Vessels
Port is major avenue for all industry
Today:
• Tons transported has been pretty flat.
• Many cargo ships are tied up.
Trends:
• Could be reducing due to competition with other modes of transportation. 1. WI railroad is increasing its infrastructure –
a small operation, but will impact the traffic.• Decrease due to decline of steel industry.
• Newer, fewer # of ships will replace old ones. 1. Building program for new Great Lakes
ships…6 built…Dutch org putting out ships one a month.
• Ocean vessels are getting larger and cannot fit thru locks. Width of vessel requires it to use only one lock and they back up at that lock - Congestion!
• Down turn trend is not reversible.
No existing mitigation discussed. Indirect discussions show that number of vessels are remaining the same.
New mitigation:
• Consider providing a plan to migrate cargo to other modes of transportation. No VTM tool for this.
Continued Next Page
11
Port Risk Assessment Sault Ste. Marie, MI
RISK FACTORS RISKS MITIGATIONS
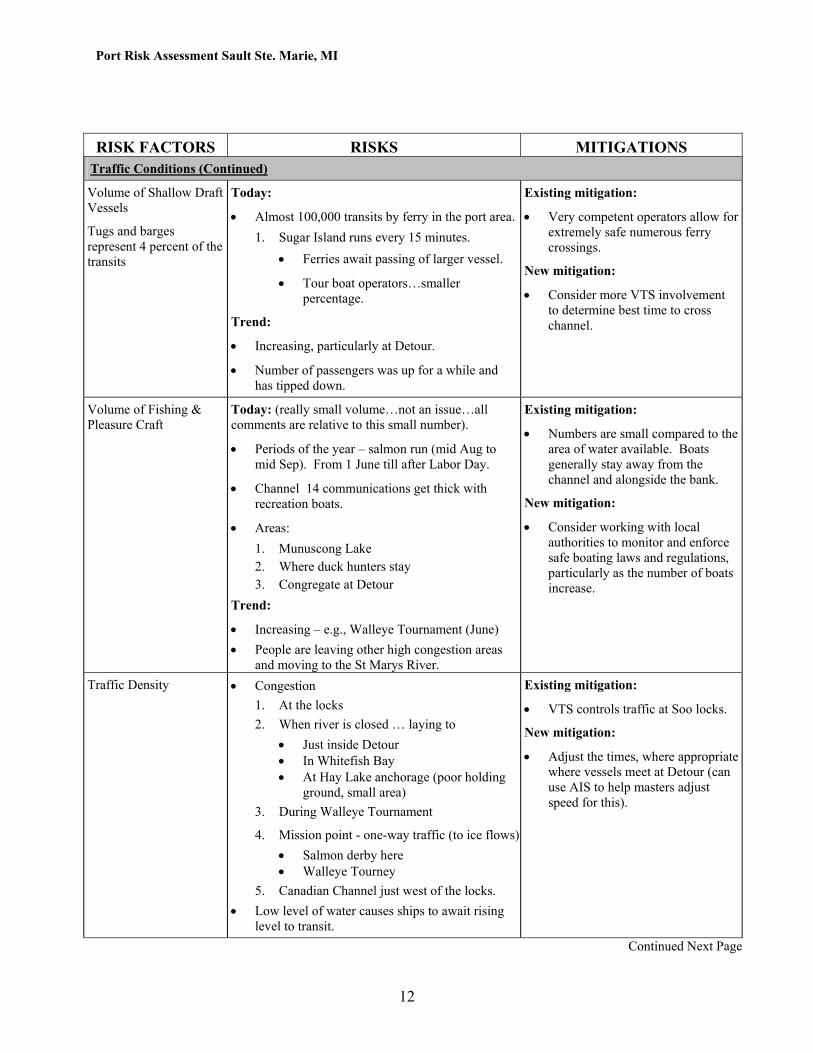
Traffic Conditions (Continued)
Volume of Shallow Draft Vessels
Tugs and barges represent 4 percent of the transits
Today:
• Almost 100,000 transits by ferry in the port area.1. Sugar Island runs every 15 minutes.
• Ferries await passing of larger vessel.
• Tour boat operators…smaller percentage.
Trend:
• Increasing, particularly at Detour.
• Number of passengers was up for a while and has tipped down.
Existing mitigation:
• Very competent operators allow for extremely safe numerous ferry crossings.
New mitigation:
• Consider more VTS involvement to determine best time to cross channel.
Volume of Fishing & Pleasure Craft
Today: (really small volume…not an issue…all comments are relative to this small number).
• Periods of the year – salmon run (mid Aug to mid Sep). From 1 June till after Labor Day.
• Channel 14 communications get thick with recreation boats.
• Areas: 1. Munuscong Lake 2. Where duck hunters stay 3. Congregate at Detour
Trend:
• Increasing – e.g., Walleye Tournament (June) • People are leaving other high congestion areas
and moving to the St Marys River.
Existing mitigation:
• Numbers are small compared to the area of water available. Boats generally stay away from the channel and alongside the bank.
New mitigation:
• Consider working with local authorities to monitor and enforce safe boating laws and regulations, particularly as the number of boats increase.
Traffic Density
• Congestion 1. At the locks 2. When river is closed … laying to
• Just inside Detour • In Whitefish Bay • At Hay Lake anchorage (poor holding
ground, small area) 3. During Walleye Tournament
4. Mission point - one-way traffic (to ice flows)• Salmon derby here • Walleye Tourney
5. Canadian Channel just west of the locks. • Low level of water causes ships to await rising
level to transit.
Existing mitigation:
• VTS controls traffic at Soo locks.
New mitigation:
• Adjust the times, where appropriate where vessels meet at Detour (can use AIS to help masters adjust speed for this).
Continued Next Page
12
Port Risk Assessment Sault Ste. Marie, MI
RISK FACTORS RISKS MITIGATIONS
Navigational Conditions
Wind Conditions
• 20 to 25 kts hard to maneuver vessel. This occurs as follows:
1. More windy days in fall than spring.
2. In fall, half the time the wind affects the vessels.
• Prevailing winds from northwest (down the channel).
• Salties upbound and light, use the entire channel where wind blows across the channel. Current sets to west in that area.
• Coming down to locks, affected by wind.
• Wind affects water level.
• Predictability:
1. Know when the wind will blow.
• A good wind from the east will last up to 10 hours – blows across the channel.
Existing mitigation:
• VTS provides wind speed information and predictions by voice radio.
New mitigation:
• Consider cataloging additional wind data gathering facilities in the area to enable expanded use of data when necessary.
• Monitor and review effectiveness of vessel evacuation plans as part of hurricane preparedness planning.
• Use EAIS to provide wind information to vessel pilothouse and conning officer.
Visibility Conditions • 149 days of fog a year – ¼ mile or less visibility.
• Seems to occur in early morning hours.
• Fog sometimes occurs as a fog period, not a fog day.
• Usually stopped 4 to 5 times a year due to low visibility.
• Fog occurs in different places at different times.
• Problem areas:
1. Making turn at Rock Cut
2. Moon Island
3. Johnson Point
Goal: Reduce the risk of casualties.
Existing mitigation:
• Required anchoring in low visibility.
• Some vessels carry precision navigation tool.
• Many one way zones reduce the occurrence of meeting traffic.
• Required to carry two operating radars.
• COTP plays honest broker to control traffic on the river during low visibility – provides level playing field.
New mitigation:
• Improve navigation information:
1. Correct charting accuracy problem particularly at Rock Cut.
2. Consider resurvey of St. Marys River.
Continued Next Page
13
Port Risk Assessment Sault Ste. Marie, MI
RISK FACTORS RISKS MITIGATIONS
Navigational Conditions (Continued)
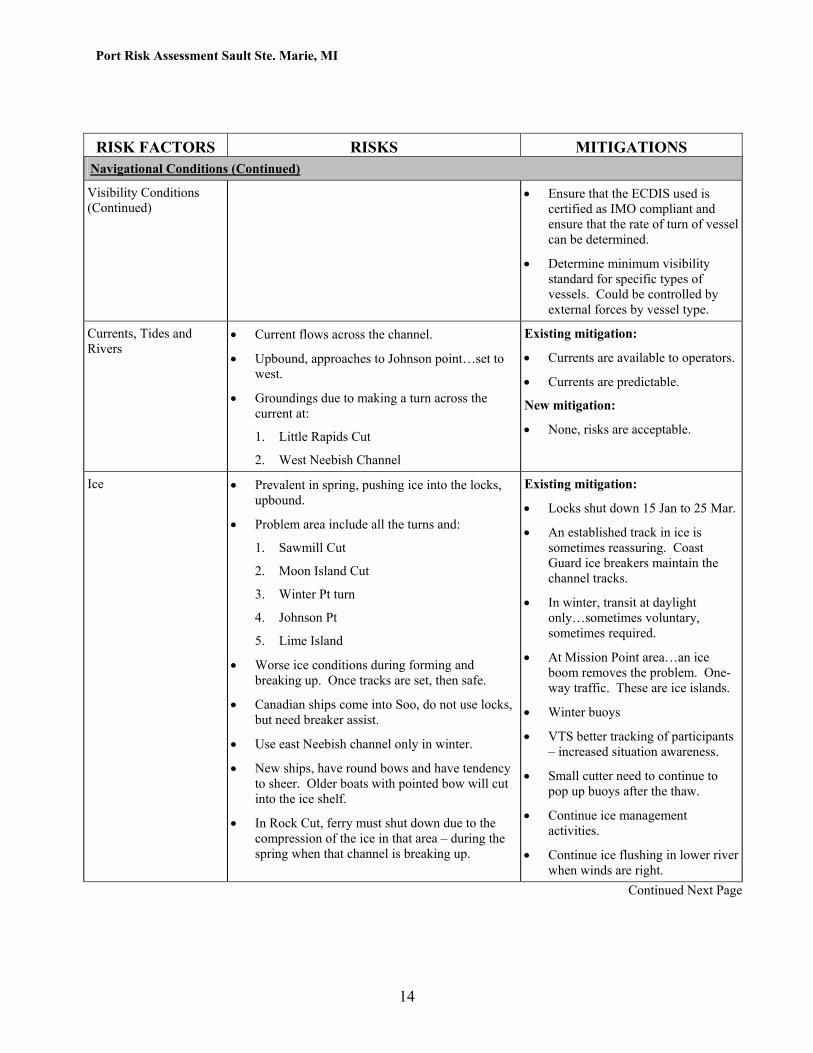
Visibility Conditions (Continued)
• Ensure that the ECDIS used is certified as IMO compliant and ensure that the rate of turn of vessel can be determined.
• Determine minimum visibility standard for specific types of vessels. Could be controlled by external forces by vessel type.
Currents, Tides and Rivers
• Current flows across the channel.
• Upbound, approaches to Johnson point…set to west.
• Groundings due to making a turn across the current at:
1. Little Rapids Cut
2. West Neebish Channel
Existing mitigation:
• Currents are available to operators.
• Currents are predictable.
New mitigation:
• None, risks are acceptable.
Ice • Prevalent in spring, pushing ice into the locks, upbound.
• Problem area include all the turns and:
1. Sawmill Cut
2. Moon Island Cut
3. Winter Pt turn
4. Johnson Pt
5. Lime Island
• Worse ice conditions during forming and breaking up. Once tracks are set, then safe.
• Canadian ships come into Soo, do not use locks, but need breaker assist.
• Use east Neebish channel only in winter.
• New ships, have round bows and have tendency to sheer. Older boats with pointed bow will cut into the ice shelf.
• In Rock Cut, ferry must shut down due to the compression of the ice in that area – during the spring when that channel is breaking up.
Existing mitigation:
• Locks shut down 15 Jan to 25 Mar.
• An established track in ice is sometimes reassuring. Coast Guard ice breakers maintain the channel tracks.
• In winter, transit at daylight only…sometimes voluntary, sometimes required.
• At Mission Point area…an ice boom removes the problem. One-way traffic. These are ice islands.
• Winter buoys
• VTS better tracking of participants – increased situation awareness.
• Small cutter need to continue to pop up buoys after the thaw.
• Continue ice management activities.
• Continue ice flushing in lower river when winds are right.
Continued Next Page
14
Port Risk Assessment Sault Ste. Marie, MI
RISK FACTORS RISKS MITIGATIONS
Navigational Conditions (Continued)
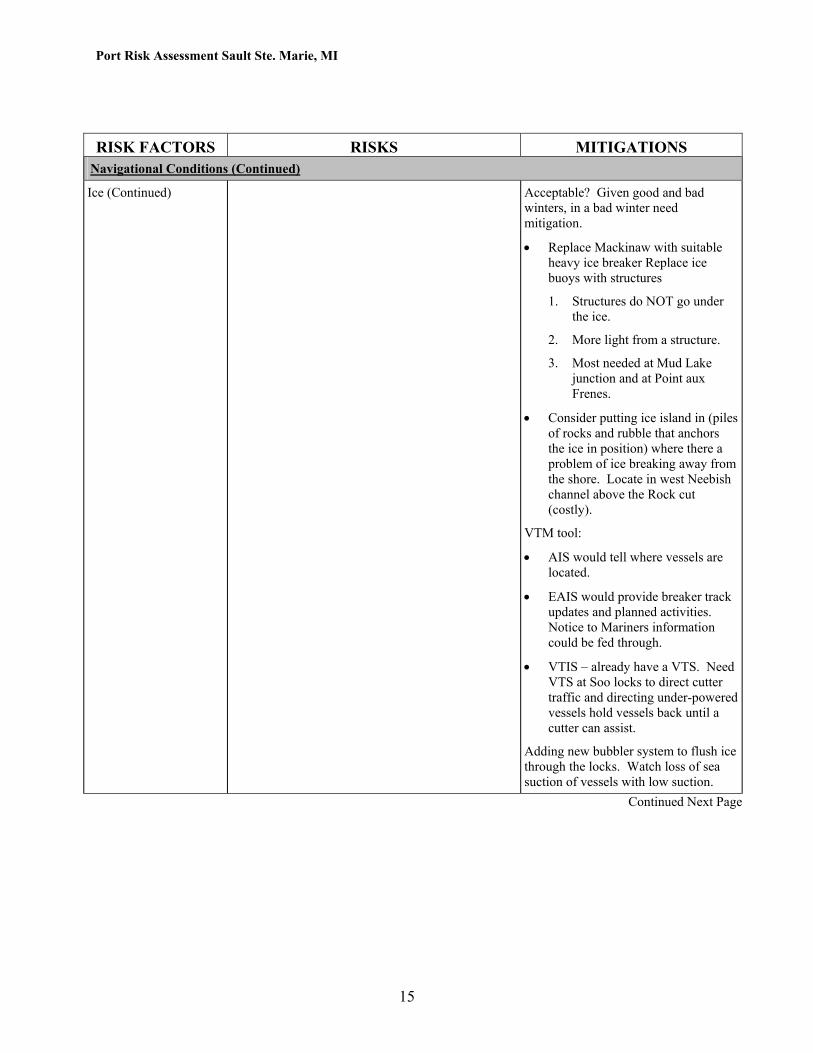
Ice (Continued) Acceptable? Given good and bad winters, in a bad winter need mitigation.
• Replace Mackinaw with suitable heavy ice breaker Replace ice buoys with structures
1. Structures do NOT go under the ice.
2. More light from a structure.
3. Most needed at Mud Lake junction and at Point aux Frenes.
• Consider putting ice island in (piles of rocks and rubble that anchors the ice in position) where there a problem of ice breaking away from the shore. Locate in west Neebish channel above the Rock cut (costly).
VTM tool:
• AIS would tell where vessels are located.
• EAIS would provide breaker track updates and planned activities. Notice to Mariners information could be fed through.
• VTIS – already have a VTS. Need VTS at Soo locks to direct cutter traffic and directing under-powered vessels hold vessels back until a cutter can assist.
Adding new bubbler system to flush ice through the locks. Watch loss of sea suction of vessels with low suction.
Continued Next Page
15
Port Risk Assessment Sault Ste. Marie, MI
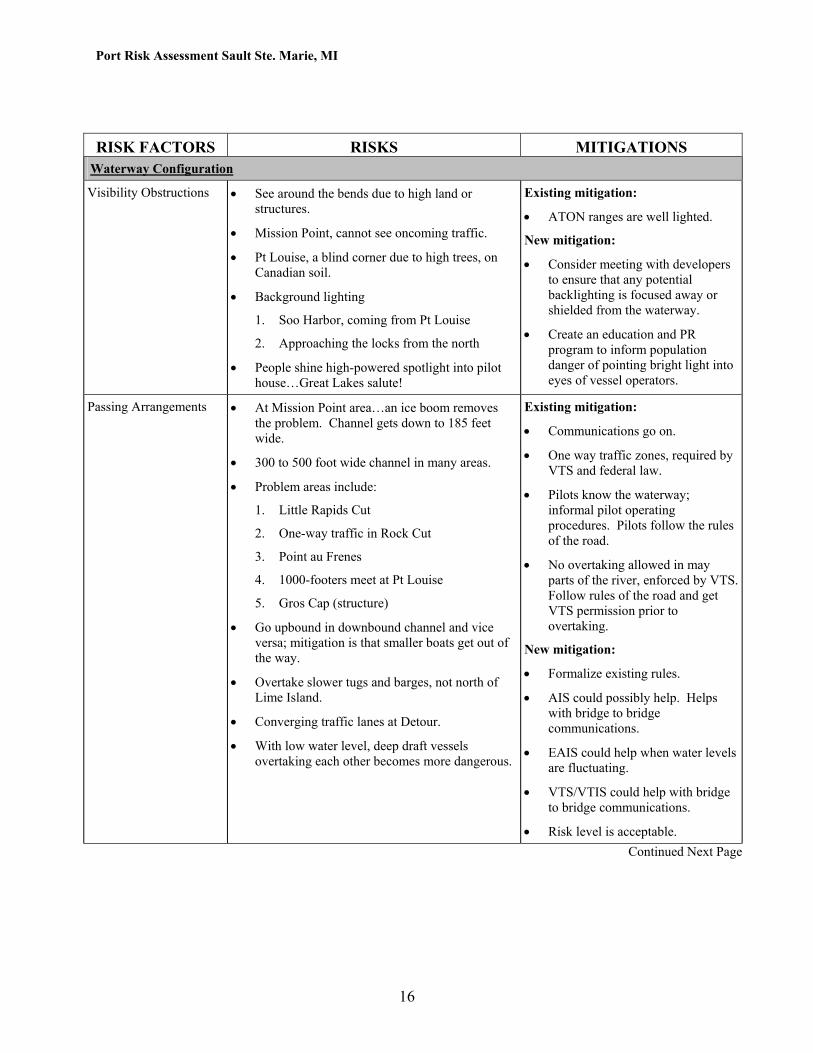
RISK FACTORS RISKS MITIGATIONS
Waterway Configuration
Visibility Obstructions
• See around the bends due to high land or structures.
• Mission Point, cannot see oncoming traffic.
• Pt Louise, a blind corner due to high trees, on Canadian soil.
• Background lighting
1. Soo Harbor, coming from Pt Louise
2. Approaching the locks from the north
• People shine high-powered spotlight into pilot house…Great Lakes salute!
Existing mitigation:
• ATON ranges are well lighted.
New mitigation:
• Consider meeting with developers to ensure that any potential backlighting is focused away or shielded from the waterway.
• Create an education and PR program to inform population danger of pointing bright light into eyes of vessel operators.
Passing Arrangements
• At Mission Point area…an ice boom removes the problem. Channel gets down to 185 feet wide.
• 300 to 500 foot wide channel in many areas.
• Problem areas include:
1. Little Rapids Cut
2. One-way traffic in Rock Cut
3. Point au Frenes
4. 1000-footers meet at Pt Louise
5. Gros Cap (structure)
• Go upbound in downbound channel and vice versa; mitigation is that smaller boats get out of the way.
• Overtake slower tugs and barges, not north of Lime Island.
• Converging traffic lanes at Detour.
• With low water level, deep draft vessels overtaking each other becomes more dangerous.
Existing mitigation:
• Communications go on.
• One way traffic zones, required by VTS and federal law.
• Pilots know the waterway; informal pilot operating procedures. Pilots follow the rules of the road.
• No overtaking allowed in may parts of the river, enforced by VTS. Follow rules of the road and get VTS permission prior to overtaking.
New mitigation:
• Formalize existing rules.
• AIS could possibly help. Helps with bridge to bridge communications.
• EAIS could help when water levels are fluctuating.
• VTS/VTIS could help with bridge to bridge communications.
• Risk level is acceptable. Continued Next Page
16
Port Risk Assessment Sault Ste. Marie, MI
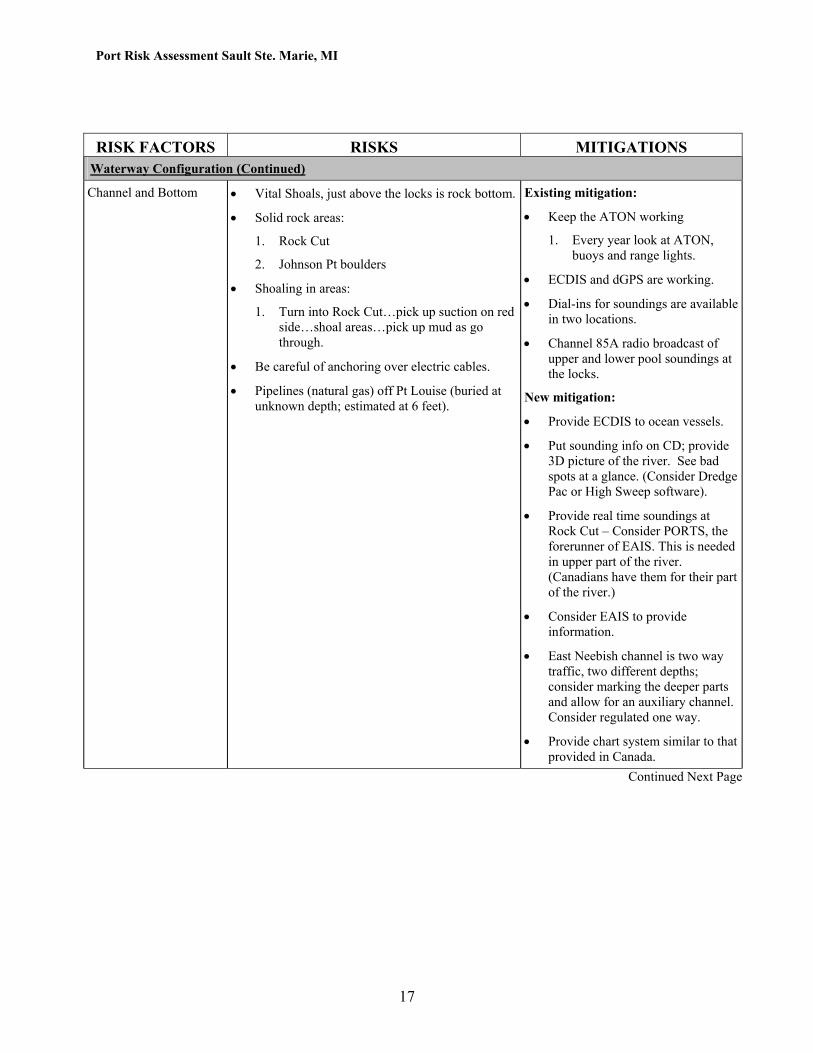
RISK FACTORS RISKS MITIGATIONS
Waterway Configuration (Continued)
Channel and Bottom • Vital Shoals, just above the locks is rock bottom.
• Solid rock areas:
1. Rock Cut
2. Johnson Pt boulders
• Shoaling in areas:
1. Turn into Rock Cut…pick up suction on red side…shoal areas…pick up mud as go through.
• Be careful of anchoring over electric cables.
• Pipelines (natural gas) off Pt Louise (buried at unknown depth; estimated at 6 feet).
Existing mitigation:
• Keep the ATON working
1. Every year look at ATON, buoys and range lights.
• ECDIS and dGPS are working.
• Dial-ins for soundings are available in two locations.
• Channel 85A radio broadcast of upper and lower pool soundings at the locks.
New mitigation:
• Provide ECDIS to ocean vessels.
• Put sounding info on CD; provide 3D picture of the river. See bad spots at a glance. (Consider Dredge Pac or High Sweep software).
• Provide real time soundings at Rock Cut – Consider PORTS, the forerunner of EAIS. This is needed in upper part of the river. (Canadians have them for their part of the river.)
• Consider EAIS to provide information.
• East Neebish channel is two way traffic, two different depths; consider marking the deeper parts and allow for an auxiliary channel. Consider regulated one way.
• Provide chart system similar to that provided in Canada.
Continued Next Page
17
Port Risk Assessment Sault Ste. Marie, MI
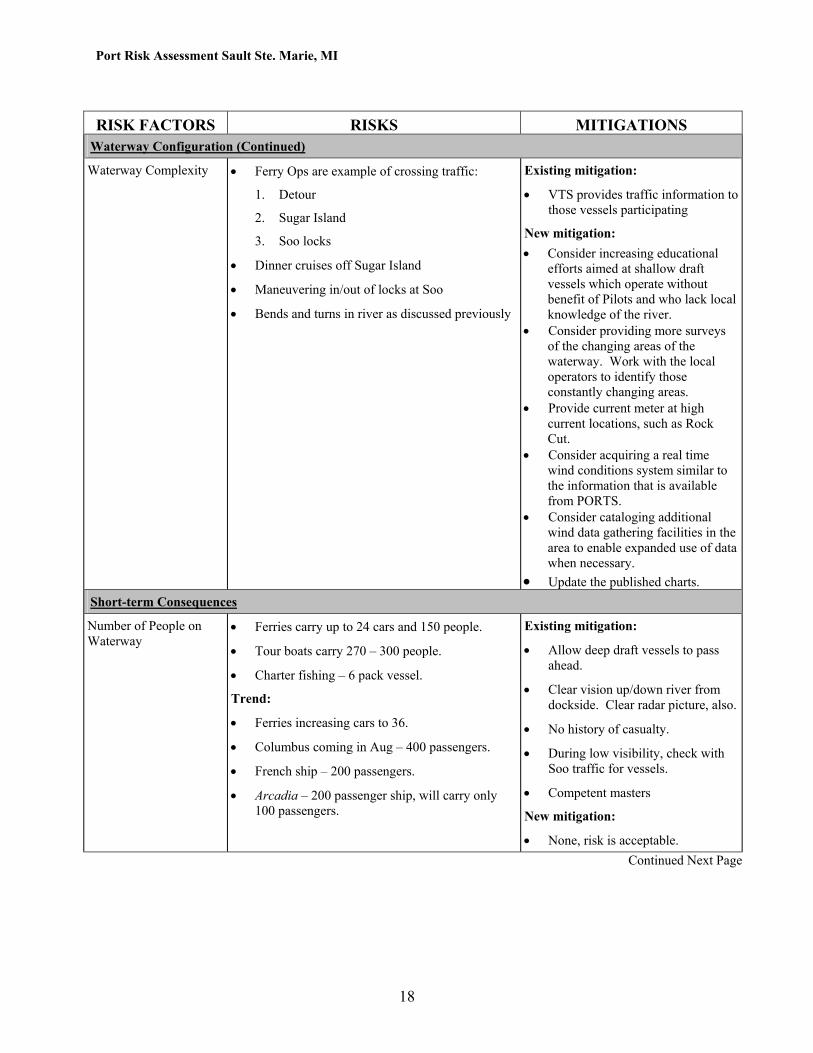
RISK FACTORS RISKS MITIGATIONS Waterway Configuration (Continued)
Waterway Complexity • Ferry Ops are example of crossing traffic:
1. Detour
2. Sugar Island
3. Soo locks
• Dinner cruises off Sugar Island
• Maneuvering in/out of locks at Soo
• Bends and turns in river as discussed previously
Existing mitigation:
• VTS provides traffic information to those vessels participating
New mitigation: • Consider increasing educational
efforts aimed at shallow draft vessels which operate without benefit of Pilots and who lack local knowledge of the river.
• Consider providing more surveys of the changing areas of the waterway. Work with the local operators to identify those constantly changing areas.
• Provide current meter at high current locations, such as Rock Cut.
• Consider acquiring a real time wind conditions system similar to the information that is available from PORTS.
• Consider cataloging additional wind data gathering facilities in the area to enable expanded use of data when necessary.
• Update the published charts. Short-term Consequences
Number of People on Waterway
• Ferries carry up to 24 cars and 150 people.
• Tour boats carry 270 – 300 people.
• Charter fishing – 6 pack vessel.
Trend:
• Ferries increasing cars to 36.
• Columbus coming in Aug – 400 passengers.
• French ship – 200 passengers.
• Arcadia – 200 passenger ship, will carry only 100 passengers.
Existing mitigation:
• Allow deep draft vessels to pass ahead.
• Clear vision up/down river from dockside. Clear radar picture, also.
• No history of casualty.
• During low visibility, check with Soo traffic for vessels.
• Competent masters
New mitigation:
• None, risk is acceptable. Continued Next Page
18
Port Risk Assessment Sault Ste. Marie, MI
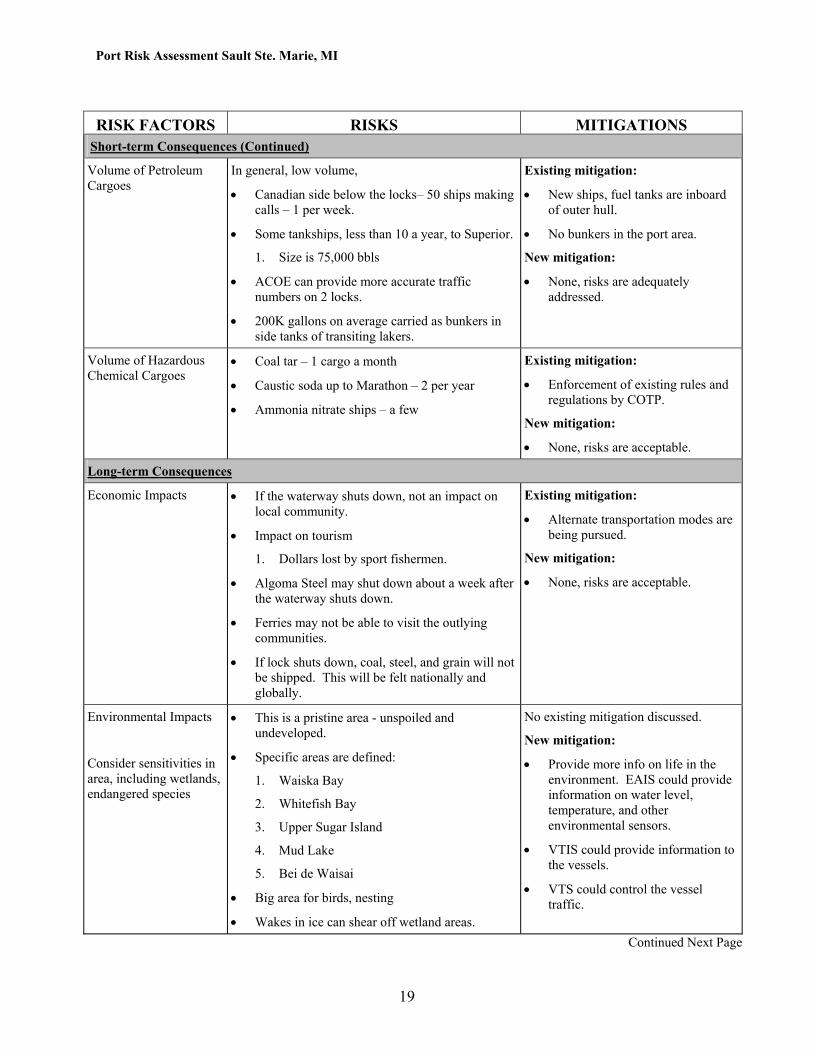
RISK FACTORS RISKS MITIGATIONS Short-term Consequences (Continued)
Volume of Petroleum Cargoes
In general, low volume,
• Canadian side below the locks– 50 ships making calls – 1 per week.
• Some tankships, less than 10 a year, to Superior.
1. Size is 75,000 bbls
• ACOE can provide more accurate traffic numbers on 2 locks.
• 200K gallons on average carried as bunkers in side tanks of transiting lakers.
Existing mitigation:
• New ships, fuel tanks are inboard of outer hull.
• No bunkers in the port area.
New mitigation:
• None, risks are adequately addressed.
Volume of Hazardous Chemical Cargoes
• Coal tar – 1 cargo a month
• Caustic soda up to Marathon – 2 per year
• Ammonia nitrate ships – a few
Existing mitigation:
• Enforcement of existing rules and regulations by COTP.
New mitigation:
• None, risks are acceptable.
Long-term Consequences
Economic Impacts • If the waterway shuts down, not an impact on local community.
• Impact on tourism
1. Dollars lost by sport fishermen.
• Algoma Steel may shut down about a week after the waterway shuts down.
• Ferries may not be able to visit the outlying communities.
• If lock shuts down, coal, steel, and grain will not be shipped. This will be felt nationally and globally.
Existing mitigation:
• Alternate transportation modes are being pursued.
New mitigation:
• None, risks are acceptable.
Environmental Impacts
Consider sensitivities in area, including wetlands, endangered species
• This is a pristine area - unspoiled and undeveloped.
• Specific areas are defined:
1. Waiska Bay
2. Whitefish Bay
3. Upper Sugar Island
4. Mud Lake
5. Bei de Waisai
• Big area for birds, nesting
• Wakes in ice can shear off wetland areas.
No existing mitigation discussed.
New mitigation:
• Provide more info on life in the environment. EAIS could provide information on water level, temperature, and other environmental sensors.
• VTIS could provide information to the vessels.
• VTS could control the vessel traffic.
Continued Next Page
19
Port Risk Assessment Sault Ste. Marie, MI
20
RISK FACTORS RISKS MITIGATIONS Long-term Consequences (Continued)
Environmental Impacts (Continued)
• Contaminates for dredging are low enough that can open water dump dredge spoils.
• High speed wakes erode the beaches.
• Recreation boats add to the pollution.
Consider an education and marketing effort to inform and enforce pollution rules for the recreation boaters.
Health and Safety Impacts
Affects of marine casualty on people ashore
• Soo area is a population center in this area (around 100,000 people).
• Water supply comes from the river – off Big Point; Canadian is above Gros Cap.
Existing mitigation:
• Conduct a “No Spill” exercise. Exercise area contingency plans. US and Canadians working closely together. Make a more effective response.
• Ships conduct emergency preparedness drills.
• Push all tanker traffic to the Poe Lock.
• Hold all other vessels when tanker is moving in the locks.
• There are regulations on venting of gasoline tanks in the locks area.
• Have enough boom to cover clear across the river. All major plants have at least 400 feet of boom.
• Nearest OSRO is at Detroit. Mackinaw environmental is available.
• Vessels must participate in eastern Canada pollution response organization. A list of people to help response.
• Ships must keep a vessel response plan.
• Vessels have oil boom on board.
New mitigation:
• None, risk level is acceptable.
• Consider exercising an evacuation plan.