Embed Size (px)
Citation preview
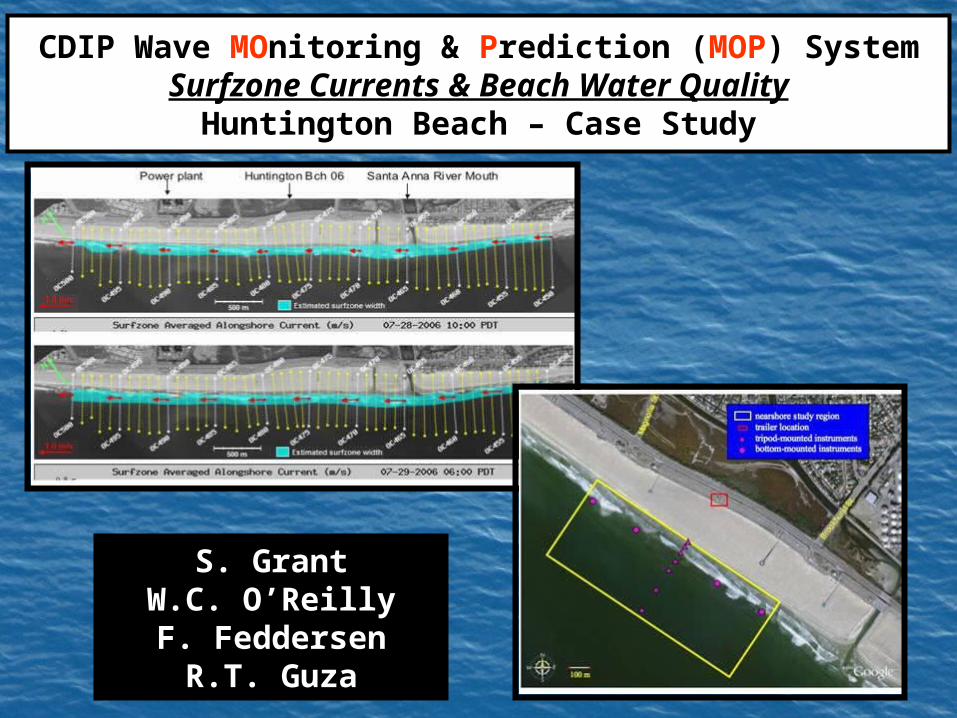
S. GrantS. GrantW.C. O’ReillyW.C. O’ReillyF. FeddersenF. Feddersen
R.T. GuzaR.T. Guza
CDIP Wave MOnitoring & Prediction (MOP) SystemSurfzone Currents & Beach Water Quality
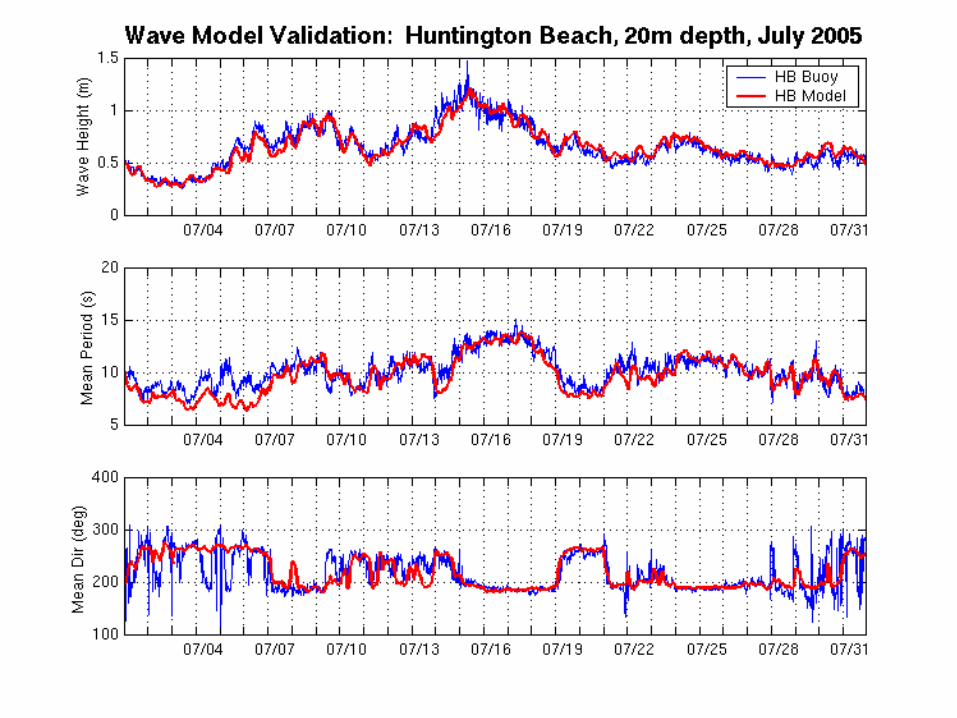
Huntington Beach – Case Study
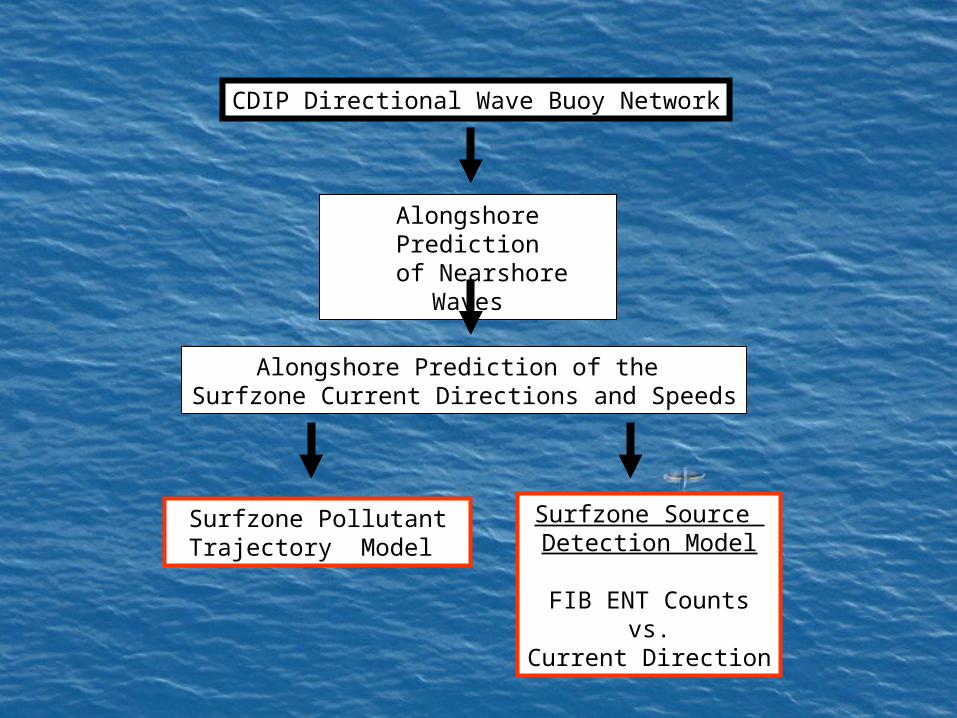
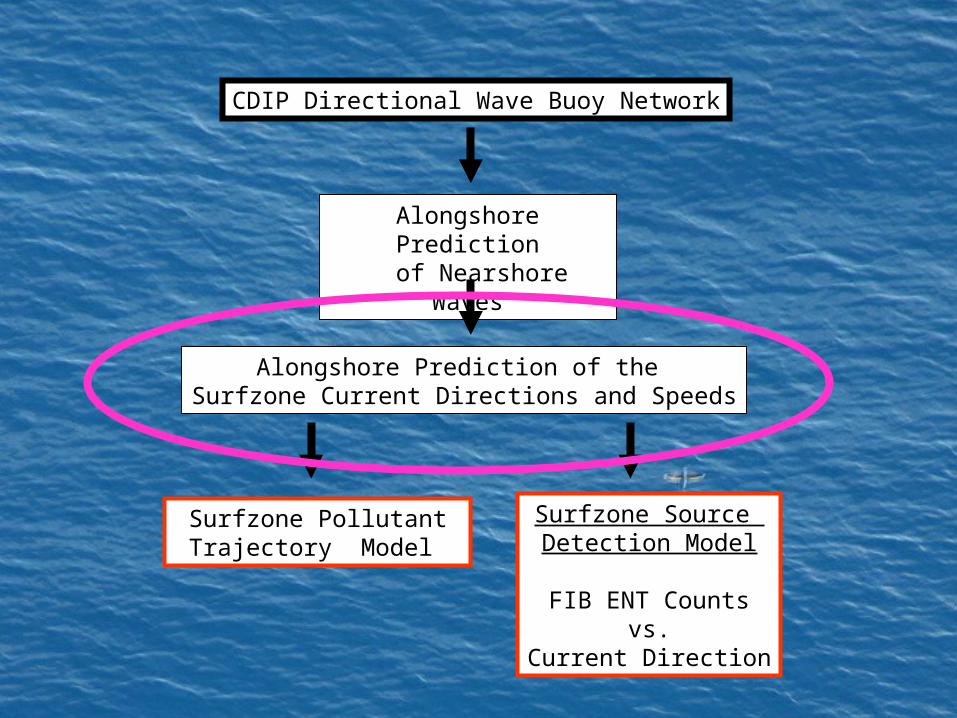
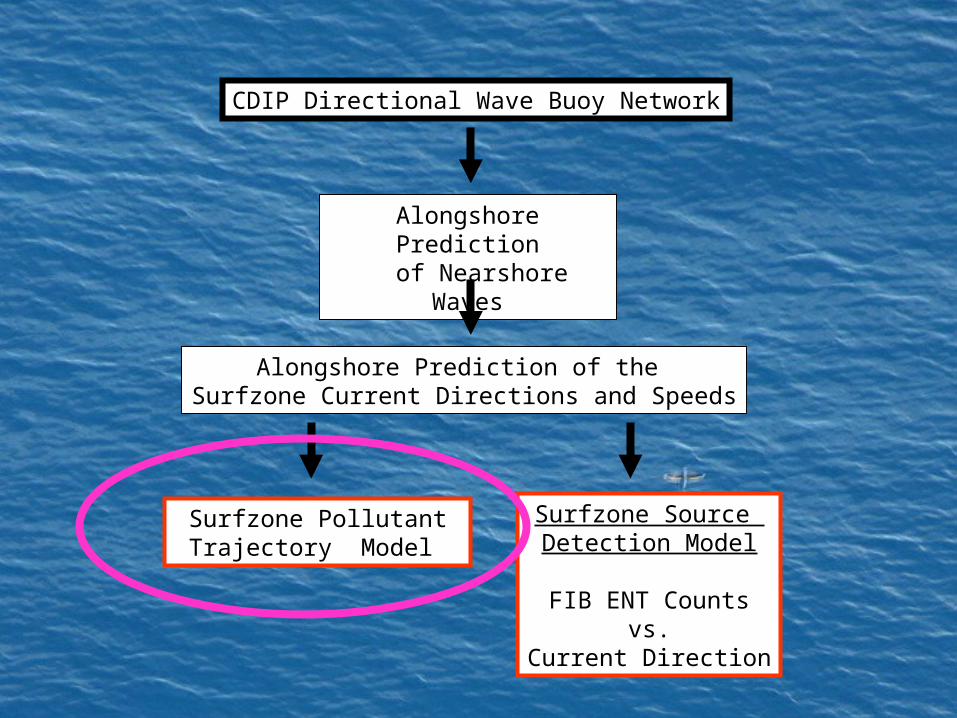
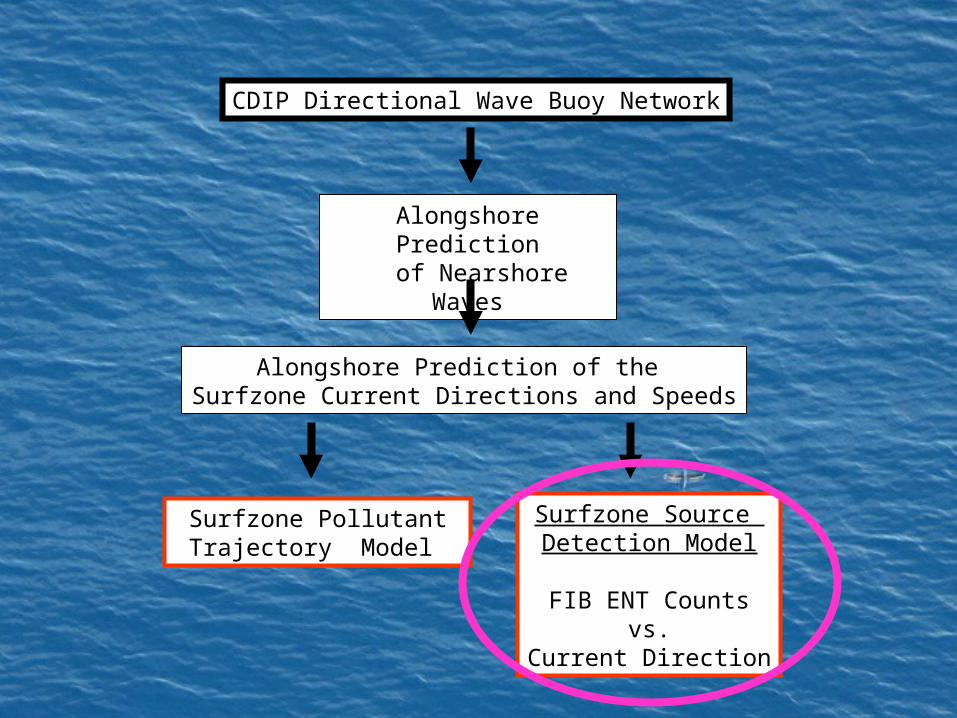
CDIP Directional Wave Buoy Network
Alongshore Prediction of Nearshore Waves
Alongshore Prediction of the Surfzone Current Directions and Speeds
Surfzone Pollutant Trajectory Model
Surfzone Source Detection Model
FIB ENT Countsvs.
Current Direction
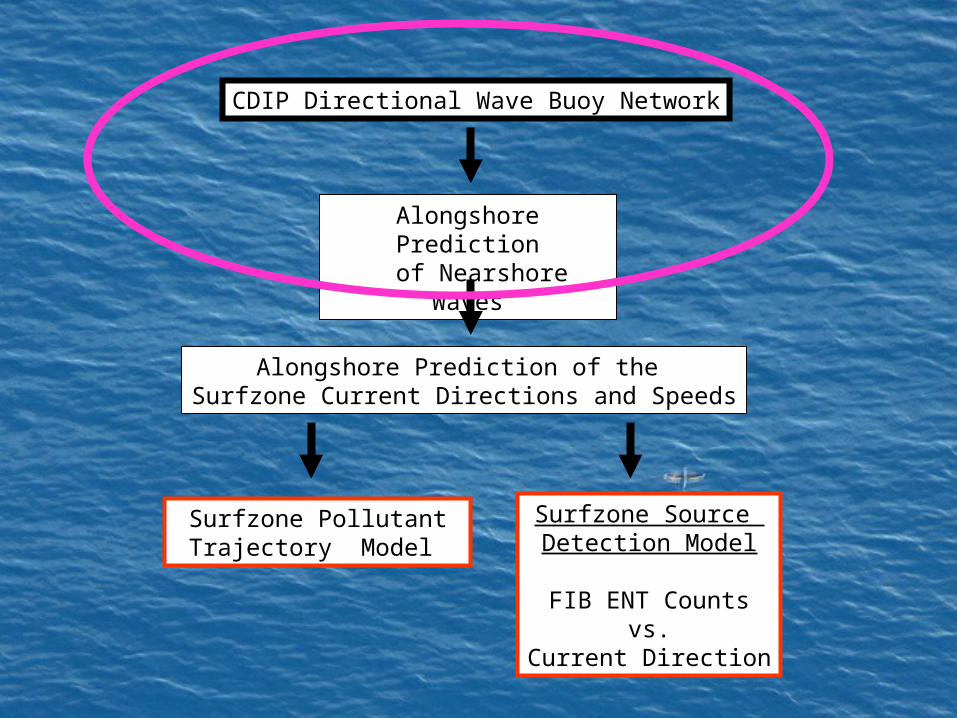
CDIP Directional Wave Buoy Network
Alongshore Prediction of Nearshore Waves
Alongshore Prediction of the Surfzone Current Directions and Speeds
Surfzone Pollutant Trajectory Model
Surfzone Source Detection Model
FIB ENT Countsvs.
Current Direction
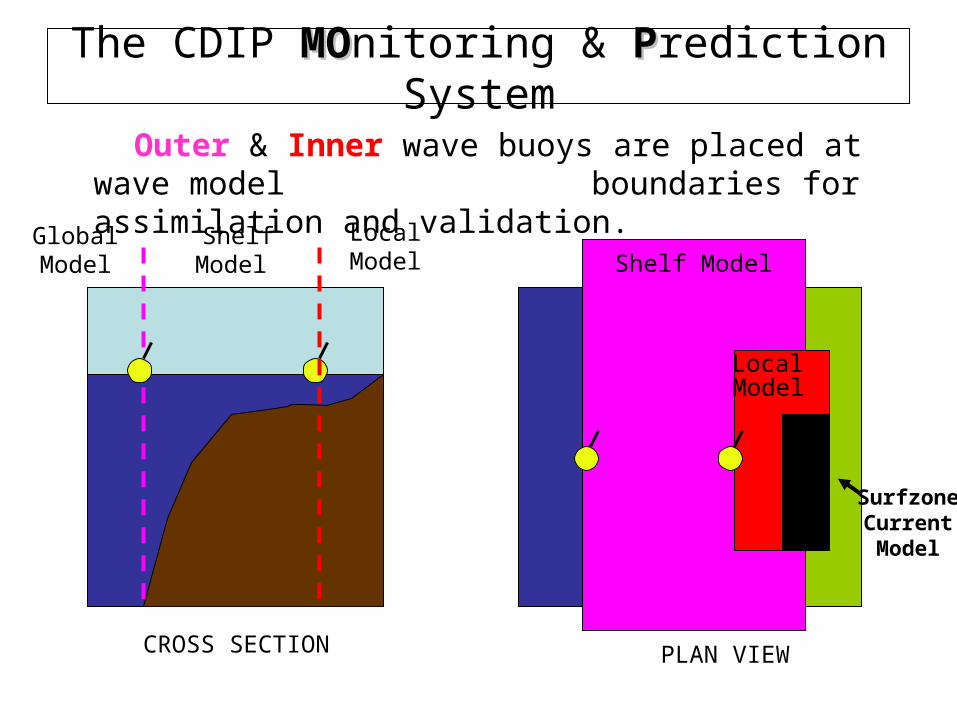
The CDIP MOMOnitoring & PPrediction System
Outer & Inner wave buoys are placed at wave model boundaries for assimilation and validation.
PLAN VIEW
ShelfBreak
GlobalModel
Shelf Model
LocalModel Shelf Model
CROSS SECTION
LocalModel
SurfzoneCurrentModel
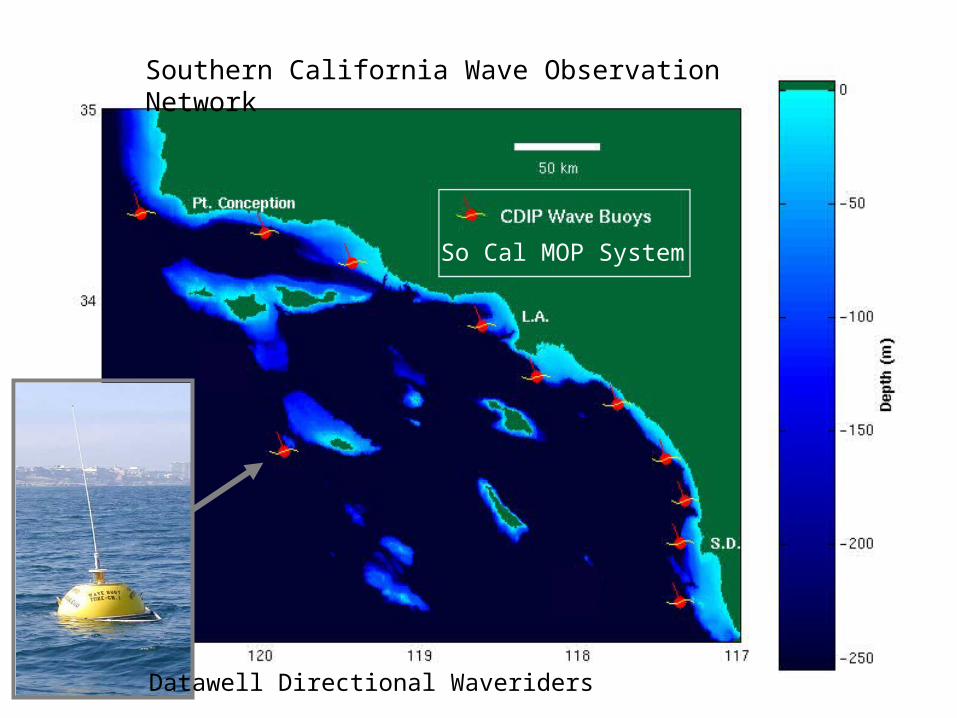
Southern California Wave Observation Network
So Cal MOP System
Datawell Directional Waveriders
Southern California Wave Observation Network
So Cal MOP System
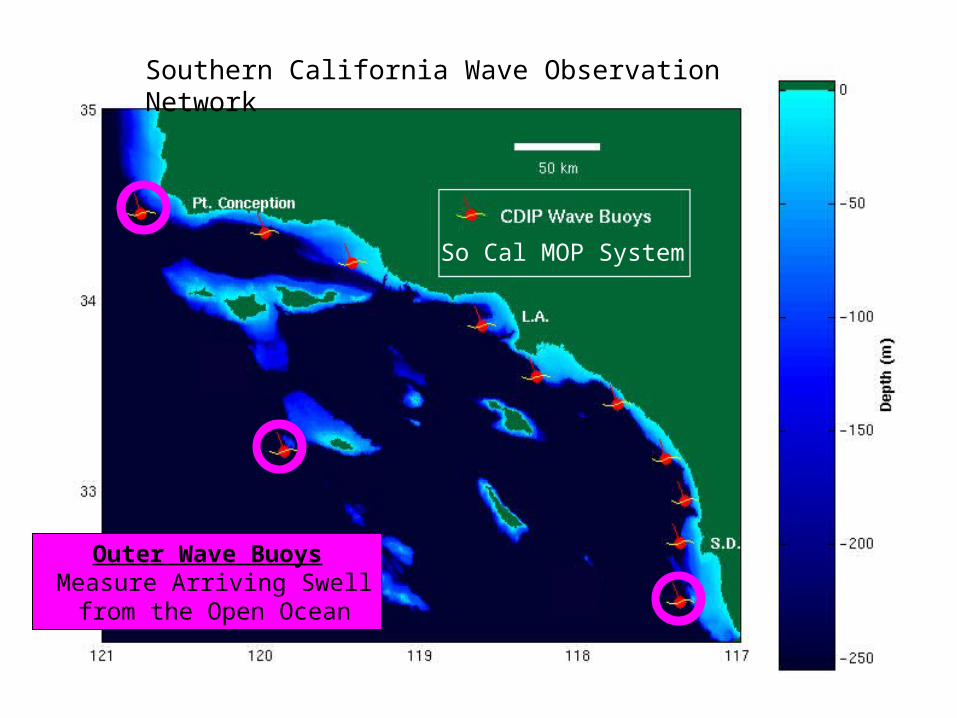
Outer Wave Buoys Measure Arriving Swell from the Open Ocean
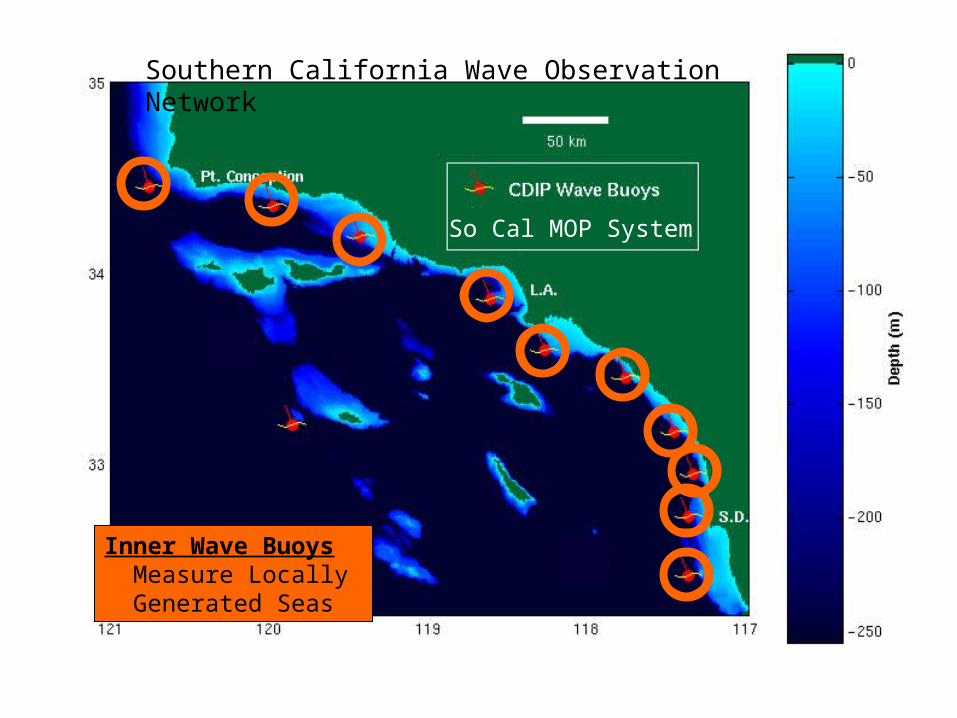
Southern California Wave Observation Network
So Cal MOP System
Inner Wave Buoys Measure Locally Generated Seas
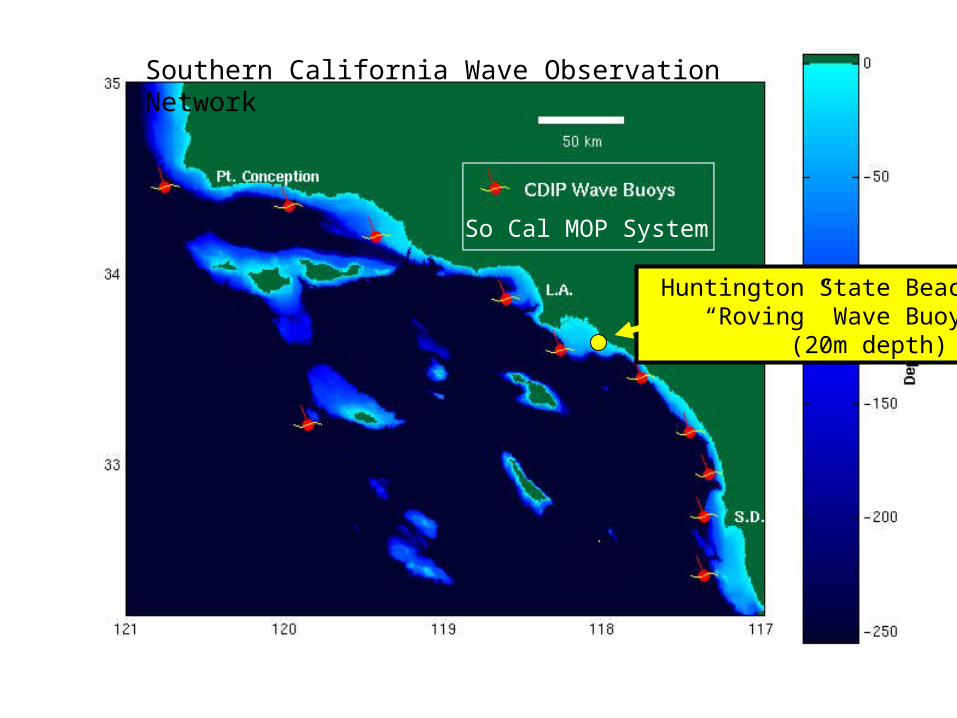
Southern California Wave Observation Network
So Cal MOP System
Huntington State Beach “Roving” Wave Buoy (20m depth)
CDIP Directional Wave Buoy Network
Alongshore Prediction of Nearshore Waves
Alongshore Prediction of the Surfzone Current Directions and Speeds
Surfzone Pollutant Trajectory Model
Surfzone Source Detection Model
FIB ENT Countsvs.
Current Direction
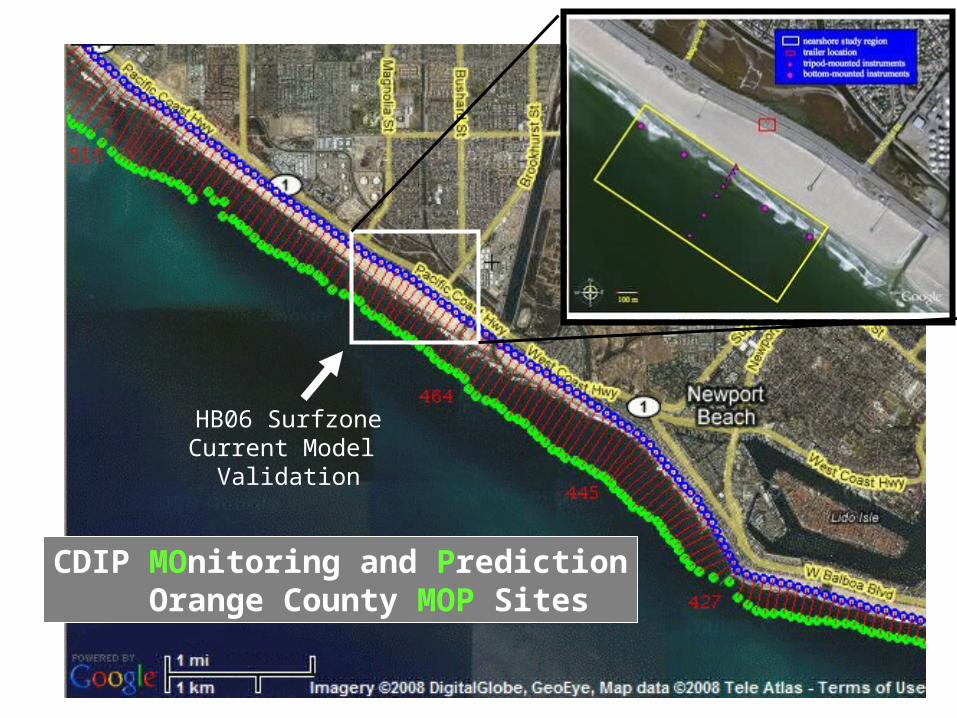
CDIP MOnitoring and Prediction Orange County MOP Sites
HB06 SurfzoneCurrent Model
Validation
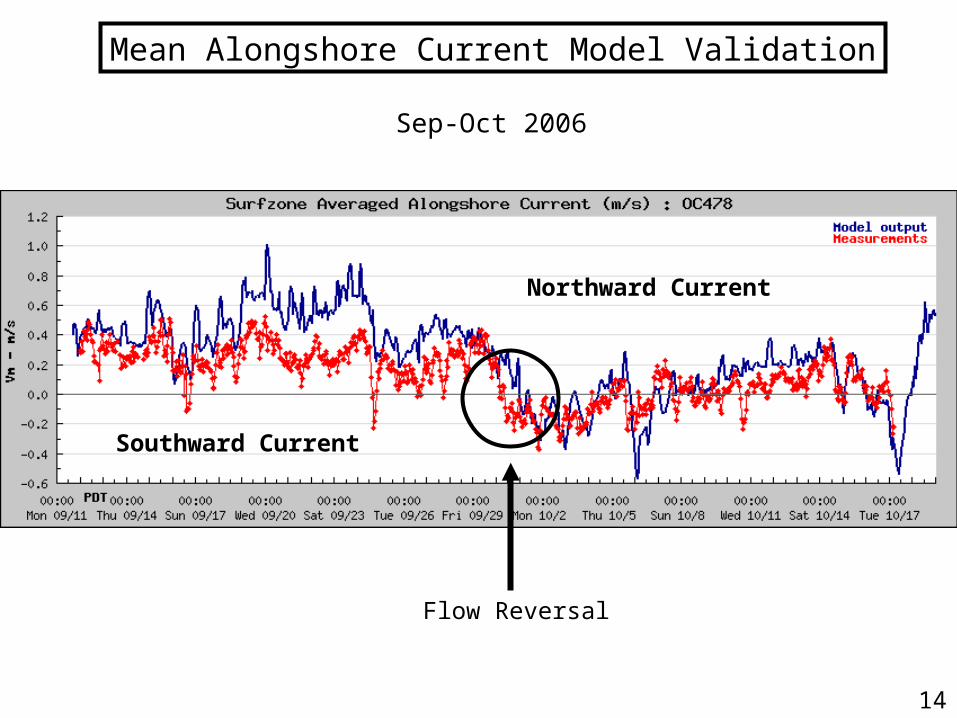
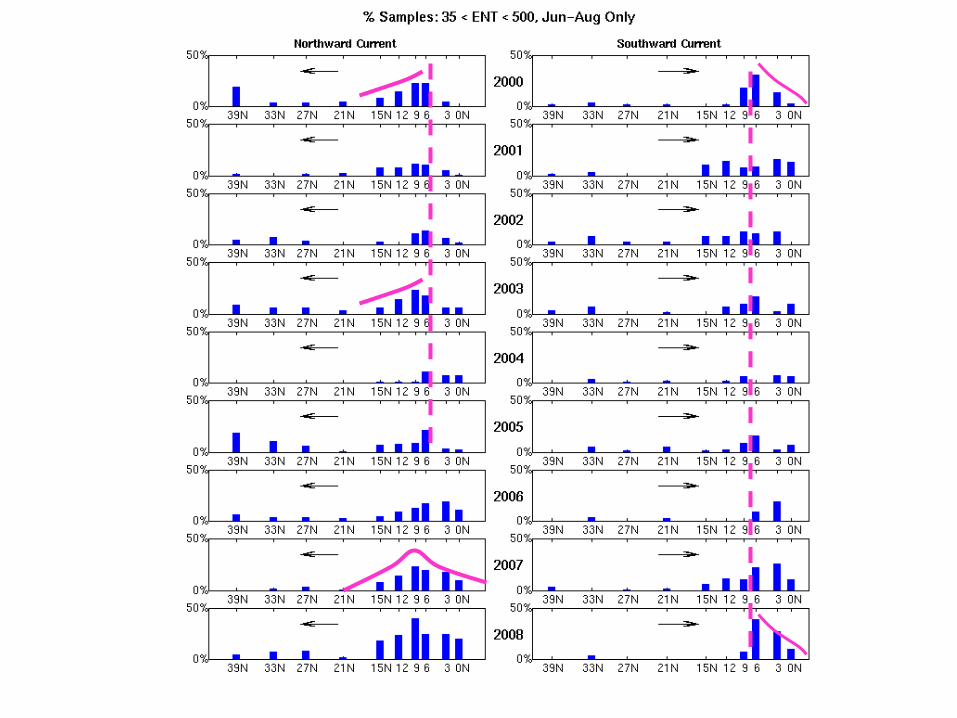
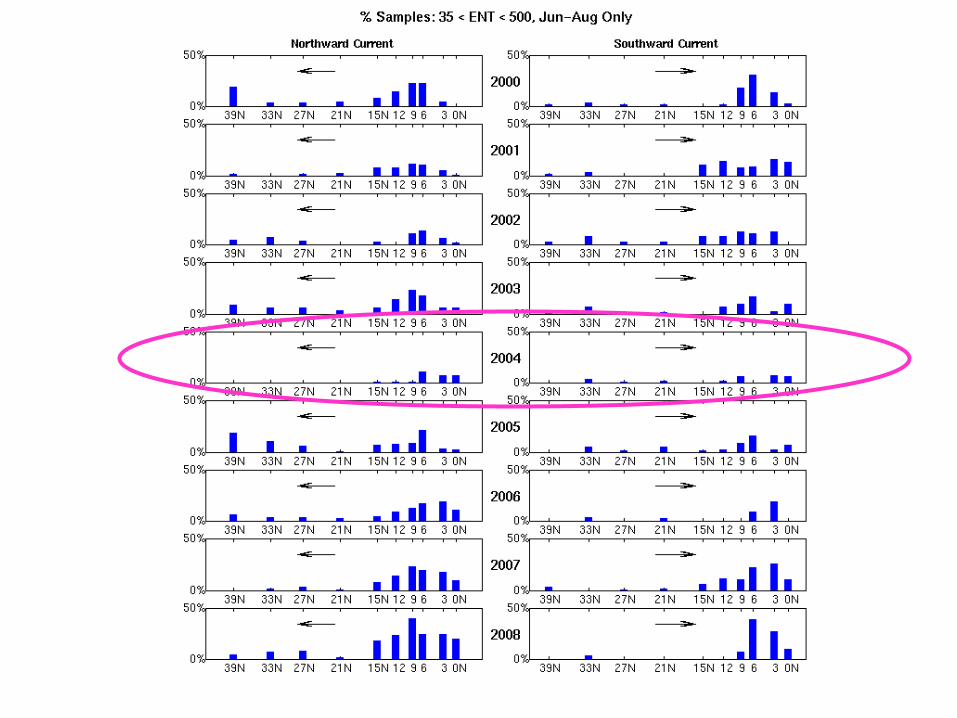
Mean Alongshore Current Model Validation
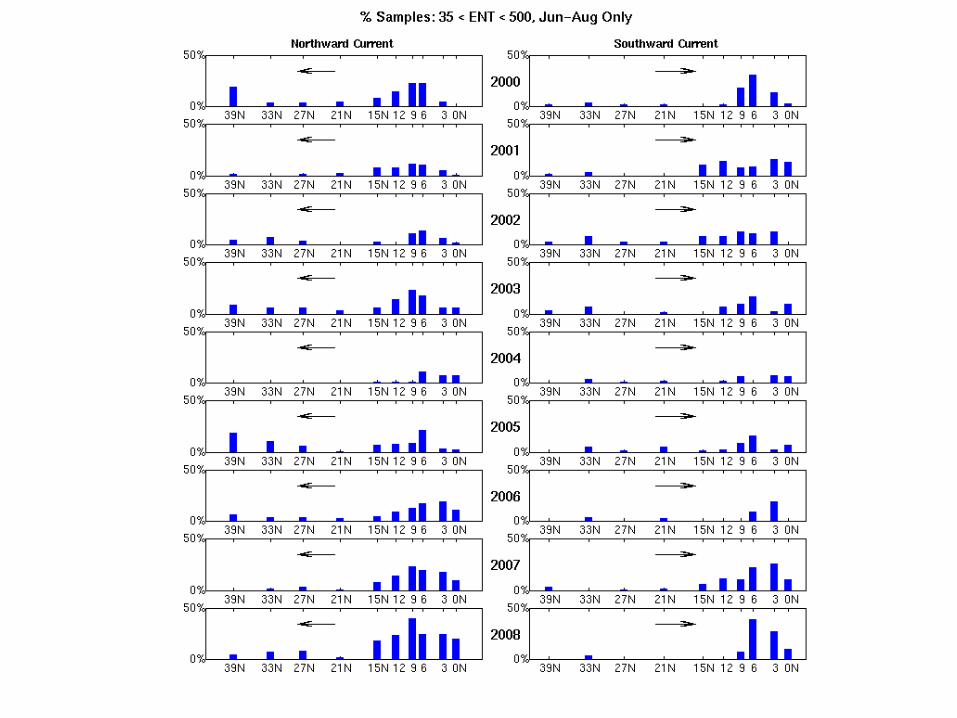
Northward Current
Southward Current
Flow Reversal
Sep-Oct 2006
14
CDIP Directional Wave Buoy Network
Alongshore Prediction of Nearshore Waves
Alongshore Prediction of the Surfzone Current Directions and Speeds
Surfzone Pollutant Trajectory Model
Surfzone Source Detection Model
FIB ENT Countsvs.
Current Direction
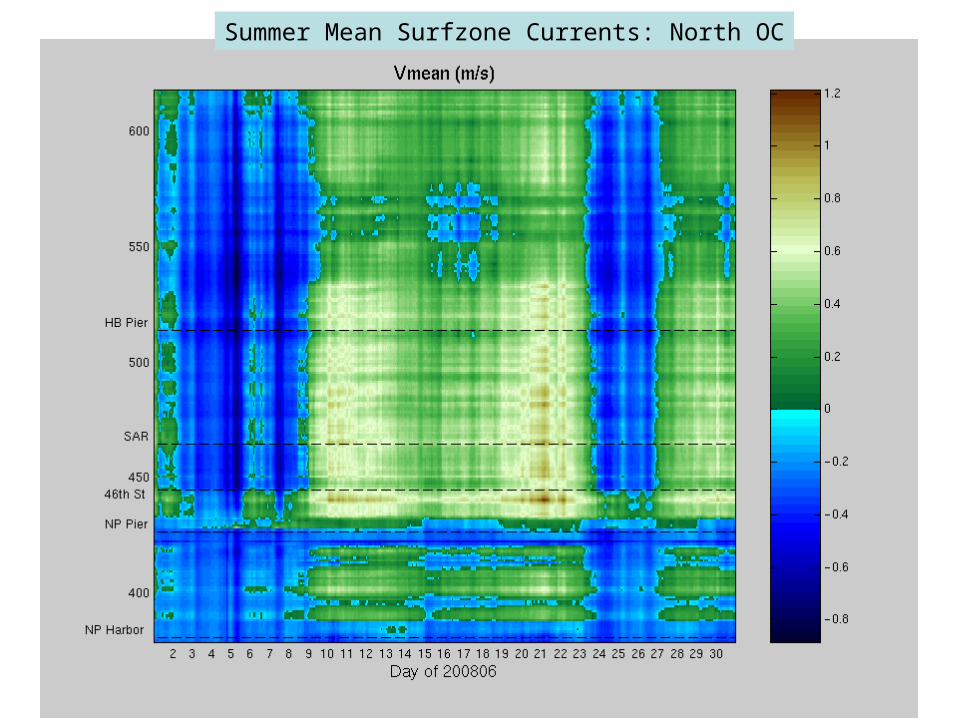
Summer Mean Surfzone Currents: North OC
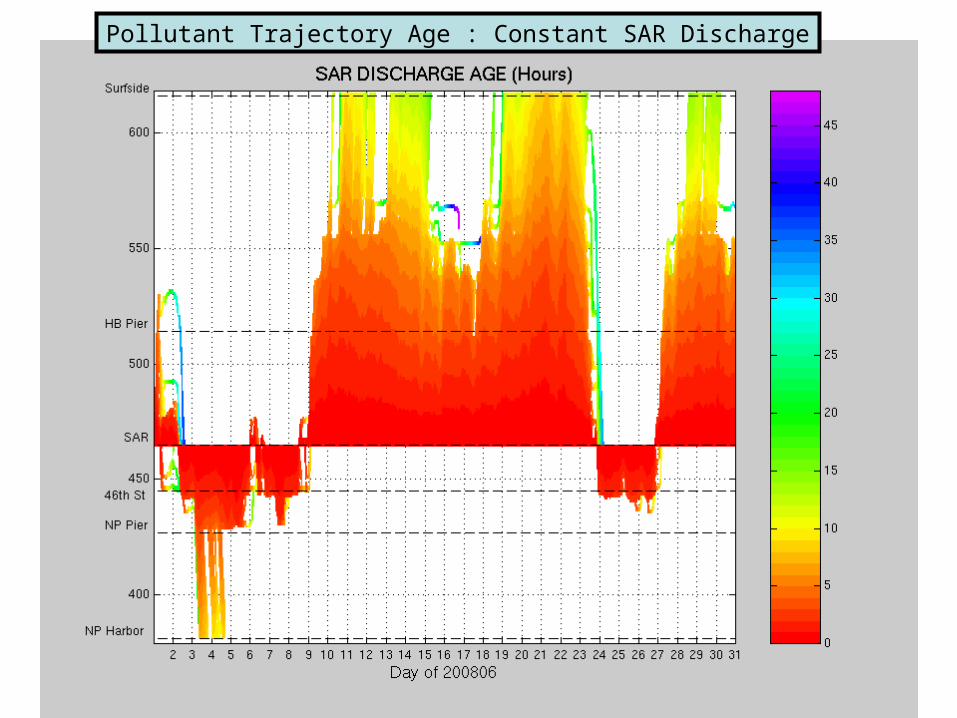
Pollutant Trajectory Age : Constant SAR Discharge
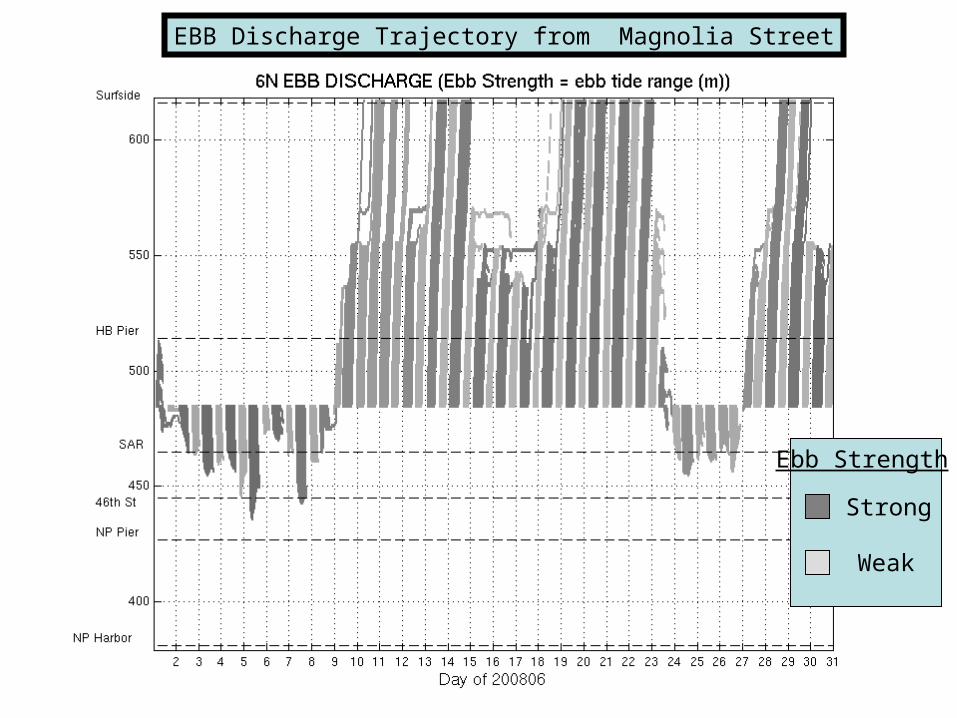
EBB Discharge Trajectory from Magnolia Street
Ebb Strength
Strong
Weak
CDIP Directional Wave Buoy Network
Alongshore Prediction of Nearshore Waves
Alongshore Prediction of the Surfzone Current Directions and Speeds
Surfzone Pollutant Trajectory Model
Surfzone Source Detection Model
FIB ENT Countsvs.
Current Direction
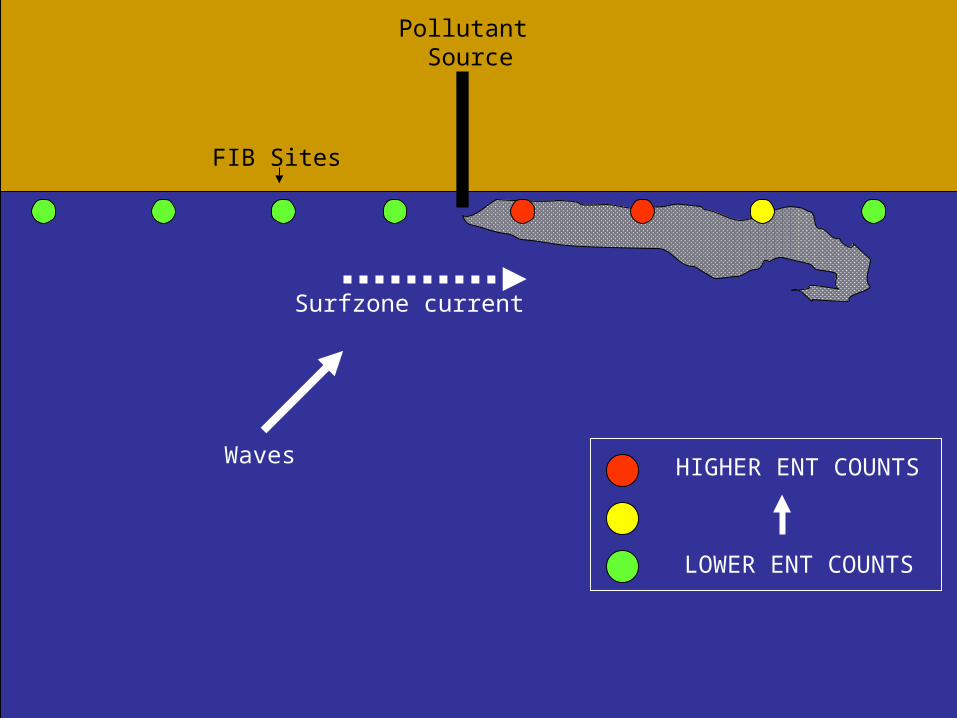
Waves
Surfzone current
FIB Sites
Pollutant Source
LOWER ENT COUNTS
HIGHER ENT COUNTS
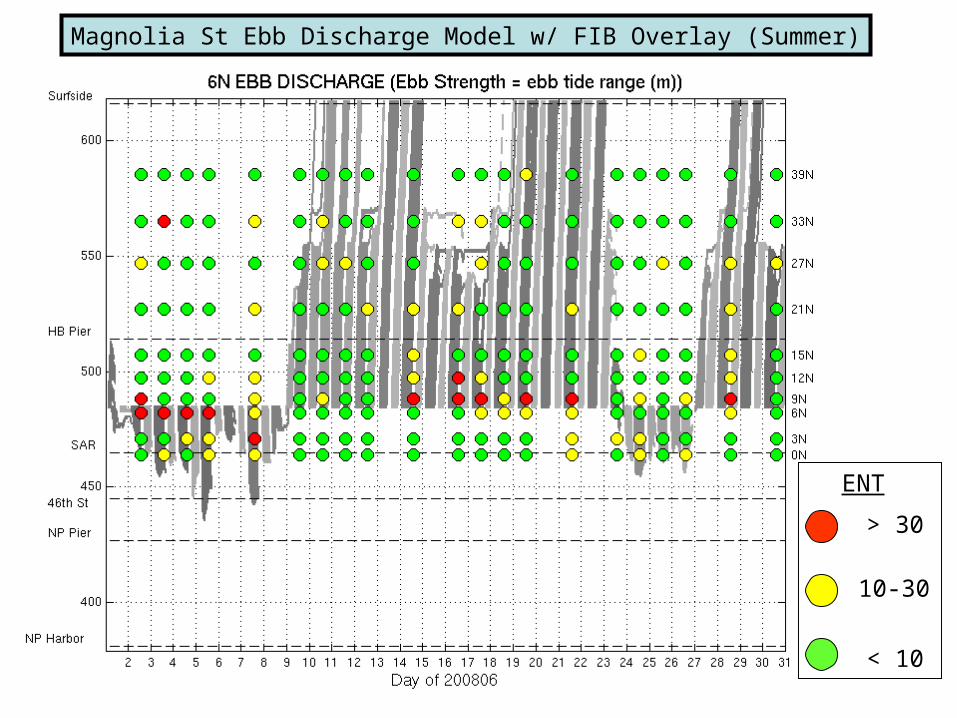
Magnolia St Ebb Discharge Model w/ FIB Overlay (Summer)
ENT
< 10
10-30
> 30
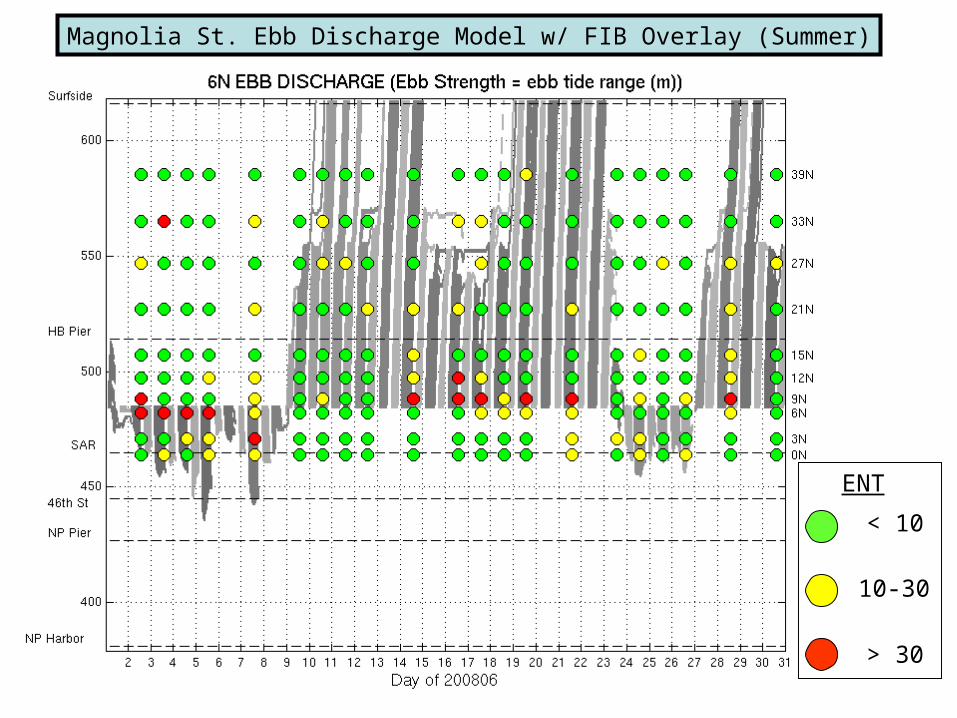
Magnolia St. Ebb Discharge Model w/ FIB Overlay (Summer)
ENT
< 10
10-30
> 30