Embed Size (px)
Citation preview
1
Russia Economic Report No. 36 I November 2016
The Russian Economy Inches Forward: Will that suffice to turn
the tide?
2
Table of Contents
List of Acronyms and Abbreviations .................................................................................................................... 5
Executive Summary ............................................................................................................................................. 6
Part 1. Recent Economic Developments (2015 – 2016)....................................................................... 12
1.1 Growth: The recession continued in Russia, albeit the pace of GDP decline has slowed down ............ 12
1.2 Balance of Payments: Capital outflows subsided due to lower debt repayments and increased
confidence in the ruble ................................................................................................................................. 14
1.3 Labor Market & Poverty Trends: Unemployment remains low and poverty rates have decreased
slightly ........................................................................................................................................................... 17
1.4 Monetary Policy: Monetary easing took a measured approach ............................................................. 19
1.5 The Financial Sector: More stable but still vulnerable to macroeconomic risks .................................... 21
1.6 Government Budget: Fiscal consolidation is planned to 2017 and beyond ........................................... 22
Part 2. The Outlook Over Three Years .................................................................................................... 27
2.1 Growth & Poverty Outlook: Russia expected to inch towards growth with a slight decrease in the
poverty rate ................................................................................................................................................... 27
Part 3. Distributional Impact of Fiscal Policy over the Boom and Downturn ................................. 31
3.1 Fiscal redistribution mainly takes place through pensions ..................................................................... 32
3.2 Government spending has been the main driver of incomes ................................................................. 34
3.3 Potential for fiscal policy to reduce poverty and inequality ................................................................... 36
References ......................................................................................................................................................... 38
List of Tables
Table 1: The projected federal budget deficit for 2016 is higher than in 2015 (% of GDP) ................................ 8
Table 2: Return to a medium-term fiscal framework can decrease the fiscal deficit over time (percent of
GDP) .................................................................................................................................................................... 8
Table 3: Balance of payments, 2012–2016 (US$ billions) ................................................................................. 15
Table 4: Net Capital Flows, 2012–2016 (US$ billions) .......................................... Error! Bookmark not defined.
Table 5: The poverty rate stopped growing, but remains elevated .................................................................. 19
Table 6: The projected federal budget deficit for 2016 is higher than in 2015 (percent of GDP) .................... 24
Table 7: Federal budget deficit expected to decrease over time (percent of GDP) ......................................... 26
Table 8: Main macroeconomic indicators in the medium-term perspective. .................................................. 30
Table 9: Pensions are responsible for most of the redistributive fiscal policy ................................................. 32
List of Figures
Figure 1: Global growth continued to slow down in 2016 .................................................................................. 6
Figure 2: The pace of the Russian recession slowed down (GDP growth y-o-y, percent) .................................. 6
3
Figure 3: Unemployment is at near minimum levels (percent) .......................................................................... 7
Figure 4: Inflation slowed down (CPI index and its components, percent, y-o-y) .............................................. 7
Figure 5: The poverty headcount is likely to decline in 2016 (percent) .............................................................. 9
Figure 6: With similar budget size, other countries achieve a higher reduction in inequality ......................... 10
Figure 7: The economy is expected to inch towards growth in 2017 and 2018 (real GDP growth, percent) ... 10
Figure 8: Global growth continued to slow down (year-on-year GDP growth) ................................................ 12
Figure 9: Sovereign bond spread narrowed (median bond spreads for emerging markets) ............................ 12
Figure 10: Household consumption put the largest negative drag on GDP growth (year-on-year growth
composition, percent) ....................................................................................................................................... 14
Figure 11: Contribution of tradable sectors to growth turned zero, while contraction in non-tradable sectors
decelerated substantially (year-on-year growth composition, percent) .......................................................... 14
Figure 12: Financial and real estate sectors reported recovery (year-on-year growth, percent) .................... 14
Figure 13: Decline in imports in the first half of 2016 was much less severe than in 2015 due to less REER
depreciation and better demand dynamics ...................................................................................................... 16
Figure 14: Improvement in services, investment income, and labor income accounts deficits could not
compensate for the worsening trade balance (percent of GDP) ..................................................................... 16
Figure 15: Russia’s external debt decreased, US$ billion adjusted for the forex revaluation) ......................... 17
Figure 16: Russia’s 5-year CDS spread was lowered and became less volatile ................................................. 17
Figure 17: Labor force participation (LFP) employment rates increased slightly (percent) ............................. 18
Figure 18: Real wage growth was close to zero in all sectors ........................................................................... 19
Figure 19: Real incomes continue to decline, driven by non-wage sources ..................................................... 19
Figure 20: The share of vulnerable population with per capita incomes below 10 USD/day in 2005 PPPs
increased for the first time since 2009 (percent).............................................................................................. 19
Figure 21: The Central Bank cut the key policy rate by 50 basis points in June and September 2016 ............. 20
Figure 22: Monetization of the economy increased ........................................................................................ 20
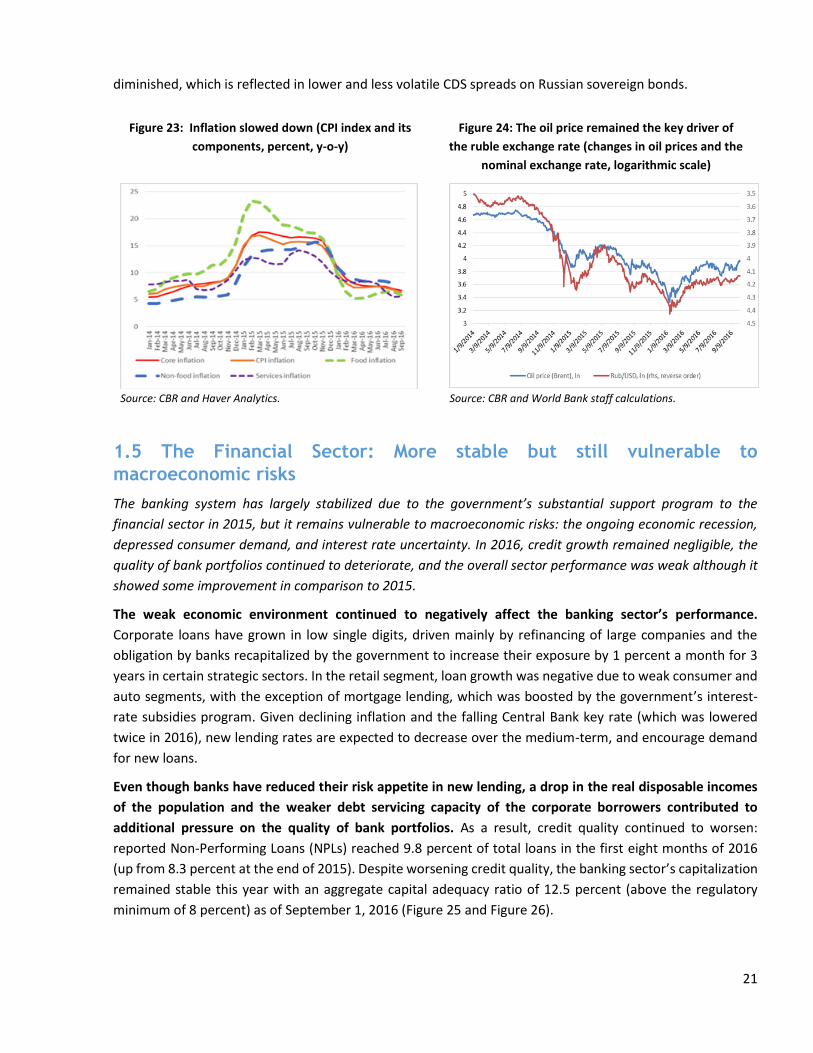
Figure 23: Inflation slowed down (CPI index and its components, percent, y-o-y) ......................................... 21
Figure 24: The oil price remained the key driver of the ruble exchange rate (changes in oil prices and the
nominal exchange rate, logarithmic scale) ....................................................................................................... 21
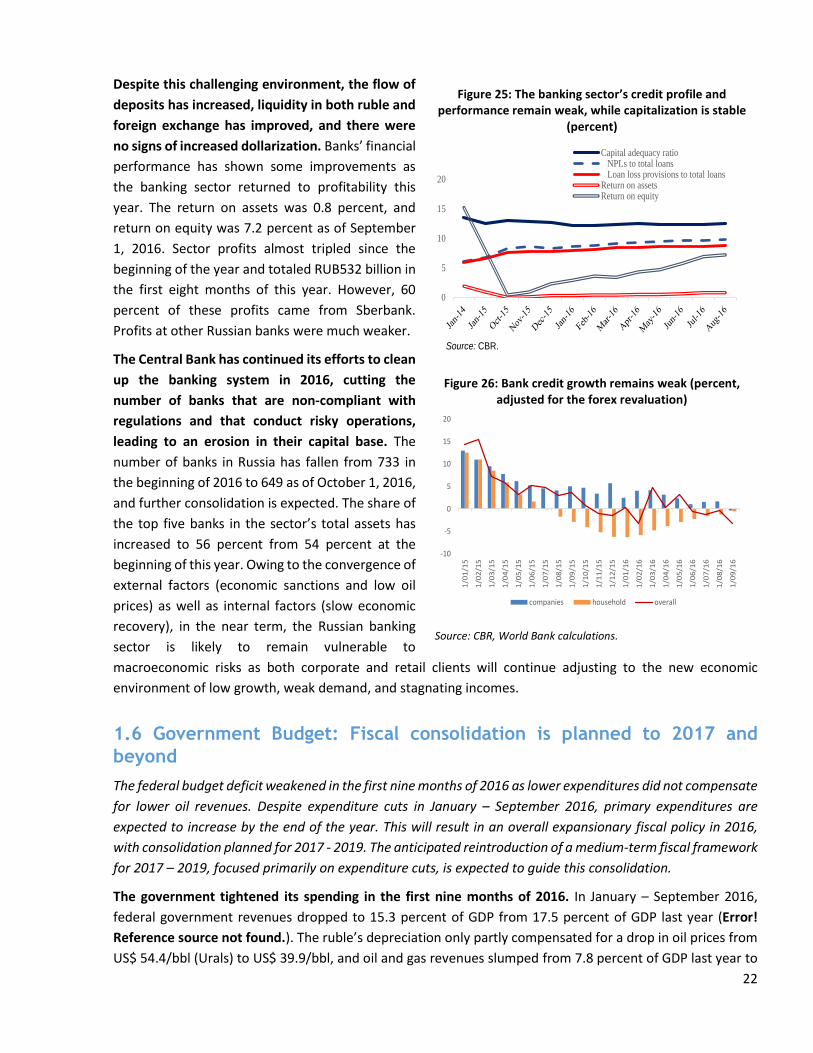
Figure 25: The banking sector’s credit profile and performance remain weak, while capitalization is stable
(percent) ............................................................................................................................................................ 22
Figure 26: Bank credit growth remains weak (percent, adjusted for the forex revaluation) ........................... 22
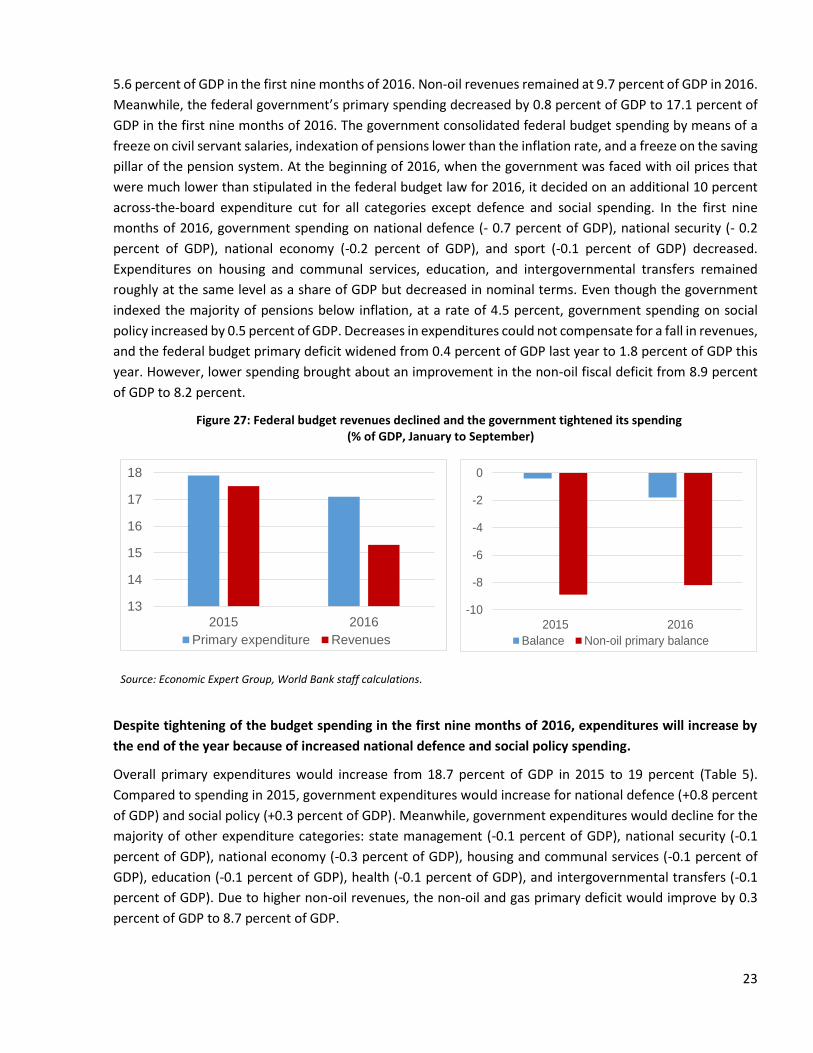
Figure 27: Federal budget revenues declined and the government tightened its spending ............................ 23
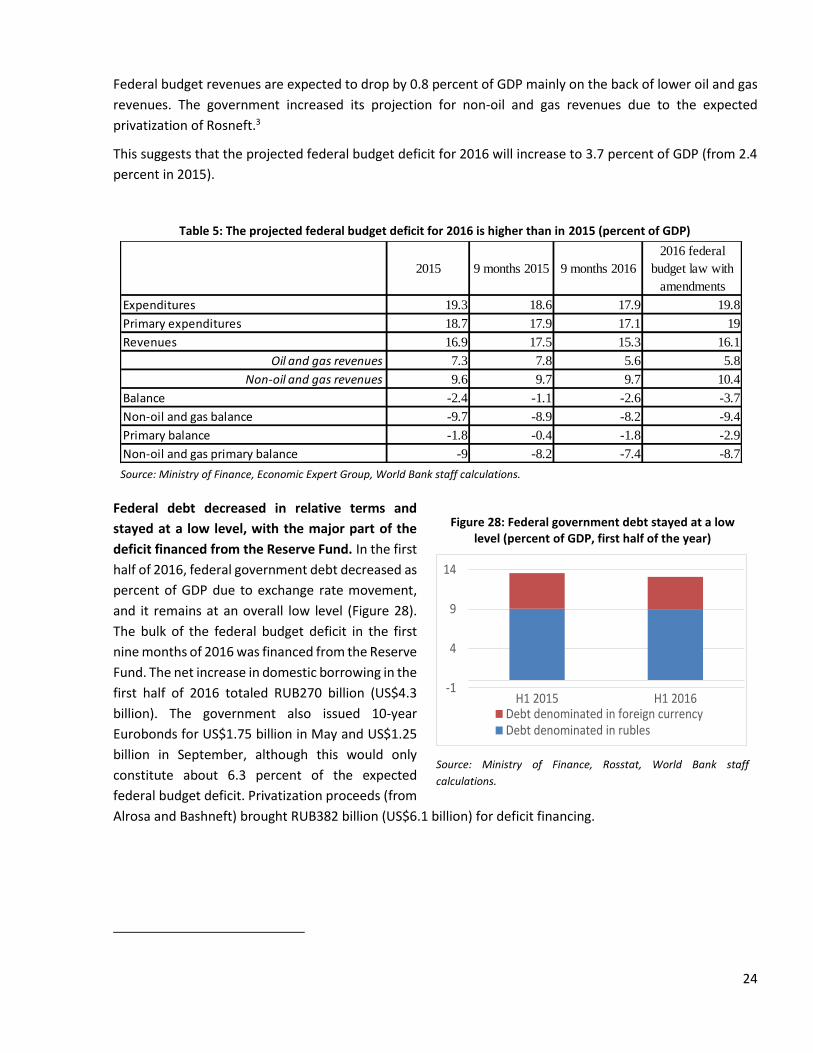
Figure 28: Federal government debt stayed at a low level (percent of GDP, first half of the year) ................. 24
Figure 29: Regional government primary expenditures as well as revenues remained at similar levels as last
year (percent of GDP, January to August) ......................................................................................................... 25
Figure 30: Fiscal buffers are expected to decrease substantially by the end of 2019, increasing fiscal
sustainability risks (percent of GDP, e-o-p) ....................................................................................................... 26
Figure 31: Government debt is expected to increase (percent of GDP, e-o-p) ................................................ 26
Figure 32: Growth of output sold domestically outperformed growth in domestic demand (percent growth,
y-o-y) ................................................................................................................................................................. 28
Figure 33: Number of sectors within manufacturing demonstrating growth is limited (annual growth,
percent, y-o-y) ................................................................................................................................................... 28
Figure 34: Growth recovers in 2017 and 2018 .................................................................................................. 28
Figure 35: The poverty headcount is likely to decline (percent) ....................................................................... 31
Figure 36: The tax system does not reduce inequality; this is achieved through government transfers
(pensions) .......................................................................................................................................................... 33
4
Figure 37: The population in the bottom 60 percent of the income distribution are net beneficiaries of the
budget ............................................................................................................................................................... 33
Figure 38: Income growth was driven primarily by labor income up to the crisis, with fiscal transfers playing
a more critical role after .................................................................................................................................... 35
Figure 39: Share of total income coming from the government budget was important for all, and has
increased in significance for the better-off population over time .................................................................... 35
Figure 40: Redistribution in Russia is moderate compared to other countries ................................................ 37
Figure 41: Other countries achieve a higher reduction in inequality with a similar budget size...................... 37
5
List of Acronyms and Abbreviations
AE Advanced Economies
Bbl oil barrel
Bps Basis points
CBR Central Bank of Russia
CDS Credit-Default Swap
CPI Consumer Price Index
EMDE Emerging Market and Developing Economies
EU European Union
GDP Gross Domestic Product
LFP Labor Force Participation
Mbd Million barrels per day
M2 Money Supply
NPL Non-Performing Loan
OECD Organization for Economic Cooperation and Development
OPEC Organization of the Petroleum Exporting Countries
PPP Purchasing Power Parity
REER Real Effective Exchange Rate
VAT Value-Added Tax
WTI West Texas Intermediate
y-o-y Year-on-year
6
Executive Summary
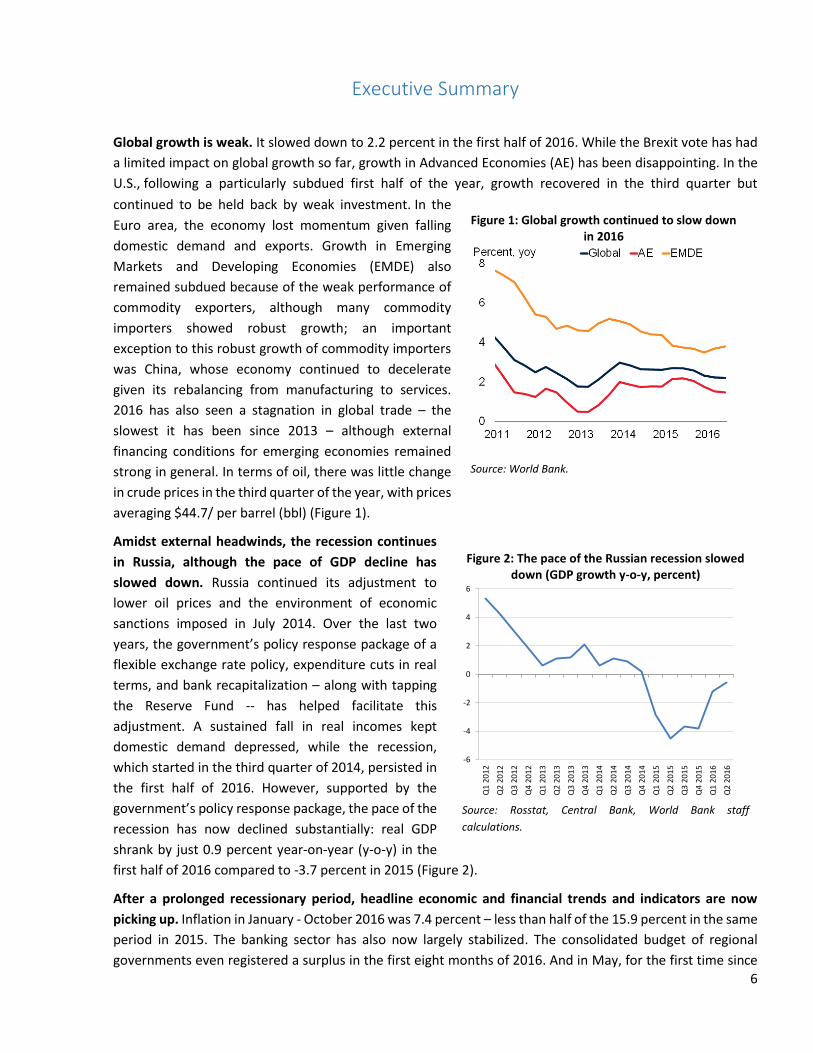
Global growth is weak. It slowed down to 2.2 percent in the first half of 2016. While the Brexit vote has had
a limited impact on global growth so far, growth in Advanced Economies (AE) has been disappointing. In the
U.S., following a particularly subdued first half of the year, growth recovered in the third quarter but
continued to be held back by weak investment. In the
Euro area, the economy lost momentum given falling
domestic demand and exports. Growth in Emerging
Markets and Developing Economies (EMDE) also
remained subdued because of the weak performance of
commodity exporters, although many commodity
importers showed robust growth; an important
exception to this robust growth of commodity importers
was China, whose economy continued to decelerate
given its rebalancing from manufacturing to services.
2016 has also seen a stagnation in global trade – the
slowest it has been since 2013 – although external
financing conditions for emerging economies remained
strong in general. In terms of oil, there was little change
in crude prices in the third quarter of the year, with prices
averaging $44.7/ per barrel (bbl) (Figure 1).
Amidst external headwinds, the recession continues
in Russia, although the pace of GDP decline has
slowed down. Russia continued its adjustment to
lower oil prices and the environment of economic
sanctions imposed in July 2014. Over the last two
years, the government’s policy response package of a
flexible exchange rate policy, expenditure cuts in real
terms, and bank recapitalization – along with tapping
the Reserve Fund -- has helped facilitate this
adjustment. A sustained fall in real incomes kept
domestic demand depressed, while the recession,
which started in the third quarter of 2014, persisted in
the first half of 2016. However, supported by the
government’s policy response package, the pace of the
recession has now declined substantially: real GDP
shrank by just 0.9 percent year-on-year (y-o-y) in the
first half of 2016 compared to -3.7 percent in 2015 (Figure 2).
After a prolonged recessionary period, headline economic and financial trends and indicators are now
picking up. Inflation in January - October 2016 was 7.4 percent – less than half of the 15.9 percent in the same
period in 2015. The banking sector has also now largely stabilized. The consolidated budget of regional
governments even registered a surplus in the first eight months of 2016. And in May, for the first time since
Figure 1: Global growth continued to slow down in 2016
Source: World Bank.
Figure 2: The pace of the Russian recession slowed down (GDP growth y-o-y, percent)
Source: Rosstat, Central Bank, World Bank staff
calculations.
-6
-4
-2
0
2
4
6
Q1
20
12
Q2
20
12
Q3
20
12
Q4
20
12
Q1
20
13
Q2
20
13
Q3
20
13
Q4
20
13
Q1
20
14
Q2
20
14
Q3
20
14
Q4
20
14
Q1
20
15
Q2
20
15
Q3
20
15
Q4
20
15
Q1
20
16
Q2
20
16
7
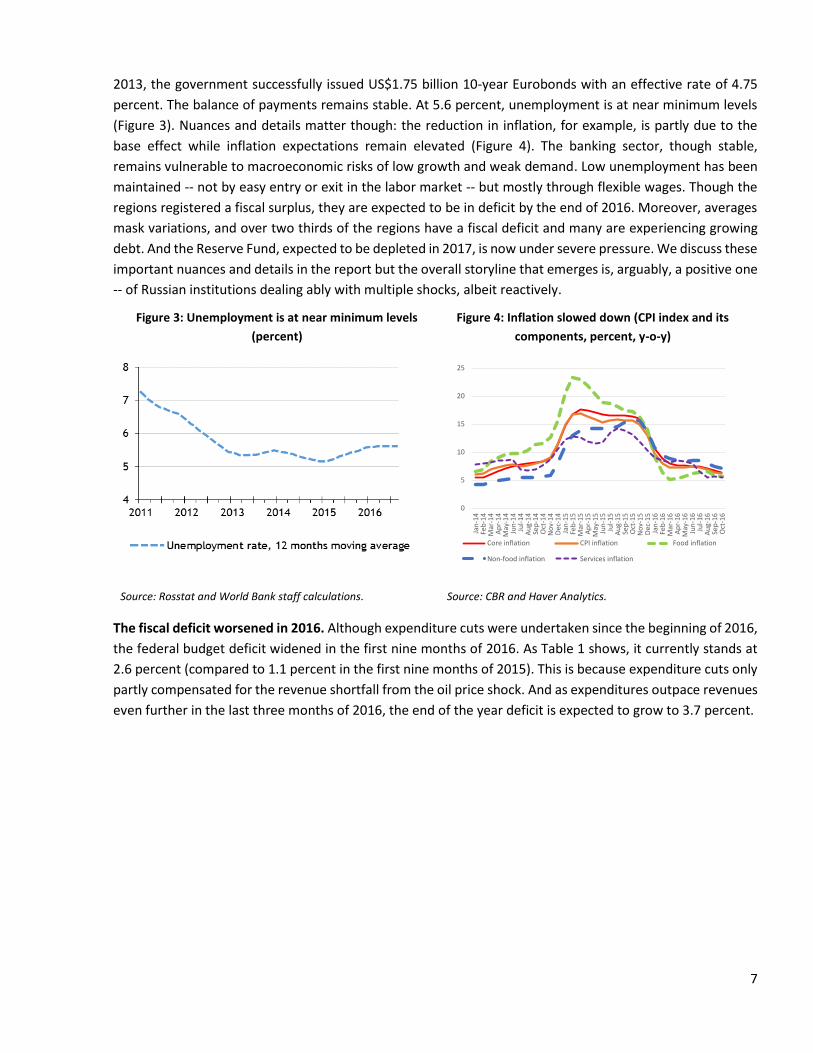
2013, the government successfully issued US$1.75 billion 10-year Eurobonds with an effective rate of 4.75
percent. The balance of payments remains stable. At 5.6 percent, unemployment is at near minimum levels
(Figure 3). Nuances and details matter though: the reduction in inflation, for example, is partly due to the
base effect while inflation expectations remain elevated (Figure 4). The banking sector, though stable,
remains vulnerable to macroeconomic risks of low growth and weak demand. Low unemployment has been
maintained -- not by easy entry or exit in the labor market -- but mostly through flexible wages. Though the
regions registered a fiscal surplus, they are expected to be in deficit by the end of 2016. Moreover, averages
mask variations, and over two thirds of the regions have a fiscal deficit and many are experiencing growing
debt. And the Reserve Fund, expected to be depleted in 2017, is now under severe pressure. We discuss these
important nuances and details in the report but the overall storyline that emerges is, arguably, a positive one
-- of Russian institutions dealing ably with multiple shocks, albeit reactively.
Figure 3: Unemployment is at near minimum levels
(percent)
Figure 4: Inflation slowed down (CPI index and its
components, percent, y-o-y)
Source: Rosstat and World Bank staff calculations. Source: CBR and Haver Analytics.
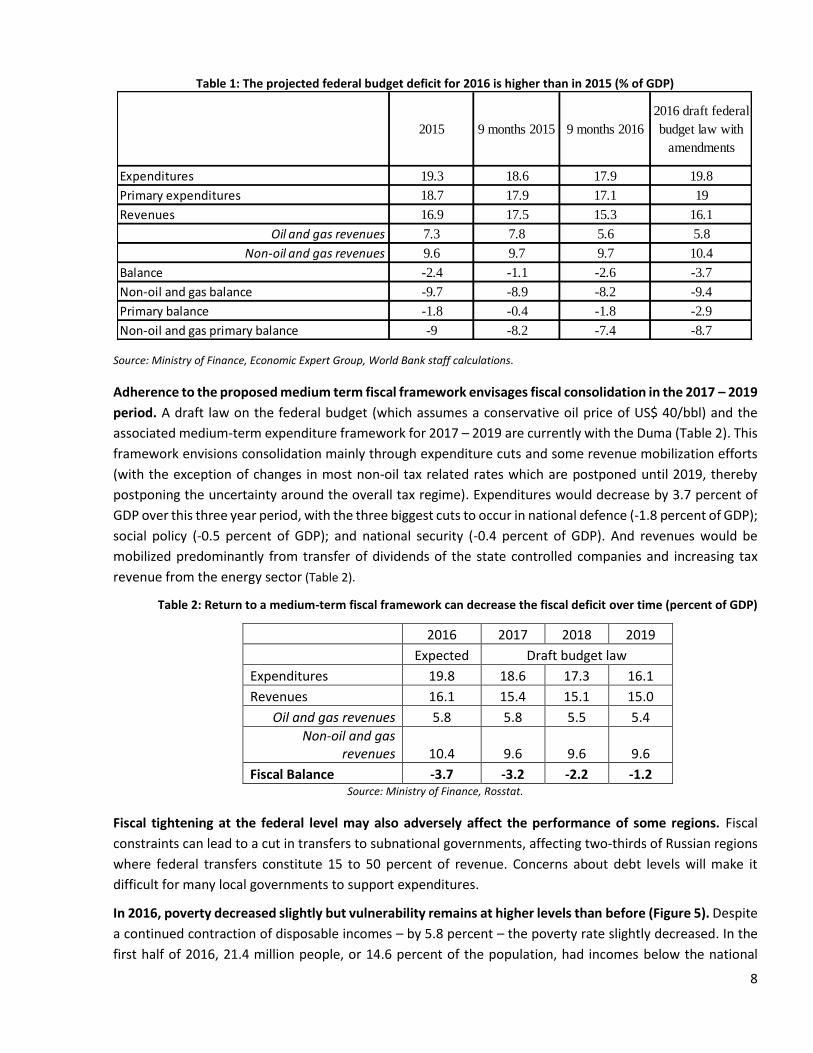
The fiscal deficit worsened in 2016. Although expenditure cuts were undertaken since the beginning of 2016,
the federal budget deficit widened in the first nine months of 2016. As Table 1 shows, it currently stands at
2.6 percent (compared to 1.1 percent in the first nine months of 2015). This is because expenditure cuts only
partly compensated for the revenue shortfall from the oil price shock. And as expenditures outpace revenues
even further in the last three months of 2016, the end of the year deficit is expected to grow to 3.7 percent.
0
5
10
15
20
25
Jan
-14
Feb
-14
Mar
-14
Ap
r-1
4M
ay-1
4Ju
n-1
4Ju
l-1
4A
ug-
14
Sep
-14
Oct
-14
No
v-1
4D
ec-1
4Ja
n-1
5Fe
b-1
5M
ar-1
5A
pr-
15
May
-15
Jun
-15
Jul-
15
Au
g-1
5Se
p-1
5O
ct-1
5N
ov-
15
Dec
-15
Jan
-16
Feb
-16
Mar
-16
Ap
r-1
6M
ay-1
6Ju
n-1
6Ju
l-1
6A
ug-
16
Sep
-16
Oct
-16
Core inflation CPI inflation Food inflation
Non-food inflation Services inflation
8
Table 1: The projected federal budget deficit for 2016 is higher than in 2015 (% of GDP)
Source: Ministry of Finance, Economic Expert Group, World Bank staff calculations.
Adherence to the proposed medium term fiscal framework envisages fiscal consolidation in the 2017 – 2019
period. A draft law on the federal budget (which assumes a conservative oil price of US$ 40/bbl) and the
associated medium-term expenditure framework for 2017 – 2019 are currently with the Duma (Table 2). This
framework envisions consolidation mainly through expenditure cuts and some revenue mobilization efforts
(with the exception of changes in most non-oil tax related rates which are postponed until 2019, thereby
postponing the uncertainty around the overall tax regime). Expenditures would decrease by 3.7 percent of
GDP over this three year period, with the three biggest cuts to occur in national defence (-1.8 percent of GDP);
social policy (-0.5 percent of GDP); and national security (-0.4 percent of GDP). And revenues would be
mobilized predominantly from transfer of dividends of the state controlled companies and increasing tax
revenue from the energy sector (Table 2).
Table 2: Return to a medium-term fiscal framework can decrease the fiscal deficit over time (percent of GDP)
2016 2017 2018 2019
Expected Draft budget law
Expenditures 19.8 18.6 17.3 16.1
Revenues 16.1 15.4 15.1 15.0
Oil and gas revenues 5.8 5.8 5.5 5.4
Non-oil and gas revenues 10.4 9.6 9.6 9.6
Fiscal Balance -3.7 -3.2 -2.2 -1.2 Source: Ministry of Finance, Rosstat.
Fiscal tightening at the federal level may also adversely affect the performance of some regions. Fiscal
constraints can lead to a cut in transfers to subnational governments, affecting two-thirds of Russian regions
where federal transfers constitute 15 to 50 percent of revenue. Concerns about debt levels will make it
difficult for many local governments to support expenditures.
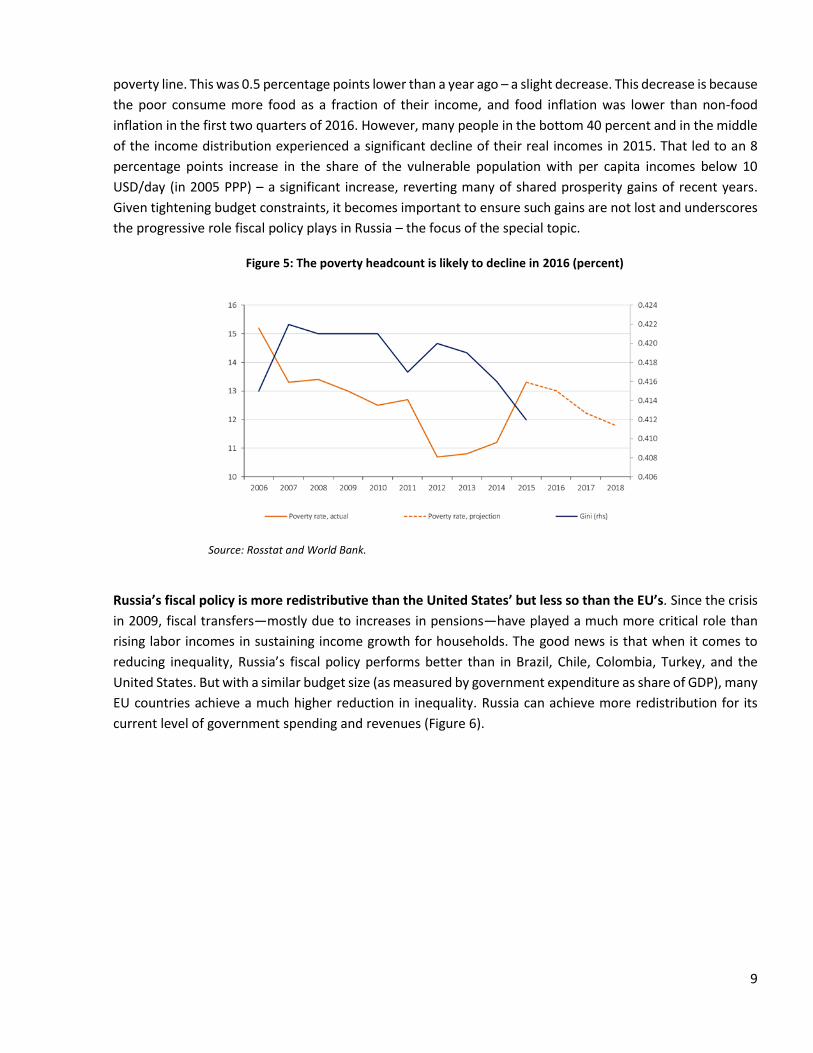
In 2016, poverty decreased slightly but vulnerability remains at higher levels than before (Figure 5). Despite
a continued contraction of disposable incomes – by 5.8 percent – the poverty rate slightly decreased. In the
first half of 2016, 21.4 million people, or 14.6 percent of the population, had incomes below the national
2015 9 months 2015 9 months 2016
2016 draft federal
budget law with
amendments
Expenditures 19.3 18.6 17.9 19.8
Primary expenditures 18.7 17.9 17.1 19
Revenues 16.9 17.5 15.3 16.1
Oil and gas revenues 7.3 7.8 5.6 5.8
Non-oil and gas revenues 9.6 9.7 9.7 10.4
Balance -2.4 -1.1 -2.6 -3.7
Non-oil and gas balance -9.7 -8.9 -8.2 -9.4
Primary balance -1.8 -0.4 -1.8 -2.9
Non-oil and gas primary balance -9 -8.2 -7.4 -8.7
9
poverty line. This was 0.5 percentage points lower than a year ago – a slight decrease. This decrease is because
the poor consume more food as a fraction of their income, and food inflation was lower than non-food
inflation in the first two quarters of 2016. However, many people in the bottom 40 percent and in the middle
of the income distribution experienced a significant decline of their real incomes in 2015. That led to an 8
percentage points increase in the share of the vulnerable population with per capita incomes below 10
USD/day (in 2005 PPP) – a significant increase, reverting many of shared prosperity gains of recent years.
Given tightening budget constraints, it becomes important to ensure such gains are not lost and underscores
the progressive role fiscal policy plays in Russia – the focus of the special topic.
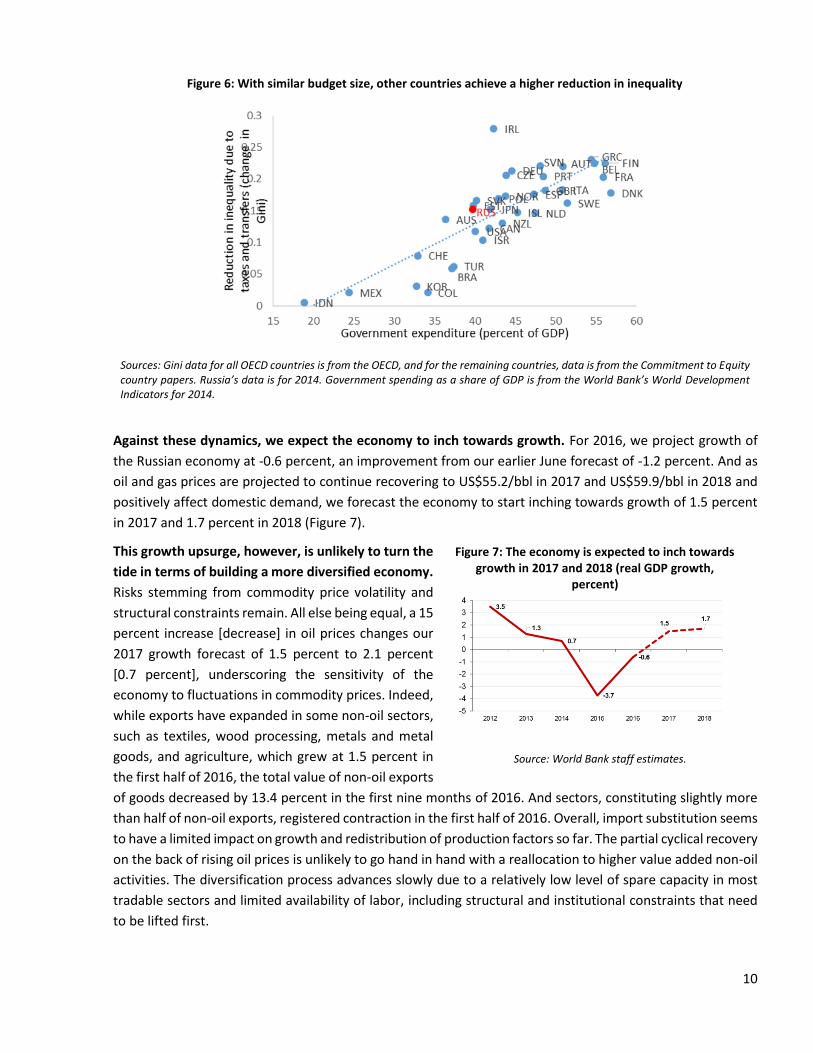
Russia’s fiscal policy is more redistributive than the United States’ but less so than the EU’s. Since the crisis
in 2009, fiscal transfers—mostly due to increases in pensions—have played a much more critical role than
rising labor incomes in sustaining income growth for households. The good news is that when it comes to
reducing inequality, Russia’s fiscal policy performs better than in Brazil, Chile, Colombia, Turkey, and the
United States. But with a similar budget size (as measured by government expenditure as share of GDP), many
EU countries achieve a much higher reduction in inequality. Russia can achieve more redistribution for its
current level of government spending and revenues (Figure 6).
Figure 5: The poverty headcount is likely to decline in 2016 (percent)
Source: Rosstat and World Bank.
10
Figure 6: With similar budget size, other countries achieve a higher reduction in inequality
Sources: Gini data for all OECD countries is from the OECD, and for the remaining countries, data is from the Commitment to Equity country papers. Russia’s data is for 2014. Government spending as a share of GDP is from the World Bank’s World Development Indicators for 2014.
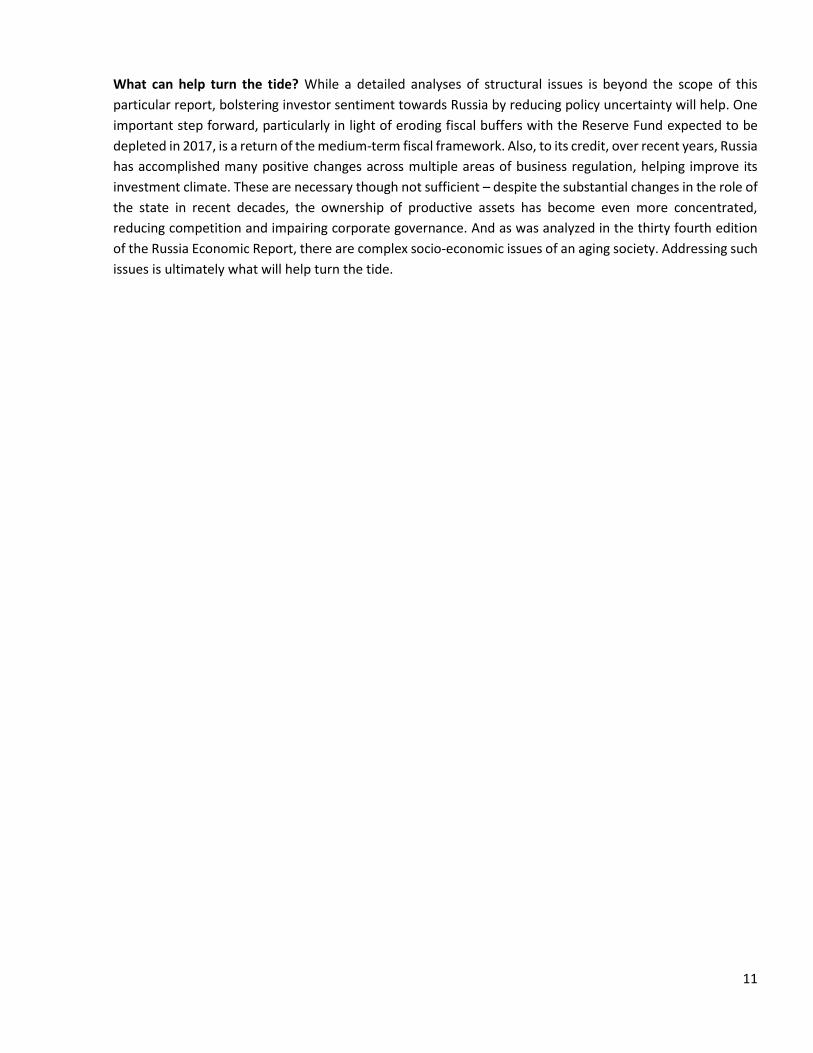
Against these dynamics, we expect the economy to inch towards growth. For 2016, we project growth of
the Russian economy at -0.6 percent, an improvement from our earlier June forecast of -1.2 percent. And as
oil and gas prices are projected to continue recovering to US$55.2/bbl in 2017 and US$59.9/bbl in 2018 and
positively affect domestic demand, we forecast the economy to start inching towards growth of 1.5 percent
in 2017 and 1.7 percent in 2018 (Figure 7).
This growth upsurge, however, is unlikely to turn the
tide in terms of building a more diversified economy.
Risks stemming from commodity price volatility and
structural constraints remain. All else being equal, a 15
percent increase [decrease] in oil prices changes our
2017 growth forecast of 1.5 percent to 2.1 percent
[0.7 percent], underscoring the sensitivity of the
economy to fluctuations in commodity prices. Indeed,
while exports have expanded in some non-oil sectors,
such as textiles, wood processing, metals and metal
goods, and agriculture, which grew at 1.5 percent in
the first half of 2016, the total value of non-oil exports
of goods decreased by 13.4 percent in the first nine months of 2016. And sectors, constituting slightly more
than half of non-oil exports, registered contraction in the first half of 2016. Overall, import substitution seems
to have a limited impact on growth and redistribution of production factors so far. The partial cyclical recovery
on the back of rising oil prices is unlikely to go hand in hand with a reallocation to higher value added non-oil
activities. The diversification process advances slowly due to a relatively low level of spare capacity in most
tradable sectors and limited availability of labor, including structural and institutional constraints that need
to be lifted first.
Figure 7: The economy is expected to inch towards growth in 2017 and 2018 (real GDP growth,
percent)
Source: World Bank staff estimates.
11
What can help turn the tide? While a detailed analyses of structural issues is beyond the scope of this
particular report, bolstering investor sentiment towards Russia by reducing policy uncertainty will help. One
important step forward, particularly in light of eroding fiscal buffers with the Reserve Fund expected to be
depleted in 2017, is a return of the medium-term fiscal framework. Also, to its credit, over recent years, Russia
has accomplished many positive changes across multiple areas of business regulation, helping improve its
investment climate. These are necessary though not sufficient – despite the substantial changes in the role of
the state in recent decades, the ownership of productive assets has become even more concentrated,
reducing competition and impairing corporate governance. And as was analyzed in the thirty fourth edition
of the Russia Economic Report, there are complex socio-economic issues of an aging society. Addressing such
issues is ultimately what will help turn the tide.
12
Part 1. Recent Economic Developments (2015 – 2016)
1.1 Growth: The recession continued in Russia, albeit the pace of GDP decline has slowed down
Global economic trends
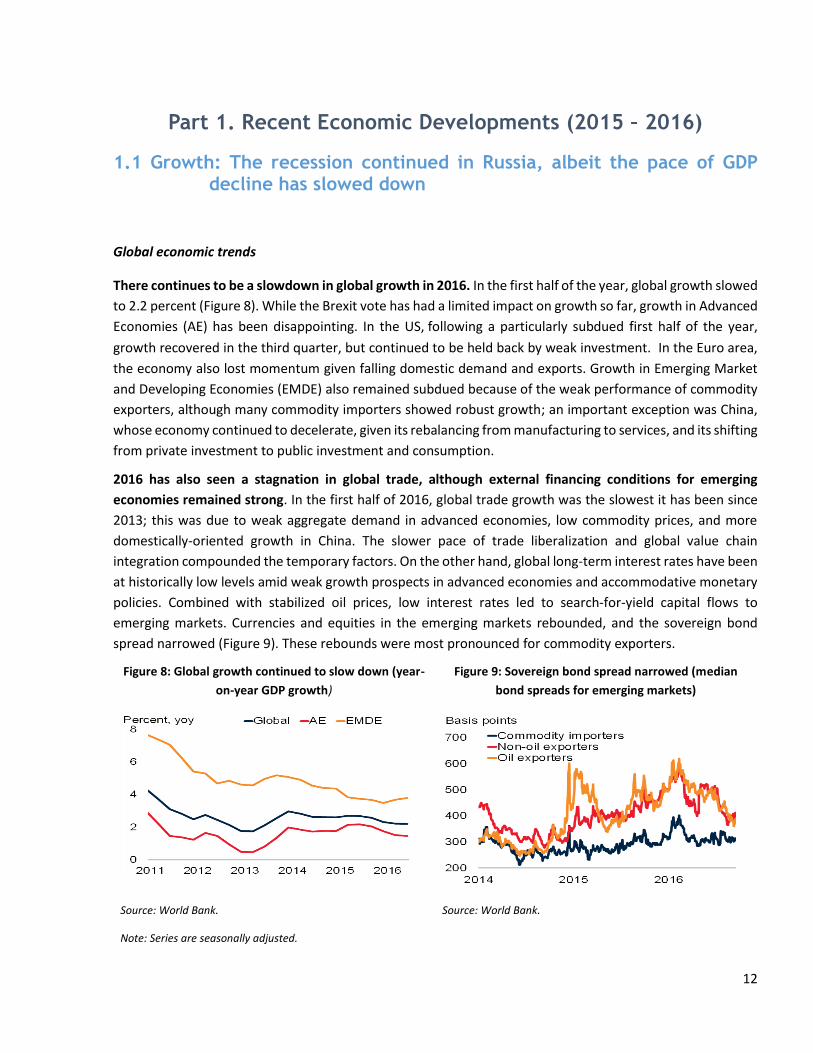
There continues to be a slowdown in global growth in 2016. In the first half of the year, global growth slowed
to 2.2 percent (Figure 8). While the Brexit vote has had a limited impact on growth so far, growth in Advanced
Economies (AE) has been disappointing. In the US, following a particularly subdued first half of the year,
growth recovered in the third quarter, but continued to be held back by weak investment. In the Euro area,
the economy also lost momentum given falling domestic demand and exports. Growth in Emerging Market
and Developing Economies (EMDE) also remained subdued because of the weak performance of commodity
exporters, although many commodity importers showed robust growth; an important exception was China,
whose economy continued to decelerate, given its rebalancing from manufacturing to services, and its shifting
from private investment to public investment and consumption.
2016 has also seen a stagnation in global trade, although external financing conditions for emerging
economies remained strong. In the first half of 2016, global trade growth was the slowest it has been since
2013; this was due to weak aggregate demand in advanced economies, low commodity prices, and more
domestically-oriented growth in China. The slower pace of trade liberalization and global value chain
integration compounded the temporary factors. On the other hand, global long-term interest rates have been
at historically low levels amid weak growth prospects in advanced economies and accommodative monetary
policies. Combined with stabilized oil prices, low interest rates led to search-for-yield capital flows to
emerging markets. Currencies and equities in the emerging markets rebounded, and the sovereign bond
spread narrowed (Figure 9). These rebounds were most pronounced for commodity exporters.
Figure 8: Global growth continued to slow down (year-
on-year GDP growth)
Figure 9: Sovereign bond spread narrowed (median
bond spreads for emerging markets)
Source: World Bank.
Note: Series are seasonally adjusted.
Source: World Bank.
13
Global oil market developments
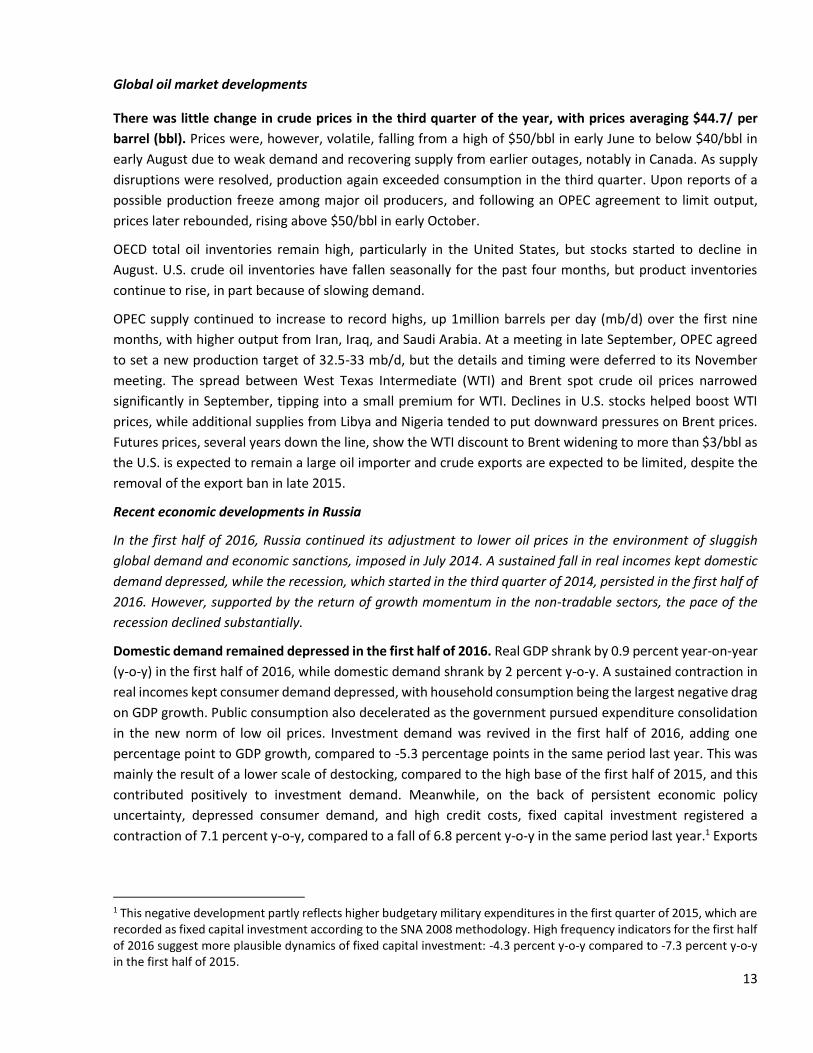
There was little change in crude prices in the third quarter of the year, with prices averaging $44.7/ per
barrel (bbl). Prices were, however, volatile, falling from a high of $50/bbl in early June to below $40/bbl in
early August due to weak demand and recovering supply from earlier outages, notably in Canada. As supply
disruptions were resolved, production again exceeded consumption in the third quarter. Upon reports of a
possible production freeze among major oil producers, and following an OPEC agreement to limit output,
prices later rebounded, rising above $50/bbl in early October.
OECD total oil inventories remain high, particularly in the United States, but stocks started to decline in
August. U.S. crude oil inventories have fallen seasonally for the past four months, but product inventories
continue to rise, in part because of slowing demand.
OPEC supply continued to increase to record highs, up 1million barrels per day (mb/d) over the first nine
months, with higher output from Iran, Iraq, and Saudi Arabia. At a meeting in late September, OPEC agreed
to set a new production target of 32.5-33 mb/d, but the details and timing were deferred to its November
meeting. The spread between West Texas Intermediate (WTI) and Brent spot crude oil prices narrowed
significantly in September, tipping into a small premium for WTI. Declines in U.S. stocks helped boost WTI
prices, while additional supplies from Libya and Nigeria tended to put downward pressures on Brent prices.
Futures prices, several years down the line, show the WTI discount to Brent widening to more than $3/bbl as
the U.S. is expected to remain a large oil importer and crude exports are expected to be limited, despite the
removal of the export ban in late 2015.
Recent economic developments in Russia
In the first half of 2016, Russia continued its adjustment to lower oil prices in the environment of sluggish
global demand and economic sanctions, imposed in July 2014. A sustained fall in real incomes kept domestic
demand depressed, while the recession, which started in the third quarter of 2014, persisted in the first half of
2016. However, supported by the return of growth momentum in the non-tradable sectors, the pace of the
recession declined substantially.
Domestic demand remained depressed in the first half of 2016. Real GDP shrank by 0.9 percent year-on-year
(y-o-y) in the first half of 2016, while domestic demand shrank by 2 percent y-o-y. A sustained contraction in
real incomes kept consumer demand depressed, with household consumption being the largest negative drag
on GDP growth. Public consumption also decelerated as the government pursued expenditure consolidation
in the new norm of low oil prices. Investment demand was revived in the first half of 2016, adding one
percentage point to GDP growth, compared to -5.3 percentage points in the same period last year. This was
mainly the result of a lower scale of destocking, compared to the high base of the first half of 2015, and this
contributed positively to investment demand. Meanwhile, on the back of persistent economic policy
uncertainty, depressed consumer demand, and high credit costs, fixed capital investment registered a
contraction of 7.1 percent y-o-y, compared to a fall of 6.8 percent y-o-y in the same period last year.1 Exports
1 This negative development partly reflects higher budgetary military expenditures in the first quarter of 2015, which are recorded as fixed capital investment according to the SNA 2008 methodology. High frequency indicators for the first half of 2016 suggest more plausible dynamics of fixed capital investment: -4.3 percent y-o-y compared to -7.3 percent y-o-y in the first half of 2015.
14
contributed negatively to GDP growth, but with imports continuing to contract, the overall contribution of
net exports to GDP growth was positive in the first half of 2016 (Figure 10).
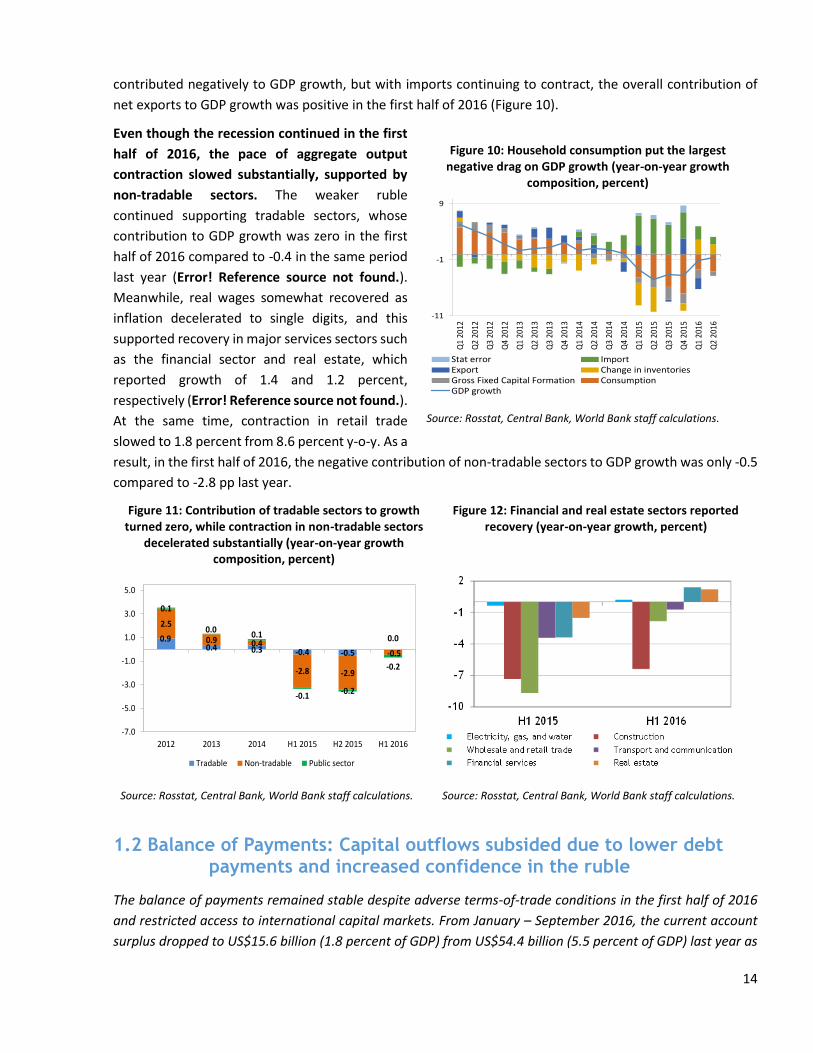
Even though the recession continued in the first
half of 2016, the pace of aggregate output
contraction slowed substantially, supported by
non-tradable sectors. The weaker ruble
continued supporting tradable sectors, whose
contribution to GDP growth was zero in the first
half of 2016 compared to -0.4 in the same period
last year (Error! Reference source not found.).
Meanwhile, real wages somewhat recovered as
inflation decelerated to single digits, and this
supported recovery in major services sectors such
as the financial sector and real estate, which
reported growth of 1.4 and 1.2 percent,
respectively (Error! Reference source not found.).
At the same time, contraction in retail trade
slowed to 1.8 percent from 8.6 percent y-o-y. As a
result, in the first half of 2016, the negative contribution of non-tradable sectors to GDP growth was only -0.5
compared to -2.8 pp last year.
Figure 11: Contribution of tradable sectors to growth turned zero, while contraction in non-tradable sectors
decelerated substantially (year-on-year growth composition, percent)
Figure 12: Financial and real estate sectors reported recovery (year-on-year growth, percent)
Source: Rosstat, Central Bank, World Bank staff calculations. Source: Rosstat, Central Bank, World Bank staff calculations.
1.2 Balance of Payments: Capital outflows subsided due to lower debt payments and increased confidence in the ruble
The balance of payments remained stable despite adverse terms-of-trade conditions in the first half of 2016
and restricted access to international capital markets. From January – September 2016, the current account
surplus dropped to US$15.6 billion (1.8 percent of GDP) from US$54.4 billion (5.5 percent of GDP) last year as
0.90.4 0.3 -0.4 -0.5
0.0
2.5
0.9 0.4
-2.8 -2.9
-0.5
0.1
0.00.1
-0.1-0.2
-0.2
-7.0
-5.0
-3.0
-1.0
1.0
3.0
5.0
2012 2013 2014 H1 2015 H2 2015 H1 2016
Tradable Non-tradable Public sector
Figure 10: Household consumption put the largest
negative drag on GDP growth (year-on-year growth composition, percent)
Source: Rosstat, Central Bank, World Bank staff calculations.
-11
-1
9
Q1
2012
Q2
2012
Q3
2012
Q4
2012
Q1
2013
Q2
2013
Q3
2013
Q4
2013
Q1
2014
Q2
2014
Q3
2014
Q4
2014
Q1
2015
Q2
2015
Q3
2015
Q4
2015
Q1
2016
Q2
2016
Stat error ImportExport Change in inventoriesGross Fixed Capital Formation ConsumptionGDP growth
15
the trade balance weakened. Net capital outflows moderated due to lower debt repayments in the banking
sector and increased confidence in the ruble.
Lower commodity prices reduced the trade balance, weakening the current account. The fall in oil prices,
which started in August 2015, ended in February 2016, and the average oil price has been gradually increasing
in the first half of 2016. Yet, on an annual basis, in all three quarters of 2016, and especially in the first half of
2016, average oil prices were lower than last year. As a result, oil and gas export proceeds dropped by 30.5
percent y-o-y in the first nine months of 2016 to US$107.6 billion. The value of non-oil exports of goods
decreased by 13.4 percent y-o-y in the first nine months of 2016 as prices for other commodities exported by
Russia were at low levels and as the diversification process advances slowly.
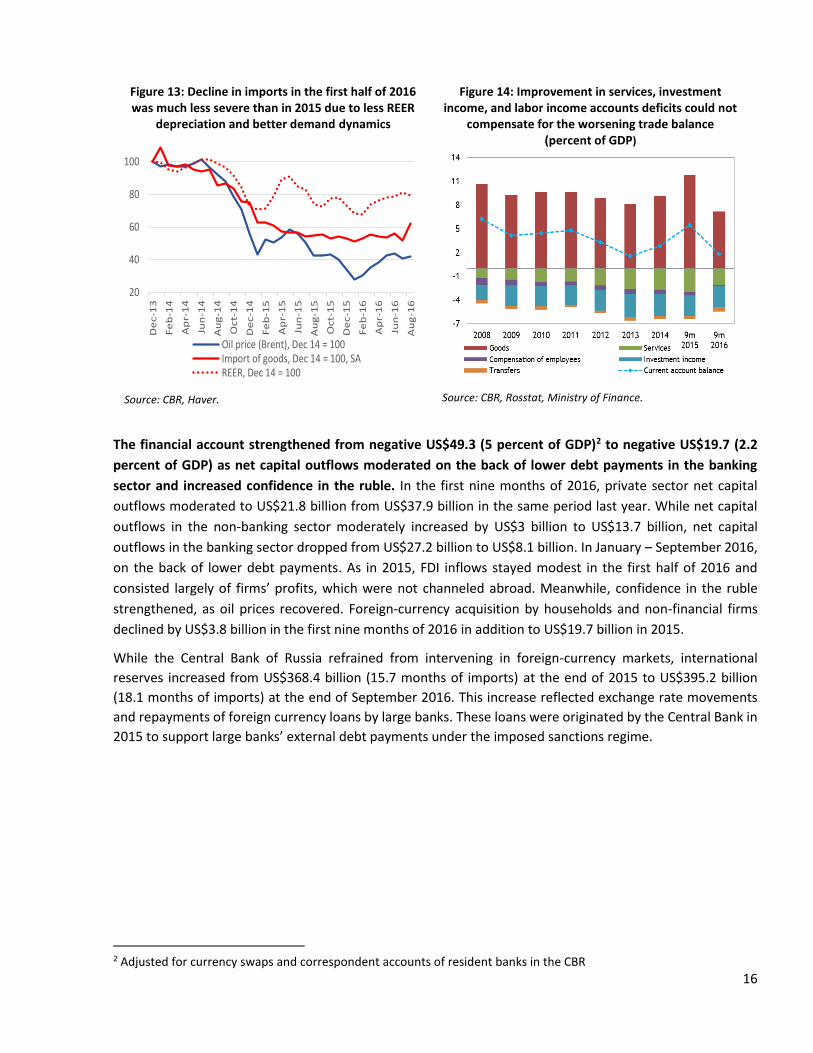
The flexible exchange rate enabled the Real Effective Exchange Rate (REER) to depreciate by 8.6 percent in
the first half of 2016, prompting a fast downward adjustment in import demand. In the first six months of
2016, the value of imports of goods decreased by 9 percent y-o-y. Nonetheless, the decline in imports was
much less severe than in the first half of 2015 when the REER depreciated by 17.4 percent and GDP contracted
by 3.5 percent y-o-y (Figure 13).
The continued ban on certain food imports, introduced in July 2014, and the ban on certain food imports from
Turkey, in place since January 2016, added to the contraction in imports of goods. In the third quarter of 2016,
when oil prices were close to last year’s levels, export contraction was not as profound as in the first half of
2016, supporting the trade balance. Overall, in the first nine months of 2016, the contraction in the value of
imports of goods could not compensate for lower export proceeds, and the trade balance almost halved to
US$63.1 billion (7.1 percent of GDP) from US$118.2 billion (11.8 percent of GDP) last year (Figure 14). The
negative balance of services improved mainly on the back of subsiding tourist imports due to lower real
incomes and restricted flights to Turkey and Egypt. A substantial reduction in net external liabilities in 2015
reduced outbound interest and dividend payments in the first nine months of 2016, improving the investment
income deficit. Overall, improvement in services, investment income, and labor income accounts deficits
could not compensate for the worsening trade balance and the current account surplus decreased to US$15.6
billion (1.8 percent of GDP) from US$54.4 billion (5.5 percent of GDP) last year (Error! Reference source not
found.). The non-oil current account deficit increased in nominal terms to US$92 billion and weakened in
relative terms from 10.1 percent of GDP to 10.4 percent of GDP, increasing vulnerability of the economy to
terms of trade shocks.
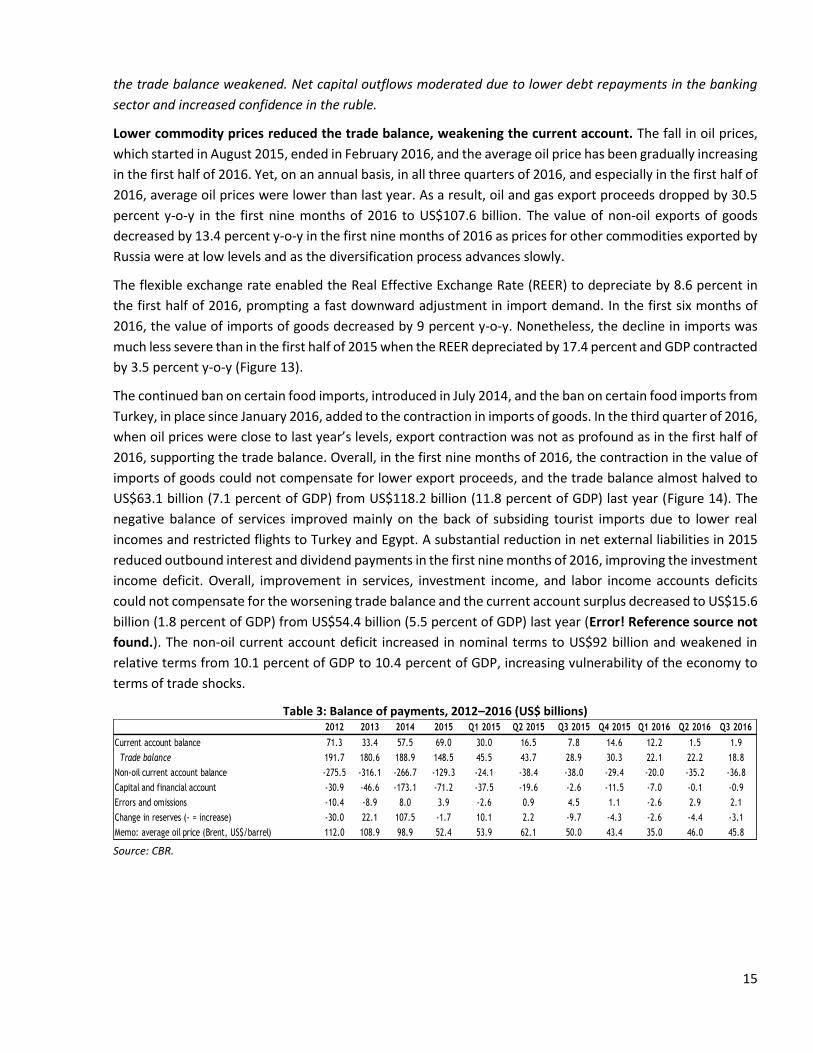
Table 3: Balance of payments, 2012–2016 (US$ billions)
Source: CBR.
2012 2013 2014 2015 Q1 2015 Q2 2015 Q3 2015 Q4 2015 Q1 2016 Q2 2016 Q3 2016
Current account balance 71.3 33.4 57.5 69.0 30.0 16.5 7.8 14.6 12.2 1.5 1.9
Trade balance 191.7 180.6 188.9 148.5 45.5 43.7 28.9 30.3 22.1 22.2 18.8
Non-oil current account balance -275.5 -316.1 -266.7 -129.3 -24.1 -38.4 -38.0 -29.4 -20.0 -35.2 -36.8
Capital and financial account -30.9 -46.6 -173.1 -71.2 -37.5 -19.6 -2.6 -11.5 -7.0 -0.1 -0.9
Errors and omissions -10.4 -8.9 8.0 3.9 -2.6 0.9 4.5 1.1 -2.6 2.9 2.1
Change in reserves (- = increase) -30.0 22.1 107.5 -1.7 10.1 2.2 -9.7 -4.3 -2.6 -4.4 -3.1
Memo: average oil price (Brent, US$/barrel) 112.0 108.9 98.9 52.4 53.9 62.1 50.0 43.4 35.0 46.0 45.8
16
The financial account strengthened from negative US$49.3 (5 percent of GDP)2 to negative US$19.7 (2.2
percent of GDP) as net capital outflows moderated on the back of lower debt payments in the banking
sector and increased confidence in the ruble. In the first nine months of 2016, private sector net capital
outflows moderated to US$21.8 billion from US$37.9 billion in the same period last year. While net capital
outflows in the non-banking sector moderately increased by US$3 billion to US$13.7 billion, net capital
outflows in the banking sector dropped from US$27.2 billion to US$8.1 billion. In January – September 2016,
on the back of lower debt payments. As in 2015, FDI inflows stayed modest in the first half of 2016 and
consisted largely of firms’ profits, which were not channeled abroad. Meanwhile, confidence in the ruble
strengthened, as oil prices recovered. Foreign-currency acquisition by households and non-financial firms
declined by US$3.8 billion in the first nine months of 2016 in addition to US$19.7 billion in 2015.
While the Central Bank of Russia refrained from intervening in foreign-currency markets, international
reserves increased from US$368.4 billion (15.7 months of imports) at the end of 2015 to US$395.2 billion
(18.1 months of imports) at the end of September 2016. This increase reflected exchange rate movements
and repayments of foreign currency loans by large banks. These loans were originated by the Central Bank in
2015 to support large banks’ external debt payments under the imposed sanctions regime.
2 Adjusted for currency swaps and correspondent accounts of resident banks in the CBR
Figure 13: Decline in imports in the first half of 2016 was much less severe than in 2015 due to less REER
depreciation and better demand dynamics
Source: CBR, Haver.
Figure 14: Improvement in services, investment income, and labor income accounts deficits could not
compensate for the worsening trade balance (percent of GDP)
Source: CBR, Rosstat, Ministry of Finance.
20
40
60
80
100D
ec-1
3
Fe
b-1
4
Ap
r-1
4
Jun
-14
Au
g-1
4
Oct-
14
De
c-1
4
Fe
b-1
5
Ap
r-1
5
Jun
-15
Au
g-1
5
Oct-
15
De
c-1
5
Fe
b-1
6
Ap
r-1
6
Jun
-16
Au
g-1
6
Oil price (Brent), Dec 14 = 100Import of goods, Dec 14 = 100, SAREER, Dec 14 = 100
17
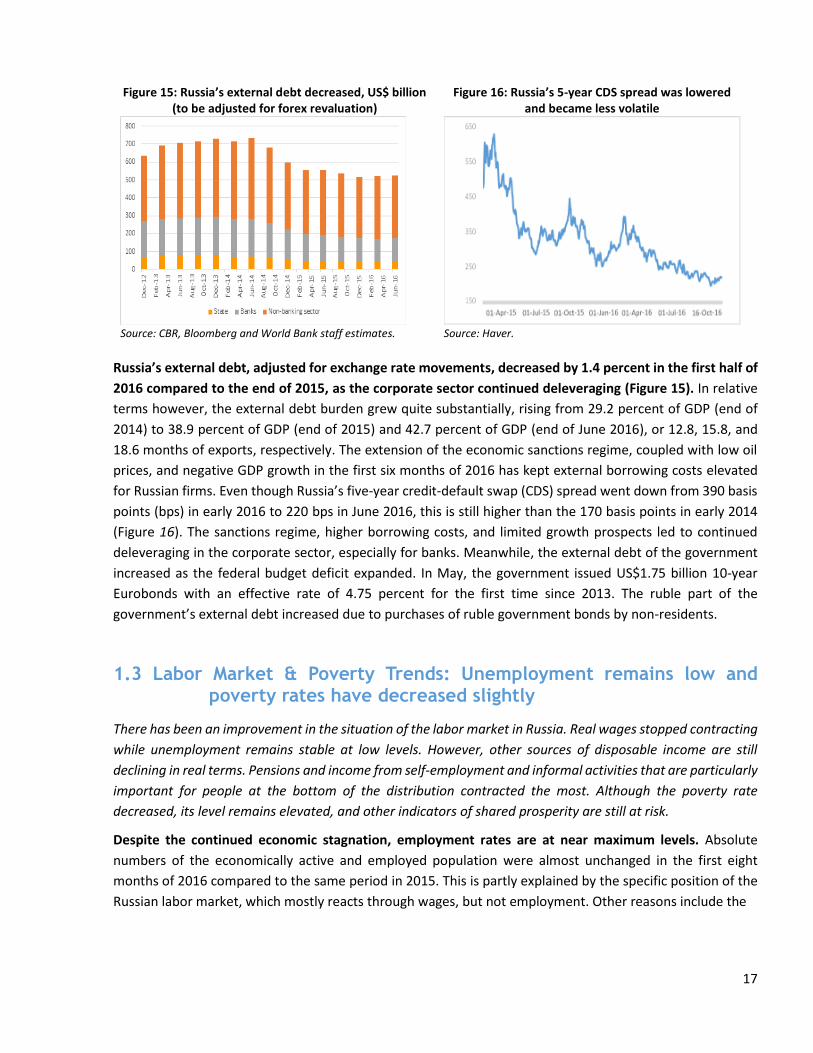
Russia’s external debt, adjusted for exchange rate movements, decreased by 1.4 percent in the first half of
2016 compared to the end of 2015, as the corporate sector continued deleveraging (Figure 15). In relative
terms however, the external debt burden grew quite substantially, rising from 29.2 percent of GDP (end of
2014) to 38.9 percent of GDP (end of 2015) and 42.7 percent of GDP (end of June 2016), or 12.8, 15.8, and
18.6 months of exports, respectively. The extension of the economic sanctions regime, coupled with low oil
prices, and negative GDP growth in the first six months of 2016 has kept external borrowing costs elevated
for Russian firms. Even though Russia’s five-year credit-default swap (CDS) spread went down from 390 basis
points (bps) in early 2016 to 220 bps in June 2016, this is still higher than the 170 basis points in early 2014
(Figure 16). The sanctions regime, higher borrowing costs, and limited growth prospects led to continued
deleveraging in the corporate sector, especially for banks. Meanwhile, the external debt of the government
increased as the federal budget deficit expanded. In May, the government issued US$1.75 billion 10-year
Eurobonds with an effective rate of 4.75 percent for the first time since 2013. The ruble part of the
government’s external debt increased due to purchases of ruble government bonds by non-residents.
1.3 Labor Market & Poverty Trends: Unemployment remains low and poverty rates have decreased slightly
There has been an improvement in the situation of the labor market in Russia. Real wages stopped contracting
while unemployment remains stable at low levels. However, other sources of disposable income are still
declining in real terms. Pensions and income from self-employment and informal activities that are particularly
important for people at the bottom of the distribution contracted the most. Although the poverty rate
decreased, its level remains elevated, and other indicators of shared prosperity are still at risk.
Despite the continued economic stagnation, employment rates are at near maximum levels. Absolute
numbers of the economically active and employed population were almost unchanged in the first eight
months of 2016 compared to the same period in 2015. This is partly explained by the specific position of the
Russian labor market, which mostly reacts through wages, but not employment. Other reasons include the
Figure 15: Russia’s external debt decreased, US$ billion (to be adjusted for forex revaluation)
Source: CBR, Bloomberg and World Bank staff estimates.
Figure 16: Russia’s 5-year CDS spread was lowered and became less volatile
Source: Haver.
18
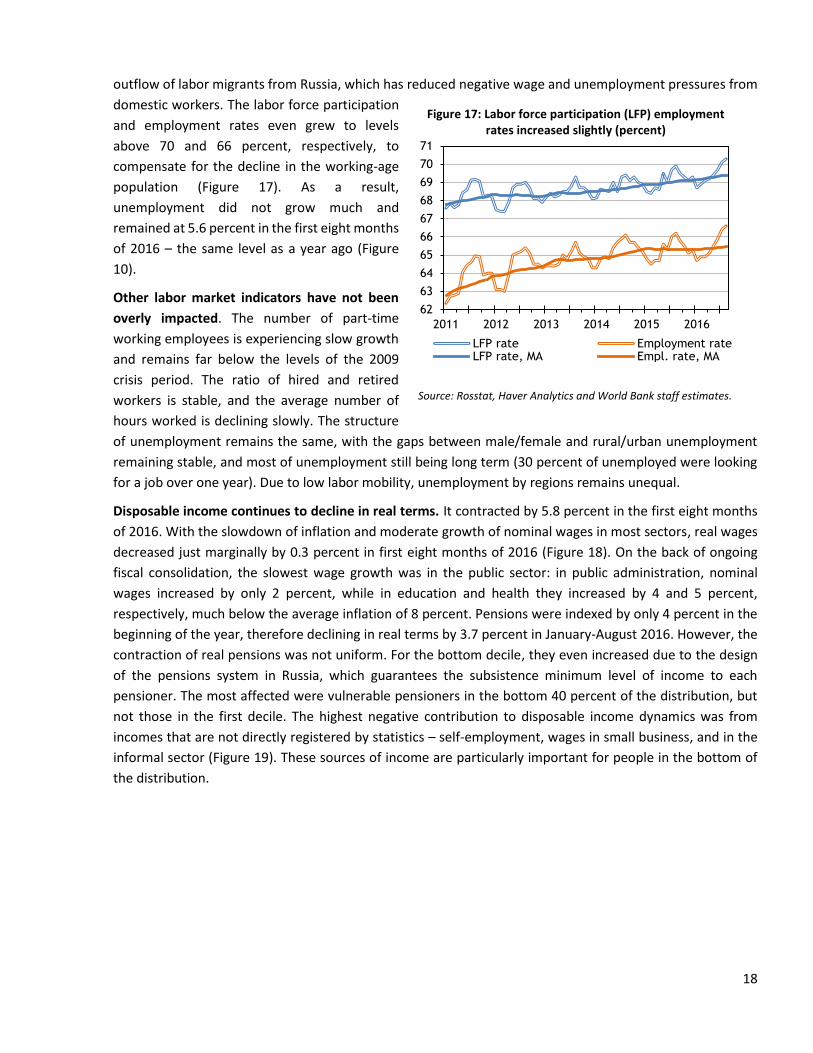
outflow of labor migrants from Russia, which has reduced negative wage and unemployment pressures from
domestic workers. The labor force participation
and employment rates even grew to levels
above 70 and 66 percent, respectively, to
compensate for the decline in the working-age
population (Figure 17). As a result,
unemployment did not grow much and
remained at 5.6 percent in the first eight months
of 2016 – the same level as a year ago (Figure
10).
Other labor market indicators have not been
overly impacted. The number of part-time
working employees is experiencing slow growth
and remains far below the levels of the 2009
crisis period. The ratio of hired and retired
workers is stable, and the average number of
hours worked is declining slowly. The structure
of unemployment remains the same, with the gaps between male/female and rural/urban unemployment
remaining stable, and most of unemployment still being long term (30 percent of unemployed were looking
for a job over one year). Due to low labor mobility, unemployment by regions remains unequal.
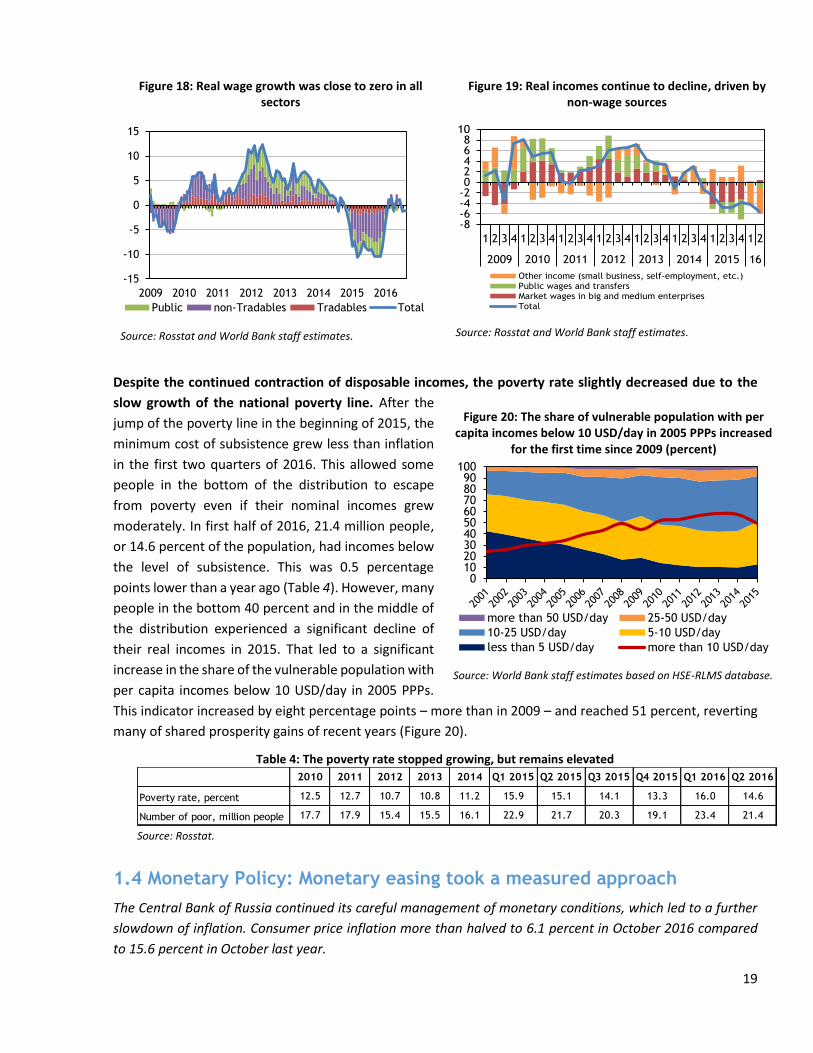
Disposable income continues to decline in real terms. It contracted by 5.8 percent in the first eight months
of 2016. With the slowdown of inflation and moderate growth of nominal wages in most sectors, real wages
decreased just marginally by 0.3 percent in first eight months of 2016 (Figure 18). On the back of ongoing
fiscal consolidation, the slowest wage growth was in the public sector: in public administration, nominal
wages increased by only 2 percent, while in education and health they increased by 4 and 5 percent,
respectively, much below the average inflation of 8 percent. Pensions were indexed by only 4 percent in the
beginning of the year, therefore declining in real terms by 3.7 percent in January-August 2016. However, the
contraction of real pensions was not uniform. For the bottom decile, they even increased due to the design
of the pensions system in Russia, which guarantees the subsistence minimum level of income to each
pensioner. The most affected were vulnerable pensioners in the bottom 40 percent of the distribution, but
not those in the first decile. The highest negative contribution to disposable income dynamics was from
incomes that are not directly registered by statistics – self-employment, wages in small business, and in the
informal sector (Figure 19). These sources of income are particularly important for people in the bottom of
the distribution.
Figure 17: Labor force participation (LFP) employment rates increased slightly (percent)
Source: Rosstat, Haver Analytics and World Bank staff estimates.
62
63
64
65
66
67
68
69
70
71
2011 2012 2013 2014 2015 2016
LFP rate Employment rateLFP rate, MA Empl. rate, MA
19
Despite the continued contraction of disposable incomes, the poverty rate slightly decreased due to the
slow growth of the national poverty line. After the
jump of the poverty line in the beginning of 2015, the
minimum cost of subsistence grew less than inflation
in the first two quarters of 2016. This allowed some
people in the bottom of the distribution to escape
from poverty even if their nominal incomes grew
moderately. In first half of 2016, 21.4 million people,
or 14.6 percent of the population, had incomes below
the level of subsistence. This was 0.5 percentage
points lower than a year ago (Table 4). However, many
people in the bottom 40 percent and in the middle of
the distribution experienced a significant decline of
their real incomes in 2015. That led to a significant
increase in the share of the vulnerable population with
per capita incomes below 10 USD/day in 2005 PPPs.
This indicator increased by eight percentage points – more than in 2009 – and reached 51 percent, reverting
many of shared prosperity gains of recent years (Figure 20).
Table 4: The poverty rate stopped growing, but remains elevated
Source: Rosstat.
1.4 Monetary Policy: Monetary easing took a measured approach
The Central Bank of Russia continued its careful management of monetary conditions, which led to a further
slowdown of inflation. Consumer price inflation more than halved to 6.1 percent in October 2016 compared
to 15.6 percent in October last year.
2010 2011 2012 2013 2014 Q1 2015 Q2 2015 Q3 2015 Q4 2015 Q1 2016 Q2 2016
Poverty rate, percent 12.5 12.7 10.7 10.8 11.2 15.9 15.1 14.1 13.3 16.0 14.6
Number of poor, million people 17.7 17.9 15.4 15.5 16.1 22.9 21.7 20.3 19.1 23.4 21.4
Figure 18: Real wage growth was close to zero in all sectors
Source: Rosstat and World Bank staff estimates.
Figure 19: Real incomes continue to decline, driven by non-wage sources
Source: Rosstat and World Bank staff estimates.
Figure 20: The share of vulnerable population with per capita incomes below 10 USD/day in 2005 PPPs increased
for the first time since 2009 (percent)
Source: World Bank staff estimates based on HSE-RLMS database.
-15
-10
-5
0
5
10
15
2009 2010 2011 2012 2013 2014 2015 2016
Public non-Tradables Tradables Total
-8-6-4-202468
10
1 2 3 4 1 2 3 4 1 2 3 4 1 2 3 4 1 2 3 4 1 2 3 4 1 2 3 4 1 2
2009 2010 2011 2012 2013 2014 2015 16
Other income (small business, self-employment, etc.)Public wages and transfersMarket wages in big and medium enterprisesTotal
0102030405060708090
100
more than 50 USD/day 25-50 USD/day
10-25 USD/day 5-10 USD/day
less than 5 USD/day more than 10 USD/day
20
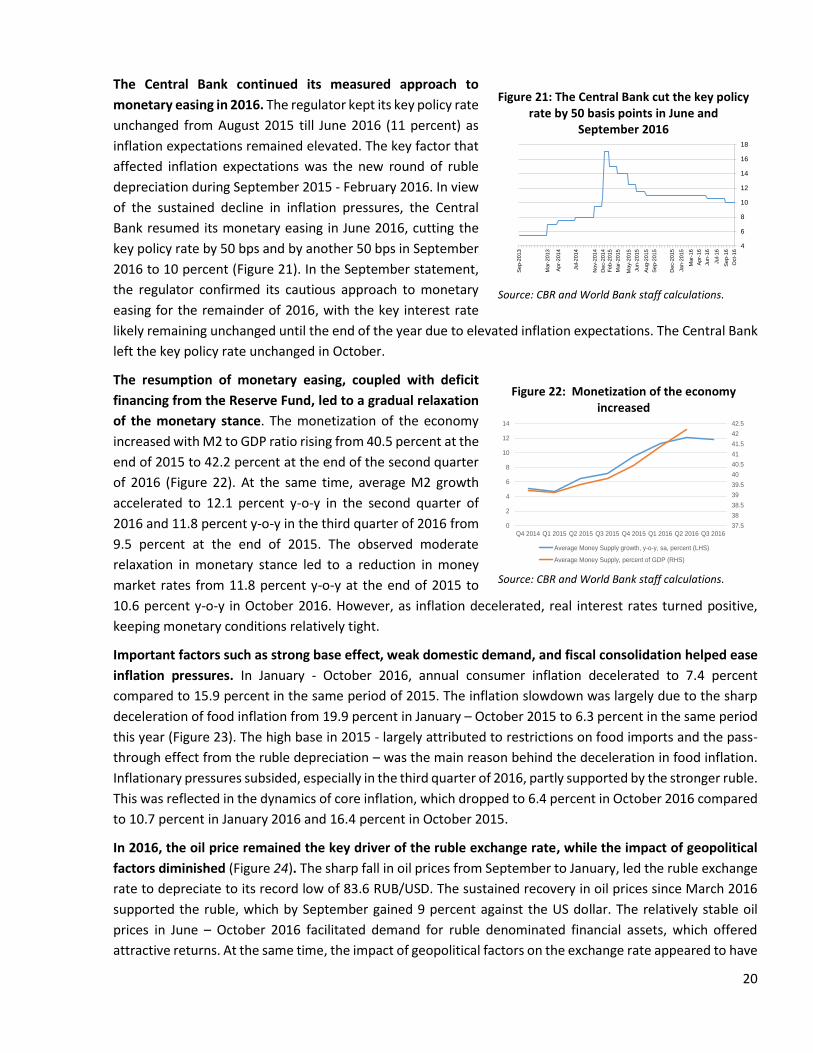
The Central Bank continued its measured approach to
monetary easing in 2016. The regulator kept its key policy rate
unchanged from August 2015 till June 2016 (11 percent) as
inflation expectations remained elevated. The key factor that
affected inflation expectations was the new round of ruble
depreciation during September 2015 - February 2016. In view
of the sustained decline in inflation pressures, the Central
Bank resumed its monetary easing in June 2016, cutting the
key policy rate by 50 bps and by another 50 bps in September
2016 to 10 percent (Figure 21). In the September statement,
the regulator confirmed its cautious approach to monetary
easing for the remainder of 2016, with the key interest rate
likely remaining unchanged until the end of the year due to elevated inflation expectations. The Central Bank
left the key policy rate unchanged in October.
The resumption of monetary easing, coupled with deficit
financing from the Reserve Fund, led to a gradual relaxation
of the monetary stance. The monetization of the economy
increased with M2 to GDP ratio rising from 40.5 percent at the
end of 2015 to 42.2 percent at the end of the second quarter
of 2016 (Figure 22). At the same time, average M2 growth
accelerated to 12.1 percent y-o-y in the second quarter of
2016 and 11.8 percent y-o-y in the third quarter of 2016 from
9.5 percent at the end of 2015. The observed moderate
relaxation in monetary stance led to a reduction in money
market rates from 11.8 percent y-o-y at the end of 2015 to
10.6 percent y-o-y in October 2016. However, as inflation decelerated, real interest rates turned positive,
keeping monetary conditions relatively tight.
Important factors such as strong base effect, weak domestic demand, and fiscal consolidation helped ease
inflation pressures. In January - October 2016, annual consumer inflation decelerated to 7.4 percent
compared to 15.9 percent in the same period of 2015. The inflation slowdown was largely due to the sharp
deceleration of food inflation from 19.9 percent in January – October 2015 to 6.3 percent in the same period
this year (Figure 23). The high base in 2015 - largely attributed to restrictions on food imports and the pass-
through effect from the ruble depreciation – was the main reason behind the deceleration in food inflation.
Inflationary pressures subsided, especially in the third quarter of 2016, partly supported by the stronger ruble.
This was reflected in the dynamics of core inflation, which dropped to 6.4 percent in October 2016 compared
to 10.7 percent in January 2016 and 16.4 percent in October 2015.
In 2016, the oil price remained the key driver of the ruble exchange rate, while the impact of geopolitical
factors diminished (Figure 24). The sharp fall in oil prices from September to January, led the ruble exchange
rate to depreciate to its record low of 83.6 RUB/USD. The sustained recovery in oil prices since March 2016
supported the ruble, which by September gained 9 percent against the US dollar. The relatively stable oil
prices in June – October 2016 facilitated demand for ruble denominated financial assets, which offered
attractive returns. At the same time, the impact of geopolitical factors on the exchange rate appeared to have
Figure 21: The Central Bank cut the key policy rate by 50 basis points in June and
September 2016
Source: CBR and World Bank staff calculations.
Figure 22: Monetization of the economy increased
Source: CBR and World Bank staff calculations.
4
6
8
10
12
14
16
18
Oct-
16
Se
p-1
6
Jul-1
6
Jun
-16
Ap
r-1
6
Ma
r-16
Jan
-2015
Dec-2
01
5
Se
p-2
015
Au
g-2
015
Jun
-2015
May-2
015
Ma
r-2015
Fe
b-2
015
Dec-2
01
4
Nov-2
01
4
Jul-2
014
Ap
r-2
01
4
Ma
r-2013
Se
p-2
013
37.5
38
38.5
39
39.5
40
40.5
41
41.5
42
42.5
0
2
4
6
8
10
12
14
Q4 2014 Q1 2015 Q2 2015 Q3 2015 Q4 2015 Q1 2016 Q2 2016 Q3 2016
Average Money Supply growth, y-o-y, sa, percent (LHS)
Average Money Supply, percent of GDP (RHS)
21
diminished, which is reflected in lower and less volatile CDS spreads on Russian sovereign bonds.
Source: CBR and Haver Analytics. Source: CBR and World Bank staff calculations.
1.5 The Financial Sector: More stable but still vulnerable to
macroeconomic risks
The banking system has largely stabilized due to the government’s substantial support program to the
financial sector in 2015, but it remains vulnerable to macroeconomic risks: the ongoing economic recession,
depressed consumer demand, and interest rate uncertainty. In 2016, credit growth remained negligible, the
quality of bank portfolios continued to deteriorate, and the overall sector performance was weak although it
showed some improvement in comparison to 2015.
The weak economic environment continued to negatively affect the banking sector’s performance.
Corporate loans have grown in low single digits, driven mainly by refinancing of large companies and the
obligation by banks recapitalized by the government to increase their exposure by 1 percent a month for 3
years in certain strategic sectors. In the retail segment, loan growth was negative due to weak consumer and
auto segments, with the exception of mortgage lending, which was boosted by the government’s interest-
rate subsidies program. Given declining inflation and the falling Central Bank key rate (which was lowered
twice in 2016), new lending rates are expected to decrease over the medium-term, and encourage demand
for new loans.
Even though banks have reduced their risk appetite in new lending, a drop in the real disposable incomes
of the population and the weaker debt servicing capacity of the corporate borrowers contributed to
additional pressure on the quality of bank portfolios. As a result, credit quality continued to worsen:
reported Non-Performing Loans (NPLs) reached 9.8 percent of total loans in the first eight months of 2016
(up from 8.3 percent at the end of 2015). Despite worsening credit quality, the banking sector’s capitalization
remained stable this year with an aggregate capital adequacy ratio of 12.5 percent (above the regulatory
minimum of 8 percent) as of September 1, 2016 (Figure 25 and Figure 26).
Figure 23: Inflation slowed down (CPI index and its
components, percent, y-o-y)
Figure 24: The oil price remained the key driver of
the ruble exchange rate (changes in oil prices and the
nominal exchange rate, logarithmic scale)
22
Despite this challenging environment, the flow of
deposits has increased, liquidity in both ruble and
foreign exchange has improved, and there were
no signs of increased dollarization. Banks’ financial
performance has shown some improvements as
the banking sector returned to profitability this
year. The return on assets was 0.8 percent, and
return on equity was 7.2 percent as of September
1, 2016. Sector profits almost tripled since the
beginning of the year and totaled RUB532 billion in
the first eight months of this year. However, 60
percent of these profits came from Sberbank.
Profits at other Russian banks were much weaker.
The Central Bank has continued its efforts to clean
up the banking system in 2016, cutting the
number of banks that are non-compliant with
regulations and that conduct risky operations,
leading to an erosion in their capital base. The
number of banks in Russia has fallen from 733 in
the beginning of 2016 to 649 as of October 1, 2016,
and further consolidation is expected. The share of
the top five banks in the sector’s total assets has
increased to 56 percent from 54 percent at the
beginning of this year. Owing to the convergence of
external factors (economic sanctions and low oil
prices) as well as internal factors (slow economic
recovery), in the near term, the Russian banking
sector is likely to remain vulnerable to
macroeconomic risks as both corporate and retail clients will continue adjusting to the new economic
environment of low growth, weak demand, and stagnating incomes.
1.6 Government Budget: Fiscal consolidation is planned to 2017 and
beyond
The federal budget deficit weakened in the first nine months of 2016 as lower expenditures did not compensate
for lower oil revenues. Despite expenditure cuts in January – September 2016, primary expenditures are
expected to increase by the end of the year. This will result in an overall expansionary fiscal policy in 2016,
with consolidation planned for 2017 - 2019. The anticipated reintroduction of a medium-term fiscal framework
for 2017 – 2019, focused primarily on expenditure cuts, is expected to guide this consolidation.
The government tightened its spending in the first nine months of 2016. In January – September 2016,
federal government revenues dropped to 15.3 percent of GDP from 17.5 percent of GDP last year (Error!
Reference source not found.). The ruble’s depreciation only partly compensated for a drop in oil prices from
US$ 54.4/bbl (Urals) to US$ 39.9/bbl, and oil and gas revenues slumped from 7.8 percent of GDP last year to
Figure 25: The banking sector’s credit profile and performance remain weak, while capitalization is stable
(percent)
Figure 26: Bank credit growth remains weak (percent,
adjusted for the forex revaluation)
Source: CBR, World Bank calculations.
0
5
10
15
20
Source: CBR.
Capital adequacy ratio NPLs to total loans Loan loss provisions to total loansReturn on assetsReturn on equity
-10
-5
0
5
10
15
20
1/0
1/1
5
1/0
2/1
5
1/0
3/1
5
1/0
4/1
5
1/0
5/1
5
1/0
6/1
5
1/0
7/1
5
1/0
8/1
5
1/0
9/1
5
1/1
0/1
5
1/1
1/1
5
1/1
2/1
5
1/0
1/1
6
1/0
2/1
6
1/0
3/1
6
1/0
4/1
6
1/0
5/1
6
1/0
6/1
6
1/0
7/1
6
1/0
8/1
6
1/0
9/1
6
companies household overall
23
5.6 percent of GDP in the first nine months of 2016. Non-oil revenues remained at 9.7 percent of GDP in 2016.
Meanwhile, the federal government’s primary spending decreased by 0.8 percent of GDP to 17.1 percent of
GDP in the first nine months of 2016. The government consolidated federal budget spending by means of a
freeze on civil servant salaries, indexation of pensions lower than the inflation rate, and a freeze on the saving
pillar of the pension system. At the beginning of 2016, when the government was faced with oil prices that
were much lower than stipulated in the federal budget law for 2016, it decided on an additional 10 percent
across-the-board expenditure cut for all categories except defence and social spending. In the first nine
months of 2016, government spending on national defence (- 0.7 percent of GDP), national security (- 0.2
percent of GDP), national economy (-0.2 percent of GDP), and sport (-0.1 percent of GDP) decreased.
Expenditures on housing and communal services, education, and intergovernmental transfers remained
roughly at the same level as a share of GDP but decreased in nominal terms. Even though the government
indexed the majority of pensions below inflation, at a rate of 4.5 percent, government spending on social
policy increased by 0.5 percent of GDP. Decreases in expenditures could not compensate for a fall in revenues,
and the federal budget primary deficit widened from 0.4 percent of GDP last year to 1.8 percent of GDP this
year. However, lower spending brought about an improvement in the non-oil fiscal deficit from 8.9 percent
of GDP to 8.2 percent.
Figure 27: Federal budget revenues declined and the government tightened its spending (% of GDP, January to September)
Source: Economic Expert Group, World Bank staff calculations.
Despite tightening of the budget spending in the first nine months of 2016, expenditures will increase by
the end of the year because of increased national defence and social policy spending.
Overall primary expenditures would increase from 18.7 percent of GDP in 2015 to 19 percent (Table 5).
Compared to spending in 2015, government expenditures would increase for national defence (+0.8 percent
of GDP) and social policy (+0.3 percent of GDP). Meanwhile, government expenditures would decline for the
majority of other expenditure categories: state management (-0.1 percent of GDP), national security (-0.1
percent of GDP), national economy (-0.3 percent of GDP), housing and communal services (-0.1 percent of
GDP), education (-0.1 percent of GDP), health (-0.1 percent of GDP), and intergovernmental transfers (-0.1
percent of GDP). Due to higher non-oil revenues, the non-oil and gas primary deficit would improve by 0.3
percent of GDP to 8.7 percent of GDP.
13
14
15
16
17
18
2015 2016
Primary expenditure Revenues
-10
-8
-6
-4
-2
0
2015 2016
Balance Non-oil primary balance
24
Federal budget revenues are expected to drop by 0.8 percent of GDP mainly on the back of lower oil and gas
revenues. The government increased its projection for non-oil and gas revenues due to the expected
privatization of Rosneft.3
This suggests that the projected federal budget deficit for 2016 will increase to 3.7 percent of GDP (from 2.4
percent in 2015).
Table 5: The projected federal budget deficit for 2016 is higher than in 2015 (percent of GDP)
Source: Ministry of Finance, Economic Expert Group, World Bank staff calculations.
Federal debt decreased in relative terms and
stayed at a low level, with the major part of the
deficit financed from the Reserve Fund. In the first
half of 2016, federal government debt decreased as
percent of GDP due to exchange rate movement,
and it remains at an overall low level (Figure 28).
The bulk of the federal budget deficit in the first
nine months of 2016 was financed from the Reserve
Fund. The net increase in domestic borrowing in the
first half of 2016 totaled RUB270 billion (US$4.3
billion). The government also issued 10-year
Eurobonds for US$1.75 billion in May and US$1.25
billion in September, although this would only
constitute about 6.3 percent of the expected
federal budget deficit. Privatization proceeds (from
Alrosa and Bashneft) brought RUB382 billion (US$6.1 billion) for deficit financing.
2015 9 months 2015 9 months 2016
2016 federal
budget law with
amendments
Expenditures 19.3 18.6 17.9 19.8
Primary expenditures 18.7 17.9 17.1 19
Revenues 16.9 17.5 15.3 16.1
Oil and gas revenues 7.3 7.8 5.6 5.8
Non-oil and gas revenues 9.6 9.7 9.7 10.4
Balance -2.4 -1.1 -2.6 -3.7
Non-oil and gas balance -9.7 -8.9 -8.2 -9.4
Primary balance -1.8 -0.4 -1.8 -2.9
Non-oil and gas primary balance -9 -8.2 -7.4 -8.7
Figure 28: Federal government debt stayed at a low level (percent of GDP, first half of the year)
Source: Ministry of Finance, Rosstat, World Bank staff
calculations.
-1
4
9
14
H1 2015 H1 2016Debt denominated in foreign currencyDebt denominated in rubles
25
With the financing of the deficit mainly from the Reserve Fund, federal government debt is expected to
increase to 14.2 percent of GDP (upper limit 16.2 percent of GDP) in 2016 from 13.6 percent of GDP in 2015,
partly due to increase of Rub 500 billion (upper limit 2.5 trillion rubles) in domestic guarantees.
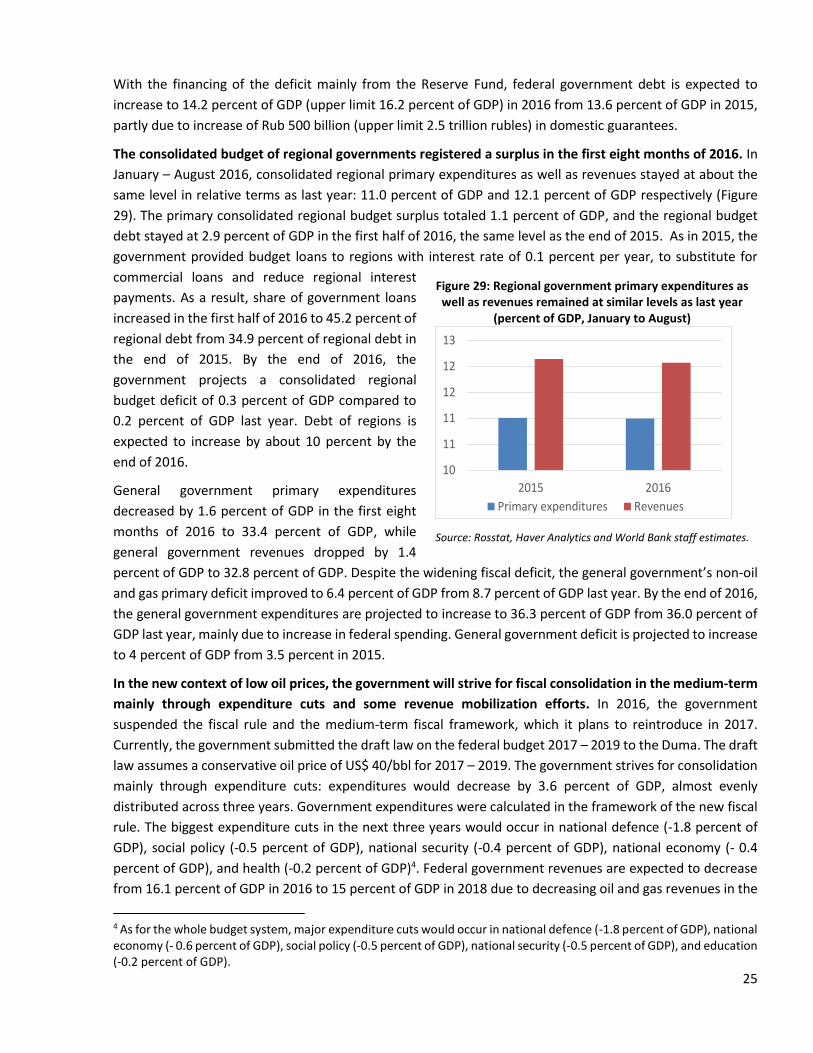
The consolidated budget of regional governments registered a surplus in the first eight months of 2016. In
January – August 2016, consolidated regional primary expenditures as well as revenues stayed at about the
same level in relative terms as last year: 11.0 percent of GDP and 12.1 percent of GDP respectively (Figure
29). The primary consolidated regional budget surplus totaled 1.1 percent of GDP, and the regional budget
debt stayed at 2.9 percent of GDP in the first half of 2016, the same level as the end of 2015. As in 2015, the
government provided budget loans to regions with interest rate of 0.1 percent per year, to substitute for
commercial loans and reduce regional interest
payments. As a result, share of government loans
increased in the first half of 2016 to 45.2 percent of
regional debt from 34.9 percent of regional debt in
the end of 2015. By the end of 2016, the
government projects a consolidated regional
budget deficit of 0.3 percent of GDP compared to
0.2 percent of GDP last year. Debt of regions is
expected to increase by about 10 percent by the
end of 2016.
General government primary expenditures
decreased by 1.6 percent of GDP in the first eight
months of 2016 to 33.4 percent of GDP, while
general government revenues dropped by 1.4
percent of GDP to 32.8 percent of GDP. Despite the widening fiscal deficit, the general government’s non-oil
and gas primary deficit improved to 6.4 percent of GDP from 8.7 percent of GDP last year. By the end of 2016,
the general government expenditures are projected to increase to 36.3 percent of GDP from 36.0 percent of
GDP last year, mainly due to increase in federal spending. General government deficit is projected to increase
to 4 percent of GDP from 3.5 percent in 2015.
In the new context of low oil prices, the government will strive for fiscal consolidation in the medium-term
mainly through expenditure cuts and some revenue mobilization efforts. In 2016, the government
suspended the fiscal rule and the medium-term fiscal framework, which it plans to reintroduce in 2017.
Currently, the government submitted the draft law on the federal budget 2017 – 2019 to the Duma. The draft
law assumes a conservative oil price of US$ 40/bbl for 2017 – 2019. The government strives for consolidation
mainly through expenditure cuts: expenditures would decrease by 3.6 percent of GDP, almost evenly
distributed across three years. Government expenditures were calculated in the framework of the new fiscal
rule. The biggest expenditure cuts in the next three years would occur in national defence (-1.8 percent of
GDP), social policy (-0.5 percent of GDP), national security (-0.4 percent of GDP), national economy (- 0.4
percent of GDP), and health (-0.2 percent of GDP)4. Federal government revenues are expected to decrease
from 16.1 percent of GDP in 2016 to 15 percent of GDP in 2018 due to decreasing oil and gas revenues in the
4 As for the whole budget system, major expenditure cuts would occur in national defence (-1.8 percent of GDP), national economy (- 0.6 percent of GDP), social policy (-0.5 percent of GDP), national security (-0.5 percent of GDP), and education (-0.2 percent of GDP).
Figure 29: Regional government primary expenditures as well as revenues remained at similar levels as last year
(percent of GDP, January to August)
Source: Rosstat, Haver Analytics and World Bank staff estimates.
10
11
11
12
12
13
2015 2016
Primary expenditures Revenues
26
medium-term and the one-off effect of expected receipts from privatization in 2016. The fiscal consolidation
will also be supported by revenue mobilization efforts: the government projects to raise 1.1 percent of GDP
in 2017 – 2019 predominantly from transfer of dividends of the state controlled companies and increasing
tax revenue from the energy sector (Error! Reference source not found.).
Table 6: Federal budget deficit expected to decrease over time (percent of GDP)
2016 2017 2018 2019
Expected Draft budget law
Expenditures 19.8 18.6 17.3 16.1
Revenues 16.1 15.4 15.1 15.0
Oil and gas revenues 5.8 5.8 5.5 5.4
Non-oil and gas revenues 10.4 9.6 9.6 9.6
Balance -3.7 -3.2 -2.2 -1.2
Non-oil and gas balance -9.4 -9.0 -7.7 -6.5
Oil price (Urals) 41 40 40 40 Source: Ministry of Finance.
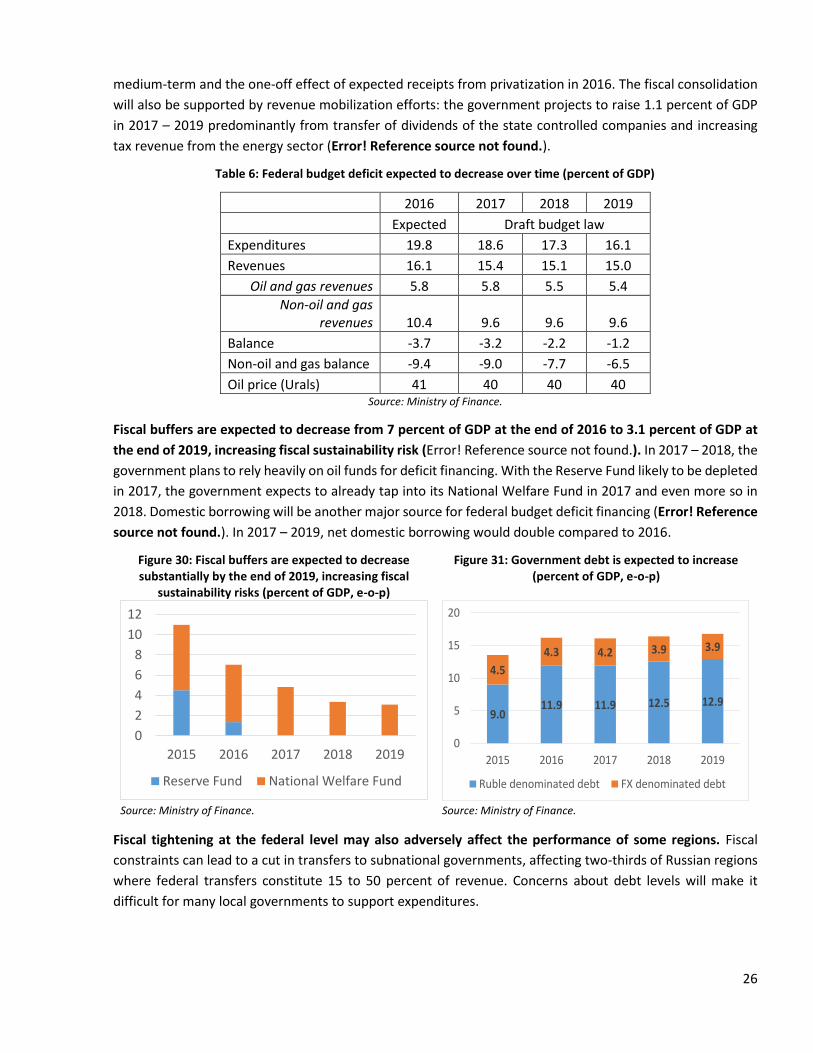
Fiscal buffers are expected to decrease from 7 percent of GDP at the end of 2016 to 3.1 percent of GDP at
the end of 2019, increasing fiscal sustainability risk (Error! Reference source not found.). In 2017 – 2018, the
government plans to rely heavily on oil funds for deficit financing. With the Reserve Fund likely to be depleted
in 2017, the government expects to already tap into its National Welfare Fund in 2017 and even more so in
2018. Domestic borrowing will be another major source for federal budget deficit financing (Error! Reference
source not found.). In 2017 – 2019, net domestic borrowing would double compared to 2016.
Figure 30: Fiscal buffers are expected to decrease substantially by the end of 2019, increasing fiscal
sustainability risks (percent of GDP, e-o-p)
Figure 31: Government debt is expected to increase (percent of GDP, e-o-p)
Source: Ministry of Finance. Source: Ministry of Finance.
Fiscal tightening at the federal level may also adversely affect the performance of some regions. Fiscal
constraints can lead to a cut in transfers to subnational governments, affecting two-thirds of Russian regions
where federal transfers constitute 15 to 50 percent of revenue. Concerns about debt levels will make it
difficult for many local governments to support expenditures.
0
2
4
6
8
10
12
2015 2016 2017 2018 2019
Reserve Fund National Welfare Fund
9.011.9 11.9 12.5 12.9
4.5
4.3 4.2 3.9 3.9
0
5
10
15
20
2015 2016 2017 2018 2019
Ruble denominated debt FX denominated debt
27
Part 2. The Outlook Over Three Years
2.1 Growth & Poverty Outlook: Russia expected to inch towards growth with
a slight decrease in the poverty rate
Russia’s economic prospects have improved due to more favorable terms of trade than earlier assumed. The
economy is projected to contract by 0.6 percent in 2016 (an improvement from our earlier June forecast of -
1.2 percent). As hydrocarbon prices are projected to continue recovering and positively affect domestic
demand, the economy is expected to experience bottoming-out during the second half of 2016 and grow by a
modest 1.5 and 1.7 percent in 2017 and 2018, respectively. We expect the poverty rate to decrease on the
back of decelerating inflation and a recovery in private incomes and consumption.
Global growth is expected to recover over the medium-term, but divergences will remain. Global growth is
projected to grow by a disappointing 2.4 percent in 2016 due to deceleration in advanced economies, owing
to both cyclical and structural factors. Over the medium-term, however, economic activity is projected to pick
up to about 2.9 percent in 2017-2018, although the recovery may be slower than previously anticipated
because of uncertainty related to the impact of Brexit. Divergences between commodity exporters and
importers will persist. Commodity exporters are expected to see a turning point in growth patterns in the
second half of 2016 or in early 2017 as commodity prices are projected to continue recovering. Meanwhile,
commodity importers are expected to continue benefitting from relatively low energy prices, improving their
growth prospects; the exception, however, is China, which will continue to rebalance its economy and grow
slower.
Russia’s external environment will remain challenging as economic sanctions have been extended and the
prospects of its main trading partners have deteriorated. The extension of the U.S. and EU sanctions (initially
introduced during the 2014 Ukraine crisis) will continue limiting access of Russian financial institutions to
international capital markets. Meanwhile, economic prospects for major advanced and emerging economies
have deteriorated amidst weak global trade and manufacturing activity. Bleak economic prospects facing
Russia’s key trading partners mean they will be unable to contribute positively to the required recovery of
external demand. Growth in the EU, the main destination of Russia’s commodity goods, was slower than
earlier anticipated and is expected to remain modest over the medium-term. China, the second largest export
market for Russia, continues its gradual slowdown and rebalancing as the economy transitions to a new
development model. Growth of the U.S. economy slowed in 2016 and is expected to be slower than before,
diminishing its role as one of major export destinations for Russian goods and services.
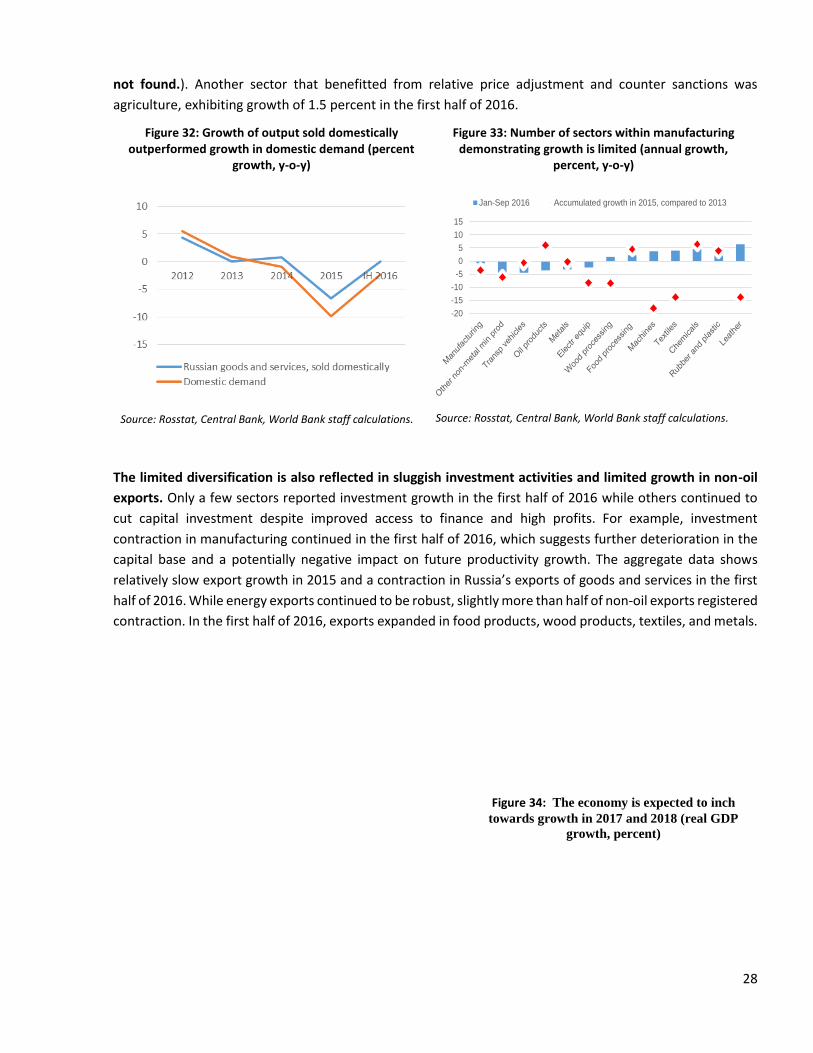
So far, import substitution has had a limited impact on growth and redistribution of production factors,
implying a slow process of diversification. As expected, the relative price adjustment facilitated the import
substitution process (Error! Reference source not found.), supporting production in several sectors. However,
this impact was limited due to a relatively low level of spare capacity (the capacity utilization level remained
at historically high levels in most tradable sectors) and limited availability of labor. As a result, the positive
impact of import substitution was not enough to compensate for the overall contraction in manufacturing of
1.7 percent y-o-y in the first half of 2016; manufacturing contributed -0.2 pp to GDP growth during this period.
Meanwhile, there were sectors that demonstrated positive dynamics in manufacturing: food products,
rubber, textiles, leather, wood processing, chemicals, and machines and equipment (Error! Reference source
28
not found.). Another sector that benefitted from relative price adjustment and counter sanctions was
agriculture, exhibiting growth of 1.5 percent in the first half of 2016.
Figure 32: Growth of output sold domestically outperformed growth in domestic demand (percent
growth, y-o-y)
Figure 33: Number of sectors within manufacturing demonstrating growth is limited (annual growth,
percent, y-o-y)
Source: Rosstat, Central Bank, World Bank staff calculations. Source: Rosstat, Central Bank, World Bank staff calculations.
The limited diversification is also reflected in sluggish investment activities and limited growth in non-oil
exports. Only a few sectors reported investment growth in the first half of 2016 while others continued to
cut capital investment despite improved access to finance and high profits. For example, investment
contraction in manufacturing continued in the first half of 2016, which suggests further deterioration in the
capital base and a potentially negative impact on future productivity growth. The aggregate data shows
relatively slow export growth in 2015 and a contraction in Russia’s exports of goods and services in the first
half of 2016. While energy exports continued to be robust, slightly more than half of non-oil exports registered
contraction. In the first half of 2016, exports expanded in food products, wood products, textiles, and metals.
-20
-15
-10
-5
0
5
10
15
Jan-Sep 2016 Accumulated growth in 2015, compared to 2013
Figure 34: The economy is expected to inch
towards growth in 2017 and 2018 (real GDP
growth, percent)
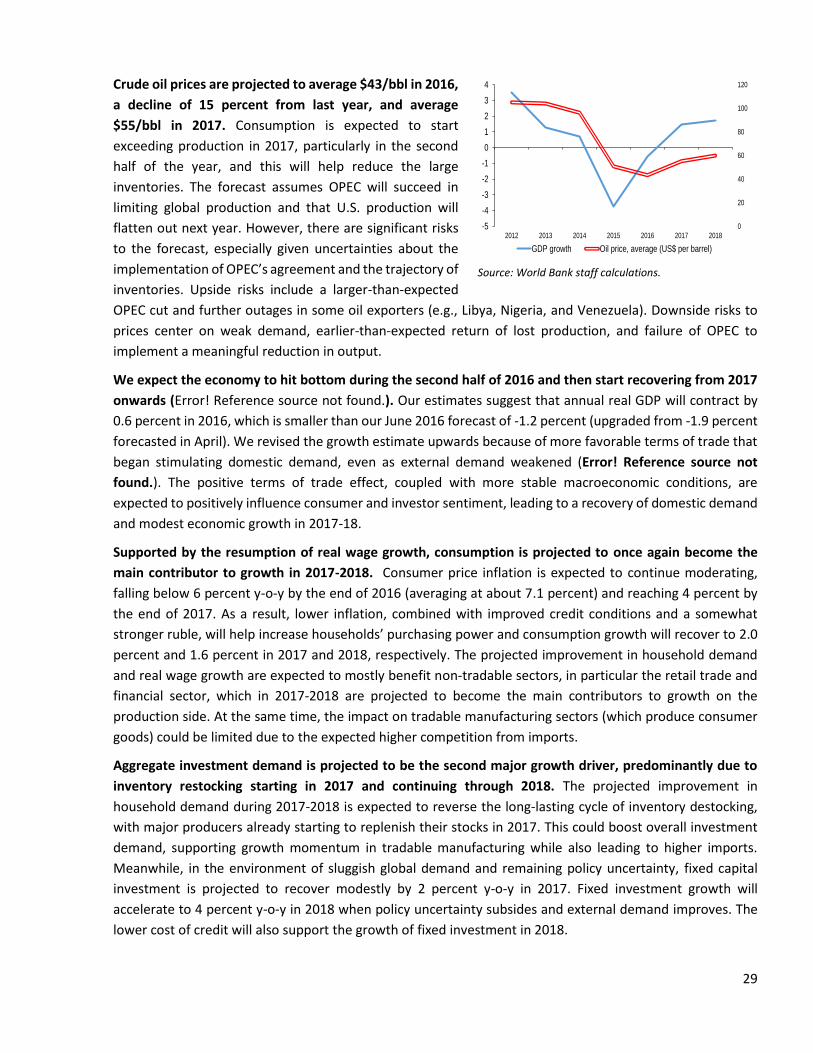
29
Crude oil prices are projected to average $43/bbl in 2016,
a decline of 15 percent from last year, and average
$55/bbl in 2017. Consumption is expected to start
exceeding production in 2017, particularly in the second
half of the year, and this will help reduce the large
inventories. The forecast assumes OPEC will succeed in
limiting global production and that U.S. production will
flatten out next year. However, there are significant risks
to the forecast, especially given uncertainties about the
implementation of OPEC’s agreement and the trajectory of
inventories. Upside risks include a larger-than-expected
OPEC cut and further outages in some oil exporters (e.g., Libya, Nigeria, and Venezuela). Downside risks to
prices center on weak demand, earlier-than-expected return of lost production, and failure of OPEC to
implement a meaningful reduction in output.
We expect the economy to hit bottom during the second half of 2016 and then start recovering from 2017
onwards (Error! Reference source not found.). Our estimates suggest that annual real GDP will contract by
0.6 percent in 2016, which is smaller than our June 2016 forecast of -1.2 percent (upgraded from -1.9 percent
forecasted in April). We revised the growth estimate upwards because of more favorable terms of trade that
began stimulating domestic demand, even as external demand weakened (Error! Reference source not
found.). The positive terms of trade effect, coupled with more stable macroeconomic conditions, are
expected to positively influence consumer and investor sentiment, leading to a recovery of domestic demand
and modest economic growth in 2017-18.
Supported by the resumption of real wage growth, consumption is projected to once again become the
main contributor to growth in 2017-2018. Consumer price inflation is expected to continue moderating,
falling below 6 percent y-o-y by the end of 2016 (averaging at about 7.1 percent) and reaching 4 percent by
the end of 2017. As a result, lower inflation, combined with improved credit conditions and a somewhat
stronger ruble, will help increase households’ purchasing power and consumption growth will recover to 2.0
percent and 1.6 percent in 2017 and 2018, respectively. The projected improvement in household demand
and real wage growth are expected to mostly benefit non-tradable sectors, in particular the retail trade and
financial sector, which in 2017-2018 are projected to become the main contributors to growth on the
production side. At the same time, the impact on tradable manufacturing sectors (which produce consumer
goods) could be limited due to the expected higher competition from imports.
Aggregate investment demand is projected to be the second major growth driver, predominantly due to
inventory restocking starting in 2017 and continuing through 2018. The projected improvement in
household demand during 2017-2018 is expected to reverse the long-lasting cycle of inventory destocking,
with major producers already starting to replenish their stocks in 2017. This could boost overall investment
demand, supporting growth momentum in tradable manufacturing while also leading to higher imports.
Meanwhile, in the environment of sluggish global demand and remaining policy uncertainty, fixed capital
investment is projected to recover modestly by 2 percent y-o-y in 2017. Fixed investment growth will
accelerate to 4 percent y-o-y in 2018 when policy uncertainty subsides and external demand improves. The
lower cost of credit will also support the growth of fixed investment in 2018.
Source: World Bank staff calculations.
0
20
40
60
80
100
120
-5
-4
-3
-2
-1
0
1
2
3
4
2012 2013 2014 2015 2016 2017 2018
GDP growth Oil price, average (US$ per barrel)
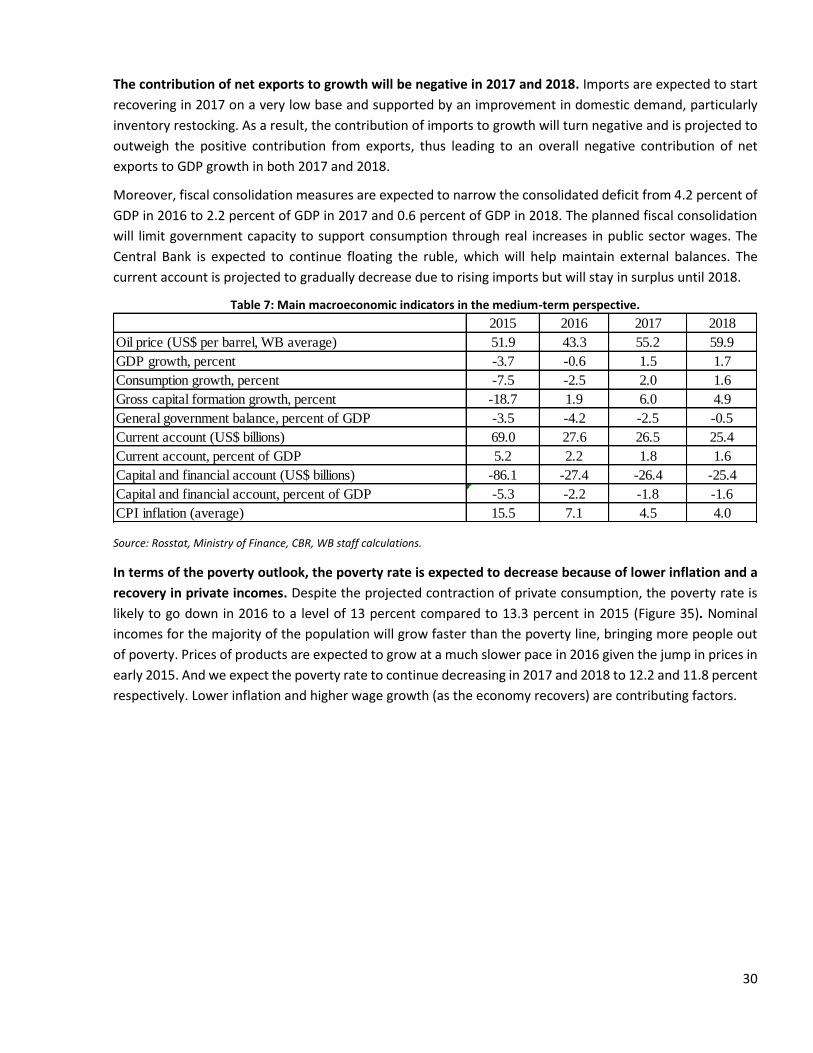
30
The contribution of net exports to growth will be negative in 2017 and 2018. Imports are expected to start
recovering in 2017 on a very low base and supported by an improvement in domestic demand, particularly
inventory restocking. As a result, the contribution of imports to growth will turn negative and is projected to
outweigh the positive contribution from exports, thus leading to an overall negative contribution of net
exports to GDP growth in both 2017 and 2018.
Moreover, fiscal consolidation measures are expected to narrow the consolidated deficit from 4.2 percent of
GDP in 2016 to 2.2 percent of GDP in 2017 and 0.6 percent of GDP in 2018. The planned fiscal consolidation
will limit government capacity to support consumption through real increases in public sector wages. The
Central Bank is expected to continue floating the ruble, which will help maintain external balances. The
current account is projected to gradually decrease due to rising imports but will stay in surplus until 2018.
Table 7: Main macroeconomic indicators in the medium-term perspective.
Source: Rosstat, Ministry of Finance, CBR, WB staff calculations.
In terms of the poverty outlook, the poverty rate is expected to decrease because of lower inflation and a
recovery in private incomes. Despite the projected contraction of private consumption, the poverty rate is
likely to go down in 2016 to a level of 13 percent compared to 13.3 percent in 2015 (Figure 35). Nominal
incomes for the majority of the population will grow faster than the poverty line, bringing more people out
of poverty. Prices of products are expected to grow at a much slower pace in 2016 given the jump in prices in
early 2015. And we expect the poverty rate to continue decreasing in 2017 and 2018 to 12.2 and 11.8 percent
respectively. Lower inflation and higher wage growth (as the economy recovers) are contributing factors.
2015 2016 2017 2018
Oil price (US$ per barrel, WB average) 51.9 43.3 55.2 59.9
GDP growth, percent -3.7 -0.6 1.5 1.7
Consumption growth, percent -7.5 -2.5 2.0 1.6
Gross capital formation growth, percent -18.7 1.9 6.0 4.9
General government balance, percent of GDP -3.5 -4.2 -2.5 -0.5
Current account (US$ billions) 69.0 27.6 26.5 25.4
Current account, percent of GDP 5.2 2.2 1.8 1.6
Capital and financial account (US$ billions) -86.1 -27.4 -26.4 -25.4
Capital and financial account, percent of GDP -5.3 -2.2 -1.8 -1.6
CPI inflation (average) 15.5 7.1 4.5 4.0
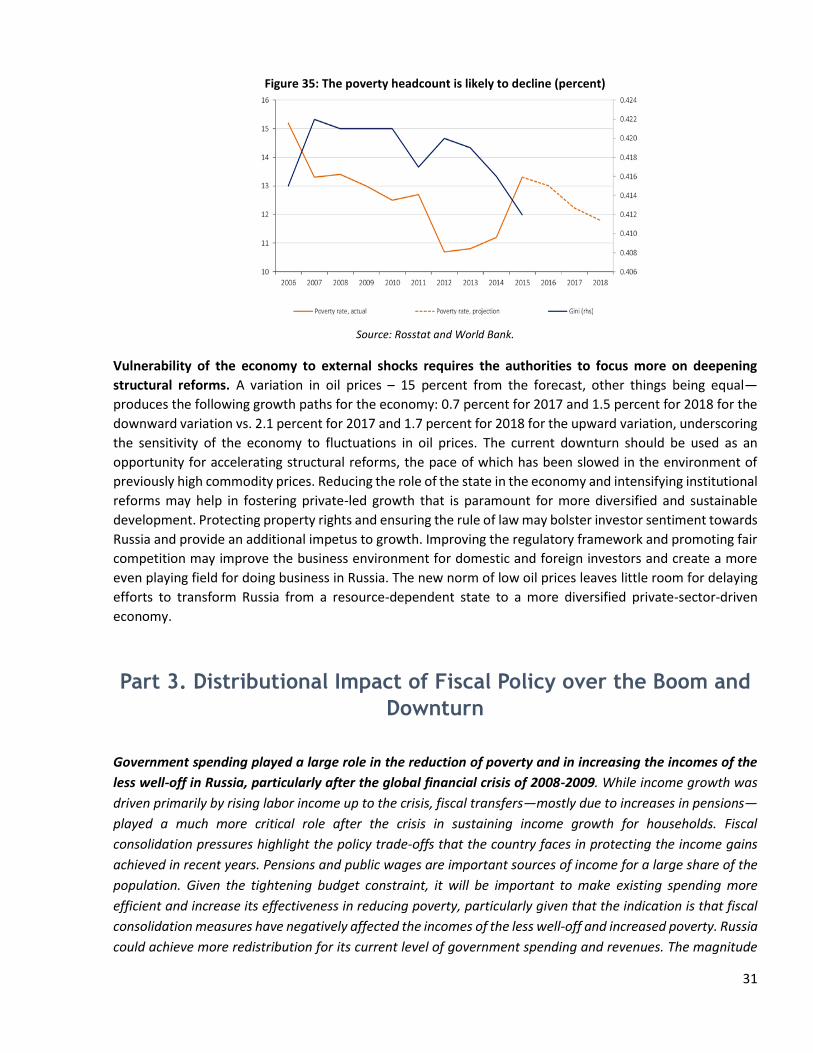
31
Figure 35: The poverty headcount is likely to decline (percent)
Source: Rosstat and World Bank.
Vulnerability of the economy to external shocks requires the authorities to focus more on deepening
structural reforms. A variation in oil prices – 15 percent from the forecast, other things being equal—
produces the following growth paths for the economy: 0.7 percent for 2017 and 1.5 percent for 2018 for the
downward variation vs. 2.1 percent for 2017 and 1.7 percent for 2018 for the upward variation, underscoring
the sensitivity of the economy to fluctuations in oil prices. The current downturn should be used as an
opportunity for accelerating structural reforms, the pace of which has been slowed in the environment of
previously high commodity prices. Reducing the role of the state in the economy and intensifying institutional
reforms may help in fostering private-led growth that is paramount for more diversified and sustainable
development. Protecting property rights and ensuring the rule of law may bolster investor sentiment towards
Russia and provide an additional impetus to growth. Improving the regulatory framework and promoting fair
competition may improve the business environment for domestic and foreign investors and create a more
even playing field for doing business in Russia. The new norm of low oil prices leaves little room for delaying
efforts to transform Russia from a resource-dependent state to a more diversified private-sector-driven
economy.
Part 3. Distributional Impact of Fiscal Policy over the Boom and
Downturn
Government spending played a large role in the reduction of poverty and in increasing the incomes of the
less well-off in Russia, particularly after the global financial crisis of 2008-2009. While income growth was
driven primarily by rising labor income up to the crisis, fiscal transfers—mostly due to increases in pensions—
played a much more critical role after the crisis in sustaining income growth for households. Fiscal
consolidation pressures highlight the policy trade-offs that the country faces in protecting the income gains
achieved in recent years. Pensions and public wages are important sources of income for a large share of the
population. Given the tightening budget constraint, it will be important to make existing spending more
efficient and increase its effectiveness in reducing poverty, particularly given that the indication is that fiscal
consolidation measures have negatively affected the incomes of the less well-off and increased poverty. Russia
could achieve more redistribution for its current level of government spending and revenues. The magnitude
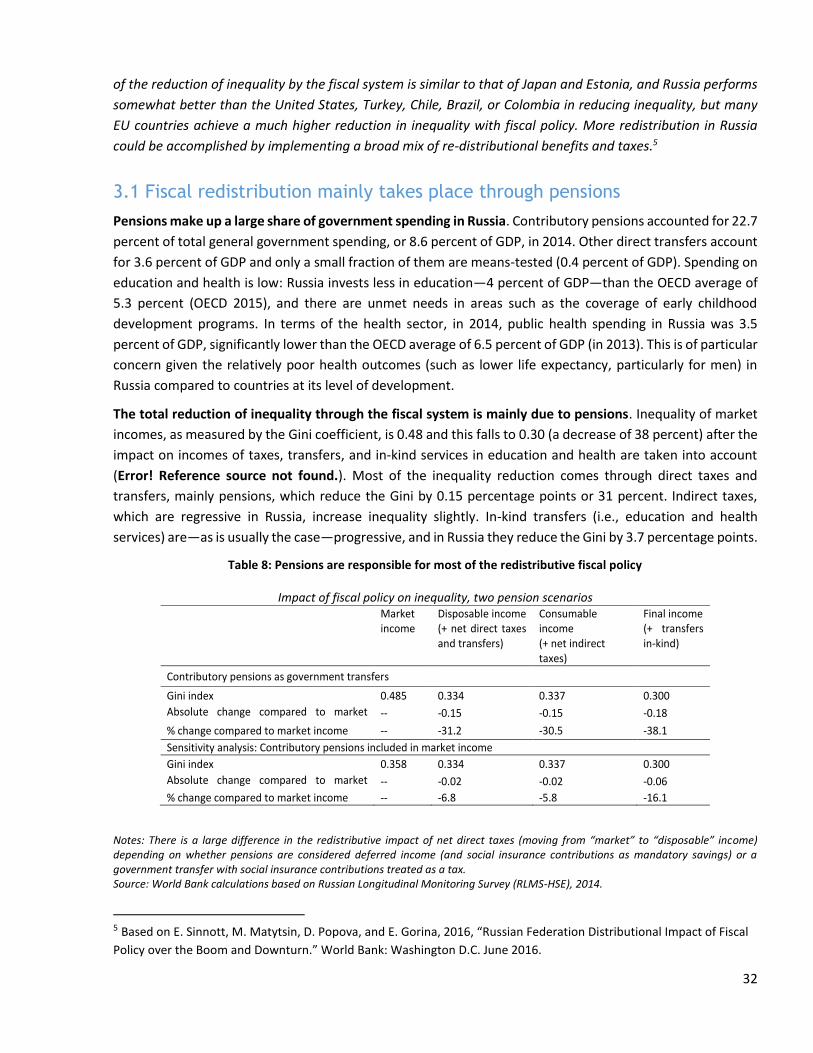
32
of the reduction of inequality by the fiscal system is similar to that of Japan and Estonia, and Russia performs
somewhat better than the United States, Turkey, Chile, Brazil, or Colombia in reducing inequality, but many
EU countries achieve a much higher reduction in inequality with fiscal policy. More redistribution in Russia
could be accomplished by implementing a broad mix of re-distributional benefits and taxes.5
3.1 Fiscal redistribution mainly takes place through pensions
Pensions make up a large share of government spending in Russia. Contributory pensions accounted for 22.7
percent of total general government spending, or 8.6 percent of GDP, in 2014. Other direct transfers account
for 3.6 percent of GDP and only a small fraction of them are means-tested (0.4 percent of GDP). Spending on
education and health is low: Russia invests less in education—4 percent of GDP—than the OECD average of
5.3 percent (OECD 2015), and there are unmet needs in areas such as the coverage of early childhood
development programs. In terms of the health sector, in 2014, public health spending in Russia was 3.5
percent of GDP, significantly lower than the OECD average of 6.5 percent of GDP (in 2013). This is of particular
concern given the relatively poor health outcomes (such as lower life expectancy, particularly for men) in
Russia compared to countries at its level of development.
The total reduction of inequality through the fiscal system is mainly due to pensions. Inequality of market
incomes, as measured by the Gini coefficient, is 0.48 and this falls to 0.30 (a decrease of 38 percent) after the
impact on incomes of taxes, transfers, and in-kind services in education and health are taken into account
(Error! Reference source not found.). Most of the inequality reduction comes through direct taxes and
transfers, mainly pensions, which reduce the Gini by 0.15 percentage points or 31 percent. Indirect taxes,
which are regressive in Russia, increase inequality slightly. In-kind transfers (i.e., education and health
services) are—as is usually the case—progressive, and in Russia they reduce the Gini by 3.7 percentage points.
Table 8: Pensions are responsible for most of the redistributive fiscal policy
Impact of fiscal policy on inequality, two pension scenarios
Notes: There is a large difference in the redistributive impact of net direct taxes (moving from “market” to “disposable” income) depending on whether pensions are considered deferred income (and social insurance contributions as mandatory savings) or a government transfer with social insurance contributions treated as a tax. Source: World Bank calculations based on Russian Longitudinal Monitoring Survey (RLMS-HSE), 2014.
5 Based on E. Sinnott, M. Matytsin, D. Popova, and E. Gorina, 2016, “Russian Federation Distributional Impact of Fiscal
Policy over the Boom and Downturn.” World Bank: Washington D.C. June 2016.
Market income
Disposable income (+ net direct taxes and transfers)
Consumable income (+ net indirect taxes)
Final income (+ transfers in-kind)
Contributory pensions as government transfers
Gini index 0.485 0.334 0.337 0.300
Absolute change compared to market income
-- -0.15 -0.15 -0.18
% change compared to market income -- -31.2 -30.5 -38.1
Sensitivity analysis: Contributory pensions included in market income
Gini index 0.358 0.334 0.337 0.300
Absolute change compared to market income
-- -0.02 -0.02 -0.06
% change compared to market income -- -6.8 -5.8 -16.1
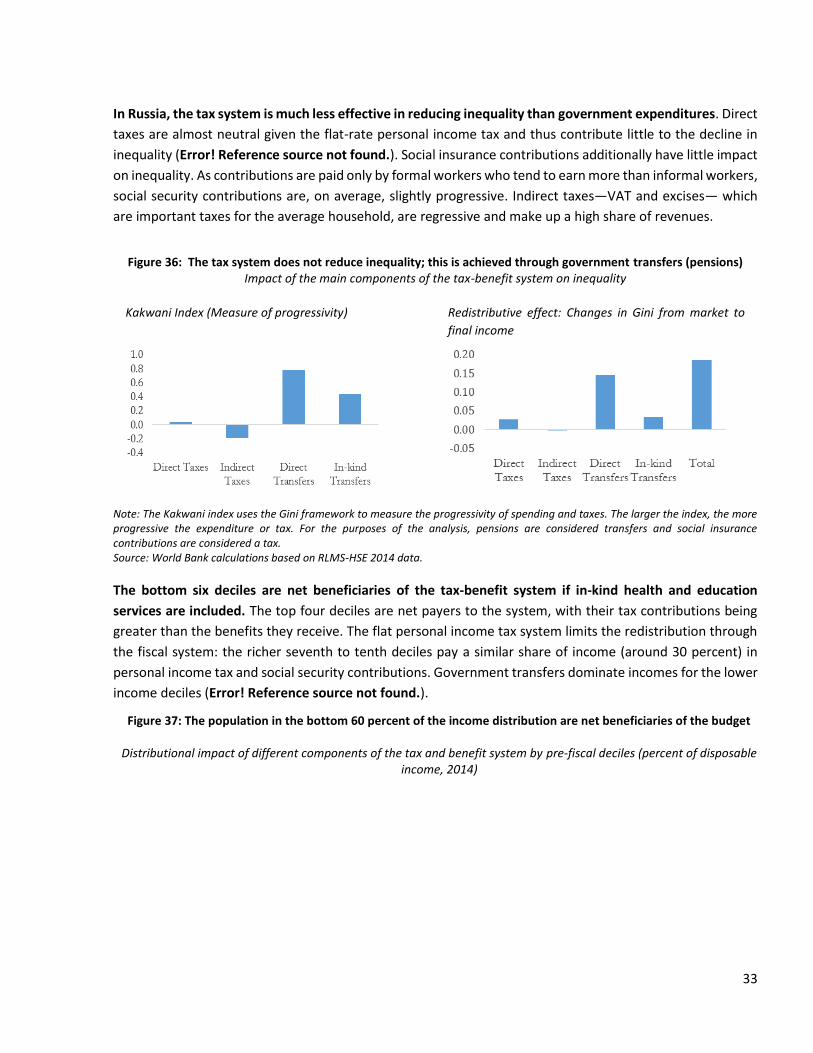
33
In Russia, the tax system is much less effective in reducing inequality than government expenditures. Direct
taxes are almost neutral given the flat-rate personal income tax and thus contribute little to the decline in
inequality (Error! Reference source not found.). Social insurance contributions additionally have little impact
on inequality. As contributions are paid only by formal workers who tend to earn more than informal workers,
social security contributions are, on average, slightly progressive. Indirect taxes—VAT and excises— which
are important taxes for the average household, are regressive and make up a high share of revenues.
Figure 36: The tax system does not reduce inequality; this is achieved through government transfers (pensions)
Impact of the main components of the tax-benefit system on inequality
Kakwani Index (Measure of progressivity) Redistributive effect: Changes in Gini from market to
final income
Note: The Kakwani index uses the Gini framework to measure the progressivity of spending and taxes. The larger the index, the more progressive the expenditure or tax. For the purposes of the analysis, pensions are considered transfers and social insurance contributions are considered a tax. Source: World Bank calculations based on RLMS-HSE 2014 data.
The bottom six deciles are net beneficiaries of the tax-benefit system if in-kind health and education
services are included. The top four deciles are net payers to the system, with their tax contributions being
greater than the benefits they receive. The flat personal income tax system limits the redistribution through
the fiscal system: the richer seventh to tenth deciles pay a similar share of income (around 30 percent) in
personal income tax and social security contributions. Government transfers dominate incomes for the lower
income deciles (Error! Reference source not found.).
Figure 37: The population in the bottom 60 percent of the income distribution are net beneficiaries of the budget
Distributional impact of different components of the tax and benefit system by pre-fiscal deciles (percent of disposable income, 2014)
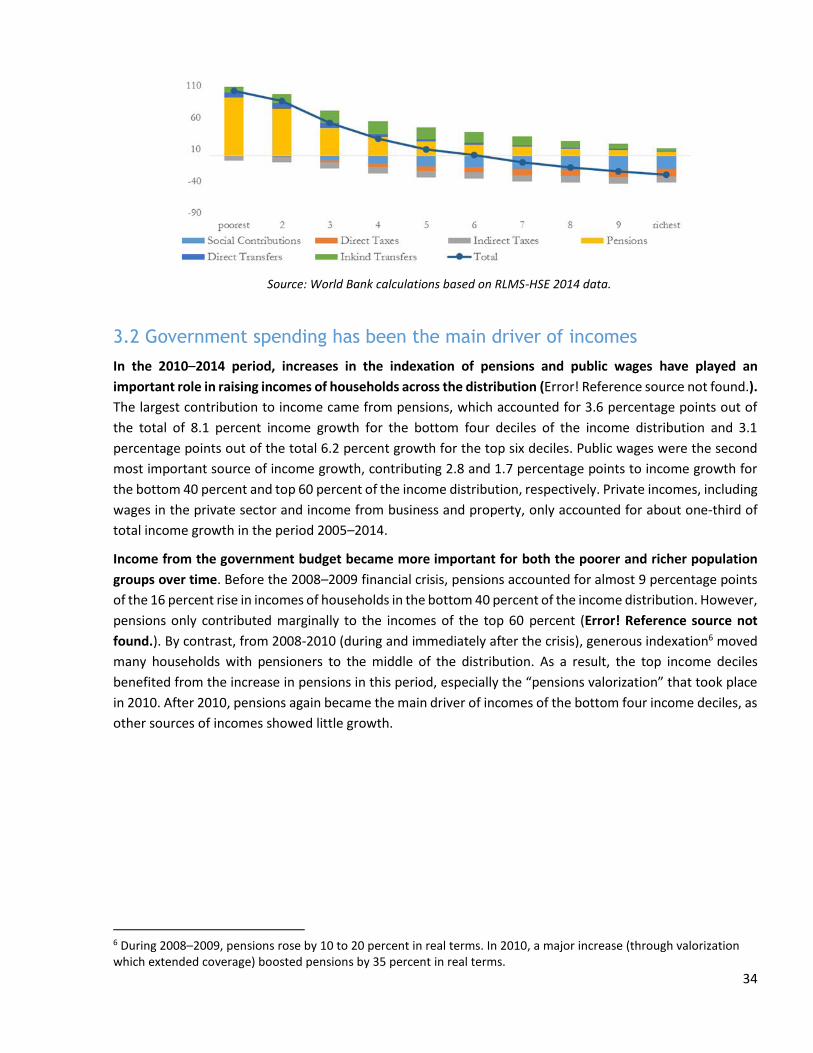
34
Source: World Bank calculations based on RLMS-HSE 2014 data.
3.2 Government spending has been the main driver of incomes
In the 2010–2014 period, increases in the indexation of pensions and public wages have played an
important role in raising incomes of households across the distribution (Error! Reference source not found.).
The largest contribution to income came from pensions, which accounted for 3.6 percentage points out of
the total of 8.1 percent income growth for the bottom four deciles of the income distribution and 3.1
percentage points out of the total 6.2 percent growth for the top six deciles. Public wages were the second
most important source of income growth, contributing 2.8 and 1.7 percentage points to income growth for
the bottom 40 percent and top 60 percent of the income distribution, respectively. Private incomes, including
wages in the private sector and income from business and property, only accounted for about one-third of
total income growth in the period 2005–2014.
Income from the government budget became more important for both the poorer and richer population
groups over time. Before the 2008–2009 financial crisis, pensions accounted for almost 9 percentage points
of the 16 percent rise in incomes of households in the bottom 40 percent of the income distribution. However,
pensions only contributed marginally to the incomes of the top 60 percent (Error! Reference source not
found.). By contrast, from 2008-2010 (during and immediately after the crisis), generous indexation6 moved
many households with pensioners to the middle of the distribution. As a result, the top income deciles
benefited from the increase in pensions in this period, especially the “pensions valorization” that took place
in 2010. After 2010, pensions again became the main driver of incomes of the bottom four income deciles, as
other sources of incomes showed little growth.
6 During 2008–2009, pensions rose by 10 to 20 percent in real terms. In 2010, a major increase (through valorization which extended coverage) boosted pensions by 35 percent in real terms.
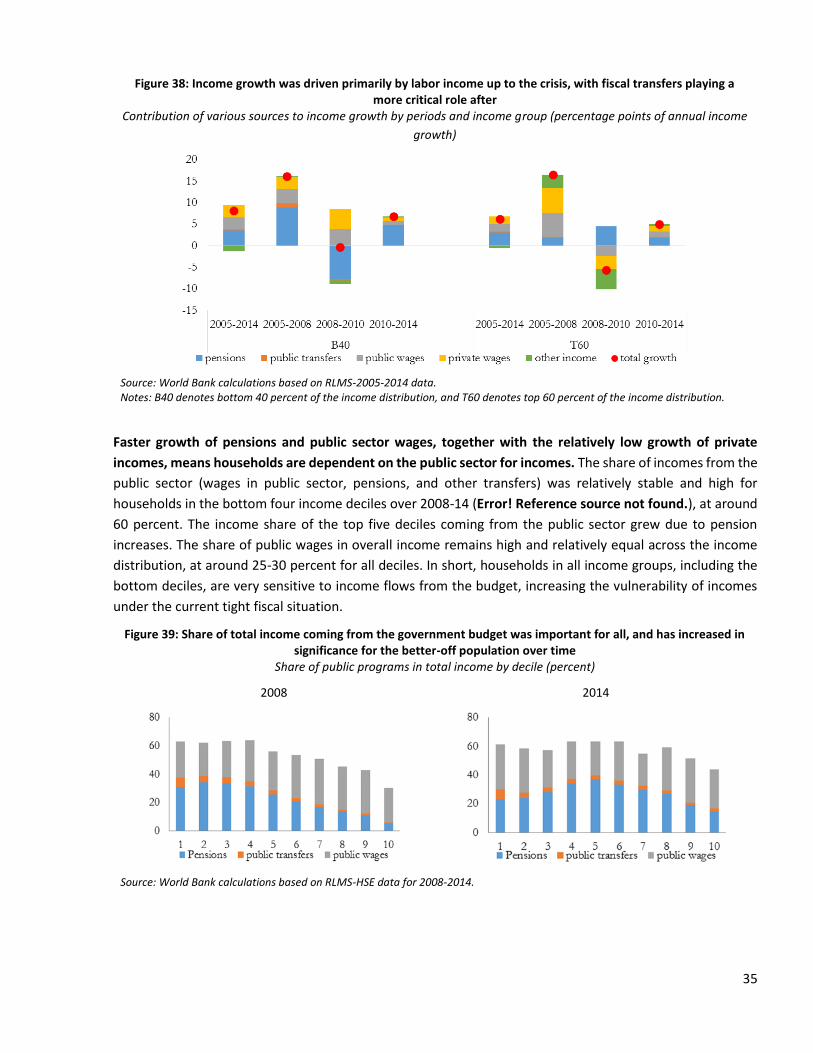
35
Figure 38: Income growth was driven primarily by labor income up to the crisis, with fiscal transfers playing a more critical role after
Contribution of various sources to income growth by periods and income group (percentage points of annual income
growth)
Source: World Bank calculations based on RLMS-2005-2014 data. Notes: B40 denotes bottom 40 percent of the income distribution, and T60 denotes top 60 percent of the income distribution.
Faster growth of pensions and public sector wages, together with the relatively low growth of private
incomes, means households are dependent on the public sector for incomes. The share of incomes from the
public sector (wages in public sector, pensions, and other transfers) was relatively stable and high for
households in the bottom four income deciles over 2008-14 (Error! Reference source not found.), at around
60 percent. The income share of the top five deciles coming from the public sector grew due to pension
increases. The share of public wages in overall income remains high and relatively equal across the income
distribution, at around 25-30 percent for all deciles. In short, households in all income groups, including the
bottom deciles, are very sensitive to income flows from the budget, increasing the vulnerability of incomes
under the current tight fiscal situation.
Figure 39: Share of total income coming from the government budget was important for all, and has increased in significance for the better-off population over time
Share of public programs in total income by decile (percent)
2008 2014
Source: World Bank calculations based on RLMS-HSE data for 2008-2014.
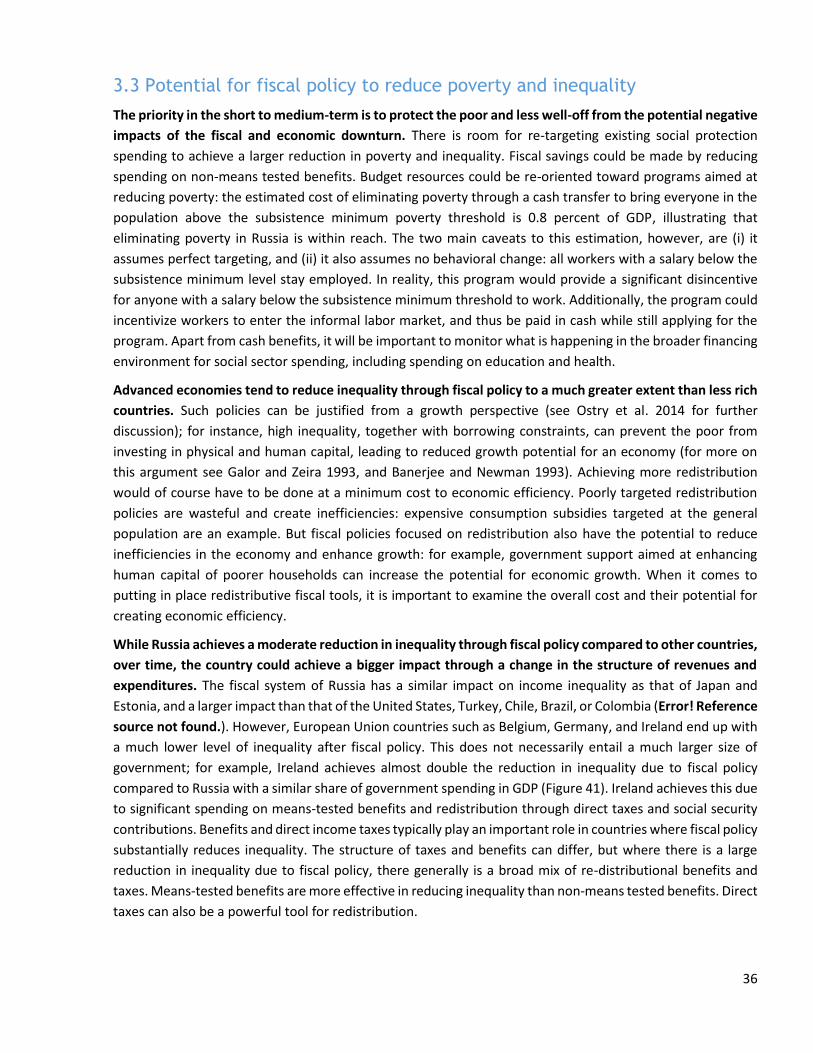
36
3.3 Potential for fiscal policy to reduce poverty and inequality
The priority in the short to medium-term is to protect the poor and less well-off from the potential negative
impacts of the fiscal and economic downturn. There is room for re-targeting existing social protection
spending to achieve a larger reduction in poverty and inequality. Fiscal savings could be made by reducing
spending on non-means tested benefits. Budget resources could be re-oriented toward programs aimed at
reducing poverty: the estimated cost of eliminating poverty through a cash transfer to bring everyone in the
population above the subsistence minimum poverty threshold is 0.8 percent of GDP, illustrating that
eliminating poverty in Russia is within reach. The two main caveats to this estimation, however, are (i) it
assumes perfect targeting, and (ii) it also assumes no behavioral change: all workers with a salary below the
subsistence minimum level stay employed. In reality, this program would provide a significant disincentive
for anyone with a salary below the subsistence minimum threshold to work. Additionally, the program could
incentivize workers to enter the informal labor market, and thus be paid in cash while still applying for the
program. Apart from cash benefits, it will be important to monitor what is happening in the broader financing
environment for social sector spending, including spending on education and health.
Advanced economies tend to reduce inequality through fiscal policy to a much greater extent than less rich
countries. Such policies can be justified from a growth perspective (see Ostry et al. 2014 for further
discussion); for instance, high inequality, together with borrowing constraints, can prevent the poor from
investing in physical and human capital, leading to reduced growth potential for an economy (for more on
this argument see Galor and Zeira 1993, and Banerjee and Newman 1993). Achieving more redistribution
would of course have to be done at a minimum cost to economic efficiency. Poorly targeted redistribution
policies are wasteful and create inefficiencies: expensive consumption subsidies targeted at the general
population are an example. But fiscal policies focused on redistribution also have the potential to reduce
inefficiencies in the economy and enhance growth: for example, government support aimed at enhancing
human capital of poorer households can increase the potential for economic growth. When it comes to
putting in place redistributive fiscal tools, it is important to examine the overall cost and their potential for
creating economic efficiency.
While Russia achieves a moderate reduction in inequality through fiscal policy compared to other countries,
over time, the country could achieve a bigger impact through a change in the structure of revenues and
expenditures. The fiscal system of Russia has a similar impact on income inequality as that of Japan and
Estonia, and a larger impact than that of the United States, Turkey, Chile, Brazil, or Colombia (Error! Reference
source not found.). However, European Union countries such as Belgium, Germany, and Ireland end up with
a much lower level of inequality after fiscal policy. This does not necessarily entail a much larger size of
government; for example, Ireland achieves almost double the reduction in inequality due to fiscal policy
compared to Russia with a similar share of government spending in GDP (Figure 41). Ireland achieves this due
to significant spending on means-tested benefits and redistribution through direct taxes and social security
contributions. Benefits and direct income taxes typically play an important role in countries where fiscal policy
substantially reduces inequality. The structure of taxes and benefits can differ, but where there is a large
reduction in inequality due to fiscal policy, there generally is a broad mix of re-distributional benefits and
taxes. Means-tested benefits are more effective in reducing inequality than non-means tested benefits. Direct
taxes can also be a powerful tool for redistribution.
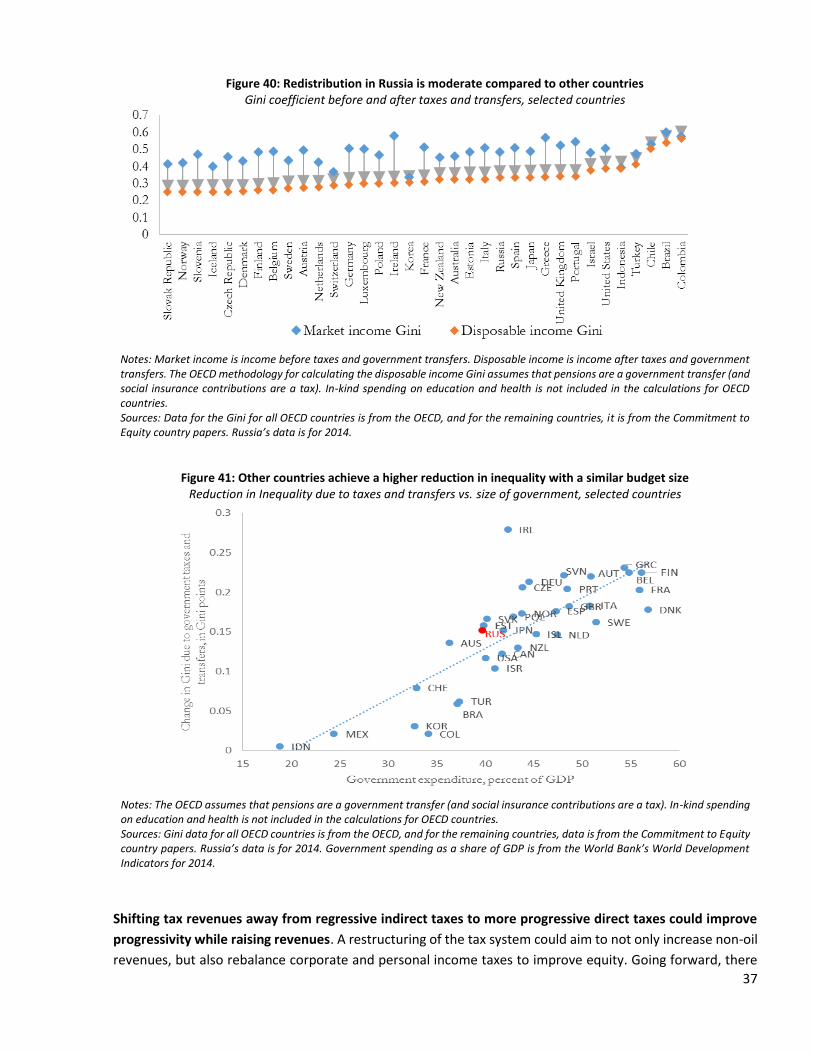
37
Figure 40: Redistribution in Russia is moderate compared to other countries Gini coefficient before and after taxes and transfers, selected countries
Notes: Market income is income before taxes and government transfers. Disposable income is income after taxes and government transfers. The OECD methodology for calculating the disposable income Gini assumes that pensions are a government transfer (and social insurance contributions are a tax). In-kind spending on education and health is not included in the calculations for OECD countries. Sources: Data for the Gini for all OECD countries is from the OECD, and for the remaining countries, it is from the Commitment to Equity country papers. Russia’s data is for 2014.
Figure 41: Other countries achieve a higher reduction in inequality with a similar budget size Reduction in Inequality due to taxes and transfers vs. size of government, selected countries
Notes: The OECD assumes that pensions are a government transfer (and social insurance contributions are a tax). In-kind spending on education and health is not included in the calculations for OECD countries. Sources: Gini data for all OECD countries is from the OECD, and for the remaining countries, data is from the Commitment to Equity country papers. Russia’s data is for 2014. Government spending as a share of GDP is from the World Bank’s World Development Indicators for 2014.
Shifting tax revenues away from regressive indirect taxes to more progressive direct taxes could improve
progressivity while raising revenues. A restructuring of the tax system could aim to not only increase non-oil
revenues, but also rebalance corporate and personal income taxes to improve equity. Going forward, there
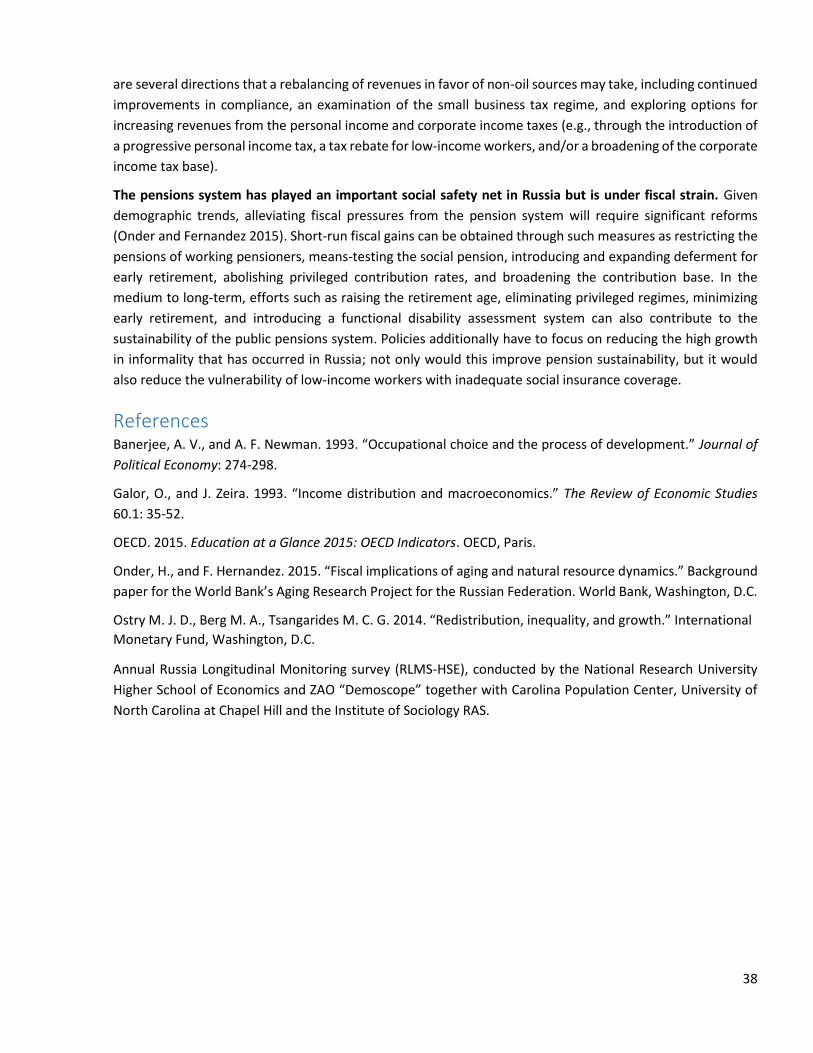
38
are several directions that a rebalancing of revenues in favor of non-oil sources may take, including continued
improvements in compliance, an examination of the small business tax regime, and exploring options for
increasing revenues from the personal income and corporate income taxes (e.g., through the introduction of
a progressive personal income tax, a tax rebate for low-income workers, and/or a broadening of the corporate
income tax base).
The pensions system has played an important social safety net in Russia but is under fiscal strain. Given
demographic trends, alleviating fiscal pressures from the pension system will require significant reforms
(Onder and Fernandez 2015). Short-run fiscal gains can be obtained through such measures as restricting the
pensions of working pensioners, means-testing the social pension, introducing and expanding deferment for
early retirement, abolishing privileged contribution rates, and broadening the contribution base. In the
medium to long-term, efforts such as raising the retirement age, eliminating privileged regimes, minimizing
early retirement, and introducing a functional disability assessment system can also contribute to the
sustainability of the public pensions system. Policies additionally have to focus on reducing the high growth
in informality that has occurred in Russia; not only would this improve pension sustainability, but it would
also reduce the vulnerability of low-income workers with inadequate social insurance coverage.
References Banerjee, A. V., and A. F. Newman. 1993. “Occupational choice and the process of development.” Journal of
Political Economy: 274-298.
Galor, O., and J. Zeira. 1993. “Income distribution and macroeconomics.” The Review of Economic Studies
60.1: 35-52.
OECD. 2015. Education at a Glance 2015: OECD Indicators. OECD, Paris.
Onder, H., and F. Hernandez. 2015. “Fiscal implications of aging and natural resource dynamics.” Background
paper for the World Bank’s Aging Research Project for the Russian Federation. World Bank, Washington, D.C.
Ostry M. J. D., Berg M. A., Tsangarides M. C. G. 2014. “Redistribution, inequality, and growth.” International
Monetary Fund, Washington, D.C.
Annual Russia Longitudinal Monitoring survey (RLMS-HSE), conducted by the National Research University
Higher School of Economics and ZAO “Demoscope” together with Carolina Population Center, University of
North Carolina at Chapel Hill and the Institute of Sociology RAS.