Embed Size (px)
Citation preview

Russia Economic Report No. 34 I September 2015
Balancing Economic Adjustment and Transformation

Acknowledgements
This report is produced twice a year by World Bank economists in the Macroeconomics and Fiscal Management Global Practice. The team that prepared this edition was led by Birgit Hansl (Lead Economist and Program Leader in Russia, [email protected]) and consisted of Sergei Ulatov (Senior Economist), Olga Emelyanova (Research Analyst), Mikhail Matytsin (Consultant), John Pollner (Lead Financial Officer), Ekaterine Vashkamadze (Senior Economist), John Baffes (Senior Economist), Juan Chavez (Consultant), and Irina Rostovtseva (Team Assistant). Birgit Hansl authored the focus note on the fiscal implications of an aging population and a shrinking resource sector based on a World Bank paper by Harun Onder (Senior Economist) and Fernando Hernandez (Lead Economist) titled Fiscal Implications of Aging and Natural Resource Dynamics. Peer reviewers included Catriona Purfield (Lead Economist), Christos Kostopoulos (Lead Economist), and Praveen Kumar (Lead Economist). The report was edited by Sean Lothrop (Сonsultant), and the graphic designer was Robert Waiharo (Сonsultant). The team would like to thank Cyril Muller (Vice President of the Europe and Central Asia Region), Hans Timmer (Chief Economist of the Europe and Central Asia Region), Andras Horvai (Country Director for Russia), Miria Pigato (Practice Manager, Macroeconomics and Fiscal Management Global Practice), the Russia team at the European Bank for Development and Reconstruction, and the IMF Russia team for their advice and support.

Content Abbreviations and Acronyms ............................................................................... i
Executive Summary ........................................................................................ ii
Part 1. Recent Economic Developments – Weathering the Storm ............................... 1
1.1. Growth ............................................................................................ 2
1.2. Balance of Payments ............................................................................ 9
1.3. Monetary Policy and the Financial Sector ................................................... 13
1.4. The Government Budget ....................................................................... 16
1.5. Income and Poverty Trends ................................................................... 21
Part 2. Outlook – High Uncertainty Prevails ....................................................... 27
2.1. Growth and Poverty Dynamics .................................................................. 28
2.2. Risks and Policy Challenges ...................................................................... 37
Part 3. Russia’s Dual Transformation - The Fiscal Implications of an Aging Population and
the Diminishing Economic Role of the Natural Resource Sector ................................... 41
3.1. The Demographic Challenge .................................................................. 42
3.2. The Growth Implications of Demographic Trends .......................................... 43
3.3. The Fiscal Implications of Russia’s Aging Population ...................................... 46
3.4. Can Russia’s Natural Resource Sector Mitigate the Fiscal Implications of an Aging
Population? .............................................................................................. 52
3.5. References ....................................................................................... 54
Annex 3-1: Russia’s Fiscal Rule and Savings from Natural Resource Revenues ................ 54
Annex: Main Macroeconomic Indicators ................................................................ 56
List of figures
Figure 1-1: GDP Growth, y-o-y, Percent ................................................................ 2
Figure 1-2: Demand Composition of GDP Growth ...................................................... 2
Figure 1-3: Global Industrial Production and Trade Growth ......................................... 3
Figure 1-4: Gross Capital Flows to Developing ......................................................... 3
Figure 1-5: Global Energy Prices ......................................................................... 4
Figure 1-6: Growth in Crude Oil Supply ................................................................. 4
Figure 1-7: Gross Domestic Income Growth, y-o-y, Percent ......................................... 5
Figure 1-8: Quarterly GDP Growth, y-o-y and q-o-q sa, Percent .................................... 5
Figure 1-9: Business Confidence Surveys in Manufacturing ........................................... 6
Figure 1-10: Key Constrains to Manufacturing, Rosstat Business Survey, Percent ................ 6
Figure 1-11: Real Effective Exchange Rate and Oil Price (Brent), Q4 2007 = 100 ................. 7

Figure 1-12: Fixed Investment Growth by Sector, H1 2015, y-o-y, Percent ....................... 8
Figure 1-13: Employment Growth by Sector, H1 2015, y-o-y*, Percent, ........................... 8
Figure 1-14: Growth in Tradables, Value-Added, y-o-y, Percent, ................................... 8
Figure 1-15: Contribution to GDP Growth ............................................................... 8
Figure 1-16: The Current-Account Balance ............................................................. 9
Figure 1-17: The Overall Trade Balance, the Services Trade Balance, the Investment Income
Balance, and Oil Prices .................................................................................... 9
Figure 1-18: External Debt Stock, US$ billions ........................................................ 10
Figure 1-19: CDS Spreads for 5-Year Bonds ............................................................ 10
Figure 1-20: Remittance Outflows, Q1-2015 .......................................................... 11
Figure 1-21: Remittance Inflows, Q1-2015 ............................................................. 11
Figure 1-22: Net Capital Flows in the Banking Sector, Billion US$ ................................. 11
Figure 1-23: Net Capital Flows in the Non-Banking Sector, Billion US$ ........................... 11
Figure 1-24: CPI Inflation Components, y-o-y, Percent .............................................. 13
Figure 1-25: Central Bank Key Policy Rate............................................................. 13
Figure 1-26: Oil Prices and Ruble Exchange Rate ..................................................... 14
Figure 1-27: Credit Growth, y-o-y, Percent ........................................................... 15
Figure 1-28: Profitability and Credit Risk, Percent ................................................... 15
Figure 1-29: Federal Budget Revenue and Budget Balances, 2007-2015, Percent of GDP ...... 16
Figure 1-30: Primary Federal Budget Expenditures, 2014, Percent of GDP ....................... 16
Figure 1-31: The Anti-crisis Plan by Expenditure Category, Billion rubles ........................ 19
Figure 1-32: The Anti-crisis Plan by Financing Sources, Billion rubles ............................. 19
Figure 1-33: Contribution to Real Wage Growth, y-o-y, Percent ................................... 22
Figure 1-34: Real Wage Growth by Sector, y-o-y, Percent .......................................... 22
Figure 1-35: Beveridge Curve ............................................................................ 23
Figure 1-36: Employment and Economic Activity Rates, Percent .................................. 23
Figure 1-37: Foreign Citizens Residing in the Russian Federation as of August 2015 ............ 23
Figure 1-38: Social Expenditures, Percent of GDP .................................................... 24
Figure 1-39: Contribution to Overall Real Income Growth, y-o-y, Percent ....................... 24
Figure 1-40: Credit Growth to Households and Household Savings Rates ......................... 24
Figure 1-41: Real Income Growth by Income Quartiles, y-o-y, Percent ........................... 25
Figure 1-42: Population Shares by Income Level and the Size of the Middle Class, Percent ... 25
Figure 1-43: Poverty Rate by Regions, 2014, Percent ................................................ 26
Figure 2-1: Real GDP Growth Projection, y-o-y, Percent ............................................ 28
Figure 2-2: Real GDP Projection, Percent, 2012=100 ................................................ 28
Figure 2-3: Global Oil Spare Capacity and Inventories ............................................... 31
Figure 2-4: The Growth of Global Oil Demand, ....................................................... 31
Figure 2-5 Poverty Rate Projections, Percent ......................................................... 32
Figure 3-1: Population Dynamics in the Russian Federation, 1970–2050 .......................... 42
Figure 3-2: Baseline Trajectories and Projection Boundaries ....................................... 46
Figure 3-3: Baseline Revenue Trajectories and Projection Boundaries ............................ 48
Figure 3-4: Baseline Trajectories and Projection Boundaries: Primary Expenditure ............ 49
Figure 3-5: Fiscal Sustainability Indicators ............................................................ 51

List of tables
Table 1-1: Contribution to Growth by Demand Components, Percentage Points ................. 7
Table 1-2: Balance of Payments, 2010-2015, Billion US$ ............................................ 12
Table 1-3: Net Capital Flows, 2010 -2015, Billion US$ ............................................... 12
Table 1-4: Russia’s External Debt Stock, 2013-2015, Billion US$ ................................... 12
Table 1-5: Russia’s External Debt Service Schedule, 2015-2017, Billion US$ ..................... 12
Table 1-6: The Federal Budget of 2013-2015, Percent of GDP ..................................... 17
Table 1-7: The Consolidated Budget of 2012-2015, Percent of GDP ............................... 21
Table 1-8: Poverty Trends, 2010-2015 ................................................................. 25
Table 2-1: Global GDP Growth, Percent ............................................................... 29
Table 2-2: Economic Indicators, Baseline Scenario ................................................... 33
Table 2-3: Economic Indicators, Lower-Bound Scenario ............................................. 35
Table 2-4: Economic Indicators, Upper-Bound Oil Scenario ......................................... 37
Table 3-1: Marginal Effects of Labor Productivity, Oil Prices, and Labor Policies on Baseline GDP
............................................................................................................... 45
Table 3-2: Marginal Impacts of Alternative Scenarios on the Baseline Debt-to-GDP Ratio,
Percentage Point Deviation .............................................................................. 52
List of boxes
Box 1-1: Global Economic Trends ........................................................................ 3
Box 1-2: Energy Price Trends ............................................................................. 4
Box 1-3: Trends in Business and Consumer Confidence ............................................... 6
Box 1-4: The Effect of the REER Adjustment on Russia’s Tradable Sector ......................... 8
Box 1-5: Remittance Trends ............................................................................. 11
Box 1-6: Oil Prices and Exchange-Rate Dynamics ..................................................... 14
Box 1-7: Amendments to the 2015 Federal Budget ................................................... 17
Box 1-8: The Government Anti-crisis Plan and its Implementation ................................ 18
Box 1-9: Russia’s Fiscal Rule ............................................................................. 20
Box 1-10: Labor Market Trends .......................................................................... 22
Box 1-11: Channels of Fiscal Income Support for Lower-income Households ..................... 24
Box 2-1: The Global Economic Outlook................................................................. 29
Box 2-2: Global Oil-Price Forecasts ..................................................................... 31
Box 2-3: Financial Market Restructuring Options ..................................................... 39
Box 3-1: The Chilean Experience with Fiscal Rules and Financing Social Security Liabilities .. 53

i
Abbreviations and Acronyms
CA Current Account
CBR Central Bank of Russia
CDS Credit Default Swap
CIS Commonwealth of Independent States
CPI Consumer Price Index
ECA Europe and Central Asia
EU European Union
FDI Foreign Direct Investment
GDP Gross Domestic Product
LFP Labor-Force Participation
NPL Nonperforming Loan
NWF National Welfare Fund
OECD Organization for Economic Cooperation and Development
OPEC Organization of the Petroleum Exporting Countries
PMI Purchasing Managers Index
REER Real Effective Exchange Rate

ii
Executive Summary
Russia’s recession deepened in the first half of 2015 with a severe impact on households.
The economy continues to adjust to the 2014 terms-of-trade shock amid a tense geopolitical
context marked by ongoing international sanctions. Oil and gas prices remained low through
the first half of 2015, further underscoring Russia’s vulnerability to volatile global commodity
markets. The weakening of the ruble created a price advantage for some industries, boosting a
narrow range of exports and encouraging investment in a certain sectors, but this was not
sufficient to generate an overall increase in non-energy exports. Investment demand continued
to contract for a third consecutive year. Economic policy uncertainty arising from an
unpredictable geopolitical situation and the continuation of the sanctions regime caused
private investment to decline rapidly as capital costs rose and consumer demand evaporated.
The record drop in consumer demand was driven by a sharp contraction in real wages, which
fell by an average of 8.5 percent in the first six months of 2015, illustrating the severity of the
recession. However, the deterioration of real wages was also the primary mechanism through
which the labor market adjusted to lower demand, and unemployment increased only slightly
from 5.3 percent in 2014 to 5.6 percent in the first half of 2015. The erosion of real income
significantly increased the poverty rate and exacerbated the vulnerability of households in the
lower 40 percent of the income distribution.
The policy response by the authorities successfully stabilized the economy. The transition
to a free-floating exchange rate allowed imports to adjust to a 17 percent depreciation in the
real effective exchange rate during the first half of 2015, strengthening the current-account
balance. Meanwhile, measures to support the financial sector appear to have contained
systemic risks, and there are early signs of stabilization. Nevertheless, the pass-through effect
of the December 2014 depreciation boosted inflation to levels not seen since 2002. Even as the
recession deepened in the first half of 2015 controlling inflation became the central bank’s
main policy challenge. Low oil prices continue to put downward pressure on federal revenue,
ushering in a period of difficult fiscal consolidation. Real public spending is expected to fall by
5 percent in 2015, notwithstanding a temporary increase in the first half of the year caused by
frontloaded expenditures as part of the government’s anti-crisis plan to cushion some of the
fiscal consolidation impact. Falling oil revenues constrained the government’s ability to counter
the decline in real income, and nominal increases in pensions and social benefits were below
the headline inflation rate. This accelerated an already troubling rise in the poverty rate, which
climbed from 13.1 percent in the first half of 2014 to 15.1 percent in the first half of 2015.
Adverse external conditions pose a serious challenge to short-term growth prospects. Yet,
high policy uncertainty prevails and the country’s outlook hinges not only on the evolution of
external factors but also on its internal capacity to adapt to an increasingly difficult macro-
fiscal context. The World Bank’s baseline scenario anticipates contractions of 3.8 percent in
2015 and 0.6 percent in 2016 before the economy recovers to a modest growth rate of 1.5
percent in 2017. Given serious concerns regarding oil-price volatility, compounded by major
downside risks to the global economic outlook, this report presents upper-bound and lower-
bound oil price scenarios along with the baseline. In the lower-bound scenario, in which oil

iii
prices fall well below the baseline projection, real GDP could contract by as much as 4.3
percent in 2015 and by another 2.8 percent in 2016, followed by zero growth in 2017. Even in
the upper-bound scenario, in which oil prices recover, real GDP would still contract by 3.1
percent in 2015 before growing by 1.3 percent in 2016 and 1.7 percent in 2017. For projection
purposes all three scenarios assume that sanctions will remain in force. Due to the severity of
the projected contraction and the vulnerability of lower-income households to economic
shocks, poverty rates are projected to increase sharply in all three scenarios.
The macro-fiscal adjustment heightens risks to financial stability and fiscal sustainability.
Measures to support financial sector stability will need to be managed carefully and with
continuous monitoring, as declining asset values in Russia’s overcrowded financial sector may
continue to expose weaknesses in bank balance sheets. The emergency measures implemented
by the government and the central bank provide short-term relief, yet these measures are also
keeping systemic risks elevated, and additional financial-market restructuring is warranted.
Monetary policy successfully prevented costly delays in relative price adjustments, highlighting
the importance of the central bank’s commitment to inflation targeting in the context of a
flexible exchange-rate regime. Maintaining fiscal sustainability will become an especially
pressing challenge as low oil prices deplete fiscal buffers, and this will necessitate difficult
policy choices during the revision of the 2016 budget proposal. Expenditure priorities will need
to be reassessed, and a renewed discussion of prospective adjustments to the fiscal rule is
anticipated. Longer-term fiscal sustainability issues will arise from a combination of major
demographic changes and the diminishing relative importance of the natural resource sector,
which will continue to drive the profound structural transformation of the Russian economy.
Economic policy should support the economic transformation that began in 2014. Russian
policymakers are confronted with complex challenges posed by the short-term economic
adjustment to external changes coupled with major internal long-term shifts in its society and
economy. In the short-to-medium term, Russia’s changing external environment will continue
to alter the internal structure of its economy. While adapting to relative price changes and the
reallocation of productive factors to new sectors is a difficult process, policies that facilitate
Russia’s economic transformation could have lasting positive effects. Facilitating structural
change will be especially critical as Russia strives to cope in the long-term with a simultaneous
demographic and economic transformation driven by a rapidly aging and shrinking population
and by the diminishing relative importance of the natural resource sector. Successfully
addressing these challenges will require a combination of fiscal discipline, regulatory restraint
and institutional capacity building, while resisting pressure to adopt policies that may
temporarily mitigate the disruptive effects of the adjustment process at the expense of long-
term growth. In the short-term, strong signals indicating the government’s commitment to
regulatory discipline and to policies that facilitate the macroeconomic adjustment process
would speed up the recovery of private-sector confidence and promote investment despite tight
financial conditions. Conversely, a failure to adopt sufficiently deep and sustained structural
reforms could leave the country trapped in low-growth equilibrium.

1
Part 1. Recent Economic Developments – Weathering the Storm
Russia’s recession deepened in the first half of this year, as the ongoing contraction in domestic
demand accelerated. The economy continues to ride the waves of the 2014 terms-of-trade
shock and the implications of geopolitical tensions and continuing international sanctions. Oil
and gas prices remained low through the first half of 2015, further underscoring Russia’s
vulnerability to global commodity markets. However, imports adjusted to reflect the
depreciation of the real effective exchange rate, as the Central Bank of Russia successfully
transitioned to a free float, which eased pressure on Russia’s external balances. Meanwhile,
measures to support the financial sector appear to have contained systemic risks, and there
are early signs of stabilization. Nevertheless, the pass-through effect of the December 2014
depreciation boosted inflation to levels not seen since 2002. Despite the deepening recession,
controlling inflation became the central bank’s main policy challenge in the first half of 2015
as double-digit inflation rates eroded real wages and incomes. Real wage and income trends
illustrate the depth of the recession and its negative impact on household consumption, which
has dropped at a record pace. The decline in real wages was also the primary mechanism
through which the labor market adjusted to lower demand, and unemployment increased only
slightly. The decline in real incomes increased poverty rates and exacerbated the vulnerability
of households in the bottom 40 percent of the income distribution.

2
1.1. Growth
Russia’s recession, which officially began in the fourth quarter of 2014, deepened significantly in the first half of this year. Consumer demand dropped at a record pace as double-digit inflation eroded real wages and incomes. Meanwhile, continued policy uncertainty, a weak domestic market, and high capital costs prompted a sharp contraction in investment.
Russia’s worsening recession has highlighted its dependence on oil and gas exports,
widening the gap between Russia and other emerging economies (Figure 1-1). In the first
quarter of 2015 growth dropped from an anemic but positive 0.4 percent to negative 2.2
percent, and in the second quarter the economy contracted at a rate of 4.6 percent. Countries
with close trade or financial ties to Russia are now experiencing adverse spillover effects. Russia
continues to struggle even as the global economy slowly improves, spurred by gradually rising
growth rates in high-income countries (Box 1-1). The continuing recovery in the US and slow
but steady growth in the euro zone boosted the global economy during the second quarter of
2015, though growth remained highly uneven among emerging and developing countries.
Persistently low commodity prices caused growth prospects for commodity exporters and
commodity importers to diverge sharply. After a weak first quarter, oil prices rose marginally
to an average of just over US$62 per barrel in May, yet this rebound appears to have been
temporary, as both supply and demand factors continue to put downward pressure on global oil
prices (Box 1-2).
Figure 1-1: GDP Growth, y-o-y, Percent Figure 1-2: Demand Composition of GDP Growth
Source: OECD. Note: Emerging EU economies include the six central European countries that are members of both the EU and the OECD: Czech Republic, Estonia, Hungary, Poland, Slovak Republic, and Slovenia. Other emerging economies include seven countries: Brazil, China, India, Indonesia, Mexico, South Africa and Turkey. OECD oil exporters include Australia, Canada, Chile, Netherlands, Norway and the United States.
Source: Rosstat. Note: *Q2 2015 are World Bank estimates based on official statistics.
-12
-8
-4
0
4
8
12
OECD Oil-exporters RussiaOECD EU EmergingOther Emerging
-25
-20
-15
-10
-5
0
5
10
15
Q1
20
08
Q2
20
08
Q3
20
08
Q4
20
08
Q1
20
09
Q2
20
09
Q3
20
09
Q4
20
09
Q1
20
10
Q2
20
10
Q3
20
10
Q4
20
10
Q1
20
11
Q2
20
11
Q3
20
11
Q4
20
11
Q1
20
12
Q2
20
12
Q3
20
12
Q4
20
12
Q1
20
13
Q2
20
13
Q3
20
13
Q4
20
13
Q1
20
14
Q2
20
14
Q3
20
14
Q4
20
14
Q1
20
15
Q2
20
15
*
Consumption Gross Fixed Capital Formation
Change in inventories Export
Import Stat error
GDP growth

3
Box 1-1: Global Economic Trends
Global growth in the second quarter of 2015 was boosted by a moderate recovery in high-income countries. Following a sluggish first quarter, the US economy expanded by 2.3 percent in the second quarter. The US continues to show signs of an accelerating recovery, and the unemployment rate fell to 5.3 percent in July, its lowest level since April 2008. The US Federal Reserve is expected to begin gradually raising interest rates in the coming months, though the exact timing of any prospective increase remains uncertain. The renewed strength of the dollar could dampen export growth and slow an expected rise in core inflation. Euro zone growth reached 1.5 percent in quarter one and 1.2 percent in quarter two despite the uncertainty surrounding the Greek debt crisis. Albeit modest, this is the euro zone’s best semi-annual growth performance since 2012. Growth was supported by the European Central Bank’s quantitative easing program, which helped improve credit conditions, weakened the euro, and reduced contagion risks associated with Greek debt. Low oil prices and the tapering of fiscal consolidation policies continue to support the euro zone’s recovery.
Growth is expected to slow in major emerging markets and most developing countries. High-frequency indicators suggest that emerging markets’ poor quarter one performance has extended into quarter two. Industrial production in a number of high- and middle-income countries is either struggling to gain momentum (Mexico, South Africa, Indonesia and Malaysia) or slowing (Brazil, Russia, the Philippines, Korea and Thailand). Purchasing Managers Index (PMI) data for July indicate further softness in the global secondary sector (Figure 1-3). A number of oil exporters (Russia, Colombia, Nigeria, Venezuela and Malaysia) are under acute pressure from deteriorating terms of trade, while countries that rely on non-energy commodity exports (Argentina, Indonesia, Chile, Peru, South Africa and Zambia) also face an adverse external environment. By contrast, India’s recovery appears to remain robust, although growth is expected to slow somewhat following an exceptionally strong quarter one. In China, quarter two growth was in line with World Bank projections at 7 percent, year-on-year, as stimulus measures mitigated the slowdown. However, manufacturing activity continued to decelerate; the July PMI deteriorated further, and exports and imports contracted significantly in July—both falling by over 8 percent from a year earlier.
Global financing and exchange-rate pressures are building. Market risk aversion increased as a result of the Greek debt crisis, the collapse of Chinese equity prices, the depreciation of the renminbi, and the persistent weakness of commodity prices, all of which are putting upward pressure on borrowing conditions in emerging markets (Figure 1-4). The EMBI global sovereign bond spread has widened by 40 basis points since mid-May, especially for oil and other commodity exporters. However, the rise in borrowing costs has been more modest than it was during either the oil price collapse in 2014, or the so-called “taper tantrum” in 2013. Currency pressures have intensified. Since June, the currencies of Russia, Colombia, Brazil, Chile and Malaysia have all depreciated by more than 10 percent against the US dollar, due largely to weak commodity prices.
Figure 1-3: Global Industrial Production and Trade Growth
Source: Datastream and World Bank Global Economic Prospects.
Figure 1-4: Gross Capital Flows to Developing Countries, US$ Billions
Source: Dealogic and World Bank Global Economic Prospects.
-25
-20
-15
-10
-5
0
5
10
15
20
Jun-
11
Sep-
11
Dec-
11
Mar
-12
Jun-
12
Sep-
12
Dec-
12
Mar
-13
Jun-
13
Sep-
13
Dec-
13
Mar
-14
Jun-
14
Sep-
14
Dec-
14
Mar
-15
Jun-
15
Developing Industrial ProductionHigh Income Industrial ProductionDeveloping Country ExportsHigh Income Imports
% change, 3m/3m saar
0
10
20
30
40
50
60
70
80
Jul-
13
Sep-1
3
Nov-1
3
Jan-1
4
Mar-
14
May-1
4
Jul-
14
Sep-1
4
Nov-1
4
Jan-1
5
Mar-
15
May-1
5
Jul-
15
Syndicated bank lending Bond issuance New equity issuance

4
Russia’s economy continues to struggle with the impact of the 2014 terms-of-trade shock,
as well as ongoing geopolitical tensions and international sanctions. Domestic demand
continues to contract, and consumption dropped precipitously in the first quarter of 2015. Given
the sustained decline in real wages and household incomes, this trend likely continued through
the second quarter (Figure 1-2). GDP growth trends only tell part of the story of the severity of
the terms-of-trade shocks on households’ incomes and consumption. In fact, terms-of trade
losses are much more severe than GDP contractions in an oil-exporting country such as Russia.
For Russia, terms-of trade losses in 2015 are likely to amount to -6.9 percent, resulting in a
drop in gross domestic income of 10.7 percent (Figure 1-7). Higher income volatility is a typical
feature of oil-exporters and can pose additional challenges for macroeconomic management,
especially if growth slows to significantly lower levels in the long-term. While periods of high
oil prices lead to large cumulative terms-of-trade gains, in times of oil-price drops the terms-
of-trade losses dwarf the slowdown in GDP (ECA Regional Economic Report).
Box 1-2: Energy Price Trends
Low energy prices continued from the first half of 2015 into the third quarter. Oil prices dropped to almost US$40 per barrel in late August, their lowest level since the 2008 financial crisis (Figure 1-5). The decline reflects an oversupplied global market, in part reflecting the resilience of US shale oil production despite large reductions in investment and drilling since October 2014. OPEC oil production continues to climb, rising by almost half a million barrels per day since May. Both Saudi Arabia and Iraq recently reached record production levels at 10.4 and 4.2 million barrels per day, respectively. The multilateral agreement with Iran over its nuclear program, if ratified, could increase Iranian oil exports by 0.5 million barrels per day by 2016. Global oil demand has responded positively to lower prices, and the International Energy Agency projects that demand will grow by 1.6 million barrels per day in 2016, the fastest pace in five years. However, there are concerns that slowing growth in China—the world’s second largest oil consumer—will prolong the surplus. Other sources of downward pressure on oil prices include a strong US dollar and continuously high OECD oil inventories.
Until 2014, the rapid expansion of shale oil production in the United States was offset almost barrel-for-barrel by supply shortfalls in the Middle East and North Africa. The rapid growth of US oil production, combined with the partial resumption of supply from Libya and record output from Iraq, created a glut in the global oil market (Figure 1-6). In the past, a well-supplied oil market would be countered by OPEC—and especially Saudi Arabia, OPEC’s largest producer—which would move to constrain global oil supply. However, in the fall of 2014, OPEC decided not to engage in any form of supply management in order to protect its market share. This decision has led to the largest supply-driven price correction since 1986. Only twice have drops in oil prices of similar magnitude occurred in the recent past: just after the first Gulf War, when supply rebounded following a shock, and during the 2008 financial crisis, as demand among major economies temporarily dropped.
Figure 1-5: Global Energy Prices
Source: World Bank. Note: These are relative prices of different fuels in terms of energy units to ensure comparability.
Figure 1-6: Growth in Crude Oil Supply
Source: World Bank and International Energy Agency.
0
5
10
15
20
25
Jan-00 Jan-02 Jan-04 Jan-06 Jan-08 Jan-10 Jan-12 Jan-14
US$/mmbtu
Coal (Australia)
Crude Oil
Natural Gas (US)
-3
-1
1
3
5
2010Q1 2011Q1 2012Q1 2013Q1 2014Q1 2015Q1
Thou
sand
s Iran
Libya
Syria
Yemen
United States
Net Changes
mb/d, changes since 2010Q4

5
Figure 1-7: Gross Domestic Income Growth, y-o-y, Percent
Figure 1-8: Quarterly GDP Growth, y-o-y and q-o-q sa, Percent
Source: Rosstat, CBR, WITS and World Bank staff calculations.
Source: Rosstat.
Imports dropped sharply during the first half of 2015 as households adjusted to the income
shock, leading to weak domestic consumer and investment demand. The real exchange rate
corrected households’ purchasing power. As a result, net exports began to rise during the first
quarter. Exports also grew, in part supported by the weaker ruble, further boosting net exports.
These trends continued throughout the second quarter. Ultimately, however, the substantial
improvement in net exports only partly offset a sharp contraction in output. Investment was
sharply negative in the first quarter, as firms reduced inventories in response to weaker-than-
expected consumer demand compounded by an uncertain policy environment, ongoing
geopolitical tensions and the international sanctions regime. Tight credit constraints and higher
risk aversion of banks did little to improve the investment conditions. The financial sector
continued its consolidation, and the stalling of the monetary-easing cycle did not sufficiently
lower interest rates. The contraction in investment is estimated to have accelerated during the
second quarter.
Russia’s economy formally entered a recession in the fourth quarter of 2014, with the
seasonally adjusted quarterly growth rate dropping below zero for two consecutive
quarters. The recession deepened in the first half of this year, as seasonally adjusted real GDP
contracted by 2.0 percent in the second quarter, following a 1.6 percent contraction in the
first quarter, and a 0.7 percent contraction in the final quarter of 2014 (Figure 1-8). The
cumulative contraction in Russia’s real GDP in the first half of 2015 is estimated to be -3.5
percent. These quarterly growth trends largely match the projections of the previous Russia
Economic Report No. 33 (April 2015) and are consistent with the current baseline outlook (see
Part II). The leading indicators for domestic demand and economic confidence surveys for the
third quarter suggest a fragile stabilization in economic activity, indicating that the Russian
economy may have hit bottom (Box 1-3). However, further downward adjustments in oil prices
and/or an increase in exchange-rate volatility could delay the return of sustained growth.
In the first quarter, consumption fell at its fastest rate since the 1998 crisis, deepening
Russia’s recession. Meanwhile, inflation rose sharply, eroding real wages and incomes. A high
debt burden and elevated interest rates severely restricted household credit growth, while
continued uncertainty regarding the length of the economic downturn made consumers cautious
about drawing on their savings to compensate for the drop in real income. The government’s
-15
-10
-5
0
5
10
15
20
real GDP growth terms-of-trade effect
0.8
1.2
1.5
1.2 0.9
0.5 0.3
0.0 0.5
0.3
0.4
0.3
0.1
0.4
(0.3)
(0.7)
(1.6)
(2.0)-5
-3
-1
1
3
5
GDP growth, y-o-y GDP growth, q-o-q, sa

6
ability to intervene to support consumption—as it did during the 2008 global financial crisis—
was constrained by tight budgets and diminished fiscal buffers. In 2015, pensions were indexed
far below the headline inflation rate, while the indexation of public wages was put on hold. As
a result, household consumption, which has been the key growth driver in recent years, dropped
by 9.0 percent, year-on-year, in the first quarter. With growth in government consumption near
zero, total consumption dropped by 6.4 percent in the first quarter, cutting 5 percentage points
from overall growth (Table 1-1). High-frequency data indicate no improvement in consumption
trends in the second quarter, and its negative contribution to growth is likely to remain similar
to that observed in quarter one.
Investment demand continued to contract for a third consecutive year despite some front-
loading of public investment in the first quarter. Front-loaded public spending focused on
capital goods, including military equipment. However, increased public investment could not
compensate for an accelerating decline in private investment spurred by economic policy
uncertainty, evaporating consumer demand and limited credit access (Box 1-4), which squeezed
Box 1-3: Trends in Business and Consumer Confidence
Business confidence deteriorated during the first half of 2015 due to weak domestic demand and continued policy uncertainty. Rosstat’s Producer Confidence Index and HSBC’s PMI both indicated that business confidence in the manufacturing sector declined further since last year (Figure 1-9). For example, the Rosstat manufacturing index averaged –6.3 in the first half of 2015, down from –3.3 in the first half of 2014. A similar trend was observed in the resource sector, where the average index dropped from -1.5 to -4.5 over the same period. The Rosstat survey also revealed that weak domestic demand and policy uncertainty were the two most important factors that negatively affected business confidence in the first half of 2015 (Figure 1-10). The importance of policy uncertainty rose sharply in 2015, with about half of all respondents citing it as a significant constraint to doing business, compared to 34 percent in 2014. Both the PMI and the Rosstat surveys continue to rank weak domestic demand as the most frequently cited constraint.
Consumer confidence also sharply deteriorated in the first quarter of 2015, yet it showed signs of rebounding in the second quarter. Rosstat’s consumer confidence index dropped from -11 in the first quarter of 2014 to -32 in the first quarter of 2015, close to the record low of -35 registered in Q1 of 2009. However, consumer confidence improved somewhat in the second quarter, though high-frequency statistics have not yet shown any improvement in consumption. The ruble’s stabilization and appreciation in mid-May and the slowdown in inflation observed since April may have bolstered consumer confidence.
Figure 1-9: Business Confidence Surveys in Manufacturing
Figure 1-10: Key Constrains to Manufacturing, Rosstat Business Survey, Percent
Source: Rosstat and HBSC. Source: Rosstat.

7
corporate profit margins. Falling consumer demand in the first quarter led to a massive
destocking of inventories. As a result, fixed investment contracted by 8.8 percent and gross
capital formation dropped by 28.5 percent. This cut 4 percentage points from overall growth
in quarter one, well above the 1.1 percentage points cut in quarter four of 2014. Fixed-
investment demand is estimated to have decreased further in the second quarter, while the
pace of destocking slowed due to the stabilization of consumer demand.
Table 1-1: Contribution to Growth by Demand Components, Percentage Points
2007 2008 2009 2010 2011 2012 2013 2014 1Q 2015
GDP growth, percent 8.5 5.2 -7.8 4.5 4.3 3.4 1.3 0.6 -2.2
Consumption 7.4 5.7 -2.6 2.6 3.7 4.3 2.7 0.7 -5.0
Households 6.9 5.1 -2.5 3.0 3.4 3.8 2.5 0.7 -5.0
Government 0.5 0.6 -0.1 -0.3 0.3 0.5 0.2 0.0 0.0
Gross capital formation 4.7 2.5 -10.5 5.4 4.7 0.8 -1.8 -1.7 -4.0
Fixed capital investment
3.9 2.2 -3.2 1.3 2.0 0.5 0.2 -0.4 -1.2
Change in stocks 0.8 0.3 -7.2 4.1 2.8 0.3 -2.0 -1.2 -2.8
Exports 2.1 0.2 -1.5 2.0 0.1 0.3 1.4 0.0 1.4
Imports -5.5 -3.2 6.7 -5.3 -4.3 -1.9 -0.8 1.8 5.6
Source: Rosstat and World Bank staff calculations.
A sharp contraction in imports and
robust export volume growth
increased the positive contribution
of net exports to GDP, limiting the
first quarter output contraction. The
rapid depreciation of the real
effective exchange rate (REER) was a
major cause of falling domestic
demand and contributed to the 25
percent year-on-year contraction in
imports observed in the first quarter
(Figure 1-11). International sanctions
and Russia’s continued restrictions on
food imports from Western countries,
implemented in August 2014, further
reduced imports. At the same time, the depreciation of the ruble improved export performance
in some sectors (Box 1-4). Exports to countries outside the Commonwealth of Independent
States (CIS) increased in the mining, chemical and machine-building sectors. As a result,
Russia’s total export volume grew by 4.5 percent in the first quarter, year-on-year. Due to the
concurrent decline in imports net exports contributed 7 percentage points to GDP, limiting the
first quarter GDP contraction to 2.2 percent, year-on-year.
Figure 1-11: Real Effective Exchange Rate and Oil Price (Brent), Q4 2007 = 100
Source: CBR and Bloomberg.
50
60
70
80
90
100
110
120
130
140
150
80
85
90
95
100
105
110
115
120
Real Effective Exchange Rate (4Q 2007 = 100)Oil price (Brent), (4Q 2007 = 100)
8
Box 1-4: The Effect of the REER Adjustment on Russia’s Tradable Sector
The positive impact of the ruble’s depreciation on Russia’s tradable sector has been so far limited and uneven. The REER’s sharp drop in the first quarter created a price advantage for the tradable sector. This boosted output and exports in a few selected sectors, spurred investment (Figure 1-12) and marginally increased employment (Figure 1-13). Mineral extraction and chemical production grew significantly, while agricultural output and foodstuff production were supported not only by the depreciation, but also by Russia’s ban on food imports. However, the relative improvement in prices did not significantly impact output or exports for most of Russia’s manufacturing sector, and many of the country’s industrial products remained uncompetitive on international markets. Indeed, overall manufacturing output contracted by 2.0 percent in the first half of 2015, whereas it had grown by 3.5 percent over the same period in 2014 (Figure 1-14). Investment data confirm the limited degree of natural substitution to date in Russia’s tradable sector. Investment increased in the chemicals, rubber, plastics, electronics and machine-building industries, presenting cause for cautious optimism.
Despite the modestly positive effects from the REER adjustment, during the first half of 2015 the tradable sector contributed negatively to growth for the first time since 2009. The decline of the tradable sector trimmed total output by 0.1 percentage points during the first half of 2015. However, a far worse performance by the nontradable sector drove the contraction in GDP, as consumer demand dropped sharply, cutting 3.1 percentage points from overall growth in the first half of the year (Figure 1-15). Retail and wholesale trade—the Russian economy’s largest sector—contracted by 9.3 percent, year-on-year, in the first half of 2015 after growing by an anemic 0.6 percent in the first half of 2014. The financial sector, a key driver of growth in recent years, contracted by 4.5 percent in the first half of 2015 after growing by 11.2 percent during the same period in the previous year.
Figure 1-12: Fixed Investment Growth by Sector, H1 2015, y-o-y, Percent
Source: CBR and Haver Analytics.
Figure 1-13: Employment Growth by Sector, H1 2015, y-o-y*, Percent,
Source: Rosstat, Haver Analytics and World Bank staff calculations. Note: *2015 data includes Crimea, largely explaining the increase in total employment.
Figure 1-14: Growth in Tradables, Value-Added, y-o-y, Percent,
Source: Rosstat.
Figure 1-15: Contribution to GDP Growth by Sector, Percent
Source: Rosstat.
-1.5-1
-0.50
0.51
1.52
2.53
3.5
Sectors average

9
1.2. Balance of Payments
Despite the worsening external environment, Russia’s current account remained in surplus,
and the vulnerability of its balance of payments decreased as imports adjusted to reflect the
depreciation of the REER. Deleveraging continued at a rapid pace as economic sanctions limited
access to international financial markets. However, capital outflows moderated as the private
sector sharply reduced its net acquisition of foreign assets.
Russia’s balance of payments remained stable in the first half of 2015 despite lower
commodity prices and elevated capital outflows. The current-account surplus continued to
improve, nearly doubling from 4.1 percent of GDP (US$37.9 billion) in 2014 to 8 percent of GDP
(US$48.1 billion) in the first half of 2015. Meanwhile, the nonoil current-account deficit
narrowed from 14.4 percent of GDP (US$135.2 billion) to 10.3 percent of GDP (US$61.8 billion),
decreasing the vulnerability of the balance of payments to external shocks (Table 1-2). The
current account was bolstered by a reduction in imports coupled with improvements in the
investment-income balance (Figure 1-16). Although exports grew in real terms, export values
dropped by 30 percent year-on-year in in the first half of 2015 due to lower oil prices. As a
result the trade balance weakened only slightly, falling from US$102.2 billion (10.9 percent of
GDP) in 2014 to US$88.6 billion (14.8 percent of GDP) as the drop in exports was almost
completely offset by a decline in imports (Figure 1-17).
The flexible exchange rate enabled the REER to depreciate by 17.4 percent in the first half
of 2015, prompting a swift downward adjustment in import demand. Due in part to Russia’s
ban on food imports, overall imports decreased by 38 percent, year-on-year, in the first six
months of 2015. However, the depreciation of the REER has thus far failed to generate an
overall increase in non-energy exports. Some non-energy exports to non-CIS countries rose in
real terms (e.g. fertilizer, processed wood, aluminum, machines and equipment, and transport
vehicles), yet the total value of non-energy exports fell to US$72.6 billion in the first half of
2015, down 12 percent from the previous year. The service sector’s trade balance improved,
as service imports (especially tourism) decreased, offsetting a decline in service exports.
Figure 1-16: The Current-Account Balance Percent of GDP
Source: CBR.
Figure 1-17: The Overall Trade Balance, the Services Trade Balance, the Investment Income Balance, and Oil Prices
Source: CBR and Bloomberg.

10
A favorable investment income balance and declining remittance outflows bolstered the
current account. The investment income balance improved due to the continued deleveraging
of external debt (Figure 1-18 and Table 1-3). As long as sanctions on the financial sector are in
place1 access to international capital market will remain limited. Low commodity prices not
only dampen Russia’s growth prospects, they also elevate borrowing costs for Russian firms.
While credit-default swap (CDS) spreads for 5-year bonds decreased from a record 613 points
in February 2015 to 340 at the end of June, they remain much higher than the 170 points
observed at the beginning of 2014 (Figure 1-19). High rates of new borrowing and less debt
rollover are reflected in the decrease in Russia’s external debt stock, which fell from US$762.8
billion (16.2 months of exports) in 2014 to US$556.2 billion (15.3 months of exports) in the first
half of 2015. External government debt declined substantially, dropping from US$57.1 billion
in 2014 to 35 billion at the end of June as non-residents sold off government bonds.2 Banking
sector debt shrank by nearly a third, from US$209 billion to US$149 billion, while non-financial
corporations reduced their debt by about a fifth, from US$450.6 billion to US$361.8 billion. This
massive deleveraging caused the investment-income deficit to narrow by US$12.6 billion to
US$18.5 billion (3.1 percent of GDP) in the first half of 2015, year-on-year. Outbound
remittances dropped sharply due to the depreciation of the ruble and the contraction in
economic output, further improving the current account (Box 1-5).
The moderation of capital outflows in the first half of 2015 led to a small recovery in the
financial account and eased pressure on international reserves. Russia’s financial-account
deficit decreased to US$51.8 billion (8.6 percent of GDP) in the first six months of 2015, down
from US$74.7 billion (8.0 percent of GDP) in the first half of 2014. Despite continued
deleveraging net capital outflows from the private sector slowed to US$52.5 billion (Table 1-4)
in the first half of 2015, down from US$69.4 billion a year earlier, due to a massive decrease in
the net acquisition of foreign assets (Figure 1-22 and Figure 1-23). Some foreign assets were
1 In June 2015, the EU extended its sanctions until end-January 2016. In March 2015, the US extended its sanctions by one year. 2 The government previously cancelled all external borrowing plans for 2014 and 2015, but it now plans to borrow US$7 billion from international markets in 2016 and 2017.
Figure 1-18: External Debt Stock, US$ billions
Source: CBR.
Figure 1-19: CDS Spreads for 5-Year Bonds
Source: Bloomberg.
0
100
200
300
400
500
600
700
800
De
c-1
1
Fe
b-1
2
Ap
r-1
2
Jun
-12
Au
g-1
2
Oct
-12
De
c-1
2
Fe
b-1
3
Ap
r-1
3
Jun
-13
Au
g-1
3
Oct
-13
De
c-1
3
Fe
b-1
4
Ap
r-1
4
Jun
-14
Au
g-1
4
Oct
-14
De
c-1
4
Fe
b-1
5
Ap
r-1
5
Jun
-15
Banks Non-financial corporations State Total debt
0
100
200
300
400
500
600
700
1/2
/20
14
2/2
/20
14
3/2
/20
14
4/2
/20
14
5/2
/20
14
6/2
/20
14
7/2
/20
14
8/2
/20
14
9/2
/20
14
10
/2/2
01
4
11
/2/2
01
4
12
/2/2
01
4
1/2
/20
15
2/2
/20
15
3/2
/20
15
4/2
/20
15
5/2
/20
15
6/2
/20
15
7/2
/20
15
8/2
/20
15
9/2
/20
15

11
shed to service external debt, as financial sanctions and the depreciation of the ruble increased
the cost of debt rollover. However, a modest resurgence in confidence in the ruble may be
curbing this trend. The government’s recent efforts to discourage offshoring,3 along with other
indirect capital-control measures,4 also contributed to the reduction in the acquisition of
foreign assets. Outbound non-banking-sector foreign direct investment (FDI) fell to US$7.3
billion in the first half of 2015, down from US$27.1 billion a year earlier. Meanwhile, households
and the non-banking sector reduced their foreign-exchange cash holdings by US$5.5 billion, a
dramatic shift from the US$13.6 billion increase observed in the first six months of 2014.
3 The de-offshorization law was adopted at the end of 2014. However, several procedures accompanying this law are still being developed, which creates uncertainty for the business community and some companies have already decreased foreign assets acquisition to preempt any risk. 4 For example, the five major oil-exporters had to cut their net foreign assets by March 1 back to the level of October 1, 2014.
Box 1-5: Remittance Trends
The ruble’s depreciation significantly reduced remittance outflows in the first quarter of 2015. Outbound remittances declined by 42 percent, year-on-year, to US$3.38 billion. 73 percent of remittances went to CIS countries, including Uzbekistan (US$634 million), Tajikistan (US$434 million), Ukraine (US$377 million), the Kyrgyz Republic (US$284 million), and Armenia (US$207 million) (Figure 1-20). Remittance inflows during the same period totaled US$1.65 billion, down 5 percent from a year ago. Of these, CIS countries accounted for 34.1 percent of total remittance inflows, led by Kazakhstan (US$215 million) and Uzbekistan (US$105 million) (Figure 1-21).
Figure 1-20: Remittance Outflows, Q1-2015 Figure 1-21: Remittance Inflows, Q1-2015
Source: CBR. Source: CBR.
Figure 1-22: Net Capital Flows in the Banking Sector, Billion US$
Source: CBR.
Figure 1-23: Net Capital Flows in the Non-Banking Sector, Billion US$
Source: CBR.
18.74%
12.83%
11.14%
8.39%6.12%
5.62%
4.58%
3.96%
1.66%
0.09%
26.87% Uzbekistan
Tajikistan
Ukraine
Kyrgyz Republic
Armenia
Moldova
Azerbaijan
Belarus
Kazakhstan
Turkmenistan
Non-CIS
13.06%
6.38%
2.92%
2.86%
2.13%
2.13%
1.76%
1.34%
0.85%0.67%
65.92%
Kazakhstan
Uzbekistan
Kyrgyz Republic
Azerbaijan
Ukraine
Armenia
Tajikistan
Moldova
Belarus
Turkmenistan
Non-CIS
-45
-35
-25
-15
-5
5
15
25
Q4 2013 Q1 2014 Q2 2014 Q3 2014 Q4 2014 Q1 2015 Q2 2015
Banking sector change in FA (- - increase) Banking sector change in NL (+ - increase)
-60
-50
-40
-30
-20
-10
0
10
20
Q4 2013 Q1 2014 Q2 2014 Q3 2014 Q4 2014 Q1 2015 Q2 2015
Non-banking sector change in NL (+ - increase)Non-banking sector change in FA (- - increase)

12
As the exchange rate began to stabilize and external shocks subsided central bank
interventions became rarer in the first half of 2015.5 By the end of June, international
reserves stood at US$361.6 billion (14.8 months of imports), well below the US$478.3 billion
(13.4 months of imports) observed in June 2014 and the US$385.5 billion (10.8 months of
imports) observed at the end of the year. In the first half of 2015, the central bank continued
to provide foreign-currency loans to support large banks’ external debt payments, spending
US$8.8 billion of its reserves. Its program of one-year loans was suspended in June, but in
August the central bank expressed its intention to relaunch the program in response to the large
amount of debt payments due in the second half of the year and the renewed volatility of oil
prices (Table 1-5).
Table 1-2: Balance of Payments, 2010-2015, Billion US$
Source: CBR.
Table 1-3: Net Capital Flows, 2010 -2015, Billion US$
Source: CBR.
Table 1-4: Russia’s External Debt Stock, 2013-2015, Billion US$
Source: CBR.
Table 1-5: Russia’s External Debt Service Schedule, 2015-2017, Billion US$
Source: CBR.
5 CBR direct interventions during the first half of 2015 consisted of US$2.3 billion spent in January to support the ruble and purchases of US$6.4 billion in May-June as part of the Reserve Replenishment Program.
2010 2011 2012 2013 2014 H1 2014 H1 2015
Current account balance 67.5 97.3 71.3 34.1 56.7 37.9 48.1
Trade balance 147.0 196.9 191.7 181.9 185.6 102.2 88.5
Non-oil current account balance -186.6 -244.5 -275.5 -316.1 -265.5 -135.2 -61.7
Capital and financial account -21.6 -76.0 -30.9 -45.4 -146.6 -75.0 -51.8
Errors and omissions -9.1 -8.7 -10.4 -10.8 3.4 -0.6 -8.5
Change in reserves (- = increase) -36.8 -12.6 -30.0 22.1 86.5 37.7 12.3
Memo: average oil price (Brent, US$/barrel) 79.7 111.1 112.0 108.9 98.8 217.7 116.0
2010 2011 2012 2013 2014 H1 2014 H1 2015
Total net capital inflows to the private sector -30.8 -81.4 -53.9 -61.0 121.9 69.4 52.5
Net capital inflows to the banking sector 15.9 -23.9 18.5 -7.5 64.8 36.2 28.6
Net capital inflows to the non-banking sector -46.7 -57.4 -72.4 -53.5 57.1 33.2 23.9
Jun-13 Sep-13 Dec-13 Mar-14 Jun-14 Sep-14 Dec-14 Mar-15 Jun-15
Total debt 707.8 716.3 728.9 715.9 732.8 680.9 599.0 555.9 556.2
Corporate 632.9 636.0 651.2 646.8 659.4 615.7 546.8 510.6 510.7
Banks 211.9 207.1 214.4 214.0 208.9 192.3 171.5 154.2 149.0
of which Private Banks 82.4 79.4 81.4 76.3 73.5 69.1 63.4 53.6
Non-financial corporations 420.9 428.9 436.8 432.7 450.6 423.4 375.4 356.5 361.8
of which Private Non-fin. Corporations 259.3 265.3 271.6 264.1 279.7 260.2 230.8 223.7
2q 2015 3q 2015 4q 2015 1q 2016 2q 2016 3q 2016 4q 2016 1q 2017
Government 0.8 0.8 1.0 1.0 0.6 1.0 1.0 0.7
Banks 8.0 9.8 11.0 6.3 6.5 4.5 5.2 7.0
Non-banking sector 19.1 21.2 28.6 13.7 17.2 11.2 18.9 13.3
Total 29.1 31.8 40.6 21.0 24.3 16.7 25.1 21.1

13
1.3. Monetary Policy and the Financial Sector
Despite the deepening recession, controlling runaway inflation became the central bank’s most
critical policy challenge during the first half of 2015. The pass-through effect of the ruble’s
depreciation in December 2014 pushed inflation to levels not seen since 2002. Due to
persistently high inflation, the central bank gradually moderated the monetary easing cycle it
had started in early 2015 and discontinued it in September. Measures to support the financial
sector appear to have contained systemic risks, and there are early signs of stabilization. The
central bank successfully transitioned to a free-floating exchange rate, but in May it resumed
marginal interventions to replenish its foreign-currency reserves.
Consumer price index (CPI) inflation slowly declined from a peak of 16.9 percent in March
as the ruble stabilized and the rise in food-price inflation subsided. The central bank
discontinued its monetary tightening policy in December 2014 and started a monetary easing
cycle in January. However, due to the pass-through effect of the ruble’s depreciation and
Russia’s ban on food imports, both food-price and core inflation uninterruptedly outpaced
headline inflation, while non-food inflation continued to accelerate (Figure 1-24). Food-price
inflation is hitting poor households particularly hard; by February food prices had risen by 23.3
percent, year-on-year, following an increase of 15.4 percent in 2014. Overall inflation
moderated in the second quarter due to weakening consumer demand, while seasonal declines
in fruit and vegetable prices and robust agricultural growth helped curb food-price inflation.
By August, CPI inflation had accelerated to 15.8 percent due to an increase in utility tariffs and
a weaker ruble, while food-price inflation remained high at more than 18 percent.
High inflation rates combined with negative growth presented a serious monetary policy
challenge, and persistently high core inflation ultimately prompted the central bank to slow
its monetary easing cycle. This cycle began on January 30, when the central bank increased
its key policy rate by 200 basis points to 15 percent as the impact of the ruble’s depreciation
subsided and financial stability was largely restored (Figure 1-25). As inflation began to slowly
moderate, the central bank continued a gradual process of monetary easing, cutting the policy
rate in March (100 basis points), April (150 basis points) and June (100 basis points) in an effort
to boost the credit supply and accelerate economic growth. Persistently high core inflation
rates of 16-17 percent led the central bank to slow the monetary easing cycle in July (50 basis
points) to 11.0 percent, and on September 11 it discontinued the cycle altogether.
Figure 1-24: CPI Inflation Components, y-o-y, Percent
Figure 1-25: Central Bank Key Policy Rate
Source: Rosstat. Source: CBR.
0
5
10
15
20
25
1401
1402
1403
1404
1405
1406
1407
1408
1409
1410
1411
1412
1501
1502
1503
1504
1505
1506
1507
1508
Core inflation CPI inflation Food inflation
Non-food inflation Services inflation

14
Foreign-exchange liquidity concerns subsided in the first half of 2015, and the successful
transition to a free float helped improve exchange-rate alignment. From February to June,
the free-floating ruble benefited from a marginal recovery in oil prices, before a renewed price
drop reversed this trend (Box 1-6). By May, the ruble had appreciated by around 30 percent
against the dollar, and the exchange rate rebounded to around 50 RUB/US$ from a low of 69.7
RUB/US$ in February. As concerns about the private sector’s access to foreign-currency liquidity
eased, the central bank discontinued its repo auctions in foreign currency. The ruble’s modest
appreciation also presented an opportunity for the central bank to launch a medium-term
reserve-replenishing program in May, which involved daily purchases of US$200 million with the
goal of increasing foreign-currency reserves to US$500 billion by 2018. Depreciation pressures
intensified in June, as oil prices once again began to slide, and by mid-September the ruble had
lost about 22.0 percent of its value against the dollar, falling to 66.48 RUB/US$, close to its
February low.
Monetary easing in the first half of 2015 marginally accelerated the growth of credit to the
private sector in the second quarter, yet banks remain risk-averse. Funding costs on the
interbank market fell substantially as the central bank cut its key policy rates by a cumulative
600 basis points. For example, the 6-month MosPrime rate was just 12.0 percent in mid-
September, down from 16.4 percent in March and 22.3 percent in January. Beginning in May,
credit to the private sector grew for three consecutive months, due in part to the reevaluation
Box 1-6: Oil Prices and Exchange-Rate Dynamics
Figure 1-26: Oil Prices and Ruble Exchange Rate
Source: Haver Analytics and CBR.
Oil prices remain the key determinant of the ruble’s exchange rate, yet rising geopolitical tensions and central bank policies have also affected exchange-rate dynamics. There were two distinct periods during 2015 when the correlation between oil prices and the exchange rate weakened: in February and in May-June (Figure 1-26). In February, the burgeoning crisis in Ukraine intensified pressure on the ruble, which was compounded by large external debt payments by the private sector during the first quarter. In February, oil prices rebounded by an average of 18 percent, month-on-month, yet the ruble appreciated by an average of only 1.3 percent against the dollar. Geopolitical tensions gradually subsided in March, following the Minsk agreement on Eastern Ukraine, while rising oil prices, a sharp drop in imports and lower external debt payments shifted the external accounts in the ruble’s favor. Commercial banks continued to borrow foreign exchange through the central bank’s repo facility, taking advantage of the high margin offered by Russian treasury bonds. This fueled the ruble’s rally, which started in mid-March and continued through most of April, prompting the central bank to increase the rate on foreign currency repos on April 10 and again on April 20. The reduction in key policy rates by 150 basis points at the end of April and the cancellation and discontinuation of the 1-year foreign-exchange repo facilities improved the exchange rate’s alignment with oil prices. The central bank’s daily purchases of US$200 million, which began on May 15, led to some temporary volatility in the foreign-exchange market, but in the second half of June the alignment between the ruble and oil prices was restored. In July, a renewed decline in oil prices intensified depreciation pressures, while large external debt payments and the start of the tourist season increased demand for dollars, prompting the central bank to postpone further foreign-exchange purchases.
3.5
3.6
3.7
3.8
3.9
4
4.1
4.2
4.33.6
3.8
4
4.2
4.4
4.6
4.8
5
Oil price (Brent), ln Rub/USD, ln (rhs, reverse order)
15
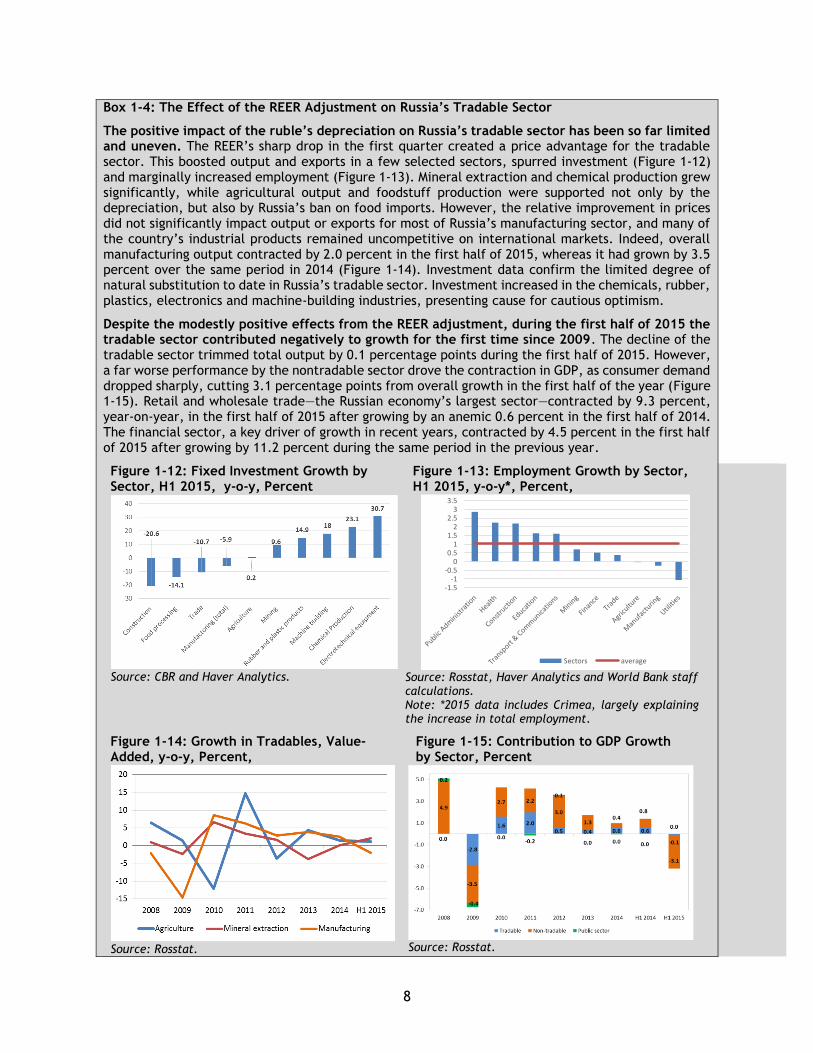
of foreign-currency loans as the ruble weakened. However, banks continued downsizing their
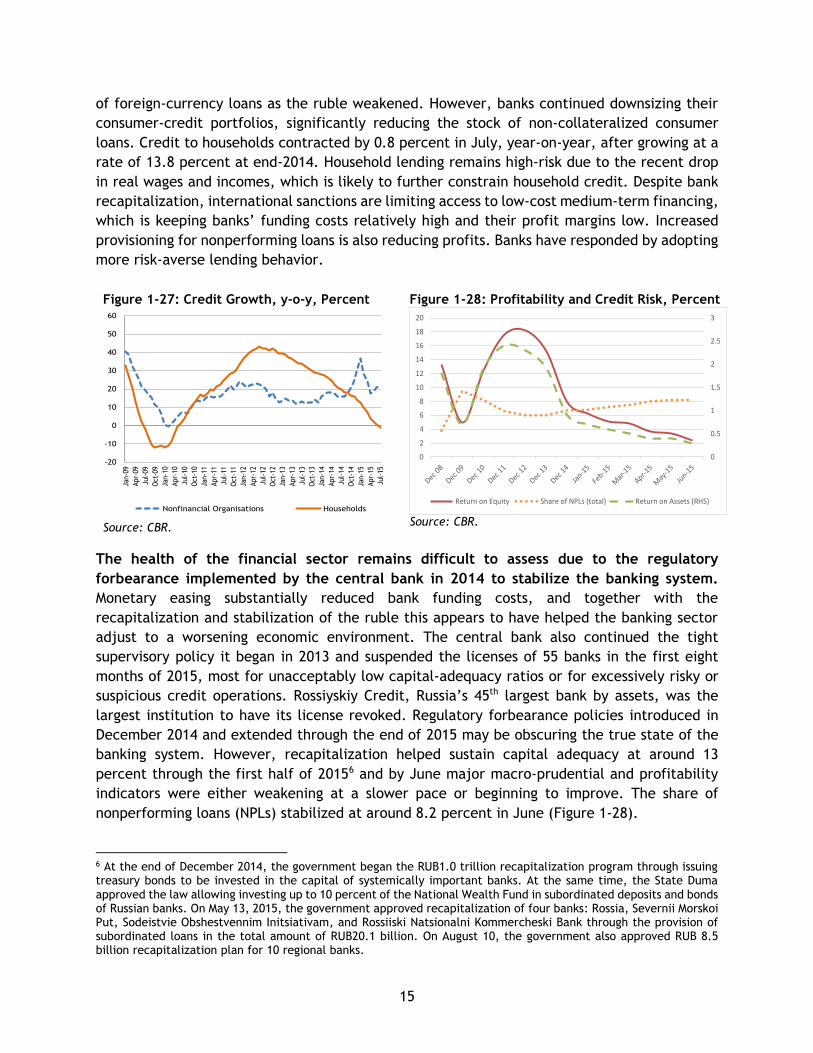
consumer-credit portfolios, significantly reducing the stock of non-collateralized consumer
loans. Credit to households contracted by 0.8 percent in July, year-on-year, after growing at a
rate of 13.8 percent at end-2014. Household lending remains high-risk due to the recent drop
in real wages and incomes, which is likely to further constrain household credit. Despite bank
recapitalization, international sanctions are limiting access to low-cost medium-term financing,
which is keeping banks’ funding costs relatively high and their profit margins low. Increased
provisioning for nonperforming loans is also reducing profits. Banks have responded by adopting
more risk-averse lending behavior.
The health of the financial sector remains difficult to assess due to the regulatory
forbearance implemented by the central bank in 2014 to stabilize the banking system.
Monetary easing substantially reduced bank funding costs, and together with the
recapitalization and stabilization of the ruble this appears to have helped the banking sector
adjust to a worsening economic environment. The central bank also continued the tight
supervisory policy it began in 2013 and suspended the licenses of 55 banks in the first eight
months of 2015, most for unacceptably low capital-adequacy ratios or for excessively risky or
suspicious credit operations. Rossiyskiy Credit, Russia’s 45th largest bank by assets, was the
largest institution to have its license revoked. Regulatory forbearance policies introduced in
December 2014 and extended through the end of 2015 may be obscuring the true state of the
banking system. However, recapitalization helped sustain capital adequacy at around 13
percent through the first half of 20156 and by June major macro-prudential and profitability
indicators were either weakening at a slower pace or beginning to improve. The share of
nonperforming loans (NPLs) stabilized at around 8.2 percent in June (Figure 1-28).
6 At the end of December 2014, the government began the RUB1.0 trillion recapitalization program through issuing treasury bonds to be invested in the capital of systemically important banks. At the same time, the State Duma approved the law allowing investing up to 10 percent of the National Wealth Fund in subordinated deposits and bonds of Russian banks. On May 13, 2015, the government approved recapitalization of four banks: Rossia, Severnii Morskoi Put, Sodeistvie Obshestvennim Initsiativam, and Rossiiski Natsionalni Kommercheski Bank through the provision of subordinated loans in the total amount of RUB20.1 billion. On August 10, the government also approved RUB 8.5 billion recapitalization plan for 10 regional banks.
Figure 1-27: Credit Growth, y-o-y, Percent
Source: CBR.
Figure 1-28: Profitability and Credit Risk, Percent
Source: CBR.
-20
-10
0
10
20
30
40
50
60
Jan-0
9
Apr-
09
Jul-
09
Oct
-09
Jan-1
0
Apr-
10
Jul-
10
Oct
-10
Jan-1
1
Apr-
11
Jul-
11
Oct
-11
Jan-1
2
Apr-
12
Jul-
12
Oct
-12
Jan-1
3
Apr-
13
Jul-
13
Oct
-13
Jan-1
4
Apr-
14
Jul-
14
Oct
-14
Jan-1
5
Apr-
15
Jul-
15
Nonfinancial Organisations Households
0
0.5
1
1.5
2
2.5
3
0
2
4
6
8
10
12
14
16
18
20
Return on Equity Share of NPLs (total) Return on Assets (RHS)

16
1.4. The Government Budget
The Russian government is facing a fiscal consolidation challenge. The federal budget balance weakened during the first half of 2015 as revenues dropped and expenditures increased in real terms. The officially projected federal deficit of 3.7 percent is being financed primarily by the Reserve Fund, which will deplete its resources by an estimated 50 percent by end-2015.
Low oil prices have exerted substantial downward pressure on federal revenues over the
past seven months. Overall federal revenues fell from 20.8 percent of GDP in 2014 to 19.2 in
2015 as oil and gas revenues decreased from 10.8 percent of GDP to 8.6 percent, year-on-year
(Figure 1-29). The average Urals oil price dropped from US$107 per barrel in the first half of
2014 to just under US$57 in the first half of 2015, prompting the government to sharply revise
the oil-price assumption underpinning the 2015 budget law (Table 1-6). The new reference
price is US$50 per barrel, half the original price of US$100 per barrel. Higher one-off VAT
receipts from the spike in durable-goods purchases by households during the December currency
crisis boosted nonoil revenues from 9.8 percent in July 2014 to 10.5 in July 2015, but this was
neither sufficient to offset the drop in oil revenues nor to finance the increase in expenditures.
Real federal public spending rose in the first seven months of 2015 due to expenditure
frontloading and the government’s anti-crisis measures. In the first seven months of 2015,
government expenditure priorities favored national defense and social programs, and spending
in these categories rose by 34.8 percent and 26.5 percent, year-on-year, respectively.
Meanwhile, economic subsidies increased by 24.7 percent, year-on-year. This was part of the
government’s anti-crisis plan which aimed to provide some additional support to parts of the
economy, regional budgets and social purposes. However, total primary expenditures are
expected to decline by 5 percent in real terms by end-2015. The procyclical spending cuts
included in the amended budget law are part of a fiscal consolidation strategy and are
appropriate given the expansionary policies pursued in the past, yet important decisions on the
restructuring of expenditures are still pending. Over the last decade, the share of the largest
expenditure items—national security and defense, economic subsidies and social spending—
Figure 1-29: Federal Budget Revenue and Budget Balances, 2007-2015, Percent of GDP
Figure 1-30: Primary Federal Budget Expenditures, 2014, Percent of GDP
Source: Ministry of Finance. Note: *January-July.
Source: Ministry of Finance
0.6
-6.4-13.5 -12.7
-9.6-10.4 -10.3 -10.9
-11.4
5.94.1
-5.9-4.1
0.8 -0.1 -0.5 -0.5-2.8
-15
-10
-5
0
5
10
0
5
10
15
20
25
2007 2008 2009 2010 2011 2012 2013 2014 2015*
Non-oil revenues, percent of GDPOil revenues, percent of GDPNon-oil balance, percent of GDP (RHS)Total balance, percent of GDP (RHS)
15.3 15.317.6
18.0
24.4 21.419.1
20.2 19.6 20.2
0
10
20
2005 2006 2007 2008 2009 2010 2011 2012 2013 2014Other Health & sportsEducation Intergovernmental transfersState administration National securityNational defense National economySocial policy (inc. transfers to Pension Fund) Federal budget primary expenditures

17
expanded as oil revenues rose (Figure 1-30). Due to persistently low oil revenues the planned
expenditure consolidation will not prevent budget deficits in 2015 and in subsequent years.
The federal budget deficit widened to 2.8 percent in the first seven months of 2015, a
sharp reversal from the 1.9 percent surplus recorded a year ago. The amended 2015 budget
anticipates a 3.7 percent deficit by the end of the year (Box 1-7), far larger than the 0.6 percent
deficit originally projected. Much of the shortfall will be financed by the Reserve Fund, and no
external financing is planned due to high borrowing costs. Weaker-than–expected oil revenues
are projected to push the nonoil deficit to over 11 percent of GDP, its highest level since 2011.
In the first seven months of 2015 the nonoil deficit widened to 11.4 percent of GDP, up from 9
percent in July 2014. This underscores Russia’s fiscal dependence on oil revenues and its
consequent vulnerability to the vicissitudes of the global oil market. The government is drawing
on the National Welfare Fund (NWF) to recapitalize banks and finance its efforts to revive
investment demand. The government’s anti-crisis plan from January 2015 called for a portion
of its financing to come from the 2015 budget (Box 1-8), exacerbating the increase in the
deficit, but cushioning otherwise somewhat the effects of a difficult fiscal consolidation.
Box 1-7: Amendments to the 2015 Federal Budget
The Ministry of Finance produced a draft 2015 budget and a prospective 2016–2017 budget in mid-2014, before the full impact of the recent terms-of-trade shocks had registered. Federal budget projections were based on an anticipated average oil price of US$100 per barrel. By the end of the year, when the oil price had dipped to US$70 per barrel, the government decided to delay the adjustment of budget parameters. As a result, the budget that took effect in December 2014 was based on outdated price projections and an obsolete macro-fiscal framework. The government began adjusting the budget during the first quarter of 2015, and on April 20 it was amended to reflect the new macroeconomic context. However, these amendments only apply to the 2015 federal budget, and the prospective 2016 and 2017 budgets remain unchanged.
In August, the Ministry of Finance decided to continue its one-year planning horizon through 2016. Consequently, there is no medium-term budget perspective to guide federal agencies, increasing policy uncertainty. The same situation occurred during the 2008 global financial crisis, when the government abandoned medium-term budgeting. The amended budget halves the expected average oil price to US$50 per barrel and revises GDP growth downward from 1.2 percent to negative 3 percent. Meanwhile, estimates of CPI inflation and exchange-rate depreciation rose from 5.5 to 12.2 percent and from 37.8 to 61.5 percent, respectively.
Table 1-6: The Federal Budget of 2013-2015, Percent of GDP
Source: Ministry of Finance, Economic Expert Group and World Bank staff calculations.
2013 2014 2014, Jan.- Jul. 2015, Jan.-Jul. 2015 2015
Execution Execution Execution Execution Budget Law Amended Budget Law
Expenditures 20.0 20.8 18.9 21.9 20.1 20.8
Revenues 19.5 20.3 20.8 19.2 19.6 17.1
Primary Balance 0.1 0.1 2.4 -2.0 0.0 -2.9
Balance -0.5 -0.5 1.9 -2.8 -0.6 -3.7
Oil Revenues 9.8 10.4 10.8 8.6 10.0 7.8
Non-Oil Revenues 9.7 9.9 9.9 10.5 9.6 9.3
Non-Oil Balance -10.3 -10.9 -9.0 -11.4 -10.6 -11.4
Urals oil price, US$/barrel 106.4 97.6 107 56.8 100.0 50.0

18
The National Welfare Fund is increasingly committed to supporting large banks and
providing off-budget stimulus. The fund currently holds almost RUB4.4 trillion, or 6 percent
of GDP, reflecting an increase of RUB10 billion since the beginning of the year. In 2015, the
government invested RUB75 billion from the fund in bonds to finance a gas-extraction project
in the Yamal Peninsula. The government deposited RUB26 billion at the state-owned bank VTB,
at 8 percent interest, for a major road project, which it had initially planned to finance though
a bond issued by the state-owned road-building company RosAvtoDor. The government invested
RUB50 billion in privileged shares of Russian Railways to support the modernization of the
Baikalo-Amur and Trans-Siberian Railways. It also invested RUB57.5 billion into privileged stocks
of the Atomenergo for the construction of the Hanhikivi-1 nuclear power station in Finland.
Moreover, the government provided direct support to certain state-owned banks, including a
RUB38.4 billion recapitalization of Gazprombank. Altogether, the NWF has invested RUB787.7
billion in domestic financial assets. Productive investments are critical to Russia’s long-term
growth, and the National Wealth Fund could potentially play an important role in building
economic assets that provide sufficient returns to cover future pension liabilities, as per its
original purpose. For that to happen, however, investment decisions must follow transparent
processes supported by adequate oversight and accountability mechanisms.
Box 1-8: The Government Anti-crisis Plan and its Implementation
On January 27, 2014 the government adopted an anti-crisis plan totaling RUB2.4 trillion. The bulk of the plan was designed to support the financial sector, but other parts of the economy, as well as regional budgets and social programs, were also targeted (Figure 1-31). The plan was to be financed by Treasury bonds issued in December to recapitalize the financial sector, along with resources from the 2015 budget and the NWF (Figure 1-32).
About 67 percent of the plan’s funds were earmarked for bank recapitalization. Treasury bonds worth RUB1 trillion were transferred to the Deposit Insurance Agency in December 2014, and 28 banks7 are currently eligible for recapitalization. In order to qualify, banks were required to commit to increasing mortgages, loans to small and medium enterprises, loans to regional budgets or loans to key economic sectors by 1 percent per month over the next three years, and to increase their own capital by at least half of the amount received from the Deposit Insurance Agency. Banks were also required to implement a three-year wage freeze. As of September, eleven banks8 had been recapitalized at a total cost of RUB598.5 billion. In August the government approved a list of regional banks9 to be recapitalized in the amount of RUB 8.5 billion through the Rossiisky Capital Bank.
The RUB1 trillion originally allocated to support commercial banks was reduced by RUB162 billion, which the government redirected to support state-owned companies. Federal bonds in the amount of RUB100 billion were transferred to the state-owned company United Airconstruction. The State Transport Leasing Company received RUB30 billion in federal bonds, and the state-owned energy company Lenenergo received RUB32 billion.10
The NWF is investing up to RUB250 billion in subordinated deposits and bonds in systemically important banks that have capital assets of at least RUB100 billion (US$1.6 billion). In October 2014, nine banks met these criteria. The interest rate on these deposits will at least equal the CPI
7 As of January 1, 2015 the combined capital assets of these bank exceeded RUB25 billion. 8 Sovkombank, Bank Petrokommerc, FK Otkrytie, AK Bars Bank, Moscow Credit Bank, Novikombank, Absolyut Bank,
VTB, Promsvyazbank, Gazprombank, Binbank, Bank Zenit. 9 Urals Bank Reconstruction and Development, Tatfondbank, Asian-Pacific Bank, Western-Siberian Commercial Bank,
St. Petersburg international Bank, Surgutneftegaz Bank, Kuban Credit, Chelyabinvestbank, First United Bank, Sarovbusinessbank. The capital of these banks exceeded RUB5 billion as of January 1, 2015. 10 One of the largest electricity distribution companies in Russia.

19
inflation rate. Banks that receive deposits from the fund are expected to finance government-approved investment projects. As of September, RUB 64.4 billion in fund assets had been deposited into commercial banks. In March, RUB 26 billion was deposited in the state-owned bank VTB to finance infrastructure projects. In April, the government deposited RUB38.4 billion in the state-owned Gazprombank to finance the construction of the new Central Ring Road. Finally, the government plans to deposit an additional RUB300 in the NWF resources in the state-owned Vnesheconombank to provide credit to the economy, but this transaction has not yet taken place.
About 13.9 percent of the anti-crisis plan’s funding (RUB320 billion) was earmarked for direct support to the economy. This includes RUB200 billion in state guarantees for systemically important companies, RUB50 billion to support agricultural enterprises and RUB10 billion to support the transportation sector. The government has approved a list of 199 firms eligible for state guarantees, which includes all major Russian companies. The firms on the list together produce about 70 percent of Russia’s GDP. In September, RUB17 billion in state guarantees were issued to the state-owned company Uralvagonzvod.11 In the first seven months of 2015 federal spending on the agricultural sector reached RUB124.4 billion (59.6 percent of the budgeted amount), up 50 percent from the previous year.
Another 12.9 percent of the anti-crisis plan’s resources (RUB296 billion) was earmarked for social support. This includes RUB188 billion to offset the decline in real pension payments, up to RUB52.2 billion for labor market policies, RUB30 billion for unemployment compensation, and RUB16 billion for the health sector. The government increased labor pensions by 11.4 percent in February and social pensions by 10.3 percent in April. During the first seven months the government also distributed 83 percent of the RUB2.5 billion in regional subsidies earmarked for labor market policies and RUB25.9 billion in regional transfers earmarked for unemployment compensation, 68 percent of the budgeted amount.
About 7.0 percent (RUB160 billion) of the plan’s resources are to be transferred to regional governments through budgetary loans. As of August, budgetary loans to regional governments increased by RUB123.5 billion to a total of RUB771 billion.
Figure 1-31: The Anti-crisis Plan by Expenditure Category, Billion rubles
Figure 1-32: The Anti-crisis Plan by Financing Sources, Billion rubles
Source: Ministry of Finance. Source: Ministry of Finance.
Russia’s fiscal buffers are not sufficient to cover successive budget deficits, and a prolonged
period of oil prices at current levels will necessitate a significant expenditure adjustment
in 2016 and beyond. In 2015, the government has relied heavily on its fiscal buffers to finance
the budget deficit. In August the Reserve Fund was not replenished, as it normally is each year,
because the fiscal rules only require its replenishment when oil prices exceed budget forecasts.
This highlights the critical importance of updating the fiscal rule (Box 1-9) to restore its
11 Uralvagonzavod is a state-owned company that produces military hardware, railway cars and road construction
machines. The company was hit hard by international sanctions, as its projects with foreign partners were halted and demand for railway cars fell.
1550
320
296
160
Bank recapitlization Support to the economy
Social support Support to the regions
1000
713
600
87
Budget 2014 Budget 2015 NWF Other

20
usefulness as a fiscal policy instrument. The financing demands of the federal budget deficit
(RUB 900 billion or 1.3 percent of GDP) coupled with the depreciation of the ruble reduced the
Reserve Fund from US$87.9 billion in January to US$72 billion as of September 1. Based on
current budget trends the deficit is expected to halve the Reserve Fund by the end of the year.
This means that previous savings are being used now to prevent fiscal distress, and that no new
savings are being amassed for future generations. Policymakers have yet to develop a
permanent solution to the long-term structural deficit, which will be exacerbated by the aging
of the population (see Part III). Without major reforms to limit public liabilities or boost
revenues future fiscal balances will not be sustainable.
In the first six months of 2015, the consolidated government budget shifted from surplus
to deficit due to imbalances in the federal budget and in the use of extra-budgetary funds.
The consolidated budget encompasses all public spending, including the federal budget,
subnational budgets and all extra-budgetary funds (Table 1-7). The trajectory of overall
revenues and expenditures largely reflects trends in the federal budget, and when oil revenues
dropped in the first half of 2015 consolidated government revenues fell from 38.7 to 37.4
percent of GDP. This occurred despite increases in income tax revenue, social contributions
and VAT receipts. Consolidated government expenditures grew from 35.4 percent of GDP in the
first half of 2014 to 40.0 percent in the first half of 2015 as spending on social programs and
national defense rose by 3.9 and 1.6 percent of GDP, respectively. Increasing imbalances in
extra-budgetary funds are negatively impacting the consolidated budget. Rising expenditures,
especially from the Pension Fund, have pushed the extra-budgetary funds into deficit, which
presents a growing fiscal risk. At end-June, the consolidated budget deficit stood at 2.6 percent
Box 1-9: Russia’s Fiscal Rule
In 2012, the government introduced an oil-price–based fiscal rule to manage its revenues from natural resources more effectively. Before 2012, the fiscal tool to guide resource-based spending was a 4.7 percent target for the nonoil budget deficit. The new rule establishes a benchmark price based on a backward-looking moving average of actual Urals oil prices, which is used to calculate how much of a given year’s resource revenues can be devoted to public spending. The benchmark price is equal to the average price of the previous three years, but only if oil prices have been decreasing for more than three consecutive years. If prices have not consistently decreased, then the benchmark price is equal to the average price for the previous 10 years. If actual oil prices are above the benchmark price in a given year, the difference is saved, and if they are lower than the benchmark price, previous savings are used to finance the difference. Savings are managed through a two-tier institutional structure. Initial savings are deposited into the Reserve Fund; once the Reserve Fund balance reaches 7 percent of GDP, half of all additional savings are allocated to the NWF and half to infrastructure projects. Balances in the NWF are earmarked for future pension liabilities and in the latter are used for current infrastructure projects.
In principle, this mechanism stabilizes public spending through the buffers deposited in the Reserve Fund and saved for future generations through the National Wealth Fund. The fiscal rule and two-tier sovereign wealth funds savings mechanism could effectively smooth revenue volatility that would otherwise be transferred from natural resource prices to public spending. However, the government is currently planning to use savings from the Reserve Fund to finance budget deficits over the next one-to-three years and has committed much of the NWF. This is a serious concern, as the simulations presented in Annex 1 show that over the long run NWF resources will not be adequate to cover the fiscal deficits generated by the aging of the Russian population.

21
of GDP, down from a surplus of 3.3 percent a year ago. By December the consolidated deficit
is expected to widen to 5.5 percent of GDP, with deficits projected at all budgetary levels.
Subnational budgets are less vulnerable to external shocks, because most oil revenues flow
through the federal level. As of end-June, the aggregate subnational budget registered a
surplus of 1.1 percent of GDP, yet this is expected to become a deficit of 0.9 percent of GDP
by end-2015. Subnational debts currently total 3.3 percent of GDP, up from 2.4 percent in the
first half of 2014. Subnational indebtedness could increase if the anticipated deficit is financed
through domestic borrowing in an environment of high interest rates.
Table 1-7: The Consolidated Budget of 2012-2015, Percent of GDP
Source: Ministry of Finance and Rosstat. Extrabudgetary funds include the Pension Fund, the Social Security Fund,
and the Federal Fund for Mandatory Health Insurance.
1.5. Income and Poverty Trends
The dramatic contraction in real wages and income observed in the first half of 2015 illustrates
the depth of the recession and its negative impact on household consumption. The decline in
real wages was the main channel through which the labor market adjusted to lower demand,
and as a result unemployment increased only slightly during the past year. However, the drop
in real income significantly increased poverty rates and exacerbated the vulnerability of
households in the lower 40 percent of the income distribution.
Real wages have tumbled since the recession began, as inflation spiked while labor demand
receded. In the first six months of 2015 real wages fell across all sectors of the economy (Figure
1-33), dropping by an average of 8.5 percent. This contraction followed a growth rate of 3.4
2012 2013 2014 2013 H1 2014 H1 2015 H1 2015
Execution Execution Execution Execution Execution Execution Forecast
Expenditures 37.3 38.2 38.7 36.0 35.4 40.0 40.8
Revenues 37.7 36.9 37.5 37.4 38.7 37.4 35.3
Balance 0.4 -1.3 -1.2 1.4 3.3 -2.6 -5.5
Expenditures 13.4 13.3 13.1 12.1 12.1 12.1 13.4
Revenues 13.0 12.3 12.5 12.2 12.4 13.2 12.5
Revenues without extrabudgetary transfers 10.4 10.0 10.1 10.0 10.1 10.9 10.5
Balance -0.4 -1.0 -0.6 0.0 0.3 1.1 -0.9
Subnational Debt 2.1 2.6 3.4 2.0 2.4 3.3
Expenditures 11.1 12.1 11.2 11.5 10.3 13.7 13.8
Revenues 12.0 12.2 11.2 11.9 11.1 12.1 12.7
Balance 0.9 0.2 0.0 0.4 0.8 -1.5 -1.1
Expenditures 20.7 20.2 20.8 19.4 19.5 21.8 20.8
Expenditures without interest payments 20.2 19.6 20.2 18.8 18.9 21.0 20.0
Revenues 20.7 19.7 20.3 20.6 21.7 19.4 17.1
Primary balance 0.5 0.1 0.1 1.8 2.8 -1.6 -2.9
Balance -0.1 -0.5 -0.5 1.2 2.2 -2.3 -3.7
Consolidated Budget
Consolidated Subnational Budget
Extrabudgetary Funds
Federal Budget

22
percent in the first half of 2014. As lower oil prices increased fiscal constraints the budget could
not support the continued growth of public sector wages at the pace observed in 2012-2013 (15
percent in real terms). The recession hit civil servants especially hard as the original 2015
federal budget provided zero indexation for public sector wages while inflation remained in
double-digits throughout the first half of the year. Civil servants comprise a large part of the
Russian middle class, and as their real wages fell by 10 percent in first half of 2015 (Figure 1-34)
private consumption dropped rapidly.
The decline in real wages enabled the labor market to adjust without shedding a large
number of jobs. As a result, the unemployment rate increased only slightly from 5.3 percent
in the first half of 2014 to an average of 5.6 percent in the first half of 2015 (Box 1-10). The
decline in labor demand is also being partially offset by demographic aging, and the gradual
shrinking of the working-age population has measurably impacted the labor market since 2012.
Figure 1-33: Contribution to Real Wage Growth, y-o-y, Percent
Source: Rosstat and World Bank estimates.
Figure 1-34: Real Wage Growth by Sector, y-o-y, Percent
Source: Rosstat and World Bank estimates.
Box 1-10: Labor Market Trends
Labor demand started to decline in the first half of 2015. As the economy contracted the vacancy
rate dropped to 2.5 percent, year-on-year (Figure 1-35). Meanwhile, the unemployment rate rose from
5.3 to 5.6 percent, representing an additional 200,000 unemployed workers. Although the labor supply
has declined gradually since 2012, due to the aging of the population, the employment ratio has
remained close to 65 percent (Figure 1-36). Male unemployment, at 6.0 percent, exceeds female
unemployment, at 5.3 percent, up slightly from 5.7 and 4.8 percent in 2014. Urban unemployment
increased from 4.4 percent to 5.0 percent, year-on-year, while rural unemployment decreased from
8.2 percent to 7.9 percent.
Russia has a long history of making labor-market adjustments through wage corrections, and
several other factors have contributed to its low unemployment rate. A slightly higher degree of
labor mobility facilitated the reallocation of human resources to expanding sectors, while public
employment—particularly in public administration, education and state-owned enterprises—also
appears to have increased. Meanwhile, the partial replacement of migrant workers by domestic
workers in sectors such as construction and agriculture helped contain unemployment. Tajikistan,
-15
-10
-5
0
5
10
15
2009 2010 2011 2012 2013 2014 2015
Public non-Tradables Tradables Total
-15
-10
-5
0
5
10
15
20
25
2009 2010 2011 2012 2013 2014 2015
Total Tradables non-Tradables Public

23
Nonwage income sources such as transfers and pensions have failed to compensate for the
drop in real wages, as they did during the 2008 global financial crisis, causing an overall
decrease in real income. Falling oil revenues constrained the government’s ability to use fiscal
transfers to offset the erosion of real wages. Pensions were indexed by 11.4 percent in
February, and social benefits were indexed at 5.5 percent, both well below the headline
inflation rate (Box 1-11). Combined with the drop in real wages this accelerated in the first half
of 2015 the contraction of real disposable income to 3.1 percent from 1.0 percent in the first
half of 2014 (Figure 1-39).
The growth of consumer credit stalled in June, and the consumer debt stock remains high
at around 25 percent of total household income. Interest rates on consumer debt also
remained elevated at close to 25 percent. This not only discourages the acquisition of new
loans, but also negatively impacts consumers seeking to roll-over existing debts, which are
typically on a very short (often one-year) maturity. The cost of servicing the large stock of
Uzbekistan and Moldova have all reported an increase in the number of returning migrant workers
from Russia, and Russia’s outbound remittances decreased substantially. Limited unemployment
benefits, a large amount of informal employment and a high share of variable compensation all exerted
downward pressure on the unemployment rate. There is little evidence of employers “hoard labor” by
switching employees to part-time work or putting them on unpaid leave.
Figure 1-35: Beveridge Curve
Source: Rosstat and World Bank staff calculations.
Figure 1-36: Employment and Economic Activity Rates, Percent
Source: Rosstat, Haver Analytics and World Bank staff calculations.
Figure 1-37: Foreign Citizens Residing in the Russian Federation as of August 2015
Source: Federal Migration Service of the Russian
Federation.
A sudden decrease in the total number of
foreign citizens residing in Russia at the end
of 2014 sparked a debate as to how the
economic downturn and a stricter migratory
framework is affecting migrant workers in
Russia. During the first seven months of 2015,
the number of migrants fell by 2 percent, year-
on-year. Ukraine became the top source of
incoming migrants, accounting for 24 percent of
the total (a 41 percent increase, year-on-year)
(Figure 1-37). Meanwhile, Uzbekistan saw its
share of migrants decline to 19 percent of the
total, (a 16 percent decrease, year-on-year).
The share of migrants from the Eurasian
Economic Union rose to 21 percent of total
migrants (a 17 percent increase, year-on-year).
4Q 09
4Q 10
4Q 11
4Q 12 4Q 13
4Q 14
1.7
2.2
2.7
3.2
5.0 6.0 7.0 8.0 9.0
Vaca
ncy
rate
, %
Unemployment rate, %
1Q 142Q14
3Q 144Q 14
1Q 15 2Q 152.40
2.60
2.80
3.00
5.1 5.6
60
62
64
66
68
70
2011 2012 2013 2014 2015
Activity rate Employment rate
Activity rate, SA Employment rate, SA
Ukraine2,631,638 24.01%
Uzbekistan2,125,943 19.39%
Tajikistan985,416 8.99%
Kazakhstan701,133 6.40%
Belarus592,451 5.40%
Azerbaijan554,364 5.06%
Moldova535,163 4.88%
Armenia535,135 4.88%
Kyrgyz Republic518,993 4.73%
China278,777 2.54%
Others (227)1,502,313 13.71%
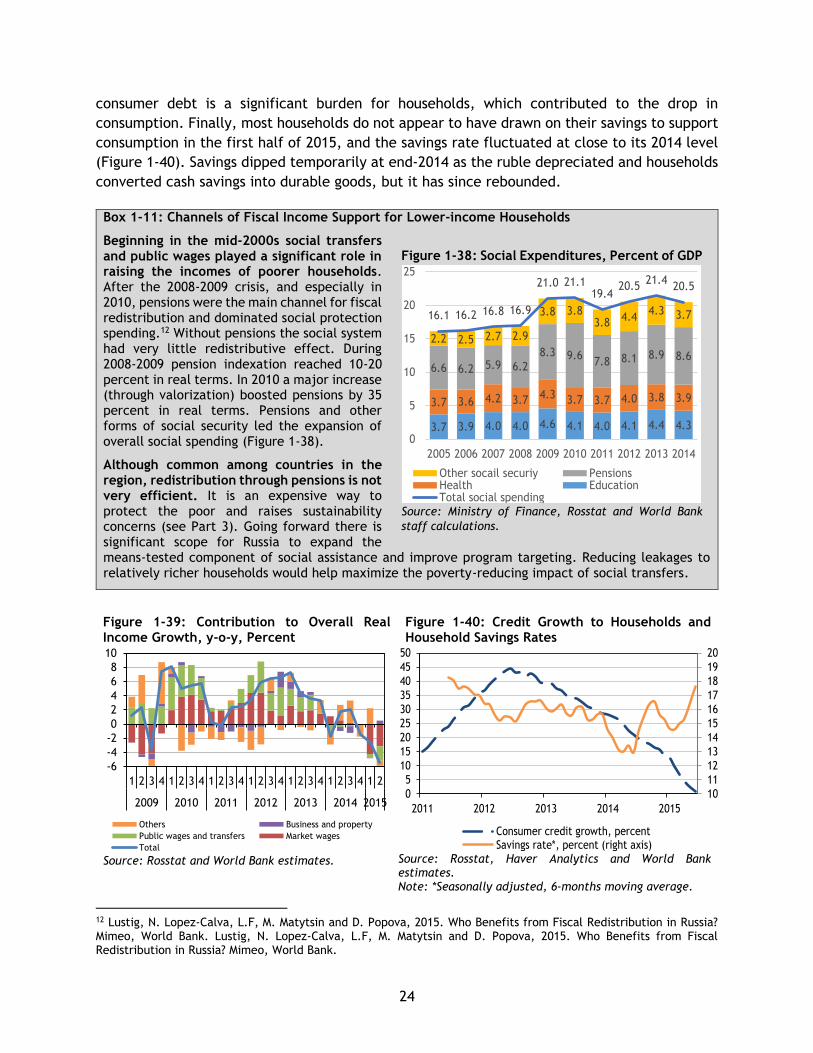
24
consumer debt is a significant burden for households, which contributed to the drop in
consumption. Finally, most households do not appear to have drawn on their savings to support
consumption in the first half of 2015, and the savings rate fluctuated at close to its 2014 level
(Figure 1-40). Savings dipped temporarily at end-2014 as the ruble depreciated and households
converted cash savings into durable goods, but it has since rebounded.
12 Lustig, N. Lopez-Calva, L.F, M. Matytsin and D. Popova, 2015. Who Benefits from Fiscal Redistribution in Russia? Mimeo, World Bank. Lustig, N. Lopez-Calva, L.F, M. Matytsin and D. Popova, 2015. Who Benefits from Fiscal Redistribution in Russia? Mimeo, World Bank.
Box 1-11: Channels of Fiscal Income Support for Lower-income Households
Figure 1-38: Social Expenditures, Percent of GDP
Source: Ministry of Finance, Rosstat and World Bank
staff calculations.
Beginning in the mid-2000s social transfers and public wages played a significant role in raising the incomes of poorer households. After the 2008-2009 crisis, and especially in 2010, pensions were the main channel for fiscal redistribution and dominated social protection spending.12 Without pensions the social system had very little redistributive effect. During 2008-2009 pension indexation reached 10-20 percent in real terms. In 2010 a major increase (through valorization) boosted pensions by 35 percent in real terms. Pensions and other forms of social security led the expansion of overall social spending (Figure 1-38).
Although common among countries in the region, redistribution through pensions is not very efficient. It is an expensive way to protect the poor and raises sustainability concerns (see Part 3). Going forward there is significant scope for Russia to expand the means-tested component of social assistance and improve program targeting. Reducing leakages to relatively richer households would help maximize the poverty-reducing impact of social transfers.
Figure 1-39: Contribution to Overall Real Income Growth, y-o-y, Percent
Source: Rosstat and World Bank estimates.
Figure 1-40: Credit Growth to Households and Household Savings Rates
Source: Rosstat, Haver Analytics and World Bank estimates. Note: *Seasonally adjusted, 6-months moving average.
3.7 3.9 4.0 4.0 4.6 4.1 4.0 4.1 4.4 4.3
3.7 3.6 4.2 3.7 4.3 3.7 3.7 4.0 3.8 3.9
6.6 6.2 5.9 6.2
8.3 9.67.8 8.1 8.9 8.6
2.2 2.5 2.7 2.9
3.8 3.83.8
4.44.3 3.716.1 16.2 16.8 16.9
21.0 21.119.4
20.521.4
20.5
0
5
10
15
20
25
2005 2006 2007 2008 2009 2010 2011 2012 2013 2014
Other socail securiy PensionsHealth EducationTotal social spending
-6
-4
-2
0
2
4
6
8
10
1 2 3 4 1 2 3 4 1 2 3 4 1 2 3 4 1 2 3 4 1 2 3 4 1 2
2009 2010 2011 2012 2013 2014 2015
Others Business and property
Public wages and transfers Market wages
Total
10
11
12
13
14
15
16
17
18
19
20
0
5
10
15
20
25
30
35
40
45
50
2011 2012 2013 2014 2015
Consumer credit growth, percentSavings rate*, percent (right axis)

25
The decline in real income in the first half of 2015 had a deeply negative impact on the
poverty rate, which climbed to 15.1 percent, representing 21.7 million people. This is an
increase of two percentage points, or 2.8 million people, from a year ago, and the average 2015
poverty rate is now estimated to be close to its 2011 level (Table 1-8). This accelerated an
already troubling trend in poverty rates, which rose from 10.8 percent in 2013 to 11.2 percent
in 2014. The increase in poverty rates was driven not only by the decline of real income but
also by food-price inflation, which continuously outpaced headline inflation. Poverty rates vary
enormously by region (Figure 1-43), with the highest rates observed in the Siberian Federal
District, led by the Tuva Republic at 35.2 percent. The lowest rates are found in the resource-
rich regions of Tatarstan Republic and Yamalo-Nenetskiy Autonomous District, both of which
have poverty rates close to 7 percent, followed by Belgorod Province (7.5 percent) and Moscow
(7.7 percent).
Table 1-8: Poverty Trends, 2010-2015
Source: Rosstat and World Bank staff calculations.
Rising poverty rates threaten Russia’s impressive achievements over the past decade in
promoting shared prosperity. Poor and low-income households are especially dependent on
pensions and social transfers, both of which were eroded by inflation in 2015. This has
significantly increased the vulnerability of households in the lower 40 percent of the income
distribution. In 2014, real income growth among households in the lower 40 percent did not
exceed the national average (Figure 1-41), preventing a further expansion of the middle-class13
(Figure 1-42). Instead, Russia’s middle class has remained close to its 2013 level (70 percent),
failing to grow for the first time since the global financial crisis.
Figure 1-41: Real Income Growth by Income Quartiles, y-o-y, Percent
Source: Rosstat and World Bank staff calculations.
Figure 1-42: Population Shares by Income Level and the Size of the Middle Class, Percent
Source: Rosstat and World Bank staff calculations.
13 The middle class is defined here as share of population with per capita income above 10 USD per day in 2005 PPP terms.
2010 2011 2012 2013 Q1 2014 Q2 2014 Q3 2014 Q4 2014 Q1 2015 Q2 2015
Poverty rate, cumulative 12.5 12.7 10.7 10.8 13.8 12.1 12.1 8.5 15.9 15.1
Number of poor, million people 17.7 17.9 15.4 15.5 19.8 18.9 18.0 16.1 22.9 21.7
-10
-5
0
5
10
15
1 2 3 4 1 2 3 4 1 2 3 4 1 2 3 4 1 2 3 4 1 2 3 4
2009 2010 2011 2012 2013 2014
Average Bottom 40 percent
0102030405060708090
100
More than 50 USD/day 25-50 USD/day
10-25 USD/day 5-10 USD/day
Less than 5 USD/day More than 10 USD/day

26
Figure 1-43: Poverty Rate by Regions, 2014, Percent
Source: Rosstat and World Bank staff calculations.

27
Part 2. Outlook – High Uncertainty Prevails
Adverse external conditions pose a serious challenge to Russia’s short-term growth prospects.
The continued impact of the adjustment to lower oil prices in a context of ongoing
international sanctions will cause the Russian economy to contract in 2015. Medium-term
growth prospects depend on how Russia will brave the difficult adjustment to this new
economic reality, but high policy uncertainty prevails. In the longer term, there is an
opportunity for Russia to benefit from a structural transformation of its economy. The baseline
scenario anticipates a contraction of 3.8 percent in 2015 and 0.6 percent in 2016, before the
economy rebounds to a modest growth rate of 1.5 percent in 2017. Given renewed concerns
regarding oil-price volatility compounded by downside risks to the global economic outlook,
Russia’s upper-bound and lower-bound oil price scenarios differ markedly. For projections
purposes, it is assumed that sanctions remain in force in all three projection scenarios. The
continuing macro-fiscal adjustment process heightens risks related to financial stability and
fiscal sustainability. Due to the severity of the projected contraction and the vulnerability of
lower-income households to growth shocks, poverty rates are projected to increase sharply.

28
2.1. Growth and Poverty Dynamics
Given the volatility of the international oil market and Russia’s economic sensitivity to changes
in oil prices, the World Bank has based its medium-term growth projections around three
scenarios: the baseline, an upper-bound oil price scenario, and a lower-bound oil price
scenario. For projections purposes it is assumed that sanctions remain in force in all three
projection scenarios. The current recession is expected to substantially reverse recent progress
in poverty reduction, and poverty levels are projected to increase sharply in all scenarios.
A combination of persistently low global oil prices and ongoing international sanctions is
exerting a profoundly negative influence on Russia’s growth prospects. The World Bank’s
baseline growth outlook for 2015 anticipates that the Russian economy will contract by 3.8
percent in 2015 (Figure 2-1), with real GDP slipping below its 2012 levels (Figure 2-2). This
reflects the continued impact of the economy’s adjustment to lower oil prices in a sanctions
environment. Oil prices are projected to remain at an average of US$53 per barrel in 2015,
unchanged from the 2015 price forecast used in the previous Russia Economic Report (April).
The upper-bound and lower-bound scenarios primarily reflect how changing oil prices would
affect other macroeconomic variables. A 50 percent drop in average oil prices prompted a sharp
depreciation in the ruble coupled with a steep rise in inflation rates, which would have a
profoundly negative impact on income and consumption levels in 2015. Meanwhile, due to the
tight domestic credit market and international financial restrictions, borrowing would became
prohibitively expensive for most investors and households.
Figure 2-1: Real GDP Growth Projection, y-o-y, Percent
Figure 2-2: Real GDP Projection, Percent, 2012=100
Source: Rosstat and World Bank staff estimates. Source: World Bank staff estimates.
Geopolitical tensions continue, and both sanctions and counter-sanctions were renewed in
2015. As a result, external borrowing cost are expected to remain elevated, with restricted
access to international financial markets suppressing investment and capital formation rates
through 2015. A slow and uneven global recovery is marked by continued weaknesses in trade
dynamics. Growth in large emerging economies is projected to decline, capital flows are being
reduced and volatility in equity prices increased world-wide. But by far most dominant for
-4.3
-2.8
0.0
3.4
1.3
0.6
-3.8
-0.6
1.5
-3.2
1.3
1.7
-5
-4
-3
-2
-1
0
1
2
3
2012 2013 2014 2015 2016 2017
Lower-bound scenario Baseline scenario Upper-bound scenario
97.5
94.8
94.8
100.0
101.3
101.9
98.097.4
98.9
98.6
99.9
101.6
93
94
95
96
97
98
99
100
101
102
2012 2013 2014 2015 2016 2017
Lower-bound scenario Baseline scenario Upper-bound scenario

29
Russia is the projected softness in commodity prices which could spark additional selloffs in the
currency and equity markets of emerging economies, further increasing international borrowing
costs (Box 2-1).
Russia’s medium-term growth prospects will hinge not only on the evolution of external
factors but also on its internal capacity to adjust to an increasingly adverse macro-fiscal
context. In 2016, growth is projected below zero as Russia will continue chartering the waters
of a difficult adjustment process. Maintaining fiscal sustainability will become an especially
pressing challenge as fiscal buffers are further depleted over time while oil prices remain low
at a projected average of US$53 per barrel. This will require difficult policy choices during the
expected revision of the 2016 budget proposal. Expenditure priorities will need to be
reassessed, and a renewed discussion of adjustments to the fiscal rule is anticipated.
Russia’s recent monetary policy actions successfully prevented costly delays in relative
price adjustments. To sustain progress on this front the central bank must remain committed
to inflation targeting in the context of a flexible exchange-rate regime. This will continue to
Box 2-1: The Global Economic Outlook
Global growth is expected to strengthen gradually over the medium term, spurred by an accelerating recovery in high-income countries (Table 2-1). Low commodity prices and generally benign financial conditions (notwithstanding the expected tightening of US monetary policy) will support a continued increase in global economic activity. The recovery among high-income countries is expected to gather momentum, with aggregate growth rising from 1.8 percent in 2014 to an estimated 2 percent in 2015 and a projected average of 2.3 percent over 2016–17. Performance gaps between major economies will narrow in 2015-2016, as growth rates plateau in the United States while increasing in the euro zone and Japan. Global growth is expected to reach 2.8 percent in 2015, up slightly from 2014, before accelerating to 3.2 percent in 2016–2017.
Developing and emerging economies will continue to face a difficult economic environment. Tighter financial markets, slowing growth in China, continued weakness in commodity prices and a strong US dollar will all present significant challenges. The protracted slump in global commodity prices has especially negative implications for growth in developing countries, as commodities account for about one-third of their aggregate GDP. Slowing growth among developing countries has adverse spillover effects for Russia, which maintains close trade, finance and remittance links with a number of developing economies. Meanwhile, countries that rely heavily on foreign capital inflows may be negatively affected by rising borrowing costs as the US Federal Reserve raises its policy interest rates. In addition, many developing and emerging economies have experienced a structural economic slowdown as demographic change has lowered the growth rate of their working-age populations. Nevertheless, rising productivity in South and East Asia should continue to support rapid regional growth, though at a somewhat slower pace than in previous years. Overall, aggregate growth in developing countries is expected to slow to 4.4 percent in 2015 before rising to 5.4 percent by 2017.
Table 2-1: Global GDP Growth, Percent
2009 2010 2011 2012 2013 2014 2015f 2016f 2017f
World -1.8 4.3 3.1 2.4 2.5 2.6 2.8 3.3 3.2
High income -3.5 3.0 1.9 1.4 1.4 1.8 2.0 2.4 2.2
Developing countries 3.0 7.8 6.3 4.9 5.1 4.6 4.4 5.2 5.4
Euro area -4.5 2.0 1.7 -0.7 -0.4 0.9 1.5 1.8 1.6 Russia -7.8 4.5 4.3 3.4 1.3 0.6 -3.8 -0.6 1.5
Source: World Bank Global Economic Prospects and World Bank Russia team estimates.

30
support timely REER adjustments. Similarly, measures to shore up financial sector stability will
need to be managed carefully and with continuous monitoring, as it is likely that declining asset
values will continue to expose weaknesses in bank balance sheets in Russia’s still-overcrowded
financial sector. With no major structural reforms expected before the 2018 presidential
election, a marginal improvement in average oil prices to US$57 per barrel in 2017 would
support a modest recovery to 1.5 percent growth in the baseline scenario.
While Russia’s economy faces serious short-term adjustment challenges, there is also a
valuable opportunity to enhance the country's long-term growth prospects by restarting
progress on the structural reform agenda. Adapting to adjustments in relative prices and the
shifting of productive factors to new growth sectors is a difficult process, but policies that
facilitate Russia’s structural transformation could have lasting positive effects. Efforts to renew
investor confidence will be especially critical to Russia’s medium-term outlook. Conversely,
policies that attempt to slow Russia’s structural transformation in an effort to mitigate the
disruptive influence of the macroeconomic adjustment process could push the country toward
a persistent low-growth equilibrium.
Two key factors influence the economic forecasts for Russia presented in this analysis, the
duration of international sanctions and the trajectory of global oil prices, but only the latter
differs in the three scenarios. For projections purposes, it is assumed that sanctions remain
in force in all three projection scenarios. Russia’s medium-term growth outlook is also heavily
dependent on trends in oil prices, and the baseline scenario reflects the Bank’s most recent
oil-price projections (Box 2-2). The World Bank projects in the baseline scenario steady oil
prices for 2015 and 2016 at US$53 per barrel and for 2017 at US$55. However, the global oil
market continues to exhibit significant volatility as OPEC and non-OPEC producers compete for
market shares. Because current oil-price forecasts are subject to both upside and downside
risks, the projections presented here include both a lower-bound and an upper-bound scenario.
The lower-bound scenario assumes that oil prices will average US$50 per barrel in 2015 and
US$40 per barrel in 2016 and 2017. The upper-bound scenario assumes that oil prices will
average US$53 per barrel in 2015, US$58 in 2016 and US$67 in 2016.
All forecasts assume that government and central bank policies will continue to support
Russia’s macroeconomic adjustment over the projection period, but policy uncertainty
remains very high. The projections do not anticipate any major shifts in government and
central bank policy that could significantly affect how changing oil prices impact the economy.
The central bank is expected to adhere to its inflation-targeting regime and relax monetary
conditions as inflationary pressures ease. At the time of this report’s publication government
fiscal policies were still in the drafting stage, following the Minister of Finance’s announcement
on September 2 that a new 2016 budget proposal would be submitted to the State Duma on
October 25, replacing the prospective 2016-2018 budget proposal submitted in June. In light of
the rapidly evolving macroeconomic situation the Duma was requested not only to extend the
deadline for submitting the 2016 budget, but to also approve a reduction in the 2016 budget-
planning horizon from three years to one. Low oil prices are expected exert considerable
pressure on the fiscal accounts over the next two years. The revenue shortfall caused by lower

31
oil export receipts, falling import duties and the contraction in GDP is not expected to be offset
by the government’s current fiscal policy, which calls for a five percent decline in real public
spending and another year of zero indexation for public wages. Either a more significant fiscal
consolidation will take place in 2016 and 2017 or higher fiscal deficits are likely in the coming
years.
Worsening macroeconomic conditions are expected to generate a substantial increase in
the poverty rate, which is projected to rise from 11.2 percent in 2014 to 14.2 percent in
2015 in the baseline scenario. This would be the first significant increase in the poverty rate
since the 1998-1999 crises (Figure 2-5). During the 2008 global financial crisis a large fiscal
stimulus package supported household consumption, and as a result the poverty rate did not
increase and disposable income continued to grow. In 2015, however, the erosion of real
Box 2-2: Global Oil-Price Forecasts
Robust supply growth coupled with slowing demand led to a substantial built-up in global oil inventories. OECD inventories exceeded 2.9 billion barrels in June, the highest level in recent history (Figure 2-3). Meanwhile, OPEC increased its output, as Saudi Arabia and other OPEC producers attempted to protect their market shares. As a result, OPEC’s excess production capacity narrowed from 4.3 million barrel per day in March to 3.2 million barrel per day in August, down from almost 5 million barrels per day at end-2013. OPEC established this strategy of increasing output in the face of weak global demand at its November 2014 meeting and reaffirmed its commitment in June 2015. Sustained low oil prices could lead in the long-term to a readjustment in oil supply and increasing again the share of traditional oil producers.
The World Bank projects that oil prices will average US$53 per barrel in 2015, a 45 percent decrease from 2014. This projection assumes that OPEC will continue to refrain from any form of supply management (the next OPEC meeting will take place on December 4, 2015) and that there will be no further deterioration in the global economic environment. This forecast assumes the maintenance of OPEC’s current policy, the easing of geopolitical tensions, further supply increases (including rising oil exports from Iran), and moderate growth in global demand (Figure 2-4). These factors, combined with the extent of existing production capacity—especially shale-oil output in the United States—suggests that oil prices will remain low at an average of US$53 per barrel in 2016. Low oil prices have also impacted other energy markets, especially European and Asian markets for natural gas. These spillover effects have additional negative implications for Russian energy exports.
Figure 2-3: Global Oil Spare Capacity and Inventories
Source: International Energy Agency.
Figure 2-4: The Growth of Global Oil Demand, Percent
Source: World Bank and International Energy Agency.
2,550
2,650
2,750
2,850
2,950
0
2
4
6
8
mb/d Million bbl
OPEC spare capacity (LHS)
OECD crude oil inventories (RHS)
-4
-2
0
2
4
2007Q1 2009Q1 2011Q1 2013Q1 2015Q1
ChinaOECDOther Non-OECD
mb/d, growth year over year

32
incomes due to inflation and exchange-rate effects combined with tight credit constraints is
expected to drive a decline in consumption and a rise in poverty rates. In particular, the high
projected rate of food-price inflation, which is already outpacing headline inflation, will
adversely impact households in the bottom 40 percent of the income distribution, as poorer
households spend a larger share of their income on food. Moreover, given the government’s
tight 2015 budget and the anticipated fiscal consolidation in 2016 and 2017, public wages,
pensions and other transfers are likely to decline in real terms. Households in the bottom 40
percent of the income distribution depend heavily on public transfers, and this, combined with
projected trends in inflation, threatens to reverse Russia’s substantial achievements in reducing
poverty and promoting shared prosperity.
In all three scenarios, the poverty rate is projected to rise above 14 percent in 2015, or
close to 20.5 million people. However, poverty trends in 2016 and 2017 vary by scenario.
Under the baseline scenario the poverty rate is expected to increase slightly to 14.6 in 2016
(20.9 million) and decrease to 14.0 percent (20.1 million) in 2017. In the lower-bound scenario,
the poverty rate is projected to increase to 15.8 percent (22.6 million people) in 2016 and 16.5
percent (23.5 million people) in 2017, erasing all gains since 2006. In the upper-bound scenario,
the poverty rate is projected to fall faster from its 2015 peak but by 2017 it would still be above
its 2014 level at close to 11.7 percent (16.8 million people).
Figure 2-5 Poverty Rate Projections, Percent
Source: Rosstat and World Bank staff estimates.
The Baseline Scenario
In the baseline scenario Russia’s real GDP is projected to contract by 3.8 percent in 2015
and 0.6 percent in 2016, before recovering to a modest 1.5 percent growth rate in 2017
(Table 2-2). This baseline is closely aligned with the outlook presented in the April 2015 issue
of the Russia Economic Report as oil-price forecasts remain broadly similar. However, the
15.2
13.3
13.413.0
12.5
12.7
10.7 10.8
14.2
14.6
14.0
11.2
14.5
15.8
16.5
14.1
13.0
11.7
0.41
0.412
0.414
0.416
0.418
0.42
0.422
0.424
10
11
12
13
14
15
16
17
2006 2007 2008 2009 2010 2011 2012 2013 2014 2015 2016 2017
Baseline scenario Lower-bound oil price scenario
Upper-bound oil price scenario Gini (rhs)

33
revised growth projection reflects the deeper impact that a depreciating ruble and an
accelerating inflation rate are expected to have on household incomes and consumption in
2015. The new baseline scenario also assumes that net exports will make a stronger contribution
to growth, since imports are expected to drop further than initially projected. Finally, the new
baseline scenario assumes that investment demand will not recover until 2017, slightly later
than in the previous projection, due to continuing sanctions and static oil prices throughout the
projection period. Business and consumer confidence are expected to remain weak due to
policy uncertainty. As a result, domestic demand is expected to contract in 2015 and 2016, with
net exports remaining the sole factor supporting growth until 2017, when investment and
consumption growth are projected to become positive again.
Table 2-2: Economic Indicators, Baseline Scenario
2012 2013 2014 2015 2016 2017
Oil price (US$ per barrel, WB average) 105.0 104.0 97.6 53.0 53.0 55.0
GDP growth, percent 3.4 1.3 0.6 -3.8 -0.6 1.5
Consumption growth, percent 6.4 3.9 1.5 -7.5 -1.7 1.0
Gross capital formation growth, percent 3.0 -6.6 -5.7 -15.5 -2.0 6.8
General government balance, percent of GDP 0.4 -1.3 -1.2 -4.3 -2.1 -1.7
Current account (US$ billions) 71.3 34.8 58.4 97.3 90.3 76.5
Current account, percent of GDP 3.6 1.6 3.2 8.1 6.9 5.3
Capital and financial account (US$ billions) -30.9 -45.4 -146.6 -113.0 -82.4 -67.0
Capital and financial account, percent of GDP -1.5 -2.2 -7.8 -9.5 -6.3 -4.6
CPI inflation (average) 5.1 6.8 7.8 15.5 7.5 5.0
Exchange rate, annual average (RUB/US$) 31.1 31.8 38.0 62.3 61.0 58.2
Source: Rosstat, Ministry of Finance, CBR, and World Bank staff estimates.
The baseline scenario includes a number of monetary and fiscal policy assumptions. While
the central bank is expected to adhere to its inflation-targeting regime, continuing fallout from
the ruble devaluations in end-2014 and mid-2015 is expected to keep both headline and core
inflation in double digits through the second half of 2015, resulting in an average inflation rate
of 15.5 percent for the year (Table 2-2). This will limit the pace of monetary easing in 2015.
Devaluation concerns are projected to wane in 2016 as oil prices stabilize, and low consumer
demand is expected to slow the inflation rate to an average of 7.5 percent. In 2017, the inflation
rate is expected to drop to 5 percent, in line with the central bank’s medium-term target.
Russia’s consolidated fiscal balance is projected to deteriorate from 1.3 percent of GDP in 2014
to 4.3 percent in 2015. Because the projected reduction in expenditures in 2015 would not
compensate for the concurrent decline in revenues, the government is expected to drawdown
the Reserve Fund substantially. The overall government deficit is projected to decrease in 2016
and 2017 due to an expected significant fiscal consolidation.
Consumption is projected to contract for two consecutive years, dropping by 7.5 percent
in 2015 and 1.6 percent in 2016 as real household incomes decline. While the Russian labor
market is expected to adjust to lower labor demand predominantly through real wage cuts,
double-digit inflation will reduce household income in the second half of 2015. Together with

34
a drop in real public transfers this is expected to cause private consumption to contract by 9
percent in 2015. The lingering effects of the sharp decline in economic activity in 2015 followed
by stagnating real wages and public transfers in 2016 is expected to further erode real income,
leading to a 1.5 percent contraction in private consumption. Only in 2017, when inflation is
projected to fall to an average of 5 percent, are real incomes expected to increase modestly,
supporting a recovery in private consumption and helping to build growth momentum in the
economy.
Investment is projected to continue declining throughout 2015 and 2016 due to weak
consumer demand and policy uncertainty. Economic sanctions are expected to further restrict
access to longer-term external capital for major Russian investors, especially in the resource-
sector. Meanwhile, the moderate anticipated pace of monetary easing would keep the cost of
domestic credit high in 2015-1016. Tight government budgets and high import prices for
investment goods and construction materials suggest that large public infrastructure projects
may be delayed or scaled down. As a result, the baseline scenario estimates a contraction in
gross capital formation of 15.5 percent in 2015 and 2 percent in 2016, partly driven by inventory
destocking (Table 2-2).
Nevertheless, the relative price adjustment could support increased investment in
manufacturing industries that are already competitive in international markets.
International sanctions could also boost domestic production in selected sectors, though
increased production at existing capacity levels is most likely over the short-to-medium term.
Over the medium term, some productive factors may be reallocated to new sectors, assuming
that capital costs fall and new comparative advantages prove durable.
Low international commodity prices and the impact of sanctions will continue to affect
Russia’s external accounts. Adjustments in the current account will continue during the second
half of 2015. Despite the declining value of merchandise exports (due to low commodity prices)
the trade balance is likely to increase as imports continue to fall. The CA will also be supported
by a further improvements in the investment income and service accounts. As a result, the
baseline scenario projects that the current account will strengthen in 2015 to US$97.3 billion
(8.1 percent of GDP), up from US$58.4 billion (3.2 percent of GDP) in 2014. In 2016, a modest
acceleration in import growth in a context of stable exports will cause the current account to
deteriorate to US$90.3 billion (6.9 percent of GDP). Economic sanctions are expected to limit
roll-over capacity and access to external financing among Russia’s major banks and
corporations. However, pressure on the capital account should gradually subside as the debt-
service profile improves in 2015-2017 following the already significant deleveraging of external
obligations by the private sector. The expected exchange-rate stabilization would help to curb
capital flight and slow the acquisition of foreign exchange by the general public, moderating
net capital outflows. The capital-account deficit is projected to decrease from US$113 billion
in 2015 to US$82.4 billion in 2016 and US$67 billion in 2017.

35
The Lower-Bound Scenario
The lower-bound scenario, in which oil prices fall well below the baseline projection,
estimates that GDP could contract by as much as 4.3 percent in 2015 and by another 2.8
percent in 2016. This scenario assumes that oil prices will continue to drop in the second half
of 2015, averaging US$43 in the latter six months. This would yield an overall average of US$50
per barrel in 2015, which would slide further to an average of US$40 per barrel in 2016 and
2017. Falling oil prices would cause a sharper contraction in both consumption and investment
than predicted in the baseline, resulting in significantly worse growth outcomes in 2015 and
2016. The ruble would continue to depreciate moderately in response to lower oil prices.
Elevated inflationary expectations would accelerate the erosion of real incomes and increase
interest rates on consumer and commercial credit. As a result consumption would contract by
8.4 percent in 2015 and by 3.8 percent in 2016 (Table 2-3). In 2015 and 2016 both private and
public investment would contract more sharply than in the baseline due to more expensive
imported investment goods, higher credit costs and lower consumer demand.
Table 2-3: Economic Indicators, Lower-Bound Scenario
2012 2013 2014 2015 2016 2017
Oil price (US$ per barrel, WB average) 105.0 104.0 97.6 50.0 40.0 40.0
GDP growth, percent 3.4 1.3 0.6 -4.3 -2.8 0.0
Consumption growth, percent 6.4 3.9 1.5 -8.4 -3.8 -1.8
Gross capital formation growth, percent 3.0 -6.6 -5.7 -20.6 -5.1 3.2
General government balance, percent of GDP 0.4 -1.3 -1.2 -4.6 -4.0 -2.9
Current account (US$ billions) 71.3 34.8 58.4 97.8 97.7 90.3
Current account, percent of GDP 3.6 1.6 3.2 8.3 8.5 7.1
Capital and financial accounts (US$ billions) -30.9 -45.4 -146.6 -112.9 -99.4 -92.1
Capital and financial accounts, percent of GDP -1.5 -2.2 -7.8 -9.6 -8.6 -7.2
CPI inflation (average) 5.1 6.8 7.8 15.8 8.0 5.0
Exchange rate, annual average (RUB/US$) 31.1 31.8 38.0 63.0 67.1 63.8
Source: Rosstat, MoF, CBR and World Bank staff estimates.
The lower-bound scenario projects a more severe deterioration in the fiscal position than
in the baseline but also a more stable current account. The loss of export revenue would be
offset by a steep drop in imports as the ruble continued to depreciate. This would strengthen
the current account slightly relative to the baseline. No significant changes in capital outflows
are expected in 2015 due to the same underlying assumptions of continued international
sanctions and weak private-sector confidence. In 2016 the continued decline in oil prices and a
sharper economic contraction would keep the cost of external financing elevated and further
limit the debt-rollover capacity of the private sector. This would result in a somewhat higher
capital-account deficit than in the baseline. On the fiscal side, the continuing depreciating of
the ruble would only partially compensate for the loss of oil revenue and the fiscal impact of
slowing economic activity. No major changes in the level or composition of public spending are
expected in the lower-bound scenario, because the government is assumed to keep real
spending close to the baseline level. As a result, the general government deficit would amount

36
to 4.3 percent of GDP in 2015 and 3.2 percent in 2016. Larger deficits are expected to be
financed by a more rapid drawdown of the Reserve Fund combined with an increase in external
borrowing.
The Upper-Bound Scenario
In the upper-bound scenario, real GDP would contract by 3.1 percent in 2015, followed by
1.3 percent growth in 2016 and 1.7 percent growth in 2017. As in the lower-bound scenario,
these growth projections are primarily driven by oil prices, which in this case are expected to
rise to US$58 per barrel in 2015, US$63 per barrel in 2016 and US$67 per barrel in 2017. Higher
oil prices are expected to have a positive spillover effect on economic activity. As oil prices
rise from the second half of 2015 through 2017 the ruble is expected to strengthen, which would
ease inflationary expectations. Inflation would average 7.0 percent in 2016 before falling to
the central bank target of 5 percent in 2017. This would improve real wage and income
dynamics and allow the central bank to cut the policy rate more aggressively to support credit
growth. Continued improvements in terms-of-trade would also increase the purchasing power
of households. In the upper-bound scenario, consumption would contract by only 7.0 percent
in 2015 and then become positive in 2016 and 2017 (Table 2-4). In 2015, gross capital formation
would contract by 14.7 percent, compared with 15.5 percent in the baseline. In 2016
investment demand would grow for the first time since 2012 supported by lower interest rates
and higher oil prices. Nevertheless, investment would recover slowly in 2016 due to continued
sanctions. The fiscal position would improve with higher oil prices and the government is likely
to slightly support an investment recovery through public infrastructure projects towards the
end of 2016 and in 2017.
In the upper-bound scenario, Russia’s fiscal position will strengthen, and its external
balances will slightly improve. The positive fiscal impact of higher oil prices would be
augmented by rising nonoil tax revenue as the economic recovery accelerated. No major
changes in spending are expected in 2015, as oil prices would be only modestly above the
budget’s current reference price, and a fiscal consolidation effort would still be required. Thus
the same 5 percent cut in real expenditures is assumed in 2015. However, in 2016-2017, higher
revenue than in the baseline and the upcoming parliamentary election could motivate the
government to lessen consolidation efforts and support economic recovery both in 2016 and
2017. As borrowing costs would decline in this scenario, large public infrastructure projects
would be expected to accelerate relative to the baseline and the cut in real expenditures may
be less than in the baseline. As a result, the projected deficit will be 3.2 percent in 2016 and
2.9 percent in 2017, about one percentage points higher than in the baseline for both years.
The current account would be somewhat weaker than in the baseline scenario, both in 2015
and 2016, as rising imports would more than offset the positive impact of higher oil prices on
the trade balance. With flexible exchange system in place, flows on capital account are
expected to largely mirror the current account changes. Despite the continued imposition of
international sanctions higher oil prices would moderately improve bank and corporate debt
roll-over capacity. The capital-account deficit would narrow slightly compared to the baseline,
with net capital outflows falling to 2013 levels by 2017.

37
Table 2-4: Economic Indicators, Upper-Bound Oil Scenario
2012 2013 2014 2015 2016 2017
Oil price (US$ per barrel, WB average) 105.0 104.0 97.6 58.0 63.6 67.1
GDP growth, percent 3.4 1.3 0.6 -3.2 1.3 1.7
Consumption growth, percent 6.4 3.9 1.5 -7.0 2.1 2.8
Gross capital formation growth, percent 3.0 -6.6 -5.7 -14.7 3.5 5.6
General government balance, percent of GDP 0.4 -1.3 -1.2 -4.5 -3.2 -2.9
Current account (US$ billions) 71.3 34.8 58.4 81.9 68.9 50.8
Current account, percent of GDP 3.6 1.6 3.2 6.3 4.4 2.8
Capital and financial account (US$ billions) -30.9 -45.4 -146.6 -92.5 -72.5 -42.5
Capital and financial account, percent of GDP
-1.5 -2.2 -7.8 -7.1 -4.7 -2.3
CPI inflation (average) 5.1 6.8 7.8 15.2 7.0 5.0
Exchange rate, annual average (RUB/US$) 31.1 31.8 38.0 57.3 51.6 47.5
Source: Rosstat, MinFin, CBR and World Bank staff estimates.
2.2. Risks and Policy Challenges
Russia faces significant external macroeconomic risks, including an uncertain global growth
outlook and volatile oil prices. Russia’s medium-term growth trajectory will hinge on its
successful adjustment to this new economic environment and the resolution of lingering risks
to financial stability and fiscal sustainability.
Overall risks to the global outlook remain tilted to the downside. Some previous concerns,
such as the threat of deflation in the euro zone, have abated, yet new financial stability and
growth risks have emerged. Deteriorating economic prospects in some developing economies,
especially commodity exporters, are eroding their resilience. Uncertainty in developing
countries and a slowdown in major emerging markets is increasing global financial pressures,
which are already elevated due to the anticipated normalization of US monetary policy. In
addition, the broad-based appreciation of the US dollar could slow the US economic recovery
to a greater extent than currently expected. Further volatility in global commodity prices
accompanied by a slowing US economy could severely disrupt international financial markets
and derail growth in developing countries and emerging economies. However, the growth
benefits generated by lower oil and nonoil commodity prices could also prove stronger than
current projections indicate.
Emerging economies, including Russia, continue to endure significant financial and
exchange-rate pressures. Recent stock market adjustments and currency depreciation,
combined with the renewed strength of the US dollar and the persistent weakness of commodity
prices, have sparked a sharp selloff in emerging-market currencies and equities and put upward
pressure on borrowing costs. Although recent disruptions were mostly concentrated in equity
and currency markets, borrowing costs also rose in emerging economies due to a general
increase in risk aversion, with the Emerging Market Bond Index spread rising by 50 basis points

38
since end-July. Significant outflows from emerging-market equity funds continued through
August, though bond outflows were more measured.
A high degree of oil-price volatility significantly increases the uncertainty of global energy
market forecasts. In addition to the standard array of supply- and demand-side variables, OPEC
policies represent a major source of exogenous risk. Persistently low global oil prices have been
driven in part by OPEC’s November 2014 decision not to engage in supply management. Since
then, OPEC officials have repeatedly stated that the cartel will maintain this policy even if
prices fall to US$20 per barrel. The next OPEC meeting will take place on December 4.
In an uncertain global economic context, Russia must maintain policy flexibility while
continuing to pursue policies that will facilitate its macroeconomic adjustment to a new
external environment. Financial sector stability and fiscal sustainability risks remain especially
prominent. Adhering to inflation targeting within a flexible exchange-rate regime will continue
to allow for timely monetary adjustments to shore up external balances and maintain adequate
international reserves.
Russia’s financial sector remains in a state of heightened vulnerability, which is negatively
impacting investment. Financial sector authorities will need to continue earmarking resources
to support Russia’s systemically important banks. While many of Russia’s largest banks are
state-owned or state-controlled, sectoral support must be impartially selective, as the
government’s resources would not be sufficient to support the entire financial system in the
event of a major disruption. The central bank’s efforts notwithstanding, high interest rates
continue to exert upward pressure on funding costs, while credit levels are decline and defaults
are increasing. This threatens to create a vicious cycle in which a shortage of investment credit
increases lending rates, which in turn tighten credit constraints and further discourage
investment.
Government and central bank policies implemented as part of the anti-crisis plan are
providing short-term relief to banks, yet these measures are also keeping systemic risks
elevated, and additional financial-market restructuring measures are warranted. Bank
liabilities continue to rise relative to both the stock of liquid assets and the real earnings
potential of those assets. Deteriorating asset values make banks more vulnerable to funding
shortfalls, especially smaller banks. Liquidity support from the central bank and the collateral
requirements for central bank loans could expose the declining market value of assets on bank
balance sheets. Russia’s banking sector remains overcrowded, with around 770 registered
banks, and it is likely that some smaller institutions may need to be removed from the market.
The central bank’s current liquidity-support measures have avoided a banking crisis, but
solvency margins are thinning and banks are becoming unprofitable. To maintain the viability
of the sector liquidity measures should be accompanied by a medium-to-long-term sector
restructuring plan designed to ensure that banks successfully rebuild their capital assets (Box
2-3).

39
Box 2-3: Financial Market Restructuring Options
Certain recent banking crises have been marked by liquidity shortages that eventually caused bank failures even while underlying solvency positions remained satisfactory; the Russian situation, however, is essentially the reverse. The central bank and the government are providing ample liquidity support (while closing small unviable banks) and allowing banks to trade foreign exchange at favorable ruble rates. Russia has also set up its own internal version of the international SWIFT payment system. While these are important short-term stabilization measures they do not address underlying solvency issues, since the deterioration of asset values (due to lower lending rates, rising NPLs and diminished collateral value such as for real estate) will eventually erode statutory solvency margins. The central bank is currently exercising regulatory forbearance by not requiring that banks immediately recognize asset losses and the consequent decline in their solvency margins. However, without assets-generating returns bank profitability will eventually become negative, as indeed has already happened in some banks, as a rising stock of nonperforming assets will drain bank resources.
Three policy options can help to address this problem and restore the long-term health of the banking sector. These can be implemented individually or jointly by the central bank and the government:
(i) Launch a bank-strengthening program under which a portion of the income earned by banks is allocated to loan-loss reserves for the next five years; this will prepare banks to write-off fully nonperforming assets and maintain sound balance sheets.
(ii) Contract asset-management companies to transfer and manage bad loans from the sector, enabling them to earn fees for collecting on bad loans, which could be temporarily replaced on bank balance sheets with long term bonds. Such a scheme would need to be designed based on the probable receipt of sufficient returns on bad assets to pay for asset-management fees and cover at least some of the interest payable on the bonds, which can initially be low-yield and with advances provided by the government.
(iii) Based their progress under the above programs during a period of at least two years the central bank should begin closing banks that are still considered unviable and insolvent, though creditors would suffer losses during liquidation.
Risks to fiscal sustainability are rising as existing buffers deteriorate and oil-price
projections remain low. This issue has already become apparent in the current budget cycle,
and the government has adjusted its proposed 2016 budget to reflect lower anticipated oil
prices. The revenue uncertainty resulting from volatile oil prices makes medium-term budget
planning difficult, and policymakers are currently attempting to shorten the budget horizon to
one year. Improvements in expenditure efficiency could help the government maximize the
value of its existing resources, but such gains may not be enough to compensate for increasing
structural imbalances. Going forward the government will need to develop a policy framework
for long-term expenditure management, complete with a corresponding financing strategy.
Rising fiscal pressures warrant a comprehensive review of expenditure priorities—including
major expenditure items such as national defense, economic subsidies, and social programs
and pensions—as well as a renewed discussion of external borrowing limits. The fiscal rule
should be refined to enable more rapid adjustments in the face of changing oil prices. Prudent
management of fiscal buffers will absolutely essential, including measures to increase
transparency in investment decisions. Strengthening public investment management would help
to ensure that scarce capital resources generate adequate long-run returns.
The transformation process that began with the recent macroeconomic adjustment
presents a set of risks, and managing them will pose a key policy challenge over the medium

40
term. Russian policymakers are confronted with complex challenges posed by the short-term
economic adjustment to external changes coupled with major internal long-term shifts in its
society and economy. In the short-to-medium term, Russia’s changing external environment
will continue to alter the internal structure of its economy, and while adapting to relative price
changes and the reallocation of productive factors to new sectors is a difficult process, policies
that facilitate Russia’s economic transformation could have lasting positive effects. In the long-
term, facilitating structural change will be especially critical as Russia will strive to cope with
a simultaneous demographic and economic transformation driven by a rapidly aging and
shrinking population and by the diminishing relative importance of the natural resource sector
(see Part III). Successfully addressing these challenges will require a combination of fiscal
discipline, regulatory restraint and institutional capacity building while resisting pressure to
adopt policies that may temporarily mitigate the disruptive effects of the adjustment at the
expense of the country’s long-term growth. Consequently, political-economy risks present a
serious threat to Russia’s economic outlook.
In the short-term, reforms that promote the reallocation of productive factors would enable
the private sector to take full advantage of the opportunities generated by the recent
change in relative prices, potentially leading to a broad improvement in Russia’s
international competitiveness. Achieving this goal will require a further retrenchment of the
public sector’s economic role and a shift in focus toward providing highly effective regulatory
institutions that foster robust competition. Strong signals indicating the government’s
commitment to regulatory discipline and to policies that facilitate the process of
macroeconomic adjustment would speed the recovery of private-sector confidence and
promote investment despite tight financial conditions. Though it poses a number of serious
short-term challenges, given an appropriately supportive policy environment Russia’s current
macroeconomic transformation could substantially enhance its medium-term growth potential.
However, without deep and sustained structural reforms Russia will remain at serious risk of
falling into a medium-term low-growth trap.

41
Part 3. Russia’s Dual Transformation - The Fiscal Implications
of an Aging Population and the Diminishing Economic Role of
the Natural Resource Sector 14
The Russian Federation is undergoing a major demographic and economic transformation
driven by a rapidly aging population and by the diminishing economic importance of the natural
resource sectors. Russia’s total population will shrink by an estimated 2 million people by
2050. At the same time, the old-age dependency ratio will increase by more than 50 percent,
from 0.4 retirees per active worker to about 0.64. Meanwhile, the total output of the oil and
gas sectors will remain broadly stable, and as productivity in other economic sectors continues
to grow, the role of natural resources will diminish significantly in the decades to come. These
trends will have important macroeconomic and fiscal implications, as the changing size and
composition of both the population and the real economy will directly and indirectly impact
the public finances. A narrowing base for income tax collection and pension contributions will
limit revenue inflows, while the government’s social-policy commitments will intensify
expenditure pressures. An aging population can shift the demand for the provision of public
services in healthcare, long term care, and education, as well as changing the size of transfers
through the pension system.
14 This note was prepared by Birgit Hansl based on a report by Harun Onder and Fernando Hernandez titled “Fiscal Implications of Aging and Natural Resource Dynamics.” The original report was part of a suite of papers prepared for the World Bank’s Aging Research Project for the Russian Federation under the guidance of Birgit Hansl. The team would like to thank Lalita Moorty, Philip O’Keefe, Emilia Skrok, Sonia Plaza, Harun Dogo, Maurizio Bussolo, Sergei Ulatov, Mikhail Matystin, Victoria Levin, Oleksiy Sluchinskyy, and all those who participated at the Higher School of Economics Conference, which yielded useful comments and discussions. The team would also like to thank Olga Emelyanova, Alexiy Balaev, and Maria Kazakova for providing data used in this analysis.

42
3.1. The Demographic Challenge
Demographic changes are transforming the Russian Federation. Russia’s population peaked
at about 149 million people in 1990, just prior to the dissolution of the Soviet Union, but by
2008 it had shrunk to about 142 million. In 2010, the population stabilized and slightly
rebounded, reaching an estimated 143.5 million in 2013 (Figure 3-1A). However, this trend is
not expected to continue over the long term. According to the baseline projections of the
Russian Statistical Office (Rosstat), the country’s total population will gradually decrease by
about 2 million, reaching 141 million by 2050. Rosstat’s alternative scenarios anticipate that by
2050 the total population could be as low as 116 million or as high as 165 million. The United
Nations (UN) Population Division projects a more conservative baseline scenario, roughly
corresponding to the low-end Rosstat forecast, and the UN’s high-end scenario is similar to
Rosstat’s baseline. Moreover, the decline in the total population is expected to be accompanied
by a substantial increase in the relative share of the elderly population (Figure 3-1B).
Figure 3-1: Population Dynamics in the Russian Federation, 1970–2050
Source: UN Population Division (historical) and Rosstat (projections).
Source: UN Population Division (historical) and Rosstat (projections).
These projected changes in the size and composition of the Russian population have
potentially serious economic implications. A simultaneously shrinking and aging population
can depress economic growth by reducing the size of the labor force. Meanwhile, the evolution
of the capital stock would depend on country-specific factors that affect savings decisions.15
The net effect on production would be determined by the magnitude of these two changes.
Demographic trends will also affect the public finances, both directly and through their
influence on the real economy. On the revenue side, a smaller, older population will narrow
the base for tax collection and social security contributions. On the expenditure side, the policy
commitments involved in caring for Russia’s aging population, as well as the shifting demands
of the population itself, will intensify spending pressures in the health and education sectors,
while profoundly altering the composition of social security transfers.
15 Dedry, Onder and Pestieau (2014).
110
120
130
140
150
160
170
19
701
974
19
781
982
19
861
990
19
941
998
20
022
006
20
102
014
20
182
022
20
262
030
20
342
038
20
422
046
20
50
Mill
ion
s
A. Total Population
Baseline Population
0%
10%
20%
30%
40%
50%
60%
70%
80%
90%
100%
2014 2018 2022 2026 2030 2034 2038 2042 2046 2050
Shar
e o
f To
tal P
op
ula
tio
nB. Age Composition (Baseline)
Young Age Working Age Old Age

43
As Russia’s demographics continue to evolve, ensuring the sustainability of the fiscal
balances will become an increasingly complex yet crucial task. The Russian government’s
ability to manage long-term structural changes in revenue and expenditure dynamics will
determine the extent to which it can provide the public goods and services required by an aging
society. Anticipating the impact of demographic trends on the fiscal balances can inform timely
policy decisions and help avoid potential solvency problems. In this context the following
section presents a projection model designed to quantify the macro-fiscal impact of Russia’s
changing demographics over the next four decades. The analysis combines projected trends in:
(i) the population and the labor force, (ii) the real economy, including the natural resource
sector, (iii) fiscal revenues, with specific attention to the fiscal rule governing resource
revenues, and (iv) public spending, particularly age-related expenditures such as education,
healthcare and social security. As many underlying factors are difficult to project with
precision, the analysis employs a scenario approach that reflects a wide range of possibilities
for multiple drivers of macroeconomic and fiscal outcomes. These include lower-, middle- and
upper-bound scenarios for demographic trends, oil prices and labor-productivity growth, as well
as a policy scenario in which the government implements measures to boost labor-force
participation.
The analysis devotes special attention to the natural resource sector, which is always a
major factor in macroeconomic and fiscal projections for Russia. While the resource sector’s
output is expected to remain broadly stable over the medium term, the sector’s share of GDP
is expected to shrink over time due to productivity growth in the non-resource economy. This
trend could magnify the fiscal implications of demographic change. Other resource-rich
countries have successfully leveraged their resource sectors to finance the liabilities generated
by an aging population (see Box 3-1). However, while Russia’s resource sector is expected to
help ease fiscal pressures early in the projection period, its diminishing economic importance
and the increasing costs of an aging population limit its ability to sustain fiscal equilibrium
through the projection horizon.
3.2. The Growth Implications of Demographic Trends
An aging population has an ambiguous effect on per capita output, which complicates
economic forecasting in Russia.16 The three most important and uncertain components of
Russia’s GDP are (i) the size of the labor force, (ii) the marginal productivity of labor, and (iii)
16 A decline in fertility reduces the number of workers and increases the inactive population relative to the workers (the dependency rate). Other things being equal, this could reduce per capita output. However, since a decline in fertility does not immediately affect worker’s incentives to save (unless institutional factors like a specific type of Pay-As-You-Go (PAYG) social security system create such incentives), there are fewer workers, and each worker has access to more capital, so that labor productivity, and perhaps per capita output, rises. Similarly, an increase in longevity increases the number of inactive people, which alone would reduce per capita output. However, those who expect to live longer are likely to increase their savings to support consumption over a longer lifetime. These adjustments will increase the capital stock, thus increasing labor productivity, and moderate the decline in the number of workers, seeing the output per capita increase. Institutional factors will determine how aging affects the real economy in net terms. For example, a defined contribution pension system heightens incentives to save, which may increase capital per worker and therefore per capita output, while a defined benefit system would achieve the opposite, see Dedry, Onder, and Pestieau (2014) for a formal discussion on this.
44
natural resource prices, in particular oil prices. The simulations presented below draw on labor-
force estimates by Balaev et al.17 In the baseline forecast, the size of the labor force is expected
to decline from about 75 million in 2014 to about 64 million by 2050 (Figure 3-2A). In the low-
end population scenario, the labor force plummets to 55 million, whereas in the high-end
scenario it diminishes modestly to 72 million.18 Other simulations explore the potential impact
of government policies designed to increase labor-force participation (LFP).19 In the baseline
scenario, these policies add about 4 million participants to the labor force by 2050 (Figure
3-2B.). Uncertainty is also a major factor in labor-productivity growth projections, and three
scenarios based on the data series developed by Balaev et al. simulate changes in output per
worker in the non-resource sector (Figure 3-2C). Finally, a set of simulations explores the
potential impact of developments in the natural resource sector. Projecting oil and gas prices
is notoriously difficult, as they reflect a constellation of unpredictable supply- and demand-
side variables. However, the resource sector is largely unaffected by aging, as it is extremely
capital intensive and employs only a small share of the labor force. The projections presented
below assume that oil production will gradually decrease from 520 million tons in 2014 to 436
million tons in 2050 (Figure 3-2D). In the baseline scenario, oil prices stabilize at around US$100
per barrel (in constant 2014 US$), while in the low-end scenario they fall to US$69 per barrel
(Figure 3-2E).20
Overall projections for Russia’s GDP are based on three aggregate scenarios. The analysis
includes three scenarios for demographic trends, three scenarios for labor productivity, three
commodity-price projections, and two labor-policy scenarios. All together, these variables yield
a total of 54 alternative GDP forecasts. Since it is not feasible to discuss all 54 potential
outcomes individually, and in order to avoid arbitrary mapping between different variables, the
analysis consolidates these alternatives into an aggregate baseline scenario, an optimistic
scenario and a pessimistic scenario. These are defined as follows:
The baseline scenario uses median forecasts for demographic variables, the size of the
labor force, labor productivity, and oil and gas prices; no government policies increase
LFP.
The optimistic scenario uses upper-bound forecasts for demographic variables, the size
of the labor force, labor productivity, and oil and gas prices; government policies
successfully boost LFP.
17 Balaev, A.; Ivanova, M.; Prilepskiy, I. and Ulatov S. (2015). “The Demographic Transition and Long-Term Growth.” World Bank Aging Research Project for the Russian Federation. Washington DC: The World Bank 18 This employment forecast assumes that the 5 percent unemployment rate observed in 2013 reflected an economy at full capacity (IMF 2013), so in this scenario that rate is extended through the projection horizon. 19 These include supporting youth employment through internships and vocational training, strengthening regulations regarding the employment of disabled persons, and stepping-up measures to encourage female participation in the labor force by expanding access to childcare and elder care (Balaev et.al. 2015). 20 The short-term projections for oil prices and other variables are different in this part from the rest of the document
report as the underlying research was finalized in 2014.

45
The pessimistic scenario uses lower-bound forecasts for demographic variables, the size
of the labor force, labor productivity, and oil and gas prices; no government policies
boost LFP.21
These simulations indicate that GDP growth will slow gradually over time, and that changes
in labor productivity and labor-market policies may have a greater impact on GDP growth
than oil prices. In the baseline scenario the annual nonoil GDP growth rate rises to 2.3 percent
in 2018 and then moderates to 1.6 percent over the long term, as a slight increase in labor
productivity fails to offset a substantial decline in the size of the labor force (Figure 3-2).22 In
the optimistic scenario long-term annual GDP growth averages about 2.7 percent, while in the
pessimistic scenario growth averages just 0.4 percent. Using the baseline scenario as the
reference point enables an assessment of each variable’s individual impact on GDP.23 The
differences between high-end, low-end, and baseline assumptions for the growth of labor
productivity and the size of the labor force widen over time, and their impact on GDP is more
pronounced in the later years of the simulation period (Table 3-1). By contrast, the effects of
oil and gas prices on GDP diminish over time, because the relative economic size of the resource
sector gradually shrinks as the non-resource sectors grow. Finally, policies that encourage
greater LFP are effective at boosting GDP. By 2050 the projected increase in the labor force
increases GDP by about 6 percentage points over the baseline scenario, exceeding the positive
effect of higher oil prices.
Table 3-1: Marginal Effects of Labor Productivity, Oil Prices, and Labor Policies on Baseline GDP
Labor Productivity Effects Oil Price Effects Labor Policy Effects
High End Low End High End Low End Medium Policy
(USD, billions) 2020 45.9 -58.8 43.1 -40.6 39.3
2030 132.4 -132.5 32.0 -64.6 103.7
2040 281.5 -262.1 34.4 -69.4 148.3
2050 481.2 -445.5 33.7 -68.1 216.7
(Percent of current GDP) 2020 2.1 -2.6 1.9 -1.8 1.8
2030 5.0 -5.0 1.2 -2.4 3.9
2040 9.0 -8.4 1.1 -2.2 4.7
2050 13.3 -12.3 0.9 -1.9 6.0
Source: World Bank staff calculations.
21 It should be noted that a low-end demographic scenario could increase per capita income, since the old-age dependency ratio is greatest in the high-end demography scenario. 22 A recent study by the Gaidar Institute (Goryunov et al. 2013) presents a similar projection. 23 For example, starting from the baseline it is possible to make projections using the high-end labor productivity scenario while keeping all others variables at their baseline levels. The resulting GDP projections can then be compared to the baseline scenario in terms of values and percentage deviations.

46
Figure 3-2: Baseline Trajectories and Projection Boundaries
Sources: Rosstat, IMF and World Bank staff calculations.
3.3. The Fiscal Implications of Russia’s Aging Population
An aging population can profoundly affect the size and composition of both revenues and
expenditures. Aging directly alters the demand for public goods and services by increasing the
total number of beneficiaries and by shifting the focus of service provision. For example, a
rising number of elderly people will, ceteris paribus, lead to both a general increase in public
spending and a specific increase in demand for healthcare and pensions. Conversely, a decline
in the share of young people will prompt a relative decrease in education spending. Public
50
55
60
65
70
75
80
2014 2018 2022 2026 2030 2034 2038 2042 2046 2050
Mill
ion
s
A. Labor Force
Baseline Population Low Variant High Variant
55
60
65
70
75
80
85
2014 2018 2022 2026 2030 2034 2038 2042 2046 2050
Mill
ion
s
B. Labor Force with Labor Market Policy
Baseline Population Low Variant High Variant
0.0
0.5
1.0
1.5
2.0
2.5
3.0
3.5
4.0
2014 2018 2022 2026 2030 2034 2038 2042 2046 2050
Per
cen
t
C. Labor Productivity Growth in Non-Resource Sectors
Baseline Growth Low Variant High Variant
300
400
500
600
700
800
900
2014 2018 2022 2026 2030 2034 2038 2042 2046 2050
Mln
To
nn
es (
Oil)
, or
Bln
Cu
bic
Met
ers
(Gas
)
D. Hydrocarbon Production
Natural Gas Oil
40
50
60
70
80
90
100
110
120
130
140
2014 2018 2022 2026 2030 2034 2038 2042 2046 2050
USD
E. Oil Prices (Annual Averages)
Baseline Price Optimistic Price Pessimistic Price
-0.5
0.0
0.5
1.0
1.5
2.0
2.5
3.0
3.5
4.0
2014 2018 2022 2026 2030 2034 2038 2042 2046 2050
Per
cen
t
F. Non-Oil GDP Growth
Baseline Pessimistic Boundary Optimistic Boundary

47
spending responds to age-related changes in demand because governments have explicit and
implicit commitments to provide public education, pensions, healthcare and other social
services. Aging also affects revenues. Taxes and social security contributions are largely tied to
individual income, and changing demographics can influence the size of the revenue base and
alter the sources of tax revenue. For example, an increase in the share of retirees may reduce
income tax revenue relative to VAT, capital gains, inheritance or other taxes. Aging also affects
the nature of the real economy, with indirect implications for revenues and expenditures. For
example, if an upward shift in the median age is associated the sustained growth of per capita
GDP (as in the familiar “demographic transition” phenomenon), rising income levels will
compound the increase in demand for healthcare services generated by the aging of the
population. Similarly, rising real wages can indirectly increase social security spending by
raising expectations for retirement income.
An analysis of Russia’s long-term fiscal prospects must also consider the evolution of natural
resource revenues. Natural resources accounted for one-third of total public revenues in 2014.
However, this share is likely to fall over time, as resource output is expected to remain stable
while productivity steadily rises in the non-resource economy. Resource revenues are windfall
gains to the government and have little direct impact on private disposable income if not
injected back into the economy through fiscal programs. By contrast, rising wages driven by
increasing labor productivity boost both public revenues and private income, and as noted
above, private income growth will intensify demand for public goods and services. Finally,
because they directly affect only a small subset of economic activities, resource-related taxes
and royalties have a limited impact on demand for public services. Over time, the growing fiscal
importance of taxes on the non-resource economy may further increase expenditure pressures.
Revenue Projections
Fiscal revenues from the non-resource sectors are expected to rise over time. The simulations
presented here assume that non-resource revenues will increase more rapidly than non-
resource GDP, i.e. that the income elasticity of revenues is greater than 1. This assumption is
based on several observations. First, in a progressive tax system rising incomes typically
generate an especially large increase in revenue from higher marginal tax brackets. Second,
rising income levels prompt consumers to spend more on normal and superior goods, which are
usually subject to higher tax rates than inferior goods. Third, more effective tax-collection
mechanisms and policies to curb informality, both of which are associated with higher per
capita income levels, will further boost tax revenues. Fourth, individual social security
contributions grow proportionately with per capita income, though in the aggregate they are
also affected by the number of workers. Due to these factors, in the baseline scenario non-
resource fiscal revenues increase from about 28 percent of non-resource GDP in 2014 to 32
percent by 2050. Fiscal revenues reach 30 percent of non-resource GDP in the pessimistic
scenario and 36 percent in the optimistic one (Figure 3-3A).
The share of natural resource revenues in total fiscal revenues is projected to decline. In the
baseline scenario natural resource output rises only slightly, as an expected increase in natural
gas production is offset by a drop in oil production and the stabilization of oil prices. As a result,

48
the net increase in natural resource revenues fails to keep pace with the growth of non-resource
revenues, and the share of resource revenues in total fiscal revenues decreases from about 30
percent in 2014 to 14 percent by 2050 (Figure 3-3B).
Figure 3-3: Baseline Revenue Trajectories and Projection Boundaries
Sources: Rosstat, IMF and World Bank staff calculations.
Expenditure Projections
A combination of rising non-resource GDP and an aging population will significantly alter
expenditure patterns over time. In the baseline scenario, spending on categories that are not
affected by demographics is expected to decline from 24.6 percent of GDP in 2014 to 19.5
percent by 2050 (Figure 3-4A). This pattern is based on the assumption that while public
investments often entail large initial costs, these costs do not necessarily grow in line with GDP.
Age-related spending categories such as education, healthcare and social security are affected
both by the aging of the population and by the projected increase in non-resource GDP.24
Overall, primary expenditures in all categories are expected to rise. By 2050, noninterest
government spending increases from 36.7 percent of GDP in 2014 to 37.8 percent in the baseline
scenario, or to 42.3 percent in the pessimistic scenario, though it drops to 32.8 percent in the
optimistic scenario (Figure 3-4E). Age-related spending rises in the baseline scenario from about
32 percent of total expenditures in 2014 to 49 percent in 2050 (Figure 3-4F). Education remains
stable as a share of total spending, but the shares of healthcare spending and social security
transfers rise by 3 and 14 percentage points, respectively.
Public spending on education is projected to increase modestly in absolute terms, while
healthcare spending would rise more rapidly. The projected increase in GDP is expected to
boost education expenditures (as richer citizens typically demand better education quality),
though the number of young people would remain stable at around 23-26 million.25 In the
baseline scenario, public education spending increases from about 4.1 percent of GDP in 2014
24 There is no empirical consensus regarding the size of income elasticities of demand for public services. Cross-country evidence usually suggests income elasticities above 1 for health care spending: Newhouse (1977) found an elasticity of 1.35 for 30 OECD countries and Leu (1986) found 1.2 for 19 OECD countries. A study by the European Commission (2012) used 1.3 to project healthcare expenditures. The simulations in this chapter use 1.2. 25 The number of young people does not decline significantly because the baseline scenario assumes that the fertility rate rebounds from 1.6 percent in 2020 to 1.9 in 2050. Education spending may also rise in response to changing policy priorities.
27
29
31
33
35
37
2014 2018 2022 2026 2030 2034 2038 2042 2046 2050
Re
ven
ue
s/G
DP
(%
)
A. Non-Resource Revenues
Baseline Pessimistic Boundary Optimistic Boundary
0%
10%
20%
30%
40%
50%
60%
70%
80%
90%
100%
Per
cen
t o
f G
DP
B. Decomposition of Tax revenues
Direct Taxes Indirect Taxes Non-Tax Revenues Oil Revenue Transfers Grants

49
to 4.3 percent in 2050 (Figure 3-4B). Education expenditures in the optimistic scenario begin
to exceed those in the pessimistic scenario in 2026, and the gap continues to rise through the
end of the forecast period.26 Population aging is expected to increase the share of health
expenditures in total spending, as older people typically require more healthcare, including
more expensive forms of long-term care.27 Meanwhile, rising per capita income levels are
expected to compound the increasing demand for healthcare generated by an aging population.
As a result, public healthcare spending climbs from about 3.9 percent of GDP in 2014 to about
5 percent by 2050 in the baseline scenario (Figure 3-4C). Health spending reaches similar levels
in the pessimistic (5.3 percent) and optimistic (4.7 percent) scenarios.
Financing the pension system’s increasing deficit is expected to drive a large expansion in
age-related public spending.28 All three scenarios predict that by 2050 the pension fund’s
deficit will double, rising from about 4 percent to 8 percent of GDP or more (Figure 3-4D).29
The different deficit trajectories reflect the interaction between GDP growth and old-age
dependency ratios. The optimistic scenario incorporates both the highest GDP growth rate and
the highest old-age dependency ratio. In the 2030s, these two factors expand the deficit to a
much greater extent than in the pessimistic scenario. By 2050, however, the impact of GDP
growth dominates, and the optimistic scenario projects the lowest pension fund deficit as a
share of GDP.
Figure 3-4: Baseline Trajectories and Projection Boundaries: Primary Expenditure
26 Over the first decade of the forecast period, the non-resource sector’s share of GDP is greater in the pessimistic scenario, and education spending is also higher. Over time, the higher fertility rates in the optimistic scenario increase the number of young people, which boosts education spending. 27 The projected fiscal burden can vary significantly depending on the methodology used. The demographic approach assumes costs to track only changes in income and the number of people in different cohorts, while other studies indicate that healthcare costs mainly reflect proximity to death rather than nominal age. Therefore, increasing longevity may not necessarily drive up health care costs. Healthcare costs may also be affected by advances in medical technology. New treatment options could boost per capita health expenditures faster than income growth. 28 Russia has recently reformed its social security system, and these projections may vary if the new system parameters are used. 29 This demography approach holds worker contributions and recipient benefits constant as a share of per capita income. Different assumptions for economic growth and social security system characteristics can alter the simulations. For instance, a 2013 World Bank study using a more optimistic growth outlook found that Russia’s social security deficits could be held to low single digits if the average benefit of all current recipients were capped at half the average wage by 2050.
15
18
21
24
27
2014 2018 2022 2026 2030 2034 2038 2042 2046 2050
Per
cen
t o
f G
DP
A. Non-Age-Related Expenditures
Baseline Pessimistic Boundary Optimistic Boundary
3.6
3.8
4.0
4.2
4.4
4.6
4.8
2014 2018 2022 2026 2030 2034 2038 2042 2046 2050
Per
cen
t o
f G
DP
B. Public Education Expenditures
Baseline Pessimistic Boundary

50
Sources: Rosstat, IMF and World Bank staff calculations.
Fiscal Sustainability
Economic and demographic changes are projected to generate protracted fiscal deficits
over the coming decades. In the baseline simulations the primary deficit widens to 3 percent
of GDP (Figure 3-5A). In the optimistic scenario the deficit climbs to 1.1 percent of GDP in the
medium-term but then gradually narrows, ultimately becoming a surplus in the second half of
the projection period. By contrast, in the pessimistic scenario the primary deficit rapidly widens
to 6 percent of GDP and reaches 9 percent by 2050. The overall fiscal balance, which includes
interest payments on public debt, is projected to hold at about 4 percent of GDP throughout
the baseline forecast (Figure 3-5C), as the interest rate on Russia’s debt is assumed to remain
well below its projected rate of GDP growth.30 Nevertheless, persistent deficits push the public
debt-to-GDP ratio from less than 20 percent in 2014 to 116 percent by 2050. The total public
debt falls to just 0.3 percent of GDP in the optimistic scenario but rises to a staggering 272
percent in the pessimistic scenario.
Changes in oil-price projections have the largest impact on the debt-to-GDP ratio. The
influence of various assumptions on the debt-to-GDP ratio is measured using the baseline
scenario as the reference point and changing the assumptions for labor productivity, labor
30 These simulations assume a 1 percent real interest rate on domestic debt and a 1.2 percent rate on external debt; in the baseline scenario GDP would grow by 2.5 percent annually. The debt-burden assumptions should therefore be regarded as conservative.
3.8
4.2
4.6
5.0
5.4
2014 2018 2022 2026 2030 2034 2038 2042 2046 2050
Per
cen
t o
f G
DP
C. Public Health Care Expenditures
Baseline Pessimistic Boundary Optimistic Boundary
3.0
4.0
5.0
6.0
7.0
8.0
9.0
10.0
2014 2018 2022 2026 2030 2034 2038 2042 2046 2050
Per
cen
t o
f G
DP
D. Transfers to Pension Fund
Baseline Pessimistic Boundary Optimistic Boundary
32
34
36
38
40
42
44
2014 2018 2022 2026 2030 2034 2038 2042 2046 2050
Per
cen
t o
f G
DP
E. Primary Expenditures
Baseline Pessimistic Boundary Optimistic Boundary
0%
10%
20%
30%
40%
50%
60%
70%
80%
90%
100%
2014 2018 2022 2026 2030 2034 2038 2042 2046 2050
Shar
e o
f P
rim
ary
Exp
end
itu
res
F. Primary Expenditure Decomposition
Other Expenditures Health Care ExpendituresEducation Expenditures Transfers to the Pension Fund

51
market policies and oil prices. Switching from the baseline projection to the high-end
projection for labor productivity would reduce the debt-to-GDP ratio by 16.8 percentage points.
Using the high-end projection for labor-market policies would reduce the ratio by 24.9
percentage points, and using the high-end projection for oil prices would cut the debt-to-GDP
ratio by a full 43.3 percentage points (Table 3-2).There are two reasons for the outsized impact
of oil prices on the debt-to-GDP ratio. First, greater economic productivity and successful labor
market policies would increase non-resource GDP, but they would also boost public spending
by raising demand for education, healthcare, pensions, and non-age-related spending. Second,
oil prices have a direct effect on revenues, and the declining share of oil revenues is largely
responsible for the expanding primary deficit. Yet, the oil sector’s impact on spending is smaller
than that of the other two variables, and consequently the net improvement in fiscal balances
is greater.
Figure 3-5: Fiscal Sustainability Indicators
Sources: Rosstat, IMF and World Bank staff calculations.
-10.0
-8.0
-6.0
-4.0
-2.0
0.0
2.0
4.0
2014 2018 2022 2026 2030 2034 2038 2042 2046 2050
Per
cen
t o
f G
DP
A. Primary Balance
Medium Demography Pessimistic Boundary
0.0
2.0
4.0
6.0
8.0
10.0
2014 2018 2022 2026 2030 2034 2038 2042 2046 2050
Per
cen
t
B. Interest Payments to Revenue Ratio
Baseline Pessimistic Boundary
-14
-12
-10
-8
-6
-4
-2
0
2
4
2014 2018 2022 2026 2030 2034 2038 2042 2046 2050
Per
cen
t o
f G
DP
C. Overall Balance
Baseline Pessimistic Boundary Optimistic Boundary
0
50
100
150
200
250
300
2014 2018 2022 2026 2030 2034 2038 2042 2046 2050
Per
cen
t o
f G
DP
D. Debt Stock
Baseline Pessimistic Boundary Optimistic Boundary

52
Table 3-2: Marginal Impacts of Alternative Scenarios on the Baseline Debt-to-GDP Ratio, Percentage Point Deviation
Labor Productivity Effect Oil Price Effect
Labor Market Policy Effect
High Low High Low Moderate Policy
2020 -0.9 1.1 -8.5 7.0 -1.4
2030 -3.9 4.3 -21.8 29.3 -7.4
2040 -9.1 9.7 -33.8 50.8 -14.7
2050 -16.8 18.9 -43.3 70.4 -24.9 Source: World Bank staff calculations.
3.4. Can Russia’s Natural Resource Sector Mitigate the Fiscal
Implications of an Aging Population?
Russia’s aging population threatens its fiscal sustainability but the government has
instruments at its disposal that could mitigate the fiscal impact of demographic change. A
rising old-age dependency ratio is expected to put significant pressure on the fiscal balances,
which will be magnified by the relative decline in natural resource revenues. In the baseline
scenario, the debt-to-GDP ratio climbs to about 116 percent by 2050, and if productivity growth
stalls, oil prices drop, or the population ages by more than the baseline assumptions predict,
the ratio could rise to over 250 percent.
The two-tiered structure of Russia’s sovereign wealth fund provides a set of policy options
that could help manage demographic risks. The sovereign wealth fund comprises two fiscal
mechanisms, the Reserve Fund and the National Welfare Fund. Savings that accrue in the
Reserve Fund are used for fiscal stabilization. When combined with the current fiscal rule the
Reserve Fund can protect the economy from moderate fluctuations in oil and gas prices,
especially if prices fall for fewer than three consecutive years.31 This smoothing effect limits
the procyclicality of fiscal policies. Meanwhile, the National Welfare Fund can finance future
pension liabilities, and its role is expected to become increasingly crucial as the aging of the
population intensifies pressure on the fiscal balances. However, while savings from the fund
can cover temporary fiscal gaps, the mechanisms was not designed to finance the structural
increase in expenditures generated by an aging population, nor will its resources be sufficient
to cover the widening fiscal deficits projected over the coming decades (Annex 3-1).
Managing the secular increase in expenditure pressures caused by an aging population will
require significant structural reforms, especially of the pension system. Directly addressing
the root cause of the deficit—the rising old-age dependency ratio—could prove to be an
effective strategy. Labor market policies designed to boost LFP, adjustments to the retirement
age, changes in contribution rates, or a shift from publicly funded to contribution-funded
benefits could have a significant impact on systemic liabilities. The simulations presented here
31 Three years of consecutive decreases in oil prices triggers a shorter averaging horizon (3 years), which brings the benchmark price closer to the actual price cycle.

53
indicate that increasing LFP could reduce new debt by about 25 percent. However, achieving
long-term sustainability through labor market policies may be costly and could add to the short-
and medium-term fiscal burden.
If utilized strategically, natural resource revenues could finance the necessary reforms,
and a relatively small increase in short- and medium-term liabilities may be desirable if it
helps avoid a much larger increase over the long term.32 Amending the fiscal rule to
guarantee a certain amount of annual savings would increase the rate at which reserves are
accumulated. Currently, only residual revenue is transferred to the Welfare Fund, and this
happens when oil prices increase and the Reserve Fund is already at its ceiling. If oil prices
remain persistently low, no savings will accrue. Faced with similar challenges, a number of
countries have successfully amended their fiscal rules and used their sovereign wealth funds to
manage the impact of an aging population; Box 3-1, describes the Chilean experience. While
adequate savings will be necessary to maintain fiscal stability, increased financing alone will
not be sufficient to address the complex challenges facing Russian policymakers. In order to
overcome these challenges the government must draft a strategy and contingency plans for
managing its rising fiscal burden and begin building the institutional capacity and inter-agency
coordination necessary to implement effective structural reforms.
Box 3-1: The Chilean Experience with Fiscal Rules and Financing Social Security Liabilities
Achieving long-term fiscal sustainability in a context of profound demographic shifts may be costly in the short and medium term, but postponing necessary reforms will only exacerbate the future fiscal burden. In 1981, the Chilean government was confronted by a steep increase in the beneficiary-to-contributor ratio and replaced its PAYG pension system by a fully funded one based on individual capital accounts. However, the transition proved costly for the budget in the next few years, because contributions stopped flowing to the public accounts but benefits for those who had already retired under the old system continued to drain public finances. To make the reform feasible, the government also issued recognition bonds to recognize the pension claims of active contributors who were moved to the new funded system and provided guarantees of minimum pensions for those in the new system. Substantial fiscal resources were needed to finance the transition. Ruiz-Tagle and Castro (1997) estimated that in the decade after the reform the additional fiscal burden averaged more than 6 percent of GDP annually, but overall, these policies brought back long-term fiscal solvency. Over time, the pool of old beneficiaries shrank by attrition and the cost of the reform gradually faded, yet the minimum pension guarantees remained a source of considerable fiscal burden. However, postponing the reforms would have only added to this burden, because old-age dependency ratios kept increasing, and thus the pool of retirees entitled to pension benefits would have gone up with each year of postponement. Chile consolidated the reform process in 2006 by passing a Fiscal Responsibility Law that obligates the government to contribute 0.2-0.5 percent of GDP annually to the Pension Reserve Fund, which was created to pay the statutory minimum in social security benefits. A similar approach in Russia would not only facilitate its transition to a more sustainable fiscal path, but would also help shore-up living standards for those who may be negatively affected by the transition.
32 Simulations of alternative price trajectories show that a recovery from the current slump in oil and gas prices could cause a long-term increase in savings accumulated in the wealth funds. Although the Reserve Fund hits its threshold value of 7 percent of GDP in 2035, the Welfare Fund reaches just 5 percent. However, this only occurs in the outer years of the projections, by which time the old-age dependency ratio will be about 50 percent higher than it is now, and as a result reforming the social security system will be more costly and more politically difficult.
54
3.5. References
Dedry, A., H. Onder, and P. Pestieau. 2014. “Aging, Social Security Design and Capital Accumulation,” Center for Operations Research and Econometrics (CORE) Discussion Paper Series 023, Université catholique de Louvain.
Engel, E., M. Marcel, and P. Meller. 2007. “Meta de Superávit Estructural: Elementos para su Análisis,” Report prepared for the Ministry of Finance.
Escolano, Julio, 2010. “A Practical Guide to Public Debt Dynamics, Fiscal Sustainability, and Cyclical Adjustment of Budgetary Aggregates: Technical Notes and Manuals Series. IMF Fiscal Affairs Department, International Monetary Fund, Washington, DC.
European Commission. 2012. “The 2012 Ageing Report: Economic and Budgetary Projections for the EU-27 Member States (2010–2060).” European Economy 2, Brussels, Belgium.
Goryunov, Eugene, Maria Kazakova, Laurence J. Kotlikoff, Arseny Mamedov, Kristina Nesterova, Vladimir Nazarov, Elena Grishina, Pavel Trunin, and Alexey Shpenev. 2013. “Russia’s Fiscal Gap." NBER Working Paper 19608, National Bureau of Economic Research, Inc., Cambridge, MA
Government of the Russian Federation. 2014. “Employment Plan.” https://g20.org/wp-content/ uploads/2014/12/g20_employment_plan_russian_federation.pdf
IMF. 2013. “Article IV Consultation Staff Report.” International Monetary Fund, Washington, DC. IMF. 2014.
Jabłonowski, J., and C. Müller. 2014. “Sustainability of Fiscal Policy in Poland.” Research Center for Generational Contracts, Freiburg University.
Leu, R. 1986. “The public-private mix and international health care costs,” AJ Culyer, B. Jönsson (Eds.), Public and private health services, Basil Blackwell, Oxford
Newhouse, J. P. 1977. “Medical care expenditure: A cross-national survey”. Journal of Human Resources 12, 115-125.
Onder, Harun. 2015. “Macroeconomic and Fiscal Implications of Aging in Europe and Central Asia.” background paper for The Golden Age of Aging. World Bank, Washington, DC.
Onder, Harun, Pierre Pestieau, and Eduardo Ley.2014. “Macroeconomic and Fiscal Implications of Population Aging in Bulgaria.” Policy Research Working Paper Series No 6774. World Bank, Washington, DC.
Ruiz-Tagle, J.V., and F. Castro, F. 1997. “The Chilean Pension System.” OECD Working Paper AWP 5.6, Organisation for Economic Co-operation and Development, Paris.
Annex 3-1: Russia’s Fiscal Rule and Savings from Natural Resource
Revenues
Our projections show that the current fiscal rule, which determines the share of natural
resource revenues that is saved, will not accumulate enough savings to cover the rise in
financing that an aging population requires. As Figure A-1A shows, the benchmark price has a
smoother trajectory than the actual price, especially when the benchmark price is the 10-year

55
moving average. However, savings from natural resource revenues are only likely when oil
prices are going up. Figure A-1D shows that in the beginning of the projections there are no
savings from natural resource revenues in the baseline and pessimistic price scenarios. As a
result of withdrawals and growing GDP, the Reserve Fund balance shrinks from about 4.7
percent of the GDP to 0 percent in the medium term in the baseline and pessimistic price
scenarios. As oil prices recover over the long term, savings turn positive, especially in the high-
price scenario but also in the baseline (Figure A-1E). However, our simulations show that in the
long run the cumulative National Welfare Fund balances will not be adequate to cover the fiscal
deficits. Toward the end of the projection horizon deficits keep widening, but National Wealth
Fund assets remain at about 5 percent of GDP at all times (Figure A-1F). These savings are
barely enough to finance two years of deficits.
Figure A-1: The Performance of the Fiscal Rule in Different Oil Price Scenarios
Sources: Rosstat, IMF and World Bank staff calculations.
60
80
100
120
2014 2018 2022 2026 2030 2034 2038 2042 2046 2050
USD
A. Reference Prices (Baseline)
Benchmark Price 3-Year Moving Average10-Year Moving Average Actual Price
50
70
90
110
130
2014 2018 2022 2026 2030 2034 2038 2042 2046 2050
USD
B. Benchmark Oil Prices
Baseline Price Optimistic Price Pessimistic Price
100
150
200
250
300
2014 2018 2022 2026 2030 2034 2038 2042 2046 2050
Bill
ion
USD
C. Transfers to Budget
Baseline Price Optimistic Price Pessimistic Price
-120
-80
-40
0
40
2014 2018 2022 2026 2030 2034 2038 2042 2046 2050
Bill
ion
USD
D. Savings from Natural Resource Revenues
Baseline Price Optimistic Price Pessimistic Price
-1%
0%
1%
2%
3%
4%
5%
6%
7%
8%
2014 2018 2022 2026 2030 2034 2038 2042 2046 2050
Bal
ance
to
GD
P R
atio
E. Reserve Fund Balance
Baseline Price Optimistic Price Pessimistic Price
2%
3%
4%
5%
6%
7%
8%
2014 2018 2022 2026 2030 2034 2038 2042 2046 2050
Bal
ance
to
GD
P R
atio
F. Welfare Fund Balance
Baseline Price Optimistic Price Pessimistic Price

56
Annex: Main Macroeconomic Indicators
2007 2008 2009 2010 2011 2012 2013 2014 Jan Feb Mar Apr May Jun Jul Aug
GDP, % change, y-o-y 8.5 5.2 -7.8 4.5 4.3 3.4 1.3 0.6 - - -2.2 - - -4.6 - -
Industrial production, % change, y-o-y 6.8 0.6 -10.7 7.3 5.0 3.4 0.4 1.7 0.9 -1.6 -0.6 -4.5 -5.5 -4.8 -4.7 -4.3
Manufacturing, % change, y-o-y 10.5 0.5 -15.2 10.6 8.0 5.1 0.5 2.1 -0.1 -2.8 -1.9 -7.2 -8.3 -6.6 -7.1 -6.8
Extraction of mineral resources, % change, y-o-y 3.3 0.4 -2.8 3.8 1.8 1.0 1.1 1.4 1.5 0.1 0.4 -0.8 -0.9 -0.9 0.2 0.8
Fixed capital investment, % change, y-o-y 23.8 9.5 -13.5 6.3 10.8 6.8 0.8 -2.7 -3.9 -4.3 -2.7 -4.8 -7.6 -7.1 -8.5 -6.8
Federal government balance, % GDP 1/ 5.4 4.5 -5.9 -4.1 0.8 -0.1 -0.5 -0.5 -5.4 -7.4 -4.9 -4.4 -3.7 -2.6 -2.8
M2, % change, p-o-p 2/ 51.3 27.2 -3.5 30.6 23.3 17.9 15.4 7.3 -2.1 0.9 -0.3 1.5 0.6 0.6 0.5
Inflation (CPI), % change, p-o-p 9.0 14.1 11.7 6.9 8.5 5.1 6.8 7.8 3.9 2.2 1.2 0.5 0.4 0.2 0.8 0.4
Producer price index (PPI), % change, p-o-p 25.1 -7.0 13.9 16.7 13.0 6.8 3.4 6.1 1.3 2.1 5.5 2.7 -1.2 0.7 1.5 0.1
Nominal exchange rate, average, Rb/USD 25.6 24.8 31.7 30.4 29.4 31.1 31.8 38.4 61.7 64.6 60.2 52.9 50.6 54.5 57.1 65.2
Reserve Fund, bln USD e-o-p 137.1 60.5 25.4 25.2 62.1 87.4 87.9 85.1 77.1 75.7 76.4 76.3 76.8 72.9 70.7
National Wealth Fund, bln USD, e-o-p 88.0 91.6 88.4 86.8 88.6 88.6 78.0 74.0 74.9 74.4 76.3 75.9 75.7 74.6 73.8
Reserves (including gold) billion $, end-o-p 478 427 439 479 499 538 510 385 376 360 356 356 357 362 358 366
Trade Balance, billion $ (monthly) 123.4 177.6 113.2 147.0 196.9 191.7 181.9 188.7 15.3 13.7 15.4 15.0 15.3 13.8 10.7
Current Account, billion $ 72.2 103.9 50.4 67.5 97.3 71.3 34.1 56.6 - - 28.9 - - 19.2 - -
Export of goods, billion $ 346.5 466.3 297.2 392.7 515.4 528.0 523.3 496.7 27.8 29.3 32.7 31.5 30.9 30.3 27.7
Import of goods, billion $ 223.1 288.7 183.9 245.7 318.6 335.7 343.0 308.0 12.5 15.6 17.3 16.4 15.6 16.5 17.0
Average weighted lending rate for enterprises, % 3/ 10.8 15.5 13.7 9.1 9.3 9.4 9.4 18.3 19.9 18.1 17.9 17.2 16.0 15.5 14.7
CBR policy rate, %, end-o-p 10.0 9.5 6.0 5.0 5.3 5.5 5.5 17.0 17.0 15.0 14.0 12.5 12.5 11.5 11.5 11.0
Real average rate for Ruble loans, % (deflated by PPI) -3.4 -6.8 -0.1 -6.5 -3.2 3.9 5.5 11.7 12.1 8.1 4.3 1.9 2.3 2.1 1.4
Stock market index (RTS, ruble term, eop) 2,291 632 1,445 1,770 1,382 1,527 1,443 791 737 897 880 1,029 969 940 859 834
Real disposable income, (1999 = 100%) 245.6 251.5 259.3 272.5 274.7 286.2 297.7 294.7 201.3 263.6 254.7 286.6 256.4 279.3 284.8 285.2
Average dollar wage, US $ 532 697 588 698 806 859 942 841 449 511 558 665 649 638 575 479
Share of people living below subsistence, % 1/ 13.3 13.4 13.0 12.5 12.7 10.7 10.8 11.2 - - 15.9 - - 15.1 - -
Unemployment (%, ILO definition) 6.1 7.8 8.2 7.2 6.1 5.1 5.6 5.3 5.5 5.8 5.9 5.8 5.6 5.4 5.3 5.3
Source: Rosstat, CBR, EEG, IMF, staff estimates.
1/ Cumulative from the year beginning.
2/ Annual change is calculated for average annual M2.
3/ All terms up to 1 year.
2015
Income, Poverty and Labor Market
Financial Market Indicators
Balance of Payment Indicators
Fiscal and Monetary Indicators
Output Indicators