Embed Size (px)
Citation preview

RTR Use in Asphalt and Concrete
Arizona
Pavements/Materials
Conference
Arizona State University
Tempe, AZ
Nov 13-14, 2013
Doug Carlson
VP Asphalt Products

Rubberized Asphalt is Triple Green
Recycled Materials Have To Perform
Better, Save Money, and be
Sustainable

End of Life Tire Market
• About 300 Million End of Life Tires Generated
Each Year
• About One Per Person/Year
• About 10% Growth in RTR Asphalt/Year

Oil, Asphalt and Gas
$0.00
$0.50
$1.00
$1.50
$2.00
$2.50
$3.00
$3.50
$4.00
$4.50
$5.00
Jul-9
6
Jan-97
Jul-9
7
Jan-98
Jul-9
8
Jan-99
Jul-9
9
Jan-00
Jul-0
0
Jan-01
Jul-0
1
Jan-02
Jul-0
2
Jan-03
Jul-0
3
Jan-04
Jul-0
4
Jan-05
Jul-0
5
Jan-06
Jul-0
6
Jan-07
Jul-0
7
Jan-08
Jul-0
8
Jan-09
Jul-0
9
Jan-10
Jul-1
0
Jan-11
Jul-1
1
$/G
allo
n
Asphalt Crude Oil Gasoline
Dramatic Increase in Cost
Crude Oil, Gas and Asphalt Costs
Relative Cost of Rubber
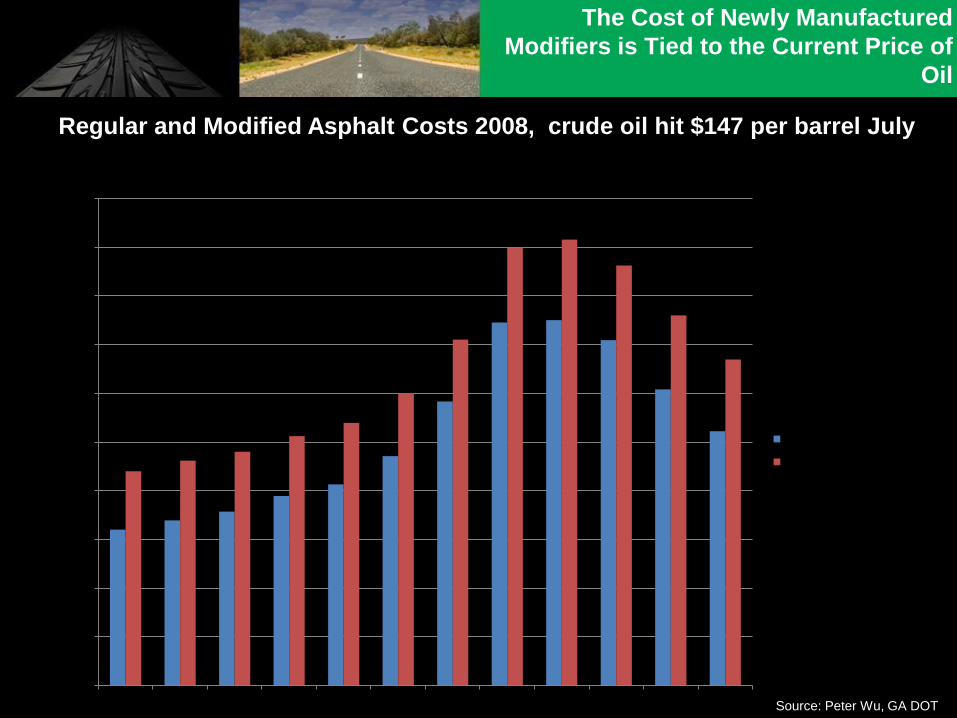
The Cost of Newly Manufactured
Modifiers is Tied to the Current Price of
Oil
0
100
200
300
400
500
600
700
800
900
1000
1-Jan 1-Feb 1-Mar 1-Apr 1-May 1-Jun 1-Jul 1-Aug 1-Sep 1-Oct 1-Nov 1-Dec
Asphalt ($/ton)
Polymer mod ($/ton)
Regular and Modified Asphalt Costs 2008, crude oil hit $147 per barrel July
Source: Peter Wu, GA DOT

RTR switch for SBS
Evaluation of Ground Tire Rubber in
Asphalt Binders and Mixtures

NCAT PG Results
7
Rubber Product Dosage Rate, % True Grade Performance Grade
-30 Liberty 10% 80.7 – 23.6 76 – 22
-20 Liberty 10% 83.1 – 24.6 82 – 22
-20 Liberty 15% 87.9 – 21.3 82 – 16
Crackermill 10% 82.8 – 23.1 82 – 22
Cryo-Hammer 10% 82.2 – 23.2 82 – 22
Cryo-Hammer 15% 86.7 – 19.3 82 – 16
-30 Liberty Fines 10% 79.8 – 20.4 76 – 16
-16 Powderizers (1mm
gap)
10% 76.3 – 21.8 76 – 16
-16 Powderizers (2
mm gap)
10% 84.7 – 21.8 82 – 16
Virgin Binder 69.2 – 24.7 67 - 22

RTR Alternative Modifier
• About 3 x RTR loading is needed compared to
SBS for similar properties.
– Example: 3% SBS content = 9% RTR Content
• Suppose SBS costs $2.00/Pound and RTR
Costs $0.50/Pound
– Example:
– 3 Pounds SBS = $6.00,
– 9 Pounds RTR = $4.50
• Project with 1000 Tons of Modified of Binder
– SBS at 3% = 30 Tons Needed @ $2.00 = $120,000
– RTR at 9% = 90 Tons Needed @ $0.50 = $90,000

• M320 – PG Asphalts, allow modifiers,
particulate 600 microns in size (30 mesh)
• T44 – Solubility Test
• MP19 – PG Asphalt using MSCR
• T315 – The DSR, 2 mm gap
AASHTO CHANGES
A Change in Acceptance
Testing
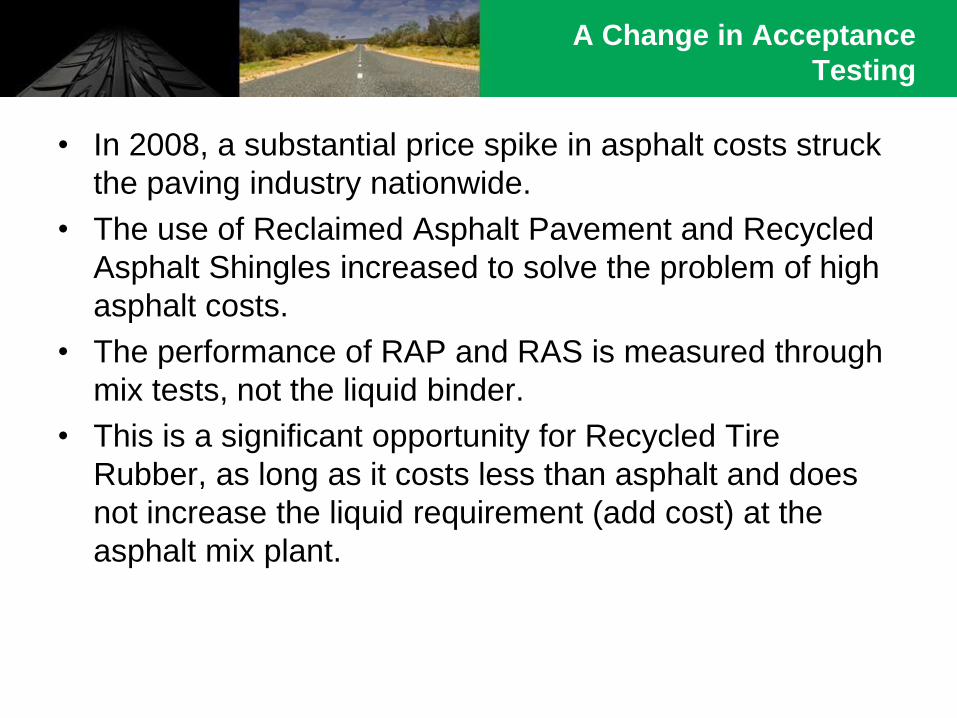
• In 2008, a substantial price spike in asphalt costs struck
the paving industry nationwide.
• The use of Reclaimed Asphalt Pavement and Recycled
Asphalt Shingles increased to solve the problem of high
asphalt costs.
• The performance of RAP and RAS is measured through
mix tests, not the liquid binder.
• This is a significant opportunity for Recycled Tire
Rubber, as long as it costs less than asphalt and does
not increase the liquid requirement (add cost) at the
asphalt mix plant.

Mix Performance Tests Are More
Common with the Use of RAP
and RAS

New “Dry Process”
• Research Published at the LTRC, (Sam Cooper and Louay Mohammad), work underway at several Universities and with-in suppliers to the asphalt industry
• Rubber particles pre-treated with useful liquids before packaging, or co-packaged with low melt
processing aids or powders before delivery to mix plant
• GA DOT using a co-packaged “Plant Mix” rubber

Test Section in Hawkinsville,
GA on SR 26

RTR Blended with Reactive
Type of Polymer

Blended RTR Being Added
To Plant at RAP Collar

Mixture Control
58-28
Control & %10
Wet Processed
Rubber
Control &
%10 Pre-
Treated
Rubber
Spec.
Total Binder content 7.5 7.5 7.5 -
Virgin Binder Added, % 7.5 7.5 7.5 -
Air Voids,% 4.3 4.7 4.8 4-6
Voids in Mineral Aggregate
% 19.7 21
20.5 18 min
Voids Filled with Asphalt,
% 78.2 77.6
76.8 65-78
Binder Absorbed, % 0.62 0.16 0.48 -
Dust to Binder Ratio 0.67 0.63 0.62 -

Test
Result
Control
58-28
Control +
10% Wet
Process
Rubber
Control +
10% Dry
GTR
Mix
Control +
10%
Pre-Treated
Rubber
Average
Overlay
Test
(OT)
Cycles
to
Failure
1466 381
230 1645

ASPHALTITE COVERING
ASPHALT-RUBBER BINDER
HYDRATED LIME
Emerging
Technologies

PelletPAVE™
Cost Effective and Convenient
Providing Asphalt-Rubber Technology for Pavement Maintenance
Emerging
Technologies

20
• Most Rubber Projects are still performing and do not need to be recycled.
• Over eight agencies have reported successful recycling projects at 15% or greater rubber Reclaimed Asphalt Pavement.
Rubberized Asphalt Can
Be Recycled

RTR Has Successful
Performance With Warm Mix
Rubber friction course on I-78
in New Jersey.
Rubberized asphalt
overlay on I-295 in
Massachusetts.
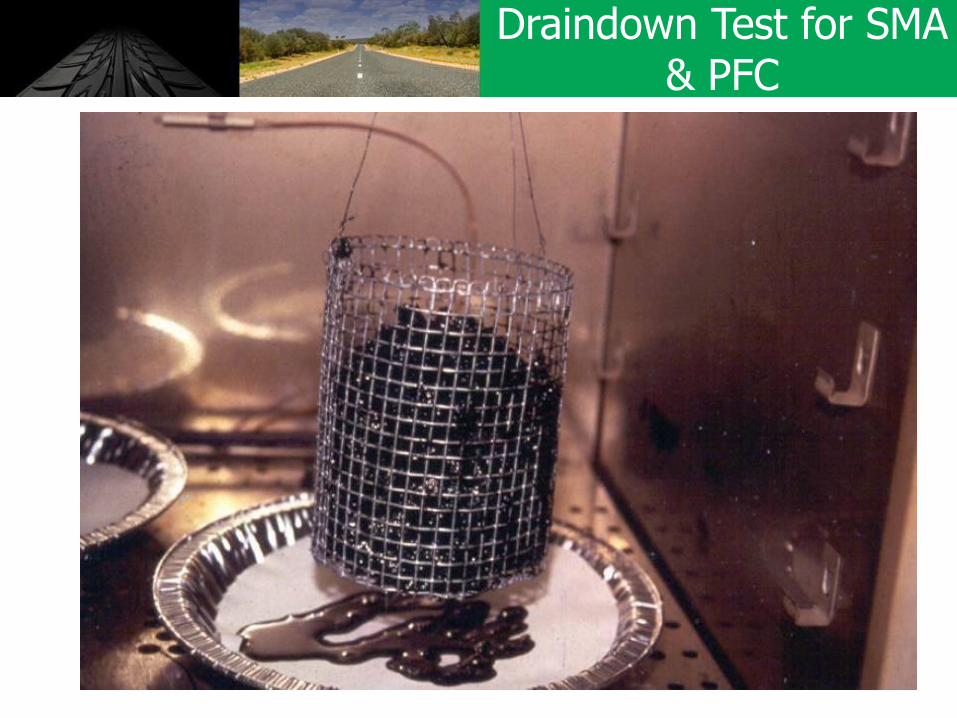
Draindown Test for SMA & PFC

Dense
Grade GAP (SMA) Grade
Coarse
Grind
Fine
Grind Polymer
Poly w
Fiber
Binder Content 5.0% 8.0% 6.0% 6.0% 6.5%
Rubber Content 20.0% 10.0%
Stones 25 30 30 30 30
Asphalt 28 35 30 33 36
Polymer 6 1
Fiber 7
Rubber 6 5
Blending 1 1 0
Total Materials per Ton
of Mix 53 72 65 69 73

Profilometer Test-Deck Park Tunnel I010 East HOV Comparison
PCCP to AR
10
20
30
40
50
60
70
80
90
100
110
120
130
140
150
160
170
100
200
300
400
500
600
700
800
900
100
0
110
0
120
0
130
0
140
0
150
0
160
0
170
0
180
0
190
0
200
0
210
0
220
0
230
0
240
0
250
0
260
0
270
0
Distance every 100ft
IRI(
IN/M
I)
PCCP
A R
Ride Quality / Roughness
IRI (in/mi) LANE
PCCP AR-ACFC
I010EHOV 96.34 43.57
I010ELN1 123.20 59.03
I010ELN2 104.29 48.81
I010ELN3 111.87 47.80
I010ELN4 115.30 52.91
I010WHOV 85.44 32.51
I010WLN1 87.94 37.79
I010WLN2 85.40 46.92
I010WLN3 96.83 46.11
I010WLN4 97.75 36.81

Rubberized Asphalt is Triple Green
Rubberized Asphalt Performs Better,
Saves Money, and is Sustainable

Hypothesis
• Rubber crumbs may function as a
distribution of mini expansion /
control joints inside the concrete.
• Thus, the crumb rubber concrete
may exhibit good characteristics in
controlling crack initiation and
propagation.

Field Experiments
• Feb 1999, ASU sidewalk, 40 lbs.
• June 2001, ASU wheel chair ramp,
20 lbs.
• May 2001, ADOT parking lot, 60
lbs.
• March 2002, residential patio
foundation in Mesa AZ, 20 cr/cy.
• April 2002, NAU campus (cold
climate), 60 lbs
• March 2003, residential sidewalk in
Scottsdale, AZ, 25 lbs.

• At Hanson’s Aggregates in Phoenix, AZ:
– test slab 5 x 25 feet and 2 inches thick
– 400 lbs of cr/cy, 25% of the concrete mix by volume
– was placed without any joints
– slab serves as a truck parking facility
– no cracks have been observed as of 2006
– provided useful experience about mixing, hauling, pumping, placing, finishing, and curing of crumb rubber concrete.
Tennis Court –
Phoenix, AZ

Tennis Court –
Phoenix, AZ
• January 2003:
experimental test slabs
– 2x4 ft in size
– thickness 2 - 3 inches
– 50 >-> 300 cr/cy.
• Tests included:
compressive strength,
flexural strength, indirect
tensile strength, and
thermal coefficient of
expansion.

Mix Characteristics
0
500
1000
1500
2000
2500
3000
3500
4000
4500
5000
0 50 100 150 200 250 300 350
RubberContent, Ibs/cy
Co
mp
res
siv
e S
tre
ng
th, p
si 3-day Strength
7-day Strength
28-day Strength
100
110
120
130
140
150
160
0 50 100 150 200 250 300 350
Rubber Content, Ibs, cy
Un
it W
t l
bs
/ft^
3
0
5
10
15
20
25
30
35
0 50 100 150 200 250 300 350
Rubber Content, Ibs/cy
Air
%
Air %C138
0
1
2
3
4
5
6
0 50 100 150 200 250 300 350
Rubber Content, Ibs/cy
Slu
mp
, in

Tennis Court Trial
Mixes

400 lbs / C.Y. Trial
Mix

Mix Behavior

Initial Test Results
0.56
2.782.39
0.31
0.83
5.30
0.00
1.00
2.00
3.00
4.00
5.00
6.00
Strain (%) Time to failure (sec) Tensile Strength (KN)
Test Parameter
Resu
lts
400 lbs Crumb Rubber / CY No Crumb Rubber

Tennis Court Before
Overlay
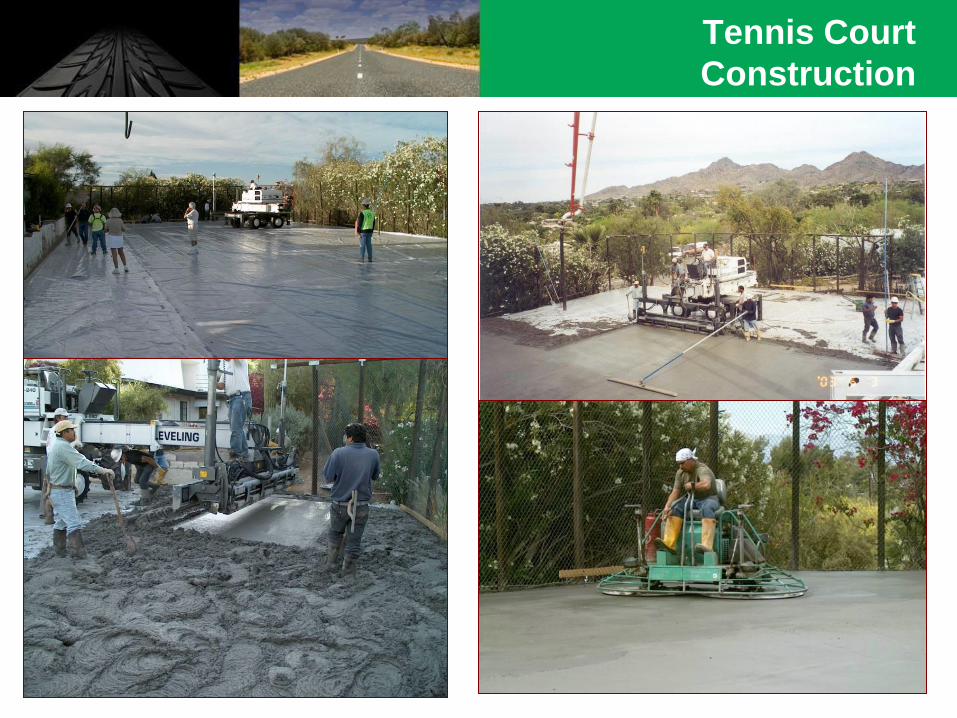
Tennis Court
Construction


ASU / ADOT Research
and Testing Program
• Evaluate CRC using fundamental
tests.
• Build and monitor field
demonstration test sections, and
evaluate the long term
performance and benefits of using
crumb rubber concrete materials.
• Share findings with state
governments, associations,
industry and private sector

Highway Related
Projects
Two UTW pavement test
sections

Glass Fibers Polypropylene
Crumb Rubber 50 Control

Laboratory Tests
• Compressive Strength
• Three Point Bending
• Panel Test
• Shrinkage
• Coefficient of Thermal Expansion

Compressive Strength
MIX. ID Age
Days
Average
Compressive
Strength
psi
Peak
Axial
Strain
in/in
(10 -3
)
Axial Modulus
of Elasticity
psi
(10 6)
Poisson's
Ratio
300 lbs per
Cyd (Const.) 7 822 9.65 0.15 NA
300 lbs per
Cyd (Const.) 28 1080 10.32 0.16 NA
400 lbs per
Cyd 14 546 6.50 0.11 NA
TW_CTR 14 5363 1.05 5.30 0.25
TW_CTR 28 5975 0.52 6.10 0.26
TW_CR 50 14 3704 1.29 3.14 0.25
TW_CR 50 28 4430 0.73 5.63 0.22

Parameters Measured
in Flexural Test • Flexural load (lbs)
• Deflection: Measured by the LVDT (in)
• Crack Mouth Opening Displacement (CMOD): Measured by the actuator (in)
MIX. ID Age
Days
Flexural
Load
lbs
CMOD
in
(10 -3
)
Flexural
Strength
(psi)
Toughness
psi x in
300 lbs per
Cyd (Const.) 28 481 1.85 157 9.4
TW_CTR 14 1049 0.97 341 8.4
TW_CTR 28 1188 1.30 387 10.3
TW_CR 50 14 807 1.67 263 7.6
TW_CR 50 28 932 1.39 303 9.5

300 lbs / C.Y. Tennis
Court Mix
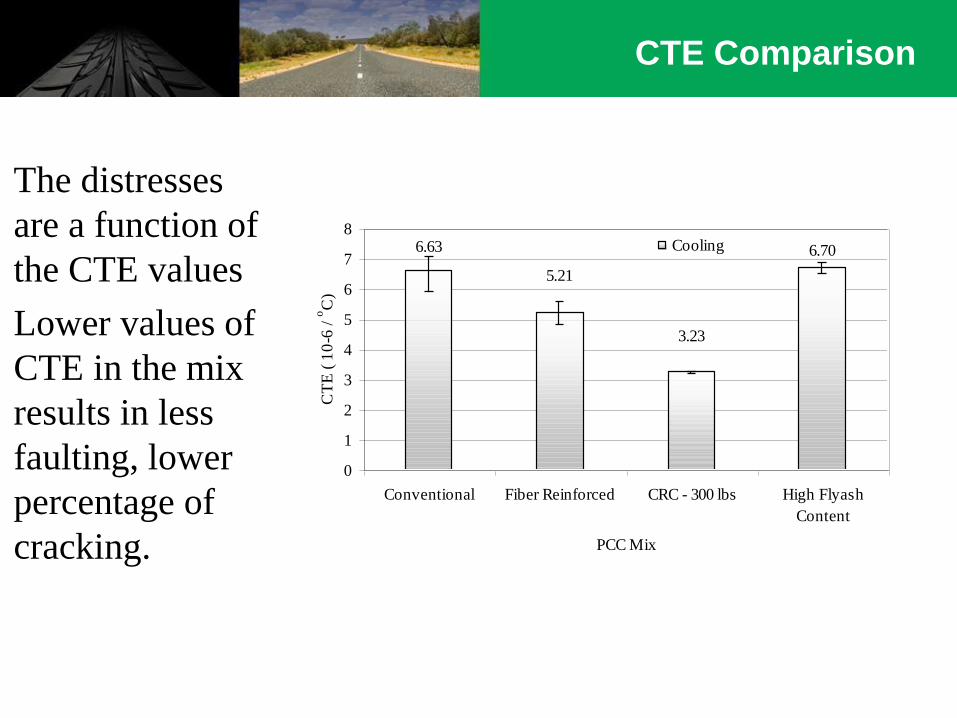
CTE Comparison
• The distresses
are a function of
the CTE values
• Lower values of
CTE in the mix
results in less
faulting, lower
percentage of
cracking.
6.70
3.23
5.21
6.63
0
1
2
3
4
5
6
7
8
Conventional Fiber Reinforced CRC - 300 lbs High Flyash
Content
PCC Mix
CT
E (
10
-6 /
oC
)
Cooling

Conclusions
• Advantage of unit weight reduction with increased crumb
rubber content.
• Entrapped air and very high rubber content contribute to
compressive strength reduction. However, higher strength
values are achievable depending on design requirements.
• Similarly, flexural strength reduction may be compensated
for by higher ductility and comparable toughness.
• Higher tensile strain at failure for CRC mixes is indicative
of higher energy absorbent mixes and less prone to
shatter.
• CTE results indicated that CRC mixes are more resistant
to thermal changes.

Final Thoughts
• Performance monitoring is needed to validate
durability and mix characteristics.
• There are advantages and disadvantages for
the use of CR PCC, careful consideration
should be given for each design case.
• Improved mixture characteristics are possible
through mix optimization. Watch for entrapped
air.
• Crumb rubber content is also specific for mix
usage or application.


![ASPHALT CONCRETE [Types] - KSU Facultyfac.ksu.edu.sa/sites/default/files/AC-1-LabTYPESDISTRESS.pdf · ASPHALT CONCRETE [Types] Introduction ... Sand Asphalt Mix Sand asphalt mixes](https://img.pdfslide.us/doc/110x75/5b72d5437f8b9a674d8d5d0c/asphalt-concrete-types-ksu-asphalt-concrete-types-introduction-sand.jpg)