1
ROYAL BANK OF CANADA (MONTREAL, QUEBEC) Exchange TSX Symbol RY Price C$49.80 (10/31/2006) 52Wk Range 50.70-24.25 Yield 3.21 P/E 16.44 *7 Year Price Score 115.59 *12 Month Price Score 105.31 *NYSE Composite Index=100 Interim Earnings (Per Share) Can$ Qtr. Jan Apr Jul Oct 2002-03 0.55 0.50 0.57 0.57 2003-04 0.59 0.58 0.57 0.37 2004-05 0.79 0.69 0.74 0.39 2005-06 0.89 0.85 0.90 ... Interim Dividends (Per Share) Amt Decl Ex Rec Pay 100% 3/3/2006 4/7/2006 3/27/2006 4/6/2006 0.36Q 3/3/2006 4/21/2006 4/25/2006 5/24/2006 0.36Q 5/26/2006 7/24/2006 7/26/2006 8/24/2006 0.40Q 8/25/2006 10/24/2006 10/26/2006 11/24/2006 Indicated Div: C$1.60 Valuation Analysis Forecast P/E 15.27 (11/29/2006) Market Cap C$63.5 Billion Book Value 21.5 Billion Price/Book 2.95 Price/Sales 2.06 Dividend Achiever Status 5 Year Growth Rate 15.57% Total Years of Dividend Growth 11 TRADING VOLUME (thousand shares) 12 16 20 24 28 32 36 40 44 48 52 100% 100% 1997 1998 1999 2000 2001 2002 2003 2004 2005 2006 0 25 50 75 Business Summary: Commercial Banking (MIC: 8.1 SIC: 6029 NAIC: 522110) Royal Bank of Canada is engaged in personal and commercial banking (RBC Banking), wealth management (RBC Investments), insurance (RBC Insurance), corporate and investment banking (RBC Capital Markets) and transaction processing (RBC Global Services). In the U.S., Co. provides personal and commercial banking, mortgage origination, insurance, full-service brokerage and corporate and investment banking services through RBC Centura and its subsidiaries RBC Mortgage and RBC Builder Finance, as well as through RBC Insurance, RBC Dain Rauscher and RBC Capital Markets. As of Oct 31 2005, Co. had total assets of C$469.52 billion, loans of C$191.91 billion and deposits of C$306.86 billion. Recent Developments: For the three months ended July 31 2006, net income increased 20.2% to C$1.18 billion compared with C$979.0 million in the equivalent quarter of the previous year. Results for 2005 included business realignment charges of C$1.0 million. Net interest income climbed 6.0% to C$1.76 billion. Total interest income jumped 36.4% to C$5.84 billion from C$4.28 billion, while total interest expense soared 55.5% to C$4.08 billion from C$2.63 billion in 2005. Provision for credit losses dropped 22.7% to C$99.0 million. Non-interest income grew 5.2% to C$3.45 billion from C$3.27 billion, while non-interest expense rose 4.7% to C$2.86 billion from C$2.73 billion in the year-earlier period. Prospects: On Nov 1 2006, Co., through its RBC Centura Bank subsidiary, signed an agreement with AmSouth Bancorp., by which Co. will acquire 39 branches in Alabama owned by AmSouth Bank for undisclosed terms. The transaction, which is expected to close in March 2007, indicates a continuation of Co.'s growth initiatives in North America and abroad. Separately, Co.'s results are reflecting solid revenue growth due to stronger trading results, as well as higher volumes in its wealth management and banking businesses. Collectively, these results bode well with Co.'s 2006 objectives for revenue to grow by 6.0 % to 8.0% and diluted earnings per share to increase by more than 20.0% over its 2005 levels. Financial Data Address: Royal Bank Plaza, 200 Bay Street, Toronto, M5J 2J5 Telephone: 416-974-5151 Web Site: www.rbc.com Officers: Gordon M. Nixon - Pres., C.E.O. Peter Armenio - Head U.S. & International Transfer Agents:The Bank of New York, New York, NY No of Institutions: 145 Shares: 544,284,416 % Held: 42.48 (Can$ in Thousands) 9 Mos 6 Mos 3 Mos 10/31/2005 10/31/2004 10/31/2003 10/31/2002 10/31/2001 Earnings Per Share 3.03 2.87 2.71 2.56 2.12 2.19 1.97 1.77 Cash Flow Per Share (10.98) (14.24) (19.21) (23.01) 0.58 (5.72) (2.25) (4.52) Tang Book Value Per Share 12.12 11.63 11.37 11.30 9.75 9.43 8.70 7.90 Dividends Per Share 1.360 1.305 1.220 1.175 1.010 0.860 0.760 0.690 Dividend Payout % 44.88 45.47 45.10 45.81 47.75 39.18 38.68 38.87 Income Statement Interest Income 16,060,000 10,220,000 5,060,000 16,958,000 13,776,000 14,053,000 14,672,000 17,307,000 Interest Expense ... ... 38,272 10,188,000 7,083,000 7,411,000 7,514,000 10,810,000 Net Interest Income 5,041,000 3,284,000 1,764,000 6,770,000 6,693,000 6,642,000 7,158,000 6,497,000 Non-Interest Income 3,067,420 3,143,420 2,953,000 9,310,000 8,438,000 7,378,000 5,355,000 5,499,000 Income Before Taxes 4,580,000 2,961,000 1,510,000 4,702,000 4,220,000 4,592,000 4,235,000 3,892,000 Income Taxes 1,061,000 680,000 332,000 1,278,000 1,232,000 1,460,000 1,365,000 1,350,000 Net Income 3,466,000 1,118,000 1,171,000 3,387,000 2,817,000 3,005,000 2,762,000 2,435,000 Average Shares 1,297,340 1,301,645 1,304,378 1,304,680 1,311,016 1,338,032 1,356,240 1,294,432 Balance Sheet Net Loans & Leases 204,505,000 197,146,000 192,757,000 190,416,000 186,543,000 170,394,000 169,258,000 178,822,000 Total Assets 523,969,000 502,893,000 487,874,000 469,521,000 429,196,000 403,033,000 376,956,000 362,483,000 Total Deposits 334,702,000 322,787,000 314,872,000 306,860,000 270,959,000 259,145,000 243,486,000 235,687,000 Total Liabilities 502,422,000 482,142,000 467,639,000 449,674,000 410,992,000 384,658,000 358,173,000 344,278,000 Stockholders' Equity 21,547,000 20,751,000 20,235,000 19,847,000 18,204,000 18,375,000 18,783,000 18,205,000 Shares Outstanding 1,275,753 1,286,064 1,290,982 1,286,448 1,279,770 1,312,042 1,330,514 1,348,041 Statistical Record Return on Assets % 0.81 0.81 0.76 0.75 0.68 0.77 0.75 0.74 Return on Equity % 19.09 18.69 18.02 17.80 15.36 16.17 14.93 15.46 Net Interest Margin % 30.09 30.65 34.86 39.92 48.58 47.26 48.79 37.54 Loans to Deposits 0.61 0.61 0.61 0.62 0.69 0.66 0.70 0.76 Price Range 49.75-24.25 49.75-24.25 46.28-31.55 43.10-30.93 32.80-29.25 32.45-26.85 29.35-23.28 26.51-21.38 P/E Ratio 16.42-8.00 17.33-8.45 17.08-11.64 16.84-12.08 15.47-13.80 14.82-12.26 14.90-11.82 14.98-12.08 Average Yield % 3.12 3.14 3.09 3.22 3.28 2.93 2.90 2.85 347

Royal Bank of Canada (Montreal, Quebec)

  • View
    214

  • Download
    2

Embed Size (px)

Citation preview

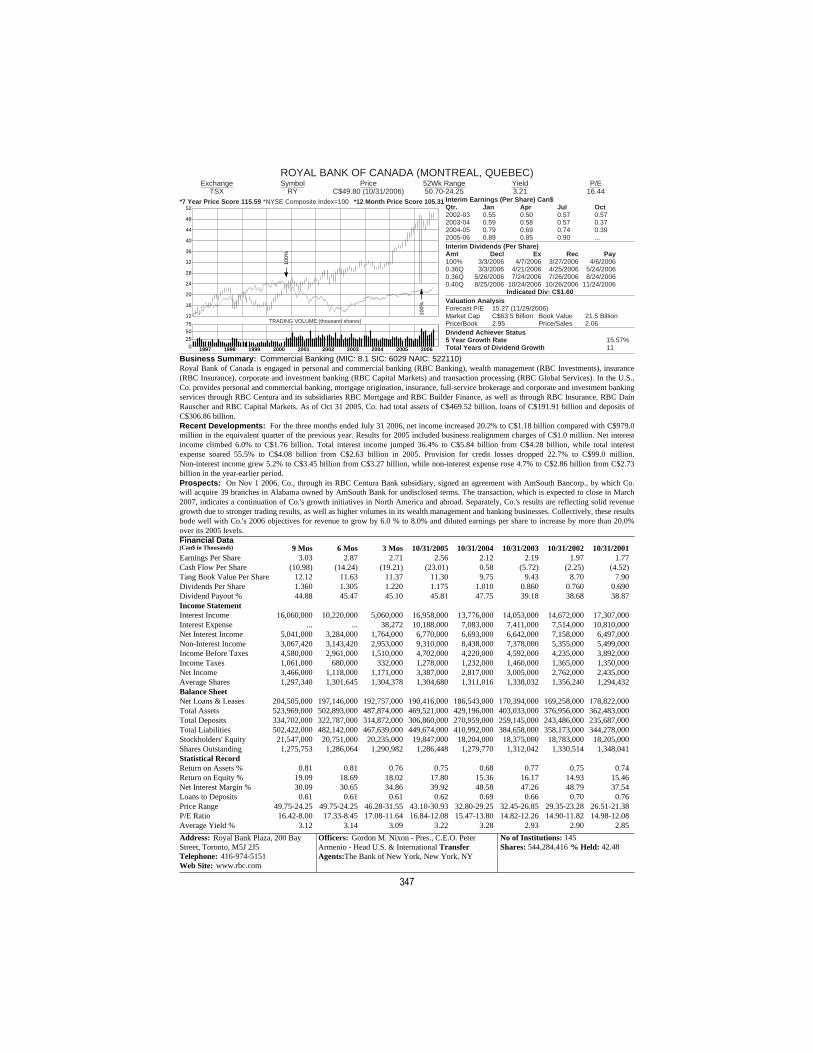
ROYAL BANK OF CANADA (MONTREAL, QUEBEC)Exchange

TSXSymbol

RYPrice

C$49.80 (10/31/2006)52Wk Range50.70-24.25

Yield3.21

P/E16.44

*7 Year Price Score 115.59 *12 Month Price Score 105.31*NYSE Composite Index=100 Interim Earnings (Per Share) Can$Qtr. Jan Apr Jul Oct2002-03 0.55 0.50 0.57 0.572003-04 0.59 0.58 0.57 0.372004-05 0.79 0.69 0.74 0.392005-06 0.89 0.85 0.90 ...Interim Dividends (Per Share)Amt Decl Ex Rec Pay100% 3/3/2006 4/7/2006 3/27/2006 4/6/20060.36Q 3/3/2006 4/21/2006 4/25/2006 5/24/20060.36Q 5/26/2006 7/24/2006 7/26/2006 8/24/20060.40Q 8/25/2006 10/24/2006 10/26/2006 11/24/2006

Indicated Div: C$1.60Valuation AnalysisForecast P/E 15.27 (11/29/2006)Market Cap C$63.5 Billion Book Value 21.5 BillionPrice/Book 2.95 Price/Sales 2.06Dividend Achiever Status5 Year Growth Rate 15.57%Total Years of Dividend Growth 11

TRADING VOLUME (thousand shares)12

16

20

24

28

32

36

40

44

48

52

100%

100%

1997 1998 1999 2000 2001 2002 2003 2004 2005 20060255075

Business Summary: Commercial Banking (MIC: 8.1 SIC: 6029 NAIC: 522110)Royal Bank of Canada is engaged in personal and commercial banking (RBC Banking), wealth management (RBC Investments), insurance(RBC Insurance), corporate and investment banking (RBC Capital Markets) and transaction processing (RBC Global Services). In the U.S.,Co. provides personal and commercial banking, mortgage origination, insurance, full-service brokerage and corporate and investment bankingservices through RBC Centura and its subsidiaries RBC Mortgage and RBC Builder Finance, as well as through RBC Insurance, RBC DainRauscher and RBC Capital Markets. As of Oct 31 2005, Co. had total assets of C$469.52 billion, loans of C$191.91 billion and deposits ofC$306.86 billion. Recent Developments: For the three months ended July 31 2006, net income increased 20.2% to C$1.18 billion compared with C$979.0million in the equivalent quarter of the previous year. Results for 2005 included business realignment charges of C$1.0 million. Net interestincome climbed 6.0% to C$1.76 billion. Total interest income jumped 36.4% to C$5.84 billion from C$4.28 billion, while total interestexpense soared 55.5% to C$4.08 billion from C$2.63 billion in 2005. Provision for credit losses dropped 22.7% to C$99.0 million.Non-interest income grew 5.2% to C$3.45 billion from C$3.27 billion, while non-interest expense rose 4.7% to C$2.86 billion from C$2.73billion in the year-earlier period. Prospects: On Nov 1 2006, Co., through its RBC Centura Bank subsidiary, signed an agreement with AmSouth Bancorp., by which Co.will acquire 39 branches in Alabama owned by AmSouth Bank for undisclosed terms. The transaction, which is expected to close in March2007, indicates a continuation of Co.'s growth initiatives in North America and abroad. Separately, Co.'s results are reflecting solid revenuegrowth due to stronger trading results, as well as higher volumes in its wealth management and banking businesses. Collectively, these resultsbode well with Co.'s 2006 objectives for revenue to grow by 6.0 % to 8.0% and diluted earnings per share to increase by more than 20.0%over its 2005 levels. Financial Data

Address: Royal Bank Plaza, 200 BayStreet, Toronto, M5J 2J5 Telephone: 416-974-5151Web Site: www.rbc.com

Officers: Gordon M. Nixon - Pres., C.E.O. PeterArmenio - Head U.S. & International TransferAgents:The Bank of New York, New York, NY

No of Institutions: 145Shares: 544,284,416 % Held: 42.48

(Can$ in Thousands) 9 Mos 6 Mos 3 Mos 10/31/2005 10/31/2004 10/31/2003 10/31/2002 10/31/2001Earnings Per Share 3.03 2.87 2.71 2.56 2.12 2.19 1.97 1.77Cash Flow Per Share (10.98) (14.24) (19.21) (23.01) 0.58 (5.72) (2.25) (4.52)Tang Book Value Per Share 12.12 11.63 11.37 11.30 9.75 9.43 8.70 7.90Dividends Per Share 1.360 1.305 1.220 1.175 1.010 0.860 0.760 0.690Dividend Payout % 44.88 45.47 45.10 45.81 47.75 39.18 38.68 38.87Income StatementInterest Income 16,060,000 10,220,000 5,060,000 16,958,000 13,776,000 14,053,000 14,672,000 17,307,000Interest Expense ... ... 38,272 10,188,000 7,083,000 7,411,000 7,514,000 10,810,000Net Interest Income 5,041,000 3,284,000 1,764,000 6,770,000 6,693,000 6,642,000 7,158,000 6,497,000Non-Interest Income 3,067,420 3,143,420 2,953,000 9,310,000 8,438,000 7,378,000 5,355,000 5,499,000Income Before Taxes 4,580,000 2,961,000 1,510,000 4,702,000 4,220,000 4,592,000 4,235,000 3,892,000Income Taxes 1,061,000 680,000 332,000 1,278,000 1,232,000 1,460,000 1,365,000 1,350,000Net Income 3,466,000 1,118,000 1,171,000 3,387,000 2,817,000 3,005,000 2,762,000 2,435,000Average Shares 1,297,340 1,301,645 1,304,378 1,304,680 1,311,016 1,338,032 1,356,240 1,294,432Balance SheetNet Loans & Leases 204,505,000 197,146,000 192,757,000 190,416,000 186,543,000 170,394,000 169,258,000 178,822,000Total Assets 523,969,000 502,893,000 487,874,000 469,521,000 429,196,000 403,033,000 376,956,000 362,483,000Total Deposits 334,702,000 322,787,000 314,872,000 306,860,000 270,959,000 259,145,000 243,486,000 235,687,000Total Liabilities 502,422,000 482,142,000 467,639,000 449,674,000 410,992,000 384,658,000 358,173,000 344,278,000Stockholders' Equity 21,547,000 20,751,000 20,235,000 19,847,000 18,204,000 18,375,000 18,783,000 18,205,000Shares Outstanding 1,275,753 1,286,064 1,290,982 1,286,448 1,279,770 1,312,042 1,330,514 1,348,041Statistical RecordReturn on Assets % 0.81 0.81 0.76 0.75 0.68 0.77 0.75 0.74Return on Equity % 19.09 18.69 18.02 17.80 15.36 16.17 14.93 15.46Net Interest Margin % 30.09 30.65 34.86 39.92 48.58 47.26 48.79 37.54Loans to Deposits 0.61 0.61 0.61 0.62 0.69 0.66 0.70 0.76Price Range 49.75-24.25 49.75-24.25 46.28-31.55 43.10-30.93 32.80-29.25 32.45-26.85 29.35-23.28 26.51-21.38P/E Ratio 16.42-8.00 17.33-8.45 17.08-11.64 16.84-12.08 15.47-13.80 14.82-12.26 14.90-11.82 14.98-12.08Average Yield % 3.12 3.14 3.09 3.22 3.28 2.93 2.90 2.85

347