Embed Size (px)
DESCRIPTION
Planetary and Synoptic Analysis of Freezing Rain Events in Montreal, Quebec. Gina M. Ressler, Eyad H. Atallah, and John R. Gyakum Department of Atmospheric and Oceanic Sciences, McGill University. The 11 th Northeast Regional Operational Workshop, Nov. 4-5th, 2009. Sponsored by Ouranos. - PowerPoint PPT Presentation
Citation preview
Planetary and Synoptic Analysis of Freezing Rain Events in Montreal, Quebec
Gina M. Ressler, Eyad H. Atallah, and John R. Gyakum
Department of Atmospheric and Oceanic Sciences, McGill University
The 11th Northeast Regional Operational Workshop, Nov. 4-5th, 2009
Sponsored by Ouranos
Motivation
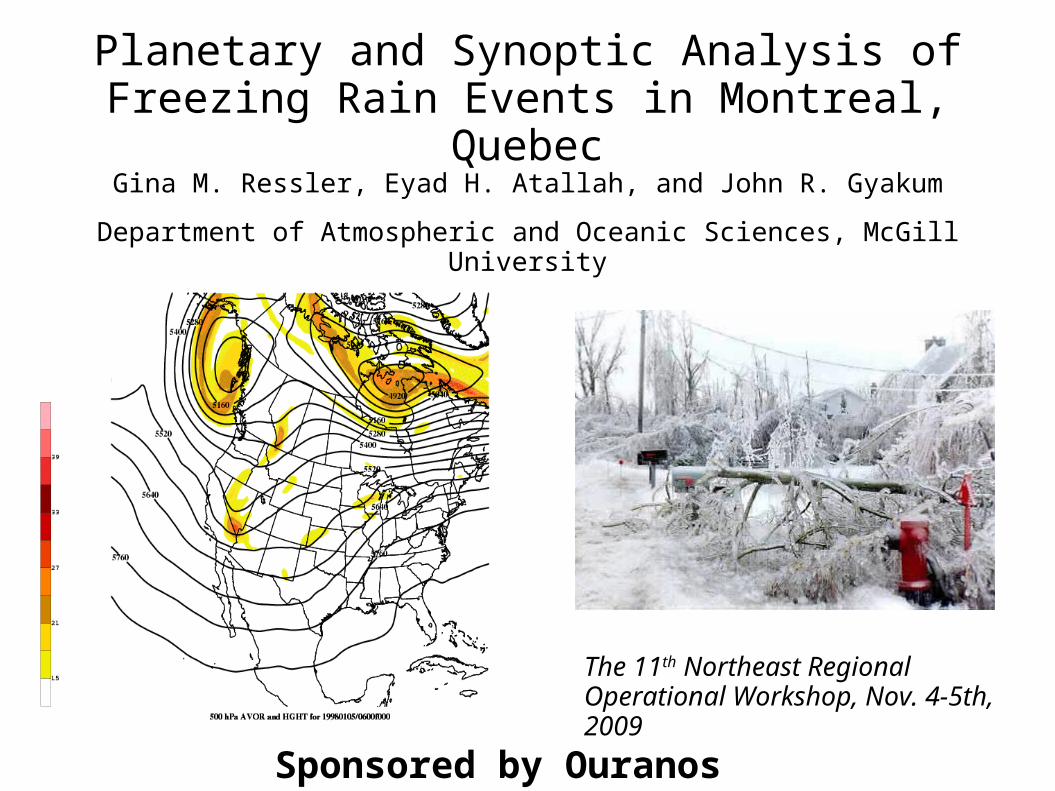
Median annual hours of freezing rain from 1979 to 1990 (Fig. 2, Cortinas et al. 2004)
Freezing rain is a major environmental hazard
Especially common along the St. Lawrence river valley
Severe events can have a devastating effect on people, commerce, and property (1998 Ice Storm)
Motivation
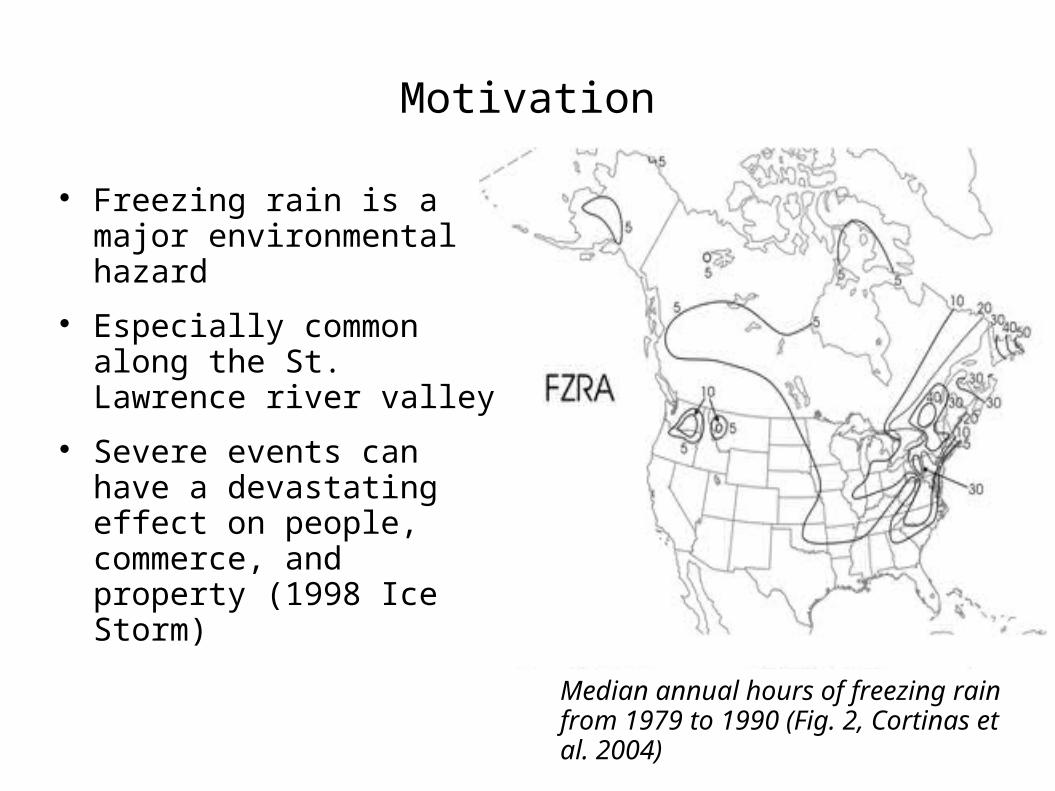
Most research has focused on:
climatology (Stuart and Isaac 1999; Cortinas et al. 2004)
case studies (Higuchi et al. 2000; Gyakum and Roebber 2001)
statistical methods for prediction (Cheng et al. 2004)
Fewer synoptic analyses (Cortinas 2000; Rauber et al. 2001)
Surface analysis illustrating Rauber's Pattern C: Cyclone-Anticyclone (Fig 5c, Rauber et al. 2001)
Objectives
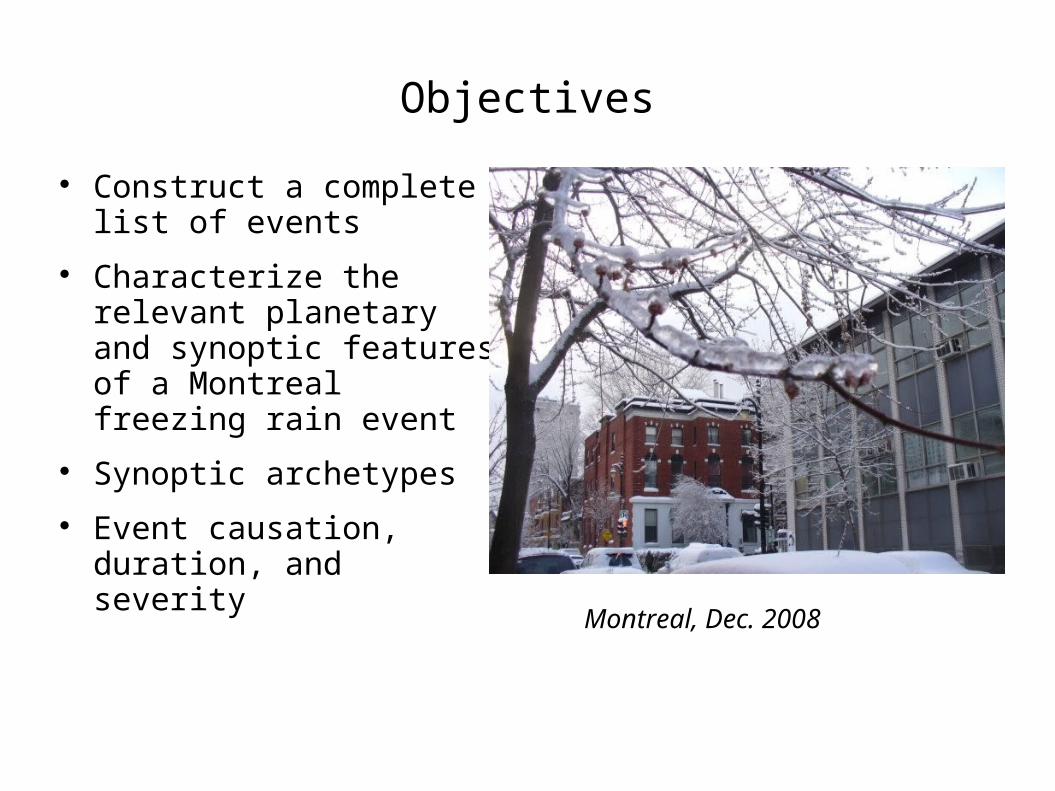
Construct a complete list of events
Characterize the relevant planetary and synoptic features of a Montreal freezing rain event
Synoptic archetypes
Event causation, duration, and severity
Montreal, Dec. 2008
Data
Environment Canada hourly surface observations at Montreal, Quebec (YUL) for the period 1979-2008
National Centers for Environmental Prediction (NCEP) North American Regional Reanalysis (NARR)
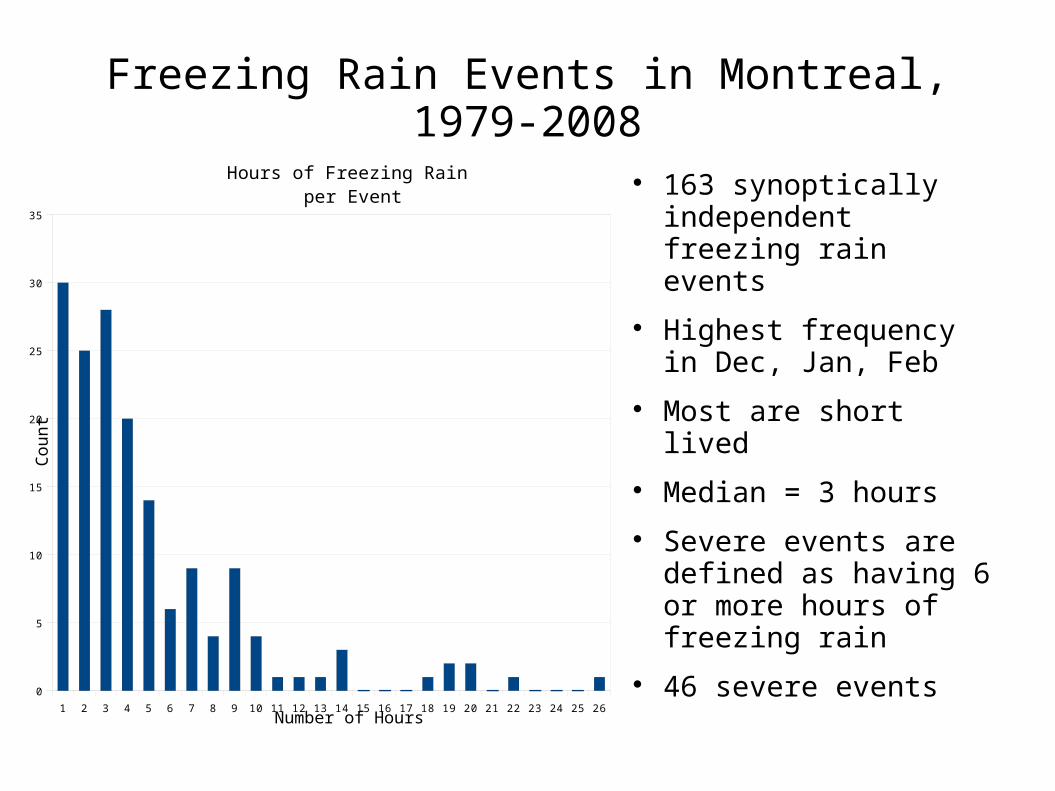
Freezing Rain Events in Montreal, 1979-2008
163 synoptically independent freezing rain events
Highest frequency in Dec, Jan, Feb
Most are short lived
Median = 3 hours
Severe events are defined as having 6 or more hours of freezing rain
46 severe events1 2 3 4 5 6 7 8 9 10 11 12 13 14 15 16 17 18 19 20 21 22 23 24 25 26
0
5
10
15
20
25
30
35
Hours of Freezing Rain per Event
Number of Hours
Cou
nt
1980 1985 1990 1995 2000 2005 2010
0
10
20
30
40
50
60
70
80
0
2
4
6
8
10
12
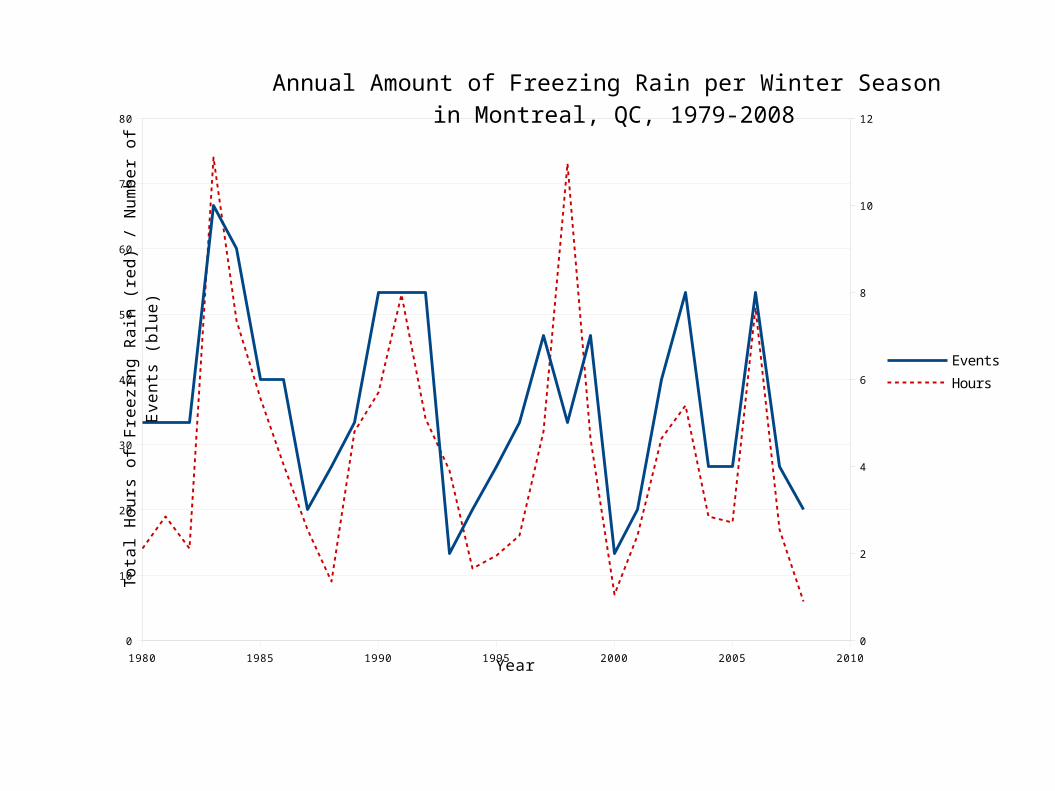
Annual Amount of Freezing Rain per Winter Season in Montreal, QC, 1979-2008
EventsHours
Year
To
tal H
ou
rs o
f Fre
ezi
ng
Ra
in (
red
) / N
um
be
r o
f Eve
nts
(b
lue
)
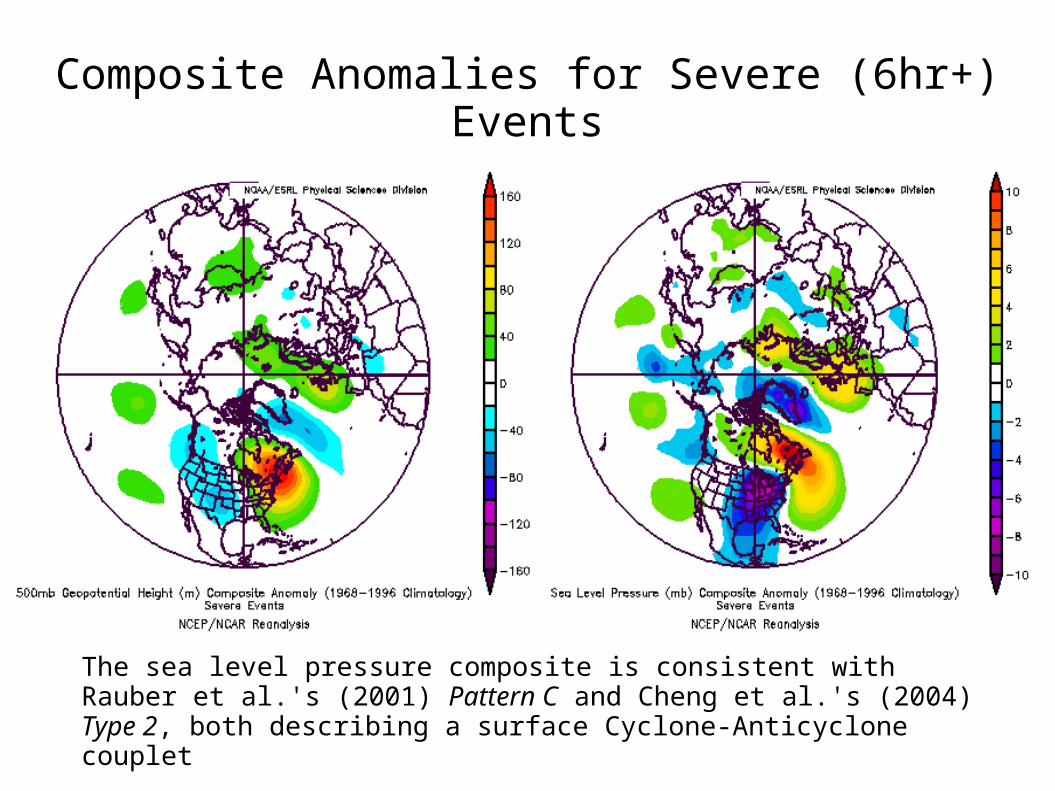
Composite Anomalies for Severe (6hr+) Events
The sea level pressure composite is consistent with Rauber et al.'s (2001) Pattern C and Cheng et al.'s (2004) Type 2, both describing a surface Cyclone-Anticyclone couplet
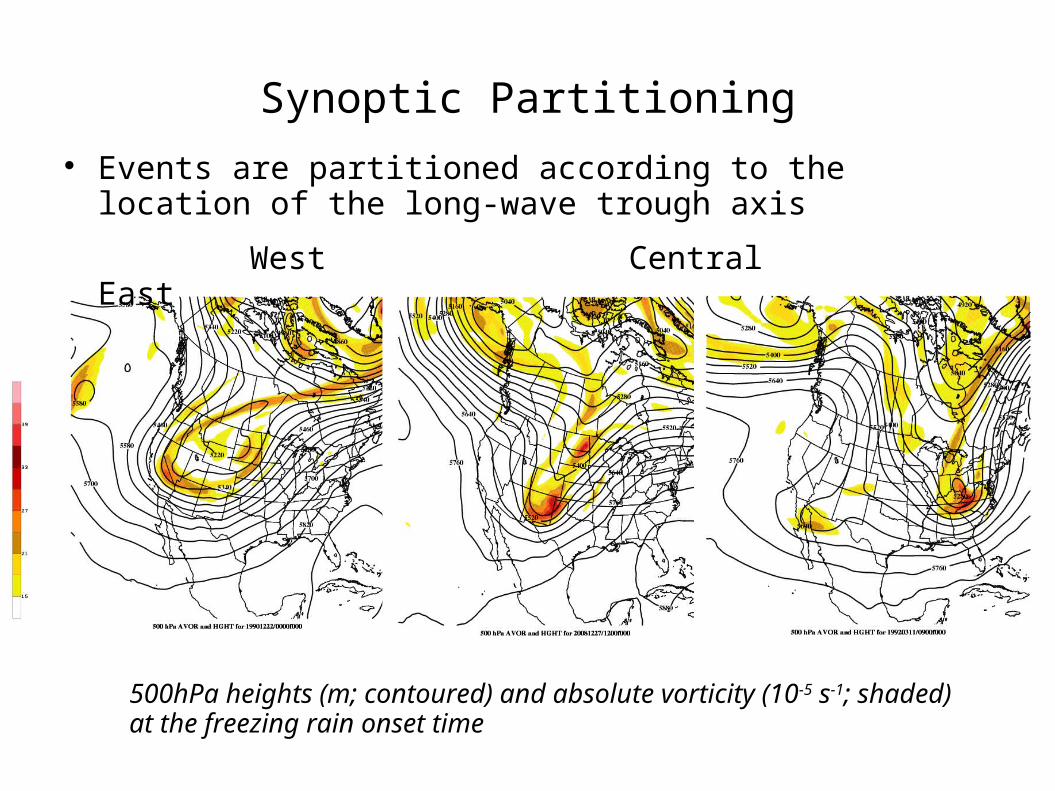
Synoptic Partitioning
500hPa heights (m; contoured) and absolute vorticity (10-5 s-1; shaded) at the freezing rain onset time
Events are partitioned according to the location of the long-wave trough axis
West Central East
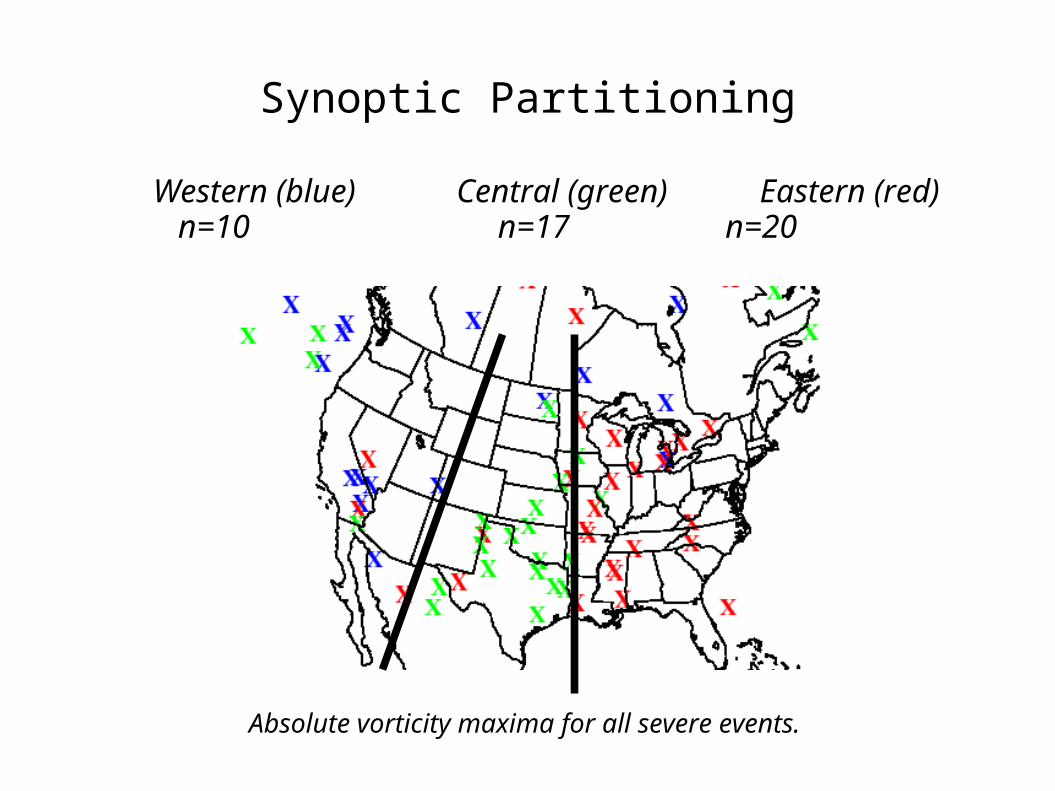
Absolute vorticity maxima for all severe events.
Western (blue) Central (green) Eastern (red) n=10 n=17 n=20
Synoptic Partitioning
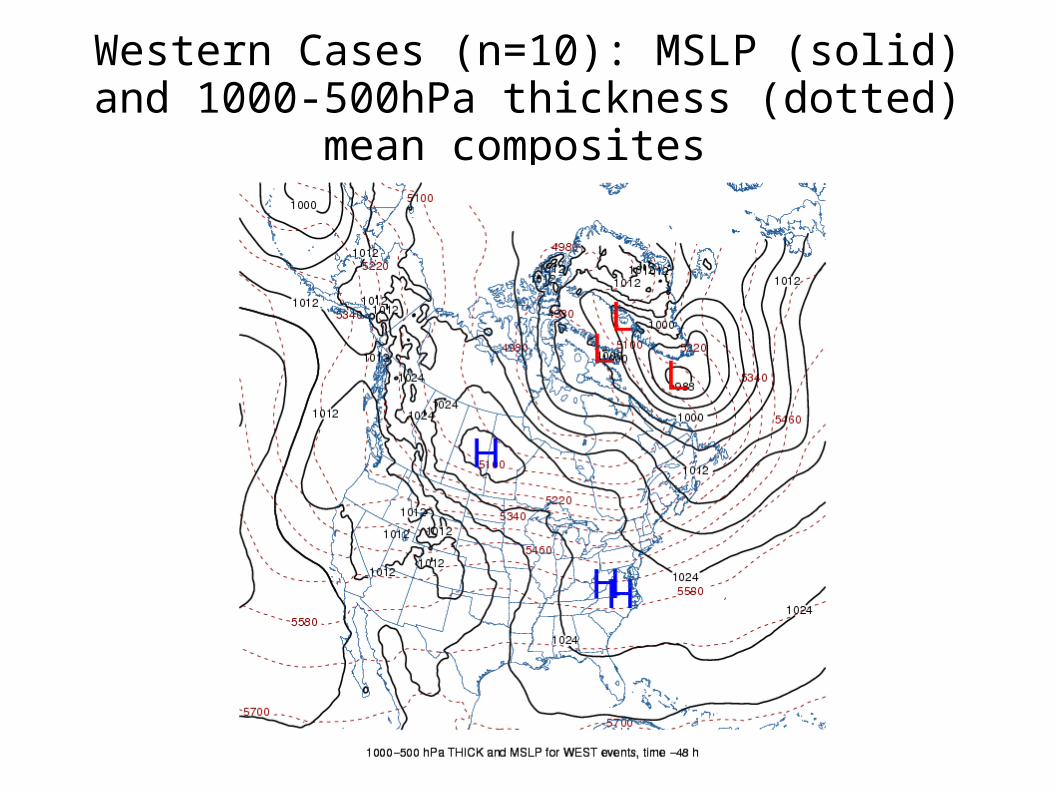
Western Cases (n=10): MSLP (solid) and 1000-500hPa thickness (dotted) mean composites
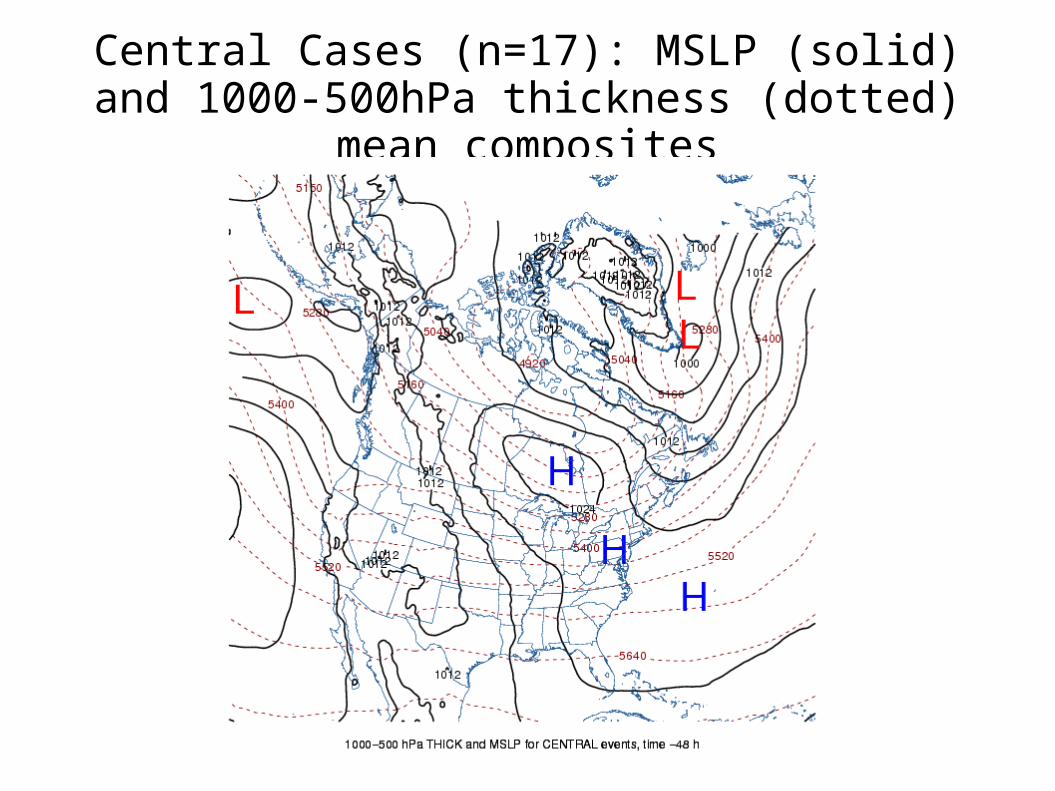
Central Cases (n=17): MSLP (solid) and 1000-500hPa thickness (dotted) mean composites
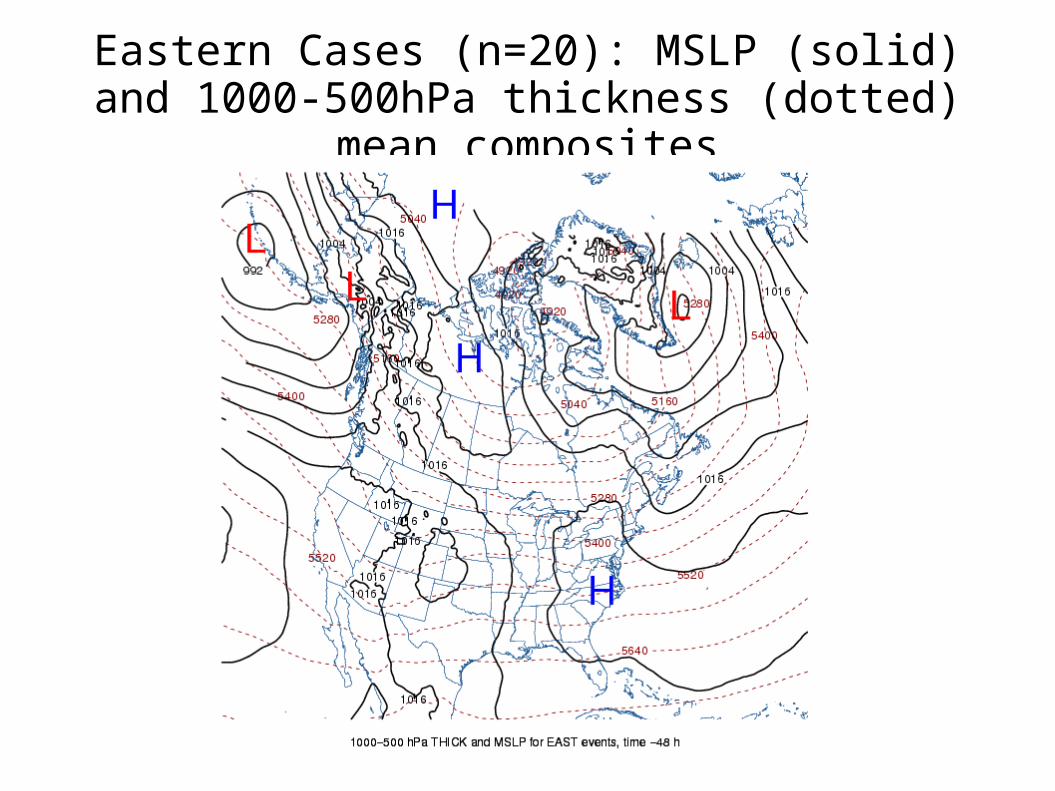
Eastern Cases (n=20): MSLP (solid) and 1000-500hPa thickness (dotted) mean composites
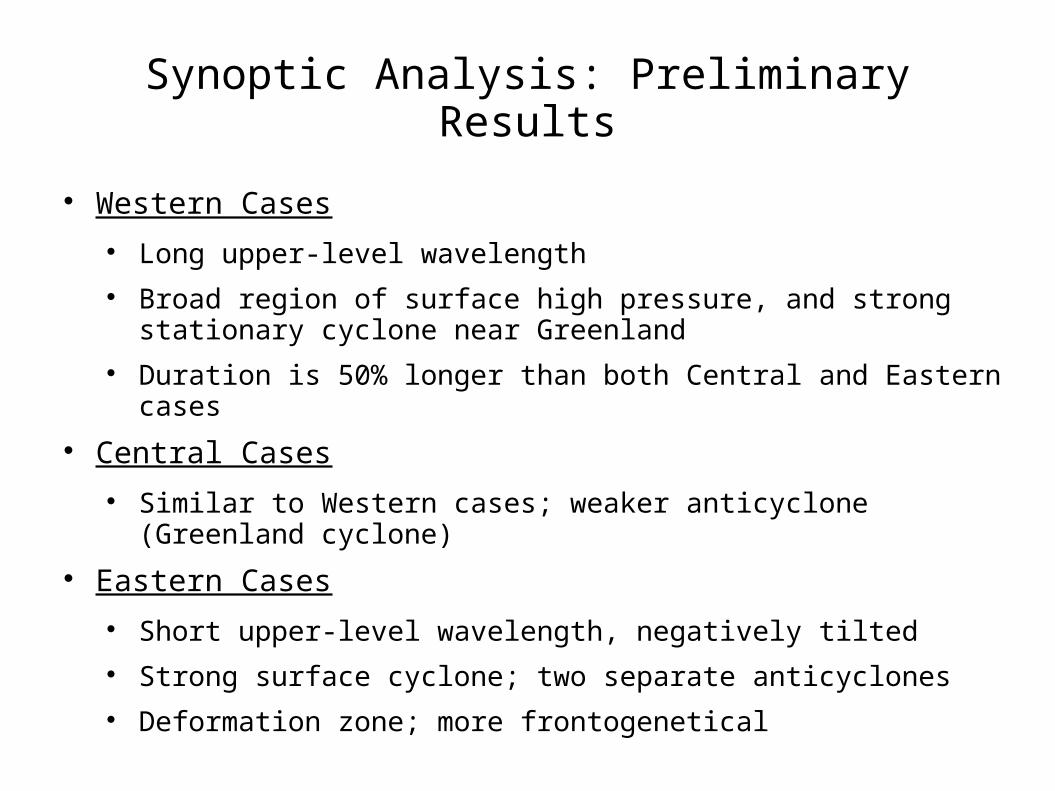
Synoptic Analysis: Preliminary Results
Western Cases Long upper-level wavelength Broad region of surface high pressure, and strong stationary
cyclone near Greenland Duration is 50% longer than both Central and Eastern cases
Central Cases Similar to Western cases; weaker anticyclone (Greenland
cyclone)
Eastern Cases Short upper-level wavelength, negatively tilted Strong surface cyclone; two separate anticyclones Deformation zone; more frontogenetical
Continued Research
Anomaly plots for each synoptic group; statistical significance
For each group, investigate:
Temperature and precipitation evolution Frontogenesis Moisture sources and air mass origins Spatial extent (ie. along the St. Lawrence river valley)
Case studies for each synoptic group