Embed Size (px)
Citation preview

8/3/2019 Rough Draft Wit Pg No
http://slidepdf.com/reader/full/rough-draft-wit-pg-no 1/59
1
1.1INTRODUCTION
Businesses are not separate entities, but collections of people. All collections of people
produce certain common and important patterns of behaviour. So the topic of organization
culture is really about people and the way they behave when in groups together.
The presence of a strong and appropriate organizational culture has become essential for
an organization to function effectively and efficiently in the modern era. Organizational culture
is the consciously or subconsciously accepted and followed way of life or manner of performing
day-to-day activities in an organization. It plays an important role in determining and controlling
employee behavior at workplace. The core values, assumptions, norms, procedures, etc. that are
followed in an organization constitute its culture. These are more often than not, accepted and
followed throughout the organization, without much deviation. However, the presence of
individuals from various social cultures and backgrounds in an organization, may lend a slight
variation to the beliefs and ideologies of the organizational members. This difference results in
the formation of subcultures within organizations
Organizational culture deals with the internalization of the core values and norms. If the
organizational culture is well internalized, it can replace the formalization of rules and
procedures in an organization. The difference between the two lies in the fact that, while
formalization deals with the standardization of jobs and involves documentation of accepted
values and norms, a strong organizational culture can achieve a certain amount of uniformity in
work processes without documentation being required.
Organizational culture plays a variety of roles in strengthening bonds between the
members of an organization. The boundary-defining role of organizational culture implies that it
helps to draw distinctions between one organization and another. It also creates a sense of
identity and belongingness among the employees of the organization. Organization culture
synergizes the efforts of organizational members towards the achievement of the common
objectives of the organization. It also maintains the stability of the social system in the
organization by minimizing individual differences between employees.
NATURE OF ORGANISATIONAL CULTURE:

8/3/2019 Rough Draft Wit Pg No
http://slidepdf.com/reader/full/rough-draft-wit-pg-no 2/59
2
The culture of an organization may reflect in various forms adopted by the organization.
These could be:
• The physical infrastructure
• Routine behaviour, language, ceremonies
• Gender equality, equity in payment
• Dominant values such as quality, efficiency and so on
• Philosophy that guides the organization’s policies towards it employees and customers
like ‘customer first’ and ‘customer is king’, and the manner in which employees deal
with customers.
Individually none of these connote organizational culture, however, together, they reflect
organizational culture. Although organizational culture has common properties, it is found that
large organizations have a dominant culture and a number of sub – cultures. The core values
shared by the majority of the organizational members constitute the dominant culture. Therefore,
whenever one refers to the culture of an organization one actually talks about the dominant
culture of an organization one actually talks about the dominant culture. Subcultures within an
organization are a set of shared understandings among members of one
group/department/geographic operations. For example, the finance department of an organization
may have a sub – culture which is unique to this department vis–a–vis other departments. This
means that this department will not only have the core values of the organization’s dominant
culture but also some unique values. If an organization does not have a dominant culture and is
comprised only of various sub – cultures, its effectiveness would be difficult to judge and there
will be no consistency of behaviour among departments. Hence, the aspect of common or shared
understanding is an essential component of organizational culture. Also, organizational culture
exists at various levels.
1.2 INDUSTRY PROFILE

8/3/2019 Rough Draft Wit Pg No
http://slidepdf.com/reader/full/rough-draft-wit-pg-no 3/59
3
AUTOMOBILE INDUSTRY HISTORY:
In the year 1769, a French engineer by the name of Nicolas J. Cugnot invented the first
automobile to run on roads. This automobile, in fact, was a self-powered, three wheeler, military
tractor that made use of steam engine. The range of the automobile, however, was very brief and
at the most, it could only run at a stretch for fifteen minutes. In addition, these automobiles were
not fit for the roads as the steam engines made them very heavy and large, and required ample
starting time. Oliver Evans was the first to design a steam engine driven automobile in the U.S.
The automobile industry finally came of age with Henry Ford in 1914 for the bulk production in
cars. This lead to the development of the industry and it first begun in the assembly lines of his
car factory. The several methods adopted by Ford, made the new invention ie) car, popular
amongst the rich as well as masses.
According to the history of automobile industry U.S, dominated the automobile markets around
the globe with no notable competitors. However, after the end of Second World War in 1945, the
automobile industry of other technologically advanced nations such as Japan and certain
European nations gained momentum and within a very short period, beginning in the early
1980s, the U.S automobile industry was flooded with foreign automobile companies, especially
those of Japan and Germany.
The current trends of the Global automobile industry reveal that in the developed countries the
automobile industry are stagnating as a result of the drooping car markets, whereas the
automobile industry in the developing nations, such as India and Brazil, have been consistently
registering higher growth rates every passing year for their flourishing automobile markets.
INDIAN AUTOMOBILE INDUSTRY:
India is one of the fastest growing automobile industries in the world. After 1960, the
automobile industry saw rapid growth and many automotive manufacturers started production.
The automobile industry in India is the seventh largest in the world with and annual production
of over 2.6 million units in 2009. In 2009, India emerged as Asia’s fourth largest exporter of
automobiles, behind Japan, South Korea and Thailand. By 2050, the country is expected to top
the world in car volumes with approximately 611 million vehicles on the nation’s roads.

8/3/2019 Rough Draft Wit Pg No
http://slidepdf.com/reader/full/rough-draft-wit-pg-no 4/59
4
A well developed transport network indicates a well developed economy. For rapid development
a well-developed and well-knit transportation system is essential. As India’s transport network is
developing at a fast pace, Indian automobile industry is growing too. Also, the automobile
industry has strong backward and forward linkages and hence provides employment to a large
section of the population. Thus the role of automobile industry cannot be overlooked in the
Indian economy. Indian automobile industry includes manufacture of trucks, buses, passenger
cars, defence vehicles ,two wheelers etc.., The industry can be broadly divided into the car
manufacturing, two-wheeler manufacturing and heavy vehicle manufacturing units.
The major car manufacturers are Hindustan Motors, Maruti Udyog, Fiat India Pvt. Ltd, Ford
India Ltd., General Motors Pvt. Ltd., Honda Siel Cars India Ltd., Hyundai Motors India Ltd.,
Skoda India Pvt. Ltd., Toyota Kirloskar Motor Ltd., to name a few.
The two wheeler manufacturing is dominated by companies like TVS, Honda Motorcycle &
Scooter India Pvt. Ltd., Hero Honda, Yamaha, Bajaj etc..,
The heavy motors like buses, trucks, defence vehicles, auto rickshaws and other multiutility
vehicles are manufactured by Tata-Telco, Ashok Leyland, Eicher Motors, Bajaj, Mahindra and
Mahindra etc..,
HEAVY VEHICLES MARKET:
Heavy vehicles market in India comprises of trucks, machines, ambulances and school buses.
The popular heavy vehicle brands in India are Volvo, Eicher, Tata, Telco, Ashok Leyland and
Swaraj Mazda.
Following are the major players in the Indian Heavy Vehicles Market:
• Tata Motors is the largest automobile manufacturing company in India that manufactures a
wide range of heavy vehicles adhering to world class standards. It is the market leader in
commercial vehicles in all the segments, be it heavy vehicles, medium size vehicles, small
vehicles, buses or defence vehicles. The heavy vehicles manufactured by Tata Motors have
highly developed braking structure, high ground authorization, better direction competence and a
muscular body. The advanced engine imparted to these heavy vehicles makes them a class apart
from the other heavy vehicles running on the Indian roads and Highways. Tata Motors leads this
segment with a market share of 61%.

8/3/2019 Rough Draft Wit Pg No
http://slidepdf.com/reader/full/rough-draft-wit-pg-no 5/59
5
. Ashok Leyland is an exclusively heavy vehicle manufacturing company situated in Chennai
and was initiated in the year 1948. It is one of India’s biggest producers of heavy vehicles such
as trucks, buses, military vehicles and also the second biggest commercial vehicle firm in India
heavy vehicle division with a market share of around 27%. Ashok Leyland is also renowned for
producing auto spare parts and engines for marine and industrial submission.
• Eicher Motors was initiated in 3rd September, 1960. The first firm to manufacture
the first tractor in India. The indigenously manufactured tractor was introduced in the Indian
market straight from Eicher’s Faridabad factory. The history of the firm can be traced back to
1948, when Goodearth Company was established for vending and repairs of imported tractors in
the nation.
• Swaraj Mazda, a tie up between Mazda and Swaraj Enterprise, Swaraj Mazda
represents advanced Indian expertise and manufacturing. The firm has Research and
Development improvement edge on international scale. The firm manufactures various products
such as Bus, Ambulance, Trucks etc.
The modern automobile market in India has been considering key issues in the process of
growth:
• Customer care, and not just service
• Domestic as well as multi-national investments
• Searing through cut-throat competition
• Road safety
• Anti-pollution norms
• Co-ordination with government to enable advancement
• Used vehicle trade
1.3 COMPANY PROFILE
Ashok Leyland is the leading manufacturer of trucks, buses, special application vehicles
and engines in India. The products of Ashok Leyland are at par with the best in the world. Ashok
Leyland is the leaders in the Indian bus market, offering unique models such as CNG, Double
8/3/2019 Rough Draft Wit Pg No
http://slidepdf.com/reader/full/rough-draft-wit-pg-no 6/59
6
Decker and Vestibule bus. More than 80% of the State Transport Undertaking (STU) buses come
from Ashok Leyland. The company is a pioneer in multi axle trucks and tractor-trailers. Ashok
Leyland is the largest provider of logistic vehicles to the Indian army. It also manufactures diesel
engines for Industrial, Genset and Marine applications, in collaboration with technology leaders.
HISTORY:
In 1948, Ashok Motors was set up in what was then Madras, for the assembly of Austin Cars.
The Company's destiny and name changed soon with equity participation by British Leyland and
Ashok Leyland commenced manufacture of commercial vehicles in 1955.
Since then Ashok Leyland has been a major presence in India's commercial vehicle industry with
a tradition of technological leadership, achieved through tie-ups with international technology
leaders and through vigorous in-house R&D.Access to international technology enabled the
Company to set a tradition to be first with technology. Be it full air brakes, power steering or rear
engine busses, Ashok Leyland pioneered all these concepts. Responding to the operating
conditions and practices in the country, the Company made its vehicles strong, over-engineering
them with extra metallic muscles. "Designing durable products that make economic sense to the
consumer, using appropriate technology", became the design philosophy of the Company, which
in turn has moulded consumer attitudes and the brand personality.
The Hinduja Group is a transnational conglomerate that provides a wide range of products in
over fifty countries worldwide. Today, the Hinduja Group has become one of the largest
transnational business conglomerates in the world. The Group employs over 25,000 people and
has offices in many key cities of the world and all the major cities in India.
Ashok Leyland vehicles have built a reputation for reliability and ruggedness. The 5,00,000
vehicles we have put on the roads have considerably eased the additional pressure placed on road
transportation in independent India.
In the populous Indian metros, four out of the five State Transport Undertaking (STU) busescome from Ashok Leyland. Some of them like the double-decker and vestibule buses are unique
models from Ashok Leyland, tailor-made for high-density routes..
For over five decades, Ashok Leyland has been the technology leader in India's commercial
vehicle industry, moulding the country's commercial vehicle profile by introducing technologies
and product ideas that have gone on to become industry norms. From 18 seater to 82 seater

8/3/2019 Rough Draft Wit Pg No
http://slidepdf.com/reader/full/rough-draft-wit-pg-no 7/59
7
double-decker buses, from 7.5 tonne to 49 tonne in haulage vehicles, from numerous special
application vehicles to diesel engines for industrial, marine and genset applications, Ashok
Leyland offers a wide range of products. Eight out of ten metro state transport buses in India are
from Ashok Leyland. With over 60 million passengers a day, Ashok Leyland buses carry more
people than the entire Indian rail network.
VISION
Achieving leadership in the medium/heavy duty segments of the domestic commercial
vehicle market and a significant presence in the world market through transport solutions that
best anticipate customer needs, with the highest value -to-cost ratio.
MISSION
-Identifying with the customer.
-Being the lowest cost manufacturer.
-Global benchmarking our products, processes and people, against the best in the
industry.
QUALITY POLICY
Ashok Leyland is committed to achieve customer satisfaction by anticipating and
delivering superior value to the customer in relation to their own business, through the products
and services offered by the company and comply with statutory requirements.
Towards this, the quality policy of Ashok Leyland is to make continual improvements in the
processes that constitute the quality management system, to make them more robust and to
enhance their effectiveness and efficiency in achieving stated objectives leading to
1. Superior products manufactured as also services offered by the company.
2. Maximum use of employees potential to contribute to quality and environment by progressive
up gradation of their knowledge and skills as appropriate to their functions.
3. Seamless involvement from suppliers and dealers in the mission of the company
to address customers changing needs and protection of the environment.
Manufacturing plant
Ashok Leyland has seven manufacturing plants -
• Ennore Plant, Chennai.
• Hosur Plants Unit I, Unit II and Unit II A.
• Alwar, Rajasthan.

8/3/2019 Rough Draft Wit Pg No
http://slidepdf.com/reader/full/rough-draft-wit-pg-no 8/59
8
• Bhandara, Maharashtra.
• Pantnagar, Uttarakhand
. The total covered space at these seven plants exceeds 650,000 sq m and together employs over
11,500 personnel
The Five AL Values are:
1.International
2.Speedy
3.ValueCreator
4.Innovative5. Ethical
Major Achievements of Hinduja Group
• In 1993, became first Indian Auto Company to receive ISO 9002 certification.
• Received ISO 9001 certification in 1994, QS 9000 in 1998, and ISO 14001 certification
for all vehicle manufacturing units in 2002.
• Became the first Indian auto company to receive the latest ISO/TS 16949 Corporate
Certification (in July 2006).
• First company to introduce full air brakes, power steering and rear engine busses in
India.
ASSOCIATE COMPANIES:
• Automotive Coaches & Components Ltd (ACCL)
• Lanka Ashok Leyland
• Hinduja Foundries
• IRIZAR – TVS
• Ashok Leyland Project Services Ltd
• Gulf Ashley Motors Ltd
• Ennore Foundries Ltd
The chief competitors of the company are;

8/3/2019 Rough Draft Wit Pg No
http://slidepdf.com/reader/full/rough-draft-wit-pg-no 9/59
9
• Mahindra
• Volvo
• Tata Motors
PRODUCT OFFERED BY COMPANY:
Ashok Leyland offers a comprehensive product range with trucks from 7.5 tons GVW to
49 tons GVW (Gross Vehicle Weight). From 19 to 80 seaters in passenger transport, a host of
special application vehicles and diesel engines for industrial gensets and marine application.
Product profile can be broadly split into five categories viz. Buses, Trucks, defence vehicles,
special Vehicles and Engines.
BUSES
LYNX BS-II Viking BS-II 12 M Bus-BS II Cheetah (Front engine)
Viking BS-III Viking AL Airport Tarmac Coach Vestibule Bus
Panther (Rear engine) Cruiser Viking CNG BS-III Double Decker
Falcon (Front engine) Stag BS-II
TRUCKS
4x2 Haulage models Ecomet 4x2 and Multi-axle Tipper
Tractor Multi Axle vehicles
DEFENCE VEHICLES
Short Chassis Bus Field artillery tractor Comet 4x4 Topchi field Artillery tractor
Stallion 6x6 Stallion truck fire fighting
SPECIAL VEHICLES
Hippo tractor
Stallion Mk III Tipper
Hippo Tipper
Beaver tractor
Rapid Intervention Vehicle
Beaver Haulage

8/3/2019 Rough Draft Wit Pg No
http://slidepdf.com/reader/full/rough-draft-wit-pg-no 10/59
10
Hippo Haulage
ENGINES
Genset application
Marine application
Industrial application
DG sets for exports
1.4. LITERATURE REVIEW
ORGANISATION
An organization as a purposeful system with several subsystems where
individuals and activities are organized to achieve certain predetermined goals through division
of labour and coordination of activities.
ORGANISATION CULTURE
MEANING
Organizational culture can be defined as a pervasive underlying set of beliefs,
assumptions, values, shared feelings and perceptions, which influence the actions and decisionstaken by the organizations.
DEFINITION

8/3/2019 Rough Draft Wit Pg No
http://slidepdf.com/reader/full/rough-draft-wit-pg-no 11/59
11
Turnstall defined organizational culture as “A general constellation of beliefs,
morals, value systems, behavioural norms, and ways of doing business that are unique to each
corporation”.
Joanne Martin defined organizational culture as “As individuals come into contactwith organizations, they come into contact with dress norms, stories people tell about what goes
on, the organization’s formal rules and procedures, its formal codes of behavior, rituals, t asks,
pay system, jargon, and jokes only understood by insiders, and so on. These elements are some
of the manifestations of organizational culture”.
TYPES OF CULTURES
The more prominent types of cultures are,
Dominant culture and subculture:
A dominant culture is marked by a set of core values that are shared by a
majority of the organizational members. In fact, when we talk about organization’s culture, we
refer to its dominant culture. The dominant culture gives a macro view of organization’s
personality. This creates a dominant culture in the organization that helps guide the day to day
behaviour of employees.
A subculture expresses a set of values that are shared by the members of a
division or department. Subculture typically is result of problems or experiences that are shared
by members of a particular department or unit. These subcultures can form vertically or
horizontally. When one product division of a conglomerate has a culture unique from that of
other divisions of the organization, a vertical subculture exists. When a specific set of functional
specialists, such as accountants, have a set of common shared understandings, a horizontal
subculture is formed.
Strong culture and weak culture :
Based on intensity of sharedness, organizational cultures are of two types: strong
weak. A strong culture is characterized by the organization’s core values being intensely held
and widely shared. So to say, more intensely the core values are shared, the stronger the culture

8/3/2019 Rough Draft Wit Pg No
http://slidepdf.com/reader/full/rough-draft-wit-pg-no 12/59
12
is. The degree of sharedness depends on two factors: orientation and rewards. In order for people
to share the same cultural values, orientation programmes are organized to tell the new comers
about the organization’s philosophy and method of operation. Orientation may be done through
both words of mouth and day to day work habits. Rewards do also affect sharedness. This in turn
results in lower employee turnover. When core values are not shared with high degree of
intensity, it forms weak culture. It is usually characterized by high turnover of employees.
FUNCTIONS OF CULTURE
We mentioned about organizational culture’s impact on employee behavior.
Culture performs several functions in an organization. The major functions performed by culture
are:
1. Culture provides shared patterns of cognitive perceptions or understanding about
the values or beliefs held by the organization. This enables the organizational
members how to think and behave as expected of them.
2. It also provides shared patterns of feelings to the organizational members to make
them know what they are expected to value and feel.
3. It provides a boundry that creates distinctions between one organization and other.
Such boundry defining helps identify members and non-members of the
organizations.
4. It enhances social stability by holding the organizational members together by
providing them appropriate standards for which the members should stand for.
5. It serves as a control mechanism that guides and shapes the attitudes and behavior
of organizational members. It helps organizational members stick to the
conformity to the prescribed and expected mode of behavior.
Culture is valuable for the organization because it enhances organizational
commitment of the employees. It guides employees how things are done and what
important for them. These clearly are benefits to employees.
CREATING, SUSTAINING AND CHANGING A CULTURE
CREATING A CULTURE:

8/3/2019 Rough Draft Wit Pg No
http://slidepdf.com/reader/full/rough-draft-wit-pg-no 13/59
13
Beliefs and values have their base on the past happenings. It implies that the
ultimate source of an organization’s culture is its founders. The founders start their organization
with a vision of what their organization should do. Then, the vision is imposed on all
organizational members. The members imbibe the vision through interaction and their own
experience. Thomas Watson of IBM is a good example. Watson’s views on research and
development, product development, product innovation, employee dress attire, and compensation
policies still influences practices at IBM, though he died long back in 1956.
SUSTAINING A CULTURE:
Culture once established may far away also hence, once a culture is created, it
needs to be sustained through reinforcement practices of human resources. Three such
practices particularly important in sustaining a culture are selection practices, the actions of
management, and socialization methods.
(i) Selection
The first step involved in sustaining culture is the careful selection of entry
level candidates. The basic purpose of selection process is to appoint right people for right jobs.
For this, the trained recruiters interview candidates and attempt to screen out candidates those
whose personal styles and values do not make a fit with the organization’s culture. Thus, by
identifying the suitable candidates who can culturally match the organizational culture, selection
helps sustain culture considerably
(ii) Top management
Subordinates emulate their superiors. Hence, the actions of top management such as what
the managers say and how they behave have a major impact on the employees working at lower
levels. As a matter of fact, this filters down in the entire organization and becomes a common
feature or culture of organization. Managerial actions like degree of freedom granted to the
subordinates, prescriptions for the employee uniform, pay off in terms of pay raises, promotions,
and other rewards also help create a common history i.e., culture in the organization.
(iii) Socialization

8/3/2019 Rough Draft Wit Pg No
http://slidepdf.com/reader/full/rough-draft-wit-pg-no 14/59
14
In simple words, socialization is the process of adaption. New organizational members
coming from different moods and mores are likely to disturb the common customs and beliefs
already established in the organization. Therefore, the new employees need to be indoctrinated to
adapt the organizational culture. This adaptation process is called socialization.
Socialization process involves three phases:
• Pre-arrival
• Encounter
• Metamorphosis
• Pre-arrival :
It refers to all the learning that occurs before a new member joins the
Organization.
• Encounter :
It is the stage of induction which the new recruit joins the firm and put on the job.
Pre-
arrival
Encount
er
Metamor
phosis
Productivity
commitment
Turnover

8/3/2019 Rough Draft Wit Pg No
http://slidepdf.com/reader/full/rough-draft-wit-pg-no 15/59
15
The role playing start here. The recruit starts comparing expectations, the image, which he had
formed during pre-arrival stage with reality. If expectation and reality concur, the encounter is
smooth.. When the two differ, stress and frustration set in. what follows thereafter is a mental
process of adjustment. In this adjustment, the individual tries to replace his/her own values and
norms with those of the organization at least in vital areas, if not in all. In other extreme, the
recruit simply cannot reconcile to those values and norms of the organization and get illusioned
and quit the job.
• Metamorphosis :
It is the completion stage of changes and consolidation of changed behavior. In
this stage, the employees master the skills required for their new roles, and make the adjustment
to the organization’s norms and values. This is, of course, a voluntary process and a conscious
decision which enables them to become compatible with the group and organization. This signals
the completion of socialization process.
CHANGING A CULTURE
The ever fast changing business environment has made everything in nature. So is
organizational culture also. As organizations do not remain the same over a period of time, so is
the case of culture as well culture
However, a changing culture is as much important is not so simple. Changing a
strong culture is particularly difficult because the cultural values and assumptions have taken
deep roots and employees become so committed to them. Changing a weak culture is easy.
Deal and Kennedy identified five situations which facilitate change in the culture:
Organizational
culture
Philosophy
of
organizatio
’
Selection
criteria
Top
manageme
nt

8/3/2019 Rough Draft Wit Pg No
http://slidepdf.com/reader/full/rough-draft-wit-pg-no 16/59
16
1. When the environment is going rapid changes and the company has always been highly
value-driven.
2. When the industry is highly competitive and the environment changes quickly.
3. When the company is worst.
4. When the company is truly at the threshold of becoming a large corporation.
5. When the company is growing very rapidly.
Creating an ethical organizational culture
The content and strength of a culture influence an organization’s ethical climate and the ethical
behavior of its members. An organizational culture most likely to shape high ethical standards is
one that’s high in risk tolerance, low to moderate in aggressiveness, and focuses on means as
well as outcomes.
• Be a visible role model
Employees will look to the behavior of top management as a benchmark for defining
appropriate behavior. When senior management is seen as taking the ethical high road, it
provides a positive message for all employees.
• Communicate ethical expectations
Ethical ambiguities can be minimized by creating and disseminating an organizational
code of ethics. It should state the organization’s primary values and the ethical rules that
employees are expected to follow.
• Provide ethical training
Set up seminars, workshops, and similar ethical training programs. Use these training
sessions to reinforce the organizations standards of conduct, to clarify what practices are
and not permissible, and to address possible ethical dilemmas.
• Visibly reward ethical acts and punish unethical one
Socializatio
ns

8/3/2019 Rough Draft Wit Pg No
http://slidepdf.com/reader/full/rough-draft-wit-pg-no 17/59
17
Performance appraisal of managers should include a point-by-point evaluation of how his
or her decisions measure up against the organization’s code of ethics. Appraisals must
include the means taken to achieve goals as well as the ends themselves. People who act
ethically should be visibly rewarded for their behavior. Just as importantly, unethical acts
should be conspicuously punished.
• Provide protective mechanisms
The organization needs to provide formal mechanisms so that employees can discuss
ethical dilemmas and report unethical behavior without fear of reprimand. This might
include creation of ethical counselors, ombudsmen, or ethical officers.
HOW EMPLOYEES LEARN CULTURE
Since the term organizational culture refers to the underlying beliefs and values
that are shared by organization members, culture can’t be dictated by the top
management. Instead, organizational culture is transmitted to employees in a number of
forms. The most important ones are stories, rituals, symbols and language.
• Stories :
The stories, be these true or false, told to the organizational members can have a
profound impact on organizational culture. Most stories are narratives based on true events
about the organization’s founders, rule breaking, rags-to-riches successes, reductions in the work
force, relocation of employees, reactions to past mistakes, and organizational coping. Some
stories are considered legends because the events are historic. Stories are useful because they
preserve the primary values of the organization by anchoring the present in the past. The popular
practice of storytelling by the grand-parents to their grand children in our society also aims at
inculcating old values and beliefs in the new generation so as the same can be preserved for all
the times.
• Rituals
Rituals also are means for transmitting culture. Activities such a award
Ceremonies, weekly Friday picnic, and annual general meeting are some examples. These rituals
reinforce the key values of the organization, what goals are important, which people are
important and which are expendable.

8/3/2019 Rough Draft Wit Pg No
http://slidepdf.com/reader/full/rough-draft-wit-pg-no 18/59
18
Many organizational researchers have even considered some of the established
management methods and techniques as cultural rituals. Managers employ techniques such as
PERT/CPM, complex modeling and simulation, dissemination of regular updates on projects,
brainstorming sessions etc.
• Symbols :
A symbol is something that represents something else. Physical symbols in
Organizations are often used to represent and support organizational culture. Examples of
symbols include the size of offices, the elegance of office furnishings, executive perks. The
values of these symbols are that they communicate important cultural values. Symbols become
more powerful facilitator of culture if symbols are consistent with the stories that are narrated to
the organizational members.
• Language :
As language is a means of universal communication, most organizations tend to
develop their own language in the forms of jargon, phrases, acronym, slogans etc. by learning
this language, the members attest to their acceptance of the culture and, in so doing, help
preserve the organizational culture.
Organization uses a specific slogan, metaphor, or saying to convey special
meaning to employees. Metaphors are often quite meaningful and convey an entire sermon in
only a short sentence. Slogans can be readily picked up and repeated by employees as well as
customers of the company.
Organization also develop unique terms to describe their key personnel, products ,
equipments and so on. New employees frequently come to hear such terms and over time, these
become part of their language.

8/3/2019 Rough Draft Wit Pg No
http://slidepdf.com/reader/full/rough-draft-wit-pg-no 19/59
19
2.1 NEED FOR THE STUDY
The main aim of the study is to know the organization culture at Ashok Leyland. A
organizational culture will helps to know about the employee perception towards their
organization. And it helps the organization to analyze its strength and weakness. Jobs are the link
between organization and their human resources. The combined accomplishment of every job
allows the organization to meet its objectives.
This study mainly concentrates on to know the deficient areas to make necessary steps to
further enhance the good culture life of its employees. Further the management wants to know
the employees perception towards organizational culture to know their expectations from the
organization.

8/3/2019 Rough Draft Wit Pg No
http://slidepdf.com/reader/full/rough-draft-wit-pg-no 20/59
20
2.2 OBJECTIVE OF THE STUDY
PRIMARY OBJECTIVES:
➢ To study the organization culture in the Ashok Leyland
➢ To find out the attitudes of the employees in the organization
SECONDARY OBJECTIVES:
➢ To analyze the relationship between co-workers.
➢ To analyze the factors affecting the organizational culture and suggest the
organization to improve the organizational culture

8/3/2019 Rough Draft Wit Pg No
http://slidepdf.com/reader/full/rough-draft-wit-pg-no 21/59
21
2.3 SCOPE OF THE STUDY
The study is conducted only among the employees in Ashok Leyland. The scope
of this study is to know about the effectiveness of work in the organization, their attitudes
towards the work and to know the work culture in the organization.
This study is helps to know the relationship between co-workers. It helps to
control the way to interact with each other and to know about the employees’ behavior in
different group of people.

8/3/2019 Rough Draft Wit Pg No
http://slidepdf.com/reader/full/rough-draft-wit-pg-no 22/59
22
2.4. RESEARCH METHODOLOGY
Research:
Research in common parlance refers to search for knowledge. It is an organized, systematic,
inquiry or investigation in to a specific problem, undertaken with the objective of finding
answers there to. According to Clifford woody, “Research comprises of defining and redefining
problems, formulating hypothesis or suggested solutions collecting, organizing and evaluating
data, making detection and reaching conclusions and at last carefully testing the conclusion to
determine whether they fit the formulating hypothesis”.
Research methods:
Research methods refer to the behavior and instruments used in selecting and constructing
research techniques.
Research technique:
Research technique refer to the behavior and instrument we use in performing research
operations such as making observation, recording data and techniques of processing data and the
like.
Research methodology:
Research methodology is a way to systematically solve the research problem. It also considers
the logic behind the methods used in the context of research study and explains why a particular
8/3/2019 Rough Draft Wit Pg No
http://slidepdf.com/reader/full/rough-draft-wit-pg-no 23/59
23
method or technique is used, so that research results are capable of being evaluated. It may be
understood as a science of studying how research is done scientifically.
Type of research:
The type of research used in this project is descriptive in nature. The descriptive study is
typically concerned with determining frequency with which something occurs or how two
variables vary together. It is concerned with describing the characteristics of particular individual
or group.
Research design:
A research design is the arrangement of conditions for collection and analysis of data in a
manner that aims to combine relevance to the research purpose with economy in procedure. It
constitutes the blueprint for the collection, measurement, and analysis of data. The research
design undertaken for the study is descriptive one.
Questionnaire
The primary instrument used in the study was the ‘‘questionnaire ’’. A questionnaire
is a research instrument consisting of a series of questions and other prompts for the purpose of
gathering information from respondents. Although they are often designed for statistical analysis
of the responses, this is not always the case. The questionnaire was invented by Sir Francis
Galton the form of each question is also important. Closed end question include all the possible
answers and subjects matters choices among them.
Questionnaires have advantages over some other types of surveys in that they are
cheap, do not require as much effort from the questioner as verbal or telephone surveys, and
often have standardized answers that make it simple to compile data. Questionnaires are also
sharply limited by the fact that respondents must be able to read the questions and respond to
them. Thus, for some demographic groups conducting a survey by questionnaire may not be
practical
Data collection:
8/3/2019 Rough Draft Wit Pg No
http://slidepdf.com/reader/full/rough-draft-wit-pg-no 24/59
24
Primary data:
Primary data is the original data collected by the researcher for the first time. The various
sources for collecting primary data are questionnaire, observation, interview, consumer panels
etc. The primary source used for this study is questionnaire.
Secondary data:
Secondary data is the information which is already available in published or unpublished form.
The various sources of secondary data are books, magazines, statistical data sources etc. The
secondary data source used for this study is company profile, scope, need, review of literature.
Sampling:
Collecting data about each and every unit of the population is called census method. The
approach, where only a few units of population under study are considered for analysis is called
sampling method.
Probability Sampling
Under this method, every item of the universe has an equal chance of inclusion in the
sample. Under probability sampling there are 4 types of sampling techniques.
A simple random sampling technique is used for data collection among the respondents.
Simple random Sampling
In this type of sampling is also known as chance sampling or probability sampling where
each and every item in the population has an equal chance of inclusion in the sample and each
one of the possible samples, in case of finite universe, has the same probability of being selected
Population:
All items in any field of enquiry constitute a universe or population. The population or universe
can be finite or infinite. The population in Ashok Leyland is found to be 3800 employees.

8/3/2019 Rough Draft Wit Pg No
http://slidepdf.com/reader/full/rough-draft-wit-pg-no 25/59
25
Sampling unit:
A decision has to be taken concerning a sampling unit before selecting sample. It may be a
geographical area such as state, district, villages etc. The sampling unit of this study is the
employees of Ashok Leyland.
Sampling frame:
A sampling frame may be defined as the listing of the general components of the individual units
that comprise the defined population.
Sampling size:
It refers to the number of elements of the population to be sampled. The sample size chosen for
survey is 120.
Hypothesis:
Hypothesis may be defined as a proposition or a set of proposition set forth as an explanation for
the occurrence of some specified group of phenomena either asserted merely as a provisional
conjecture to guide some investigation or accepted as highly probable in the light of established
facts.
Types of Hypothesis
(i) Null hypothesis
The null hypothesis is set up in testing a statistical hypothesis only to decide whether
to accept or reject the null hypothesis. It asserts that there is no difference between the
sample statistic and population parameter and whatever difference is there, is
attributable to sampling errors. Null hypothesis is denoted by, H0.
H0: μ1 = μ2
(ii) Alternative hypothesis

8/3/2019 Rough Draft Wit Pg No
http://slidepdf.com/reader/full/rough-draft-wit-pg-no 26/59
26
Any hypothesis which is not a null hypothesis is called an alternative hypothesis. It is
denoted by H1 or Ha. It is set in such a way that the rejection of null hypothesis
implies the acceptance of alternative hypothesis.
H1: μ1 ≠ μ2
H1: μ1> μ2
H1: μ1< μ2
Statistical Tools for Analysis
The researcher carries out analysis through various statistical tools. The statistical analysis is
useful for drawing inference from the collected information.
Percentage:
Percentage refers to a special kind of ratio. Percentage is used in making comparison between
two or more series of data.
No. Of Respondents
Percentage = X 100
Total No. Of Respondents
Chi-square test:
Chi-Square Test for Goodness of Fit Ψ2:
This test is a measurable of probabilities of association between the attributes. It gives us
an idea about the divergence between the observed and expected frequencies. Thus the test is
also described as the test of goodness of fit.
Formula:
Ψ2 = ∑ [(Oi - Ei)2 / Ei]

8/3/2019 Rough Draft Wit Pg No
http://slidepdf.com/reader/full/rough-draft-wit-pg-no 27/59
27
ANOVA test:
The analysis of variance is a method of splitting the total variation of a data into
constituent parts which measures different sources of variations. Analysis of variance is to find
out the components of total variations.
2.4 LIMITATIONS OF THE STUDY
➢ Time provided for completing this project work was a major constraints
➢ The respondents may be biased.
➢ Time and cost constraints were a major limitation which prevented a large sample
from been chosen
➢ Some of the respondents reacted indifferently while filling up the questionnaire.
➢ The statistical tools which used for converting qualitative data into quantitative
data may often lead to inaccurate results.
8/3/2019 Rough Draft Wit Pg No
http://slidepdf.com/reader/full/rough-draft-wit-pg-no 28/59
28
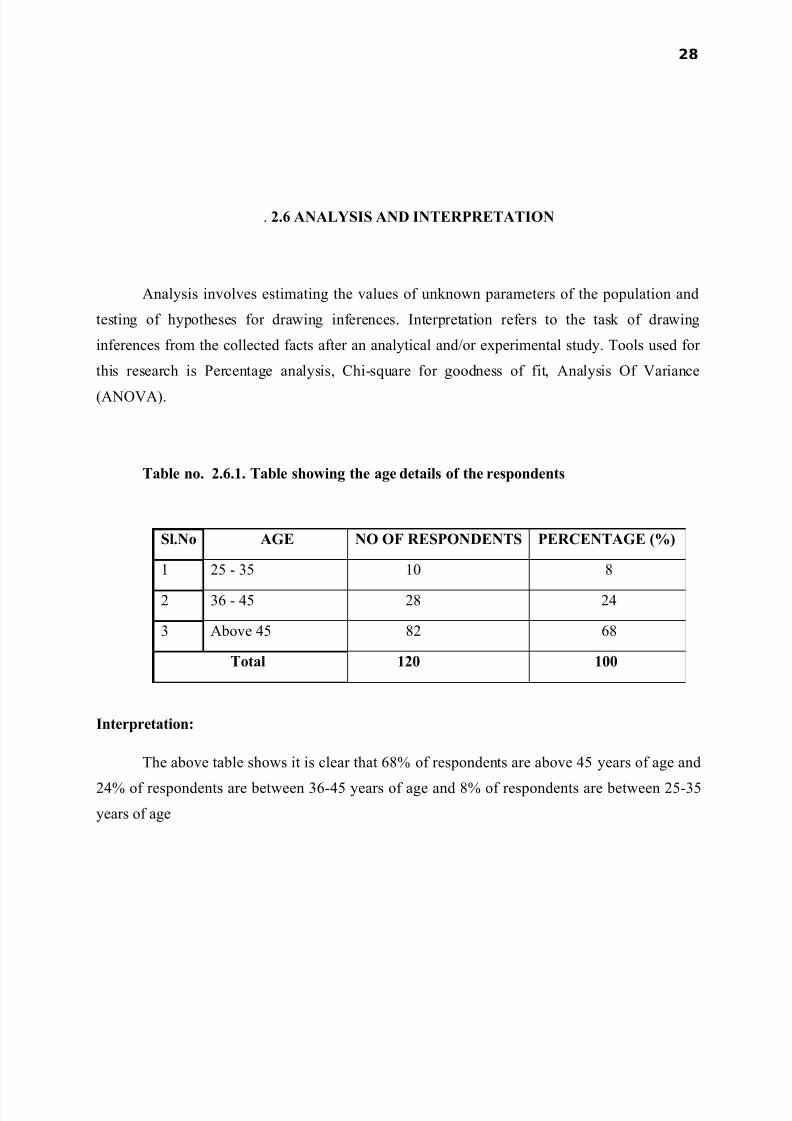
. 2.6 ANALYSIS AND INTERPRETATION
Analysis involves estimating the values of unknown parameters of the population and
testing of hypotheses for drawing inferences. Interpretation refers to the task of drawing
inferences from the collected facts after an analytical and/or experimental study. Tools used for
this research is Percentage analysis, Chi-square for goodness of fit, Analysis Of Variance
(ANOVA).
Table no. 2.6.1. Table showing the age details of the respondents
Sl.No AGE NO OF RESPONDENTS PERCENTAGE (%)
1 25 - 35 10 8
2 36 - 45 28 24
3 Above 45 82 68
Total 120 100
Interpretation:
The above table shows it is clear that 68% of respondents are above 45 years of age and
24% of respondents are between 36-45 years of age and 8% of respondents are between 25-35
years of age
8/3/2019 Rough Draft Wit Pg No
http://slidepdf.com/reader/full/rough-draft-wit-pg-no 29/59
29
Chart no. 2.6.1(a). Chart showing the age details of the respondents
.
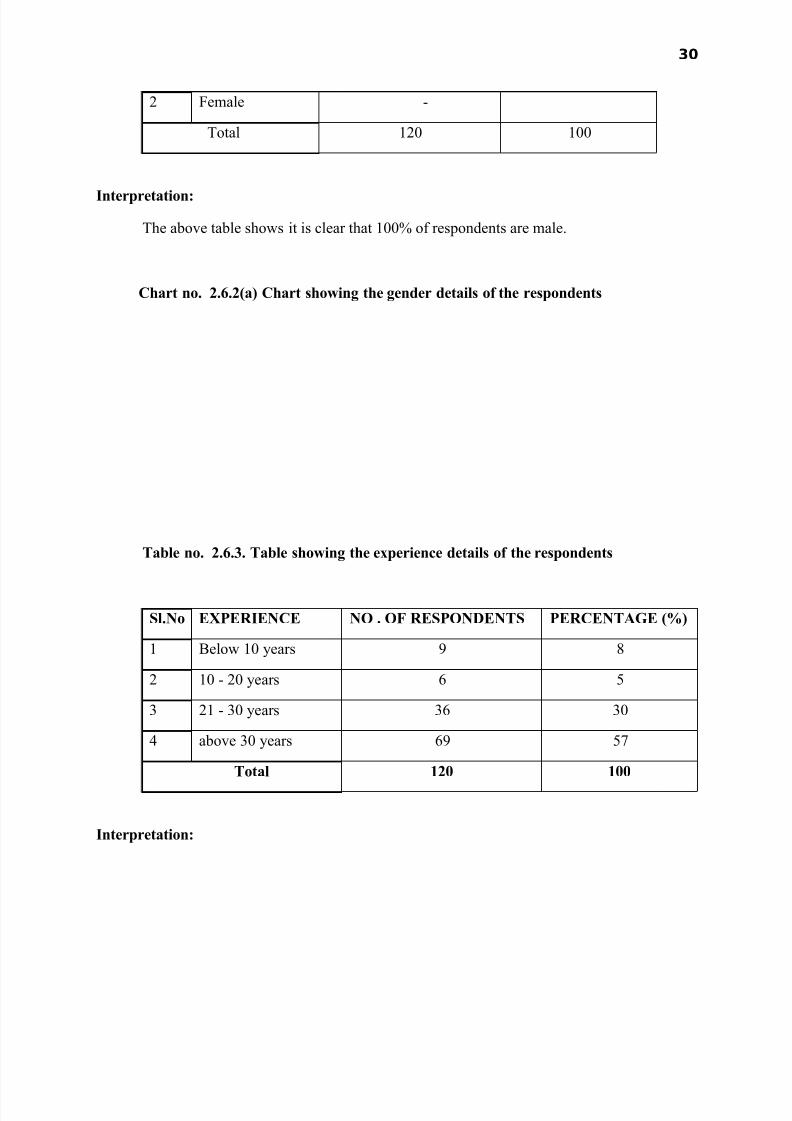
Table no. 2.6.2. Table showing the gender details of the respondents
Sl.No GENDER NO OF RESPONDENTS PERCENTAGE (%)
1 Male 120 100
8/3/2019 Rough Draft Wit Pg No
http://slidepdf.com/reader/full/rough-draft-wit-pg-no 30/59
30
2 Female -
Total 120 100
Interpretation:
The above table shows it is clear that 100% of respondents are male.
Chart no. 2.6.2(a) Chart showing the gender details of the respondents
Table no. 2.6.3. Table showing the experience details of the respondents
Sl.No EXPERIENCE NO . OF RESPONDENTS PERCENTAGE (%)
1 Below 10 years 9 8
2 10 - 20 years 6 5
3 21 - 30 years 36 30
4 above 30 years 69 57
Total 120 100
Interpretation:

8/3/2019 Rough Draft Wit Pg No
http://slidepdf.com/reader/full/rough-draft-wit-pg-no 31/59
31
The above table shows it is inferred that 57% of respondents are above 30 year of
experience and 30% of respondents are between 21-30 years and 8% of respondents are below
10 years and 5% of respondents are between 10-20years of experience in their work.
Chart no. 2.6.3(a). Chart showing the experience details of the respondents
Table no. 2.6.4. Table showing the salary details of the respondents
Sl.No SALARY NO OF RESPONDENTS PERCENTAGE (%)
1 Below 20000 6 5
2 20000 - 30000 52 43
3 30000 - 40000 62 52
Total 120 100
Interpretation:
The above table shows that 52% of respondents are between 30000-40000 and 43% of
respondents are between 20000-30000 and 5% of respondents are getting below 20000 of salary.
Chart no. 2.6.4(a) Chart showing the salary details of the respondents

8/3/2019 Rough Draft Wit Pg No
http://slidepdf.com/reader/full/rough-draft-wit-pg-no 32/59
32
Table no. 2.6.5. Table showing the employees’ opinion about the strategic goals and
objectives are shared with all.
Sl.No OPTIONS NO OF RESPONDENTS PERCENTAGE (%)
1 Strongly agree 6 5
2 Agree 94 78
3 Neutral 14 12
4 Disagree 6 5
5 Strongly disagree 0 0
Total 120 100
Interpretation:
The above table shows it is clear that 78% of respondents are agree and 12% of
respondents are neutral and 5% of respondents are strongly agree and another 5% of respondents
are disagree on the strategic goals and objectives are shared with all.
Chart no. 2.6.5(a). Chart showing the employees’ opinion about the strategic goals
and objectives are shared with all.
Table no. 2.6.6. Table showing the employees opinions regarding the organizational
policies is reviewed annually.
Sl.No OPTIONS NO OF RESPONDENTS PERCENTAGE (%)
1 Yes 110 92
2 No 10 8
Total 120 100

8/3/2019 Rough Draft Wit Pg No
http://slidepdf.com/reader/full/rough-draft-wit-pg-no 33/59
33
Interpretation:
The above table it shows that 92% of respondents are Yes and 8% of respondents are No
on the organizational policies are reviewed annually.
Chart no. 2.6.6(a) Chart showing the employees opinions regarding the organizational
policies are reviewed annually.
Table no. 2.6.7. Table showing the organization shows respect for diverse range of
opinions.
Sl.No. OPTIONS NO. OF RESPONDENTS PERCENTAGE (%)
1 Strongly agree 2 2
2 Agree 88 73
3 Neutral 26 22
4 Disagree 2 2
5 Strongly disagree 2 1
Total 120 100
Interpretation:
The above table shows it is clear that 73% of respondents are agree,22% of respondents
are neutral,2% of respondents are strongly agree,2% of respondents are disagree and another 1%
of respondents are strongly disagree about the organization shows respect for diverse opinions
Chart no. 2.6.7. (a) Chart showing the organization shows respect for diverse range
of opinion

8/3/2019 Rough Draft Wit Pg No
http://slidepdf.com/reader/full/rough-draft-wit-pg-no 34/59
34
Table no.2.6.8.Table showing the employees opinion on the culture followed in
organization for both employees and organization.
Sl.No. OPTIONS NO. OF RESPONDENTS PERCENTAGE (%)
1 Strongly agree 2 2
2 Agree 88 73
3 Neutral 24 20
4 Disagree 6 5
5 Strongly disagree 0 0
Total 120 100
Interpretation:
The above table shows it is inferred that 73% of respondents are agree, 20% of
respondents are neutral, 5% of respondents are disagree and 2% of respondents are strongly
agree on that the culture followed in organization for both employees and organization
Chart no. 2.6.8(a) Chart showing the employees opinion on the culture followed in
organization for both employees and organization.
Table no.2.6.9.Table showing the employees’ opinions on human resource
department is creative in finding new ways

8/3/2019 Rough Draft Wit Pg No
http://slidepdf.com/reader/full/rough-draft-wit-pg-no 35/59
35
Interpretation:
The above table shows that it is seen that 72% of respondents are agree, 22% of
respondents are neutral, 5% of respondents are strongly agree and 1% of respondents are
strongly disagree on that the HR department is creative in finding new ways.
Chart no. 2.6.9(a) Chart showing the employees’ opinions on human resource
department is creative in finding new ways
Table no. 2.6.10. Table showing employees’ opinions on the management teams are
diverse in nature
Sl.No. OPTIONS NO. OF RESPONDENTS PERCENTAGE (%)
1 Strongly agree 2 2
2 Agree 65 54
3 Neutral 49 41
4 Disagree 4 3
5 Strongly disagree 0 0
Total 120 100
Sl.No. OPTIONS NO. OF RESPONDENTS PERCENTAGE (%)
1 Strongly agree 6 5
2 Agree 86 72
3 Neutral 26 22
4 Disagree 0 0
5 Strongly disagree 2 1
Total 120 100

8/3/2019 Rough Draft Wit Pg No
http://slidepdf.com/reader/full/rough-draft-wit-pg-no 36/59
36
Interpretation:
The above table shows it is clear that 54% of respondents are agree, 41% of respondents
are neutral, 3% of respondents area disagree and 2% of respondents are strongly agree on that the
management teams are diverse in nature
Chart no. 2.6.10(a) Chart showing employees’ opinions on the management teams
are diverse in nature.
Table no. 2.6.11. Table showing that the organization values employees opinion
Sl.No. OPTIONS NO.OF RESPONDENTS PERCENTAGE (%)
1 Strongly agree 7 6
2 agree 87 73
3 Neutral 23 19
4 Disagree 3 2
5 Strongly disagree 0 0
Total 120 100
Interpretation:
It is clear that 73% of respondents are agree, 19% of respondents are neutral, 6% of
respondents are strongly agree and 2% of respondents are disagree on the organization values my
opinion.
Chart no. 2.6.11(a) Chart showing that the organization values employees opinion

8/3/2019 Rough Draft Wit Pg No
http://slidepdf.com/reader/full/rough-draft-wit-pg-no 37/59
37
Table no. 2.6.12. Table showing the satisfactory level regard to these factors
Sl.N
o
OPTIONS HIGHLY
SATISFIED
%
SATISFI
ED
%
NEUTRAL
%
DISSATISFI
ED
%
HIGHLY
DISSATISFI
ED
%
TOT
L
1
Working
Environment
3 3 97 81 10 8 10 8 0 0 120
2 Training
4 3 69 57 45 38 0 0 2 2 120
3 Promotion
8 7 48 40 43 36 15 12 6 5 120
4
Shared
values
4 3 51 43 45 38 16 13 4 3 129
Interpretation:
The above table shows it is clear that in working environment 81% of respondents are
satisfied, 8% of respondents are neutral, 8% of respondents are dissatisfied and 3% of
respondents are highly satisfied in their work environment.
In training 57% of respondents are satisfied, 38% of respondents are neutral, 3% of
respondents are highly satisfied and 2% of respondents are highly dissatisfied in training.
In promotion 40% of respondents are satisfied, 36% of respondents are neutral, 12% of respondents are dissatisfied, 7% of respondents are highly satisfied and 5% of respondents are
highly dissatisfied in promotion.

8/3/2019 Rough Draft Wit Pg No
http://slidepdf.com/reader/full/rough-draft-wit-pg-no 38/59
38
In shared values 43% of respondents are satisfied, 38% of respondents are neutral, 13%
of respondents are dissatisfied, 3% of respondents are highly dissatisfied and 3% of respondents
are highly satisfied in shared values.
Chart no. 2.6.12. Chart showing the satisfactory level regard to these factors
Table no. 2.6.13 Table showing the employees satisfactory level on the organization
rules and regulations.

8/3/2019 Rough Draft Wit Pg No
http://slidepdf.com/reader/full/rough-draft-wit-pg-no 39/59
39
Sl.No OPTIONS NO. OF RESPONDENTS PERCENTAGE (%)
1 Highly satisfied 4 3
2 Satisfied 102 85
3 Neutral 10 9
4 Dissatisfied 4 3
5 Highly dissatisfied 0 0
Total 120 100
Interpretation:
It is clear that 85% of respondents are satisfied, 9% of respondents are neutral, 3% of
respondents are dissatisfied and another 3% of respondents are highly satisfied of the
organization rules and regulations.
Chart no. 2.6.13(a) Chart showing the employees satisfactory level on the
organization rules and regulations
Table no. 2.6.14 Table showing the employees opinion about the organization
communicates effectively.
Sl.No. OPTIONS NO. OF RESPONDENTS PERCENTAGE (%)
1 Strongly agree 6 5
2 Agree 78 65
3 Neutral 34 28
4 Disagree 2 2
5 Strongly disagree 0 0
Total 120 100

8/3/2019 Rough Draft Wit Pg No
http://slidepdf.com/reader/full/rough-draft-wit-pg-no 40/59
40
Interpretation:
The table shows it is inferred that 65% of respondents are agree, 28% of respondents are
neutral, 5% of respondents are strongly agree and 2% of respondents are disagree on that the
organization communicates effectively
Chart no. 2.6.14(a) Chart showing the employees opinion about the organization
communicates effectively.
.
Table no.2.6.15. Table showing that the every level of workers has a unique code of
conduct
Sl.No. OPTIONS NO. OF RESPONDENTS PERCENTAGE (%)
1 Strongly agree 0 0
2 Agree 82 68
3 Neutral 28 24
4 Disagree 10 8
5 Strongly disagree 0 0
Total 120 100
Interpretation:
From the above table shows that 68% of respondents are agree, 24% of respondents are
neutral, 8% of respondents are disagree on every level of workers has a unique code of conduct.
Chart no.2.6.15 (a) Chart showing that the every level of workers has a unique code
of conduct

8/3/2019 Rough Draft Wit Pg No
http://slidepdf.com/reader/full/rough-draft-wit-pg-no 41/59
41
Tableno.2.6.16.Table showing the employees opinion about the team members are
rewarded based on performance
Sl.No. OPTIONS NO. OF RESPONDENTS PERCENTAGE (%)
1 Strongly agree 10 8
2 Agree 71 59
3 Neutral 25 21
4 Disagree 8 7
5 Strongly disagree 6 5
Total 120 100
Interpretation:
The above table shows it is clear that 59% of respondents are agree, 21% of respondents
are neutral,8% of respondents are strongly agree 7% of respondents are disagree and 5% of
respondents are strongly disagree on the team members arena rewarded strictly based on
performance
Chartno.2.6.16(a)Chart showing the employees opinion about the team members
are
rewarded based on performance
Table no. 2.6.17 Table showing satisfactory level on employees driven to make
difference in workplace
Sl.No. OPTIONS NO. OF RESPONDENTS PERCENTAGE (%)
1 Highly satisfied 11 9
2 Satisfied 80 67

8/3/2019 Rough Draft Wit Pg No
http://slidepdf.com/reader/full/rough-draft-wit-pg-no 42/59
42
3 Neutral 26 22
4 Dissatisfied 1 1
5 Highly dissatisfied 2 1
Total 120 100
Interpretation:
The above table shows it is clear that 67% of respondents are satisfied, 22% of
respondents are neutral, 9% of respondents are highly satisfied, 1% of respondents are
dissatisfied and another 1% of respondents are highly dissatisfied on driven to make difference
in their workplace.
Chart no. 2.6.17(a) Chart showing satisfactory level on employees driven to make
difference in workplace
Table no. 2.6.18. Table showing that there is openness to suggestion from people at
all levels.
Sl.No. OPTIONS NO. OF RESPONDENTS PERCENTAGE (%)
1 Strongly agree 7 6
2 Agree 68 56
3 Neutral 25 21
4 Disagree 9 8
5 Strongly disagree 11 9
Total 120 100
Interpretation:
The above table shows it is inferred that 56% of respondents are agree, 21% of
respondents are neutral,8% of respondents are disagree, 6% of respondents are strongly agree

8/3/2019 Rough Draft Wit Pg No
http://slidepdf.com/reader/full/rough-draft-wit-pg-no 43/59
43
and 9% of respondents are strongly disagree on there is openness to suggestion from people-
related at all levels.
Chart no. 2.6.18(a) Chart showing that there is openness to suggestion from people
at all levels.
Table no. 2.6.19 Table showing the employees opinion on culture learned from the
organization
Sl.No. OPTIONS NO. OF RESPONDENTS PERCENTAGE (%)1 Stories 12 10
2 Symbols 47 39
3 Rituals 12 10
4 Language 49 41
Total 120 100
Interpretation:
It is clear that 41% of respondents are learned the culture through language, 39% of
respondents are through symbols, 10% of respondents are learned through stories and 10% of
respondents are learned the culture through rituals.
Chart no. 2.6.19(a) Chart showing the employees opinion on culture learned from
the organization
Table no. 2.6.20 Table showing the employees opinion about the perfect
8/3/2019 Rough Draft Wit Pg No
http://slidepdf.com/reader/full/rough-draft-wit-pg-no 44/59
44
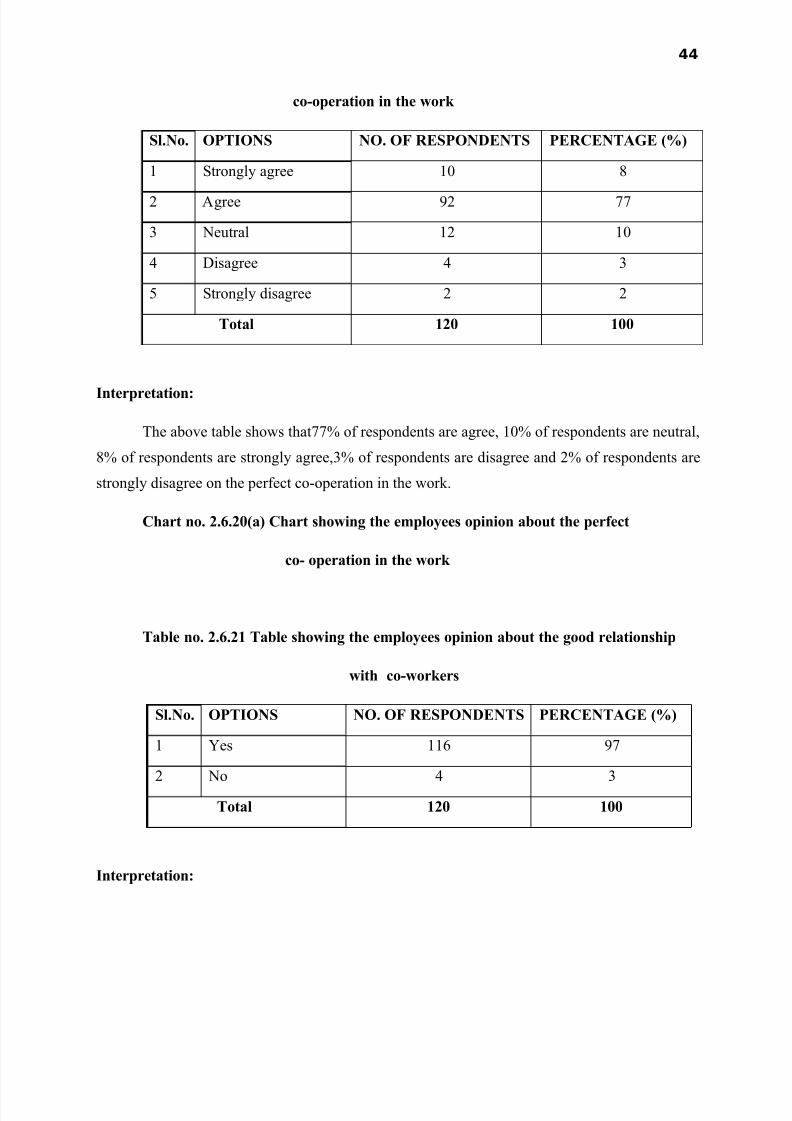
co-operation in the work
Sl.No. OPTIONS NO. OF RESPONDENTS PERCENTAGE (%)
1 Strongly agree 10 8
2 Agree 92 77
3 Neutral 12 10
4 Disagree 4 3
5 Strongly disagree 2 2
Total 120 100
Interpretation:
The above table shows that77% of respondents are agree, 10% of respondents are neutral,
8% of respondents are strongly agree,3% of respondents are disagree and 2% of respondents are
strongly disagree on the perfect co-operation in the work.
Chart no. 2.6.20(a) Chart showing the employees opinion about the perfect
co- operation in the work
Table no. 2.6.21 Table showing the employees opinion about the good relationship
with co-workers
Sl.No. OPTIONS NO. OF RESPONDENTS PERCENTAGE (%)
1 Yes 116 97
2 No 4 3
Total 120 100
Interpretation:

8/3/2019 Rough Draft Wit Pg No
http://slidepdf.com/reader/full/rough-draft-wit-pg-no 45/59
45
The above table shows it is clear that 97% of respondents are yes on good relationship
with co-workers and 3% of respondents are no on good relationship with co-workers.
Chart no. 2.6.21(a) Chart showing the employees opinion about the good
relationship with co-workers
Table no. 2.6.22. Table showing the employees opinion about enjoying starting a
new day at work
Sl.No. OPTIONS NO. OF RESPONDENTS PERCENTAGE
(%)
1 Strongly agree 29 24
2 Agree 87 73
3 Neutral 2 2
4 Disagree 0 0
5 Strongly disagree 2 1
Total 120 100
Interpretation:
The above table shows it is inferred that 73% of respondents are agree, 24% of
respondents are strongly agree and 1,67% of respondents are neutral on the enjoy starting a new
day at work.
Chart no. 2.6.22(a) Chart showing the employees opinion about enjoying starting a

8/3/2019 Rough Draft Wit Pg No
http://slidepdf.com/reader/full/rough-draft-wit-pg-no 46/59
46
new day at work
Table no. 2.6.23. Table showing the employees opinion on organization recognizes
and celebrates successes of team members.
Sl.No. OPTIONS NO. OF RESPONDENTS PERCENTAGE (%)
1 Yes 116 97
2 No 4 3
Total 120 100
Interpretation:
The above table shows it is clear that 96.67% of respondents are yes on the organization
celebrate success of team members and 3.33% of respondents are No on the organization
celebrate success of team members
Chart no. 2.6.23(a) Chart showing the employees opinion on organization recognizes
and celebrates successes of team members.
Table no.2.6.24 Table showing that the satisfactory level on strong culture
Sl.N
o.
OPTIONS HIGHLY
SATISFIE
D
%
SATISFIE
D
%
NEUTRA
L
%
DISSATIS
FIED
%
HIGHLY
DISSATISFI
ED
%
TOT
AL

8/3/2019 Rough Draft Wit Pg No
http://slidepdf.com/reader/full/rough-draft-wit-pg-no 47/59
47
1
Rewards 5 4 83 69 20 17 12 10 0 0 120
2
Orientation 5 4 66 55 40 33 7 6 2 2 120
3
Beliefs 5 4 65 54 46 38 2 2 2 2 120
4
Communication 7 6 64 53 42 35 7 6 0 0 120
Interpretation:
The above table shows it is inferred that in rewards 69% of respondents are satisfied on
their rewards, 17% of respondents are neutral, 10% of respondents are dissatisfied and 4% of
respondents are highly satisfied on rewards.
In orientation 55% of respondents are satisfied on orientation, 33% of respondents are
neutral, 6% of respondents are dissatisfied, another 4% of respondents are highly satisfied and
2% of respondents are highly dissatisfied on orientation.
In beliefs 54% of respondents are satisfied on beliefs,38% of respondents are neutral, 4%
of respondents are highly satisfied, 2% of respondents are dissatisfied and 2% of respondents are
highly dissatisfied about their beliefs.
In communication 53% of respondents are satisfied on the communication, 35% of
respondents are neutral on this, 6% of respondents are highly satisfied, and 6% of respondents
are dissatisfied on communication.
Chart no.2.6.24 (a) Chart showing that the satisfactory level on strong culture

8/3/2019 Rough Draft Wit Pg No
http://slidepdf.com/reader/full/rough-draft-wit-pg-no 48/59
48
Chi-square test for goodness of fit
Sl.No. OPTIONS NO. OF RESPONDENTS PERCENTAGE (%)
1 Strongly agree 10 8
2 Agree 71 59
3 Neutral 25 21
4 Disagree 8 7
5 Strongly disagree 6 5
Total 120 100
Ho: there is no relationship between the team members performance and rewards

8/3/2019 Rough Draft Wit Pg No
http://slidepdf.com/reader/full/rough-draft-wit-pg-no 49/59
49
H1: there is relationship between the team members performance and rewards
The value of the test-statistic is
Table no.2.6.25 Table showing that there is a relationship between the team
members performance and rewards
Options
Observed
frequency(O
)
Expected
frequency(E)(O-E) (O-E)2 (O-E)2/E
Strongly agree 10 24 -14 196 8.17
Agree 71 24 47 2209 92.04
Neutral 25 24 -1 1 0.045
Disagree 8 24 -16 256 10.67
Strongly disagree 6 24 -18 324 13.5
Total 120 124.4
Expected frequency =120/5 = 24.
Calculated value = 124.4
Level of significance =0.5
Degree of freedom= n-1
= 5-1
= 4
Table value = 9.488

8/3/2019 Rough Draft Wit Pg No
http://slidepdf.com/reader/full/rough-draft-wit-pg-no 50/59
50
RESULT:
Since the Calculated value > table value, so reject Ho.
Hence, there is relationship between the team members performance and rewards.
ANALYSIS OF VARIANCE (ANOVA)
Components Highly
satisfied
Satisfied Neutral Dissatisfied Highly
dissatisfied
Rewards 5 83 20 12 0
Orientation 5 66 40 7 2
Beliefs 5 65 46 2 2
Communication 7 64 42 7 0
Ho: there is no significant difference between the components of strong culture

8/3/2019 Rough Draft Wit Pg No
http://slidepdf.com/reader/full/rough-draft-wit-pg-no 51/59
51
H1: there is significant difference between the components of strong culture
Step 1:
Table no.2.6.26 table showing that there is a significant difference in these components
Particulars X1 X2 X3 X4 X5
Rewards 5 83 20 12 0
Orientation 5 66 40 7 2
Beliefs 5 65 46 2 2
Communication 7 64 42 7 0
Total ΣX1= 22 ΣX2= 278 ΣX3= 148 ΣX4= 28 ΣX5= 4
Step 2:
Particulars X21 X22 X23 X24 X25
Rewards 25 6889 400 144 0
Orientation 25 4356 1600 49 4
Beliefs 25 4225 2116 4 4
Communication 49 4096 1764 49 0
Total ΣX21=172 ΣX22=18380 ΣX23=6056 ΣX24=232 ΣX25=8

8/3/2019 Rough Draft Wit Pg No
http://slidepdf.com/reader/full/rough-draft-wit-pg-no 52/59
52
Step 3:
Calculate T value:
N=20
T=Σx1+Σx2+Σx3+Σx4+Σx
=22+278+148+28+4
T= 480
Step 4:
Correction Factor = T2/2
= 4802/20
=230400/20
CF=11520
Step 5:
TSS = (ΣX21+ΣX22+ΣX23+ΣX24+ΣX25) – CF
= (124+19566+5880+246+8) – 11520
= 25824 – 11520
= 14304.
Step 6:
Sum of square between components
= [(ΣX1)2/n+ (ΣX2)2/n + (ΣX3)2 /n+(ΣX4)2/n + (ΣX5)2/n] – CF
= [(22)2/4 + (278)2/4+ (148)2/4+(28)2/4+(4)2/4] -11520
= (121+19321+5476+196+4) – 11520
= 13598

8/3/2019 Rough Draft Wit Pg No
http://slidepdf.com/reader/full/rough-draft-wit-pg-no 53/59
53
Step 7:
(Total sum of squares) – (sum of squares)
= (14304) – (13598)
= 706.
Step 8:
ANOVA table
Source of variance Sum of squares Degree of freedom variance
Between variables 13598 C-1= 5-1 =4 SSC/C-1 = 3399.5
Within variables 706 N-C= 20-5 = 15 SSE/N-C = 47.07
F= between variable / within variable
= 3399.5/47.07
= 72
Calculated value =72
Table value = 3.06
RESULT:
Since Calculated value > table value, so reject Ho.
Hence, there is a significant difference between the components of strong culture.

8/3/2019 Rough Draft Wit Pg No
http://slidepdf.com/reader/full/rough-draft-wit-pg-no 54/59
54
3.1 FINDINGS
➢ It is inferred that majority (68%) of the respondents are above 40 years of age.
➢ It is inferred that majority (100%) of the respondents are male.
➢ It is inferred that majority (57%) of the respondents are above 30 years of experience in
their work.
➢ It is inferred that majority (52%) of the respondents are getting salary between 30000 to
40000.
➢ It is inferred that majority (78%) of the respondents agree that the strategic goals and
objectives are widely shared with all in Ashok Leyland.
➢ It is found that majority (92%) of the respondents said that the organization policies are
reviewed annually.

8/3/2019 Rough Draft Wit Pg No
http://slidepdf.com/reader/full/rough-draft-wit-pg-no 55/59
55
➢ It is inferred that majority (73%) of the respondents agree that the organization shows
respect for a different opinions and ideas.
➢ It is inferred that majority (73%) of the respondents says that the organization culture
followed for both the organization and employees.
➢ It is inferred that majority (72%) of the respondents agree with the human resource
department is creative in finding new ways to attract diverse groups.
➢ It is inferred that majority (54%) of the respondents agree with the management teams are
diverse in nature.
➢ It is found that majority (73%) of the respondents feel that organization values our
opinion.
➢ It is inferred that majority (81%) of the respondents satisfied with their working
environment in Ashok Leyland.
➢ It is inferred that majority (57%) of the respondents satisfied with their training programs
conducted in the Ashok Leyland.
➢ It is inferred that majority (40%) of the respondents satisfied with their promotions.
➢ It is inferred that majority (43%) of the respondents satisfied with the organization shares
the information.
➢ It is found that majority (85%) of the respondents satisfied with their rules and
regulations of Ashok Leyland Company.
➢ It is inferred that majority (65%) of the respondents agree with the organization
communicates effectively.
➢ It is found that majority (68%) of the respondents agree with that every level of workers
has a unique code of conduct in the organization.
➢ It is inferred that majority (59%) of the respondents are stated that rewarded the team
members based on their performance.
➢ It is found that majority (67%) of the respondents are feel driven to make a difference in
their work place.
➢ It is inferred that majority (56%) of the respondents are agree with that openness to
suggestion from all levels of people in the organization.
➢ It is found that majority (41%) of the respondents learned the culture of the organization
by the way of language.

8/3/2019 Rough Draft Wit Pg No
http://slidepdf.com/reader/full/rough-draft-wit-pg-no 56/59
56
➢ It is found that majority (77%) of the respondents have a perfect co-operation in their
work.
➢ It is found that majority (97%) of the respondents have the good relationship with their
co-workers in the organization.
➢ It is inferred that majority (73%) of the respondents enjoying their work from the new
day they starting their work.
➢ It is inferred that majority (97%) of the respondents are celebrates the success of team
members.
➢ It is inferred that majority (69%) of the respondents satisfied with the strong culture is
based on the rewards.
➢ It is inferred that majority (55%) of the respondents satisfied with the strong culture is
based on the orientation.
➢ It is inferred that majority (54%) of the respondents satisfied with the strong culture is
based on beliefs.
➢ It is inferred that majority (53%) of the respondents satisfied with the strong culture is
based on communication.
➢ It is inferred that there is a relationship between the team members performance and
rewards.
➢ It is found that there is a significant difference between the components of strong culture.

8/3/2019 Rough Draft Wit Pg No
http://slidepdf.com/reader/full/rough-draft-wit-pg-no 57/59
57
3.2. SUGGESTION
➢ The management can provide proper guidance to the employees regarding organizational
culture through HR department.
➢ Management can improve the better communication between management and
employees and improve to consider the openness suggestion from all levels of people
working in the organization.
➢ To improve the relationship between top level to low level.
➢ The Management can improve the training programs to the employees, it helps to develop
their skills.
➢ The company will improve to share the information to all working in the organization\
➢ The company can improve to promote the employees based on their performance in the
work.
➢ Work will be planned well in advance, taking care that work assignments do not overlap
with one another. Information regarding the work could reach in time.
8/3/2019 Rough Draft Wit Pg No
http://slidepdf.com/reader/full/rough-draft-wit-pg-no 58/59
58
3.3. CONCLUSION
The present study was conducted at Ashok Leyland Private Limited, Chennai.
Organizational culture helps to identify the employees’ perception towards the
organization. The emphasis has been on improved receptivity to feedback, more openness
of communication, introduction of new methodologies of work, better clarity of roles and
jobs, as well as adequacy and appropriateness of training. The type of research design
used for the study is descriptive research design. Sample size taken for the study is 120
employees in Ashok Leyland. Simple random sampling technique has been used. A
structured questionnaire is prepared to collect data.
To a lesser degree, the respondents also agree that they have more freedom in
their work, that the organization has become less bureaucratic and more flexible, and that
the work environment is pleasant. Since most of the respondents have positive feelings
about it, the management should take care to maintain the current way of working.

8/3/2019 Rough Draft Wit Pg No
http://slidepdf.com/reader/full/rough-draft-wit-pg-no 59/59
59