Embed Size (px)
Citation preview
8/10/2019 ROR 97 2003 Workbook
http://slidepdf.com/reader/full/ror-97-2003-workbook 1/9
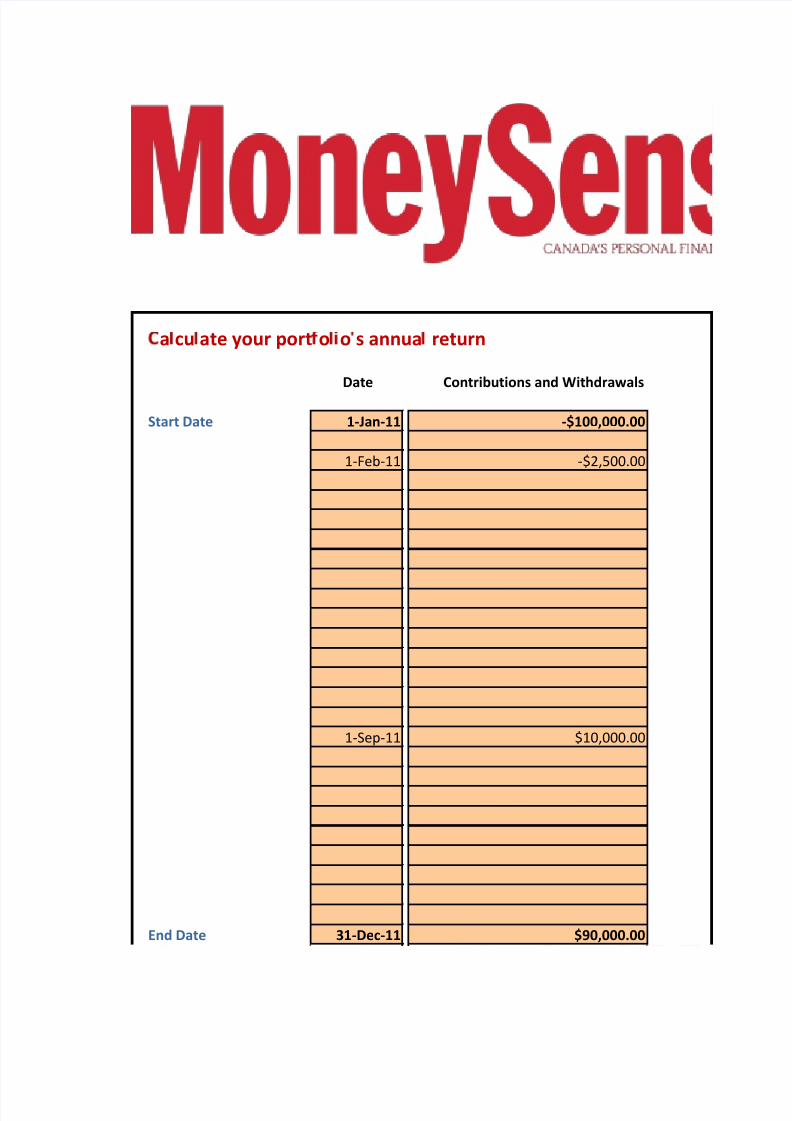
a cu ate your port o o s annua return
Date Contributions and Withdrawals
Start Date 1-Jan-11 -$100,000.00
1-Feb-11 -$2,500.00
1-Sep-11 $10,000.00
End Date 31-Dec-11 $90,000.00
8/10/2019 ROR 97 2003 Workbook
http://slidepdf.com/reader/full/ror-97-2003-workbook 2/9
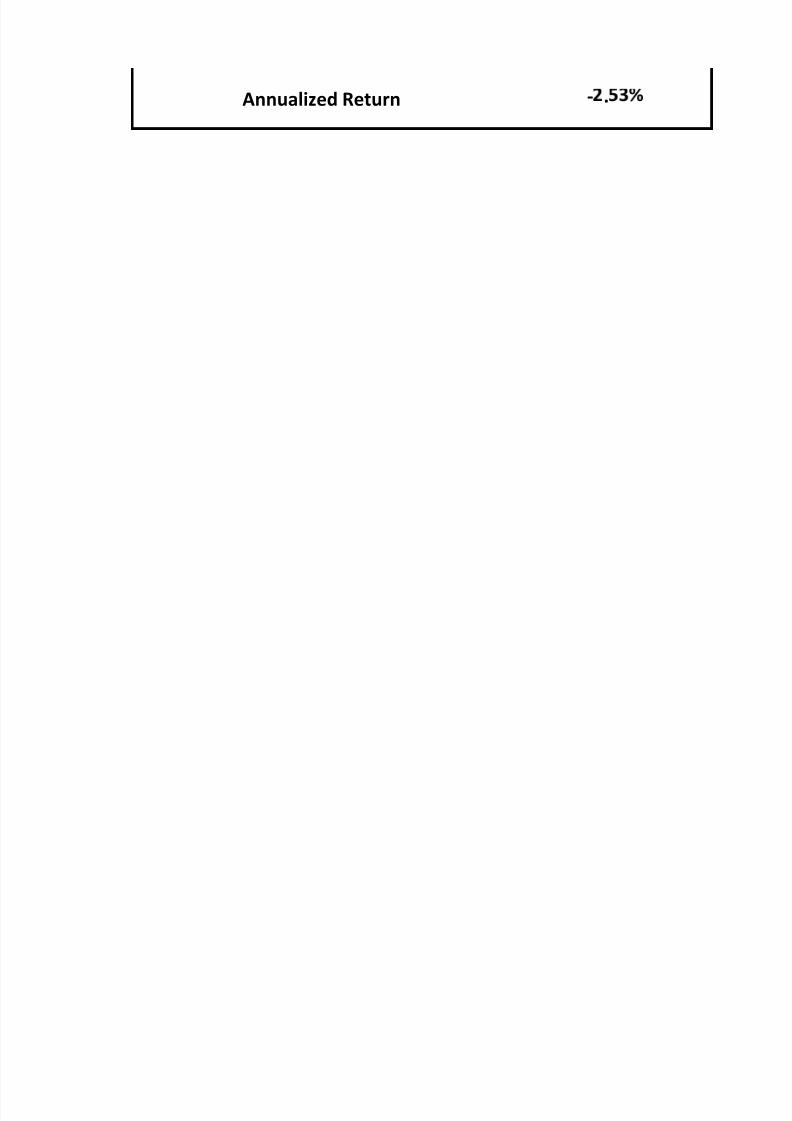
- .Annualized Return
8/10/2019 ROR 97 2003 Workbook
http://slidepdf.com/reader/full/ror-97-2003-workbook 3/9
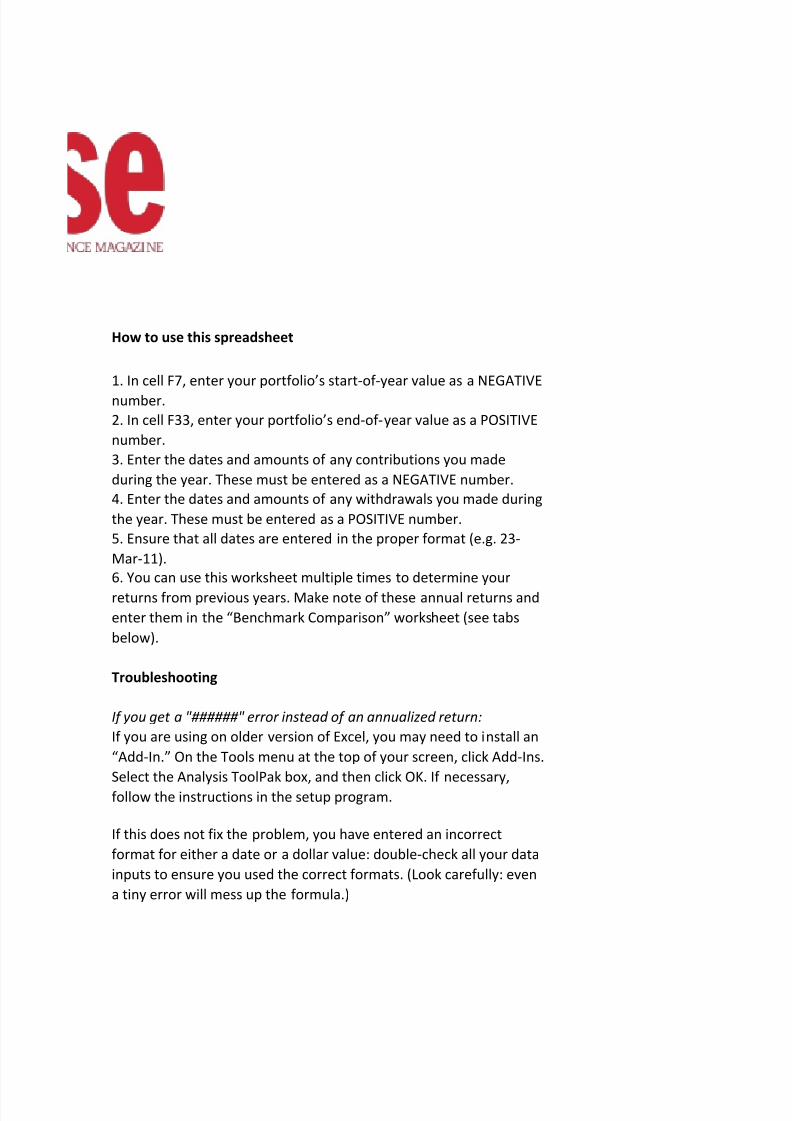
How to use this spreadsheet
Troubleshooting
If you get a "######" error instead of an annualized return:
5. Ensure that all dates are entered in the proper format (e.g. 23-
Mar-11).
If you are using on older version of Excel, you may need to install an
“Add-In.” On the Tools menu at the top of your screen, click Add-Ins.
Select the Analysis ToolPak box, and then click OK. If necessary,
follow the instructions in the setup program.
If this does not fix the problem, you have entered an incorrect
format for either a date or a dollar value: double-check all your data
inputs to ensure you used the correct formats. (Look carefully: even
a tiny error will mess up the formula.)
1. In cell F7, enter your portfolio’s start-of-year value as a NEGATIVE
number.
2. In cell F33, enter your portfolio’s end-of-year value as a POSITIVE
number.
3. Enter the dates and amounts of any contributions you made
during the year. These must be entered as a NEGATIVE number.
4. Enter the dates and amounts of any withdrawals you made during
the year. These must be entered as a POSITIVE number.
6. You can use this worksheet multiple times to determine your
returns from previous years. Make note of these annual returns and
enter them in the “Benchmark Comparison” worksheet (see tabs
below).
8/10/2019 ROR 97 2003 Workbook
http://slidepdf.com/reader/full/ror-97-2003-workbook 4/9
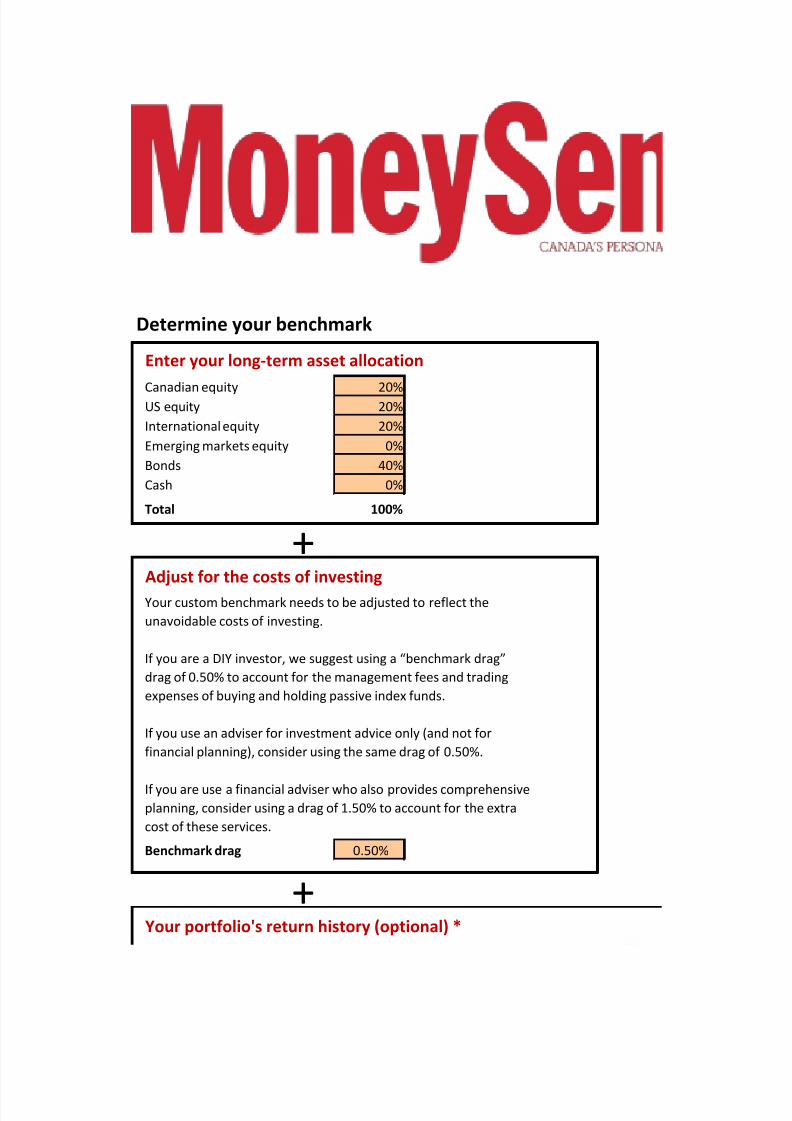
Determine your benchmark
20%20%
20%
0%
40%
0%
Total 100%
+
Benchmark drag 0.50%
+Your portfolio's return history (optional) *
Cash
Your custom benchmark needs to be adjusted to reflect the
unavoidable costs of investing.
If you are a DIY investor, we suggest using a “benchmark drag”
drag of 0.50% to account for the management fees and trading
expenses of buying and holding passive index funds.
If you use an adviser for investment advice only (and not for
financial planning), consider using the same drag of 0.50%.
If you are use a financial adviser who also provides comprehensiveplanning, consider using a drag of 1.50% to account for the extra
cost of these services.
Enter your long-term asset allocation
Adjust for the costs of investing
Canadian equityUS equity
International equity
Emerging markets equity
Bonds
8/10/2019 ROR 97 2003 Workbook
http://slidepdf.com/reader/full/ror-97-2003-workbook 5/9
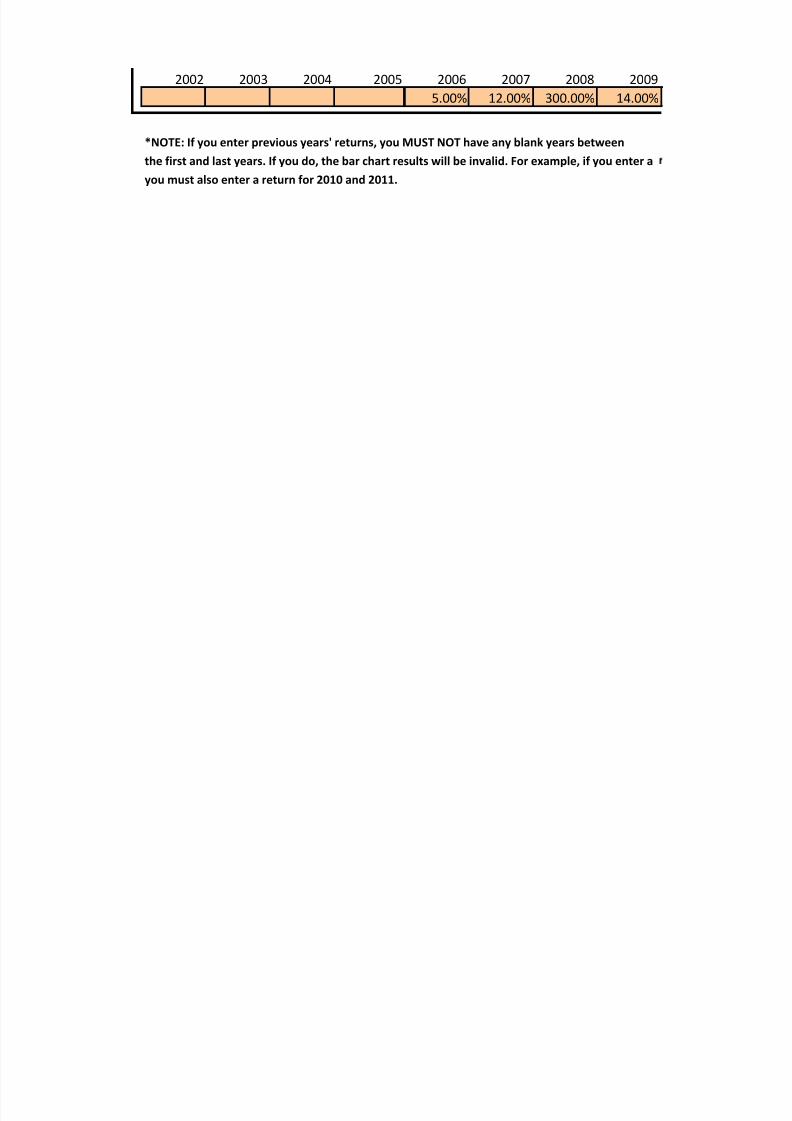
2002 2003 2004 2005 2006 2007 2008 2009
5.00% 12.00% 300.00% 14.00%
*NOTE: If you enter previous years' returns, you MUST NOT have any blank years between
the first and last years. If you do, the bar chart results will be invalid. For example, if you enter a
you must also enter a return for 2010 and 2011.
8/10/2019 ROR 97 2003 Workbook
http://slidepdf.com/reader/full/ror-97-2003-workbook 6/9
200200820072006
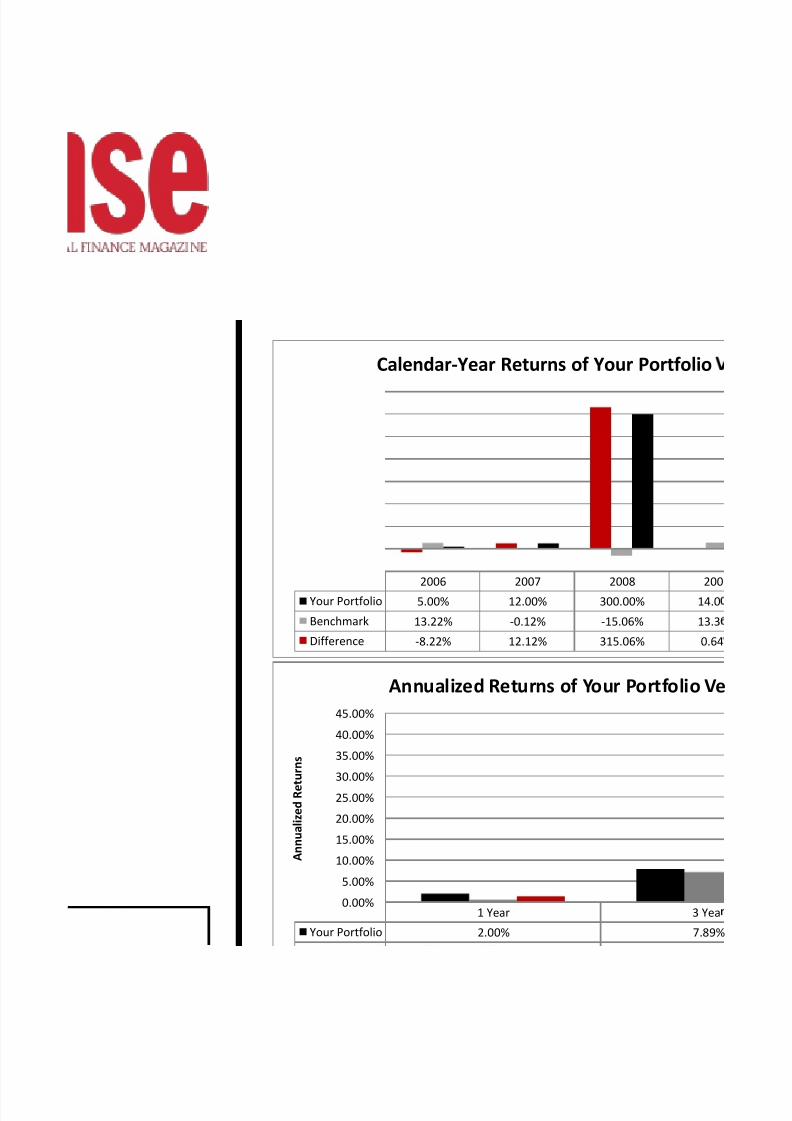
Your Portfolio 14.0300.00%12.00%5.00%
Benchmark 13.3-15.06%-0.12%13.22%
Difference 0.64315.06%12.12%-8.22%
Calendar-Year Returns of Your Portfolio
1 Year 3 Yea
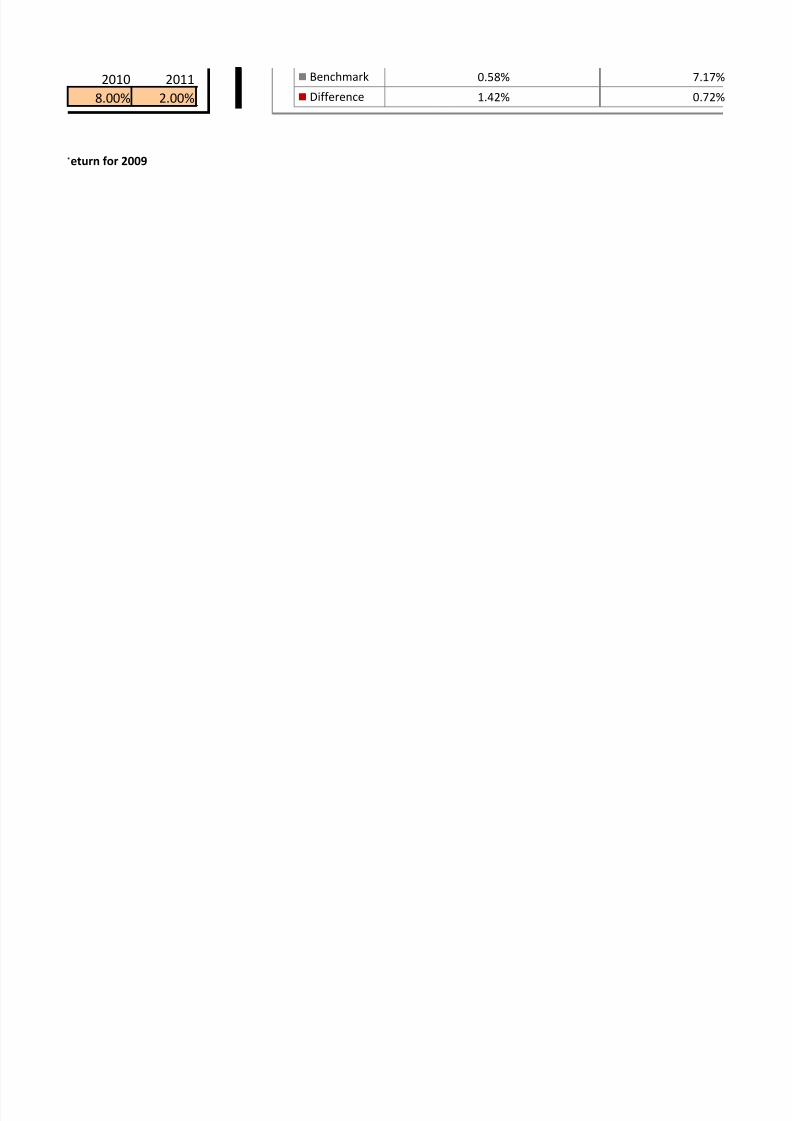
Your Portfolio 2.00% 7.89%
0.00%
5.00%
10.00%
15.00%
20.00%
25.00%
30.00%
35.00%
40.00%
45.00%
A n n u a l i z e d
R e t u r n s
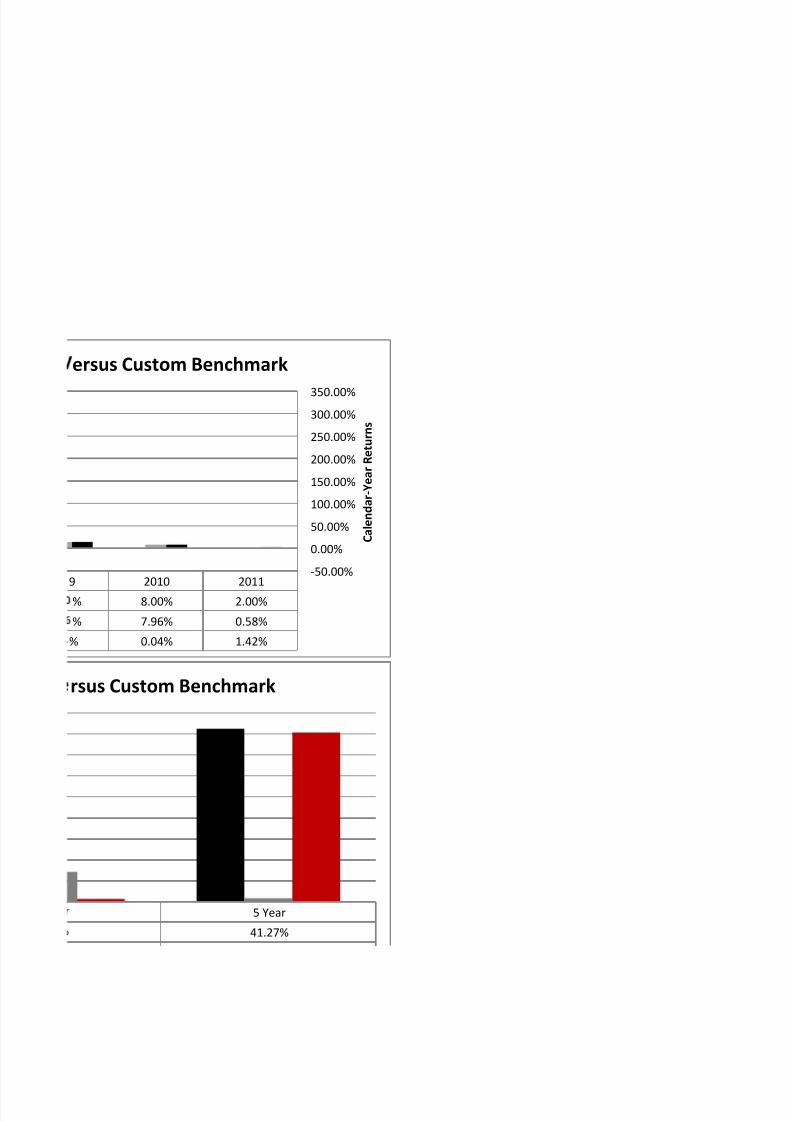
Annualized Returns of Your Portfolio Ve
8/10/2019 ROR 97 2003 Workbook
http://slidepdf.com/reader/full/ror-97-2003-workbook 7/9
2010 2011
8.00% 2.00%
eturn for 2009
Benchmark 0.58% 7.17%
Difference 1.42% 0.72%
8/10/2019 ROR 97 2003 Workbook
http://slidepdf.com/reader/full/ror-97-2003-workbook 8/9
201120109
2.00%8.00%%
0.58%7.96%%
1.42%0.04%%
-50.00%
0.00%
50.00%
100.00%
150.00%
200.00%
250.00%
300.00%
350.00%
C a l e n d a r - Y e a r R e t u r n s
ersus Custom Benchmark
5 Year
41.27%
rsus Custom Benchmark

8/10/2019 ROR 97 2003 Workbook
http://slidepdf.com/reader/full/ror-97-2003-workbook 9/9
0.87%
40.40%


![ROR [20791]](https://img.pdfslide.us/doc/110x75/563db9ca550346aa9a9feea2/ror-20791.jpg)