Embed Size (px)
Citation preview

THESIS FOR THE DEGREE OF DOCTOR OF PHILOSOPHY
RoPax Ship Collision – a Methodology for Survivability Analysis
PER HOGSTRÖM
Department of Shipping and Marine Technology
CHALMERS UNIVERSITY OF TECHNOLOGY
Gothenburg, Sweden
2012

RoPax Ship Collision – a Methodology for Survivability Analysis PER HOGSTRÖM © PER HOGSTRÖM, 2012 ISBN 978-91-7385-648-5 Doktorsavhandlingar vid Chalmers tekniska högskola Ny serie nr: 3329 ISSN 0346-718X Department of Shipping and Marine Technology Division of Marine Design Chalmers University of Technology SE-412 96, Gothenburg Sweden Telephone: +46 (0)31-772 1000 Printed by Chalmers Reproservice Gothenburg, Sweden 2012

i
RoPax Ship Collision – a Methodology for Survivability Analysis PER HOGSTRÖM Department of Shipping and Marine Technology, Division of Marine Design
Abstract Throughout the world, ships are continuously being declared as total losses and 10 to 15% of these accidents are collisions between ships. The consequences of a collision are diverse and depend on the ship type, e.g. oil outflow in the case of damaged tankers or loss of stability in damaged passenger ships. This thesis focuses on RoPax ships, which in damaged conditions are related to high risk due to the large number of persons on-board. The main objective of the work is to contribute to RoPax shipping’s further development of sustainable transport and maritime safety. The work contributes to knowledge and understanding of in what conditions a RoPax ship damaged in a collision will survive without capsizing and how these can be simulated accurately using numerical models. In order to determine the consequences of the survivability of a RoPax ship struck in collision from the shape and size of the damage opening in its side-shell, a computational methodology is presented. It is sequential (de-coupled) and incorporates a non-linear finite element (FE) analysis of a collision, followed by dynamic damage stability simulations due to flooding. By means of this approach the conditions for the survivability of a ship struck in a collision, which for a RoPax ship is the time to capsize, can be assessed. The influence of variations in input parameters to the computational methodology is studied. Uncertainties of parameters in the FE analyses include dispersion in material parameters, material failure criterion and its representation, model representation of the striking bow section, friction coefficient, collision angle and ship speed. The influence of these parameters on the shape and size of the damage opening area and time to capsize of the struck RoPax ship is assessed. Recommendations for a sufficient level of simplifications in the models and analyses for arriving at reliable results in a numerical simulation of ship collisions are made. A significant part of the thesis is dedicated to the model uncertainty that relates to a possible (user-related) insecurity in the selection of criterion for material damage and rupture in ship collision simulations using non-linear explicit FE analyses. Several criteria are compared, such as the Shear, FLD and FLSD criteria, and assessed by comparison between experiments and numerical analyses. Tensile tests are used to study the dependence on a length scale of the fracture of the material. A relationship similar to Barba’s law was established which relates the fracture strain of the material to the length scale (element size) in the FE analysis. Forming limit tests are used to study the dependence on a multiaxial strain state. A small-scale ship-like structure subjected to impact loading is used as a reference structure in the assessment of the criteria. Results from FE simulations are compared to and validated using experimental results and recommendations for procedures for a numerical analysis of collision simulations are presented. Conceptual crashworthy side-shell structures that follow either the ductility or the strength design principles are assessed with a conventional reference structure. The assessment is made by comparing the intrusion depth before rupture of the inner side-shell of a double-hull structure occurs, energy absorption during the indentation, the final damage opening area as well as the weight and manufacturing costs of each structure. The results provide a basis for the discussion of the potential and challenges related to the implementation of each structure. Keywords: Crashworthiness, damage stability, failure modelling, non-linear FEA, sheet metal failure, ship collision, uncertainty analysis.

ii
iii
Preface This thesis is comprised of work carried out during the years 2007-2012 at the Division of Ship Design (Marine Design since 2012), Department of Shipping and Marine Technology, Chalmers University of Technology. The first part of the work was carried out as part of the project HASARD, (Holistic Assessment of Ship Survivability and Risk After Damage). This project was funded by VINNOVA, the Swedish Government Agency of Innovation Systems, under contract no. 30115-1 and by LIGHTHOUSE, the Swedish Competence Centre in Maritime Education and Research (www.lighthouse.nu). First and foremost, I would like to thank my supervisor Professor Jonas Ringsberg for his deeply dedicated support and infectious enthusiasm. I would also like to thank my co-supervisor, adjunct professor Erland Johnson. No Ph.D. student could wish more from his or her supervisors than the support I have had. I also would like to express my gratitude to persons who have made contribution to the present work. In no particular order: Mathias Flansbjer, Jukka Hollappa and Ronny Engrup at SP Technical Research Institute of Sweden in Borås for their expertise in planning and carrying out the experiments; Joachim Larsson, Anders Rosvall and Rickard Svärd at SSAB for providing test data which made the scatter analysis possible; Hagbart Alsos at Reinertsen AS in Norway for kind support on the BWH criterion; Sören Ehlers at NTNU in Norway for exchange of ideas; Ulf Karlsson for exchange of models and ideas; Martin Schreuder for making the key element of this thesis – the survivability assessment – possible and Agneta Rawlinson for helping to improve the language in this thesis. In addition, I would like to express my gratitude to my colleagues at the Department of Shipping and Marine Technology, to my friends and to my family. This thesis is dedicated to my wife, Hanna, for much needed encouragement and support during the challenges I have faced pursuing my Ph.D. Per Hogström Gothenburg, February 2012

iv

v
Rule of the Road at Sea When both side-lights you see ahead — Port your helm and show your RED. GREEN to GREEN — or, RED to RED — Perfect safety — go ahead! If to your starboard RED appear, It is your duty to keep clear; To act as judgment says is proper; To Port — or Starboard — Back — or Stop her! But when upon your Port is seen A Steamer's Starboard Light of GREEN, There's not so much for you to do, For GREEN to Port keeps clear of you. Both in safety and in doubt Always keep a good look-out; In danger, with no room to turn, Ease her, Stop her, Go astern. Thomas Gray, 1867

vi

vii
List of appended papers Paper A Hogström, P., Ringsberg, J. W., Johnson, E. (2009). An experimental and
numerical study of the effects of length scale and strain state on the necking and fracture behaviours in sheet metals. International Journal of Impact Engineering 36(10-11):1194-1203.
Paper B Schreuder, M., Hogström, P., Ringsberg, J. W., Johnson, E., Janson, C. -E.
(2011). A method for assessment of the survival time of a ship damaged by collision. Journal of Ship Research 55(2):86-99.
Paper C Hogström, P., Ringsberg, J. W., Johnson, E. (2011). Survivability analysis of a
struck ship with damage opening – influence from model and material properties uncertainties. Ships and Offshore Structures 4(6):339-354.
Paper D Hogström, P., Ringsberg, J. W. (2011). An extensive study of a ship’s
survivability after collision – a parameter study of material characteristics, non-linear FEA and damage stability analyses. Submitted for publication in Marine Structures.
Paper E Hogström, P., Ringsberg, J. W. (2012). Assessment of the crashworthiness of a
selection of innovative ship structures. Submitted for publication in Ocean Engineering.

viii
List of additional peer-reviewed scientific publications
The author of this thesis is co-author of the following peer-reviewed conference articles: Schreuder, M., Hogström, P., Ringsberg, J. W., Janson, C. -E., Johnson, E. (2009). Holistic assessment of ship survivability and risk after damage. Proceedings of the 3rd International Conference on Computational Methods in Marine Engineering (MARINE2009). Trondheim, Norway. June 15-17, 2009. Hogström, P., Ringsberg, J. W., Johnson, E. (2009). Experimental verification of finite element failure criteria with respect to strain state and element size. Proceedings of the 12th International Conference on Fracture (ICF12). Ottawa, Canada. July 12-17, 2009. (Presenting author). Hogström, P., Ringsberg, J. W., Johnson, E. (2010). Analysis of a struck ship with damage opening – influence from model and material properties uncertainties. Proceedings of the 29th International Conference on Ocean, Offshore and Arctic Engineering (OMAE2010). Shanghai, China. June 6-11, 2010. (Presenting author). Ringsberg, J. W., Johnson, E., Schreuder, M., Hogström, P. (2010). Examples of selected research efforts made on characteristics of material, ship side structure response and ship survivability in ship collisions. Proceedings of the 5th International Conference on Collision and Grounding (ICCGS5). Helsinki, Finland. June 14-16, 2010. Hogström, P., Ringsberg, J. W. (2011). What can we learn from uncertainty analysis with respect to survivability or time to capsize of a ship struck in collision? Proceedings of the 30th International Conference on Ocean, Offshore and Arctic Engineering (OMAE2011). Rotterdam, the Netherlands. June 19-24, 2011. (Presenting author). Ringsberg, J. W., Hogström, P. (2012). Comparison and assessment of the crashworthiness of three innovative side-shell structures: the X-core, Y-core and corrugation panel structures. Proceedings of the 31st International Conference on Ocean, Offshore and Arctic Engineering (OMAE2012). Rio de Janeiro, Brazil. June 10-15, 2012.

ix
Contributions to appended papers The papers presented in this thesis were prepared in collaboration with co-authors. The contributions by the author of this thesis to the appended papers are summarised below. Paper A Contributed to the ideas presented, took part in the planning of the paper,
organized most of the planning of the tests, carried out the numerical simulations and wrote most of the manuscript.
Paper B Contributed to some of the ideas presented, took part in the planning of the
paper, carried out the finite element simulations and wrote parts of the manuscript.
Paper C Contributed to the ideas presented, was responsible for the planning of the paper,
carried out the numerical simulations and wrote most of the manuscript. Paper D Contributed to the ideas presented, planned the paper with the co-author, carried
out the numerical simulations, carried out the variance analysis and wrote most of the manuscript.
Paper E Contributed to the ideas presented, planned the paper with the co-author, carried
out the finite element simulations and wrote most of the manuscript.

x

xi
Contents Abstract ....................................................................................................................................... i
Preface ....................................................................................................................................... iii
List of appended papers ............................................................................................................ vii
List of additional peer-reviewed scientific publications ......................................................... viii
Contributions to appended papers ............................................................................................. ix
Contents ..................................................................................................................................... xi
1 Introduction ......................................................................................................................... 1
1.1 Motivation for study .................................................................................................... 2
1.2 Objectives of work ....................................................................................................... 4
1.3 Ship survivability analysis methodology ..................................................................... 5
1.4 Focus and limitations ................................................................................................... 6
2 Material characterization ..................................................................................................... 7
2.1 Experiments ............................................................................................................... 11
2.2 Failure modelling ....................................................................................................... 13
2.3 Verification of failure model with FEA of experimental structure ........................... 17
3 Computational methodology ............................................................................................. 21
3.1 Finite element analysis of ship collisions .................................................................. 21
3.2 Dynamic damage stability analyses ........................................................................... 23
3.3 Observations of damage opening shape representation and Tcap ............................... 25
4 Uncertainty and reliability analysis ................................................................................... 27
4.1 Sources of uncertainties ............................................................................................. 27
4.2 Response variables .................................................................................................... 31
4.3 Variance analysis ....................................................................................................... 33
5 Crashworthiness – alternative designs .............................................................................. 37
5.1 Design philosophies ................................................................................................... 37
5.2 Conceptual structures and evaluation criteria ............................................................ 38
5.3 Results ....................................................................................................................... 40
6 Summary of appended papers ........................................................................................... 47
7 Conclusions ....................................................................................................................... 51
8 Future work ....................................................................................................................... 53
References ................................................................................................................................ 55

xii
1
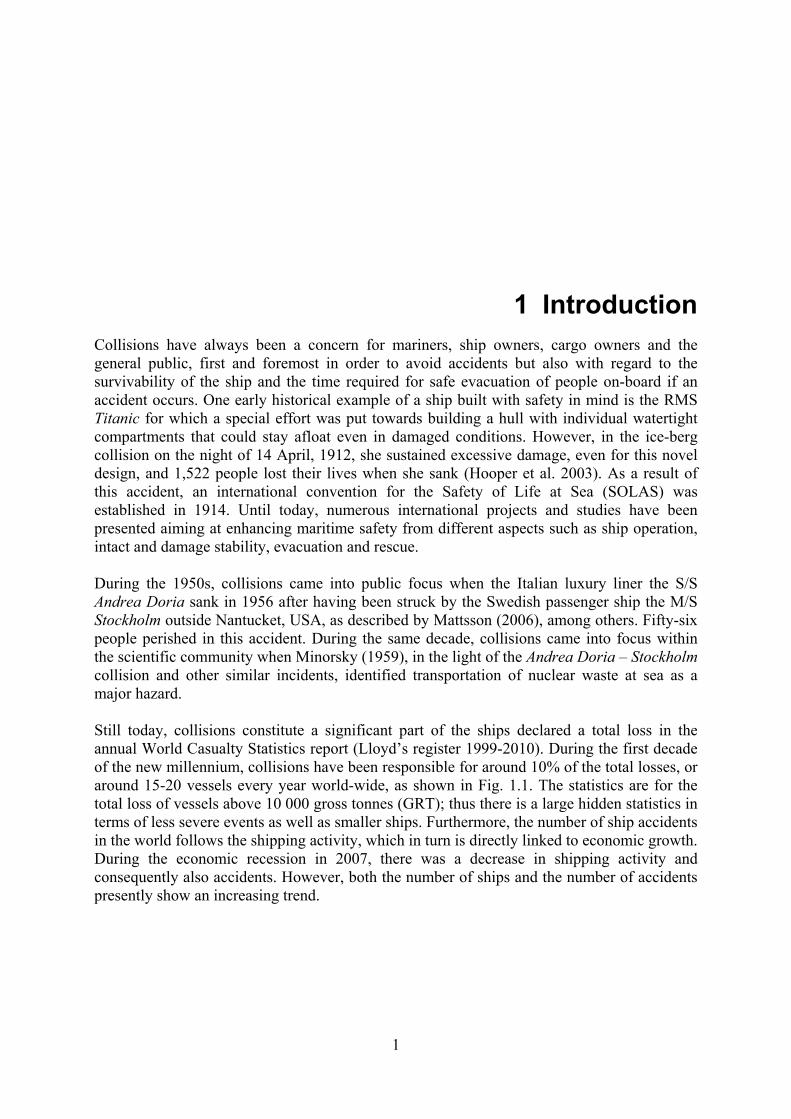
1 Introduction Collisions have always been a concern for mariners, ship owners, cargo owners and the general public, first and foremost in order to avoid accidents but also with regard to the survivability of the ship and the time required for safe evacuation of people on-board if an accident occurs. One early historical example of a ship built with safety in mind is the RMS Titanic for which a special effort was put towards building a hull with individual watertight compartments that could stay afloat even in damaged conditions. However, in the ice-berg collision on the night of 14 April, 1912, she sustained excessive damage, even for this novel design, and 1,522 people lost their lives when she sank (Hooper et al. 2003). As a result of this accident, an international convention for the Safety of Life at Sea (SOLAS) was established in 1914. Until today, numerous international projects and studies have been presented aiming at enhancing maritime safety from different aspects such as ship operation, intact and damage stability, evacuation and rescue. During the 1950s, collisions came into public focus when the Italian luxury liner the S/S Andrea Doria sank in 1956 after having been struck by the Swedish passenger ship the M/S Stockholm outside Nantucket, USA, as described by Mattsson (2006), among others. Fifty-six people perished in this accident. During the same decade, collisions came into focus within the scientific community when Minorsky (1959), in the light of the Andrea Doria – Stockholm collision and other similar incidents, identified transportation of nuclear waste at sea as a major hazard. Still today, collisions constitute a significant part of the ships declared a total loss in the annual World Casualty Statistics report (Lloyd’s register 1999-2010). During the first decade of the new millennium, collisions have been responsible for around 10% of the total losses, or around 15-20 vessels every year world-wide, as shown in Fig. 1.1. The statistics are for the total loss of vessels above 10 000 gross tonnes (GRT); thus there is a large hidden statistics in terms of less severe events as well as smaller ships. Furthermore, the number of ship accidents in the world follows the shipping activity, which in turn is directly linked to economic growth. During the economic recession in 2007, there was a decrease in shipping activity and consequently also accidents. However, both the number of ships and the number of accidents presently show an increasing trend.

2
Figure 1.1: Numbers of total losses of ships with GRT>10 000 tons between the years 1999-2010 (Lloyd’s register 1999-2010).
The consequences of a collision are diverse and depend on the ship type, e.g. oil spill for damaged tankers and progressive failure for bulk carriers when the ultimate limit strength (ULS) is exceeded. This thesis focuses on RoPax ships, a ship type that in a damaged condition, e.g. from a collision, is related to a high risk (loss of human lives) due to the large number of persons on-board. In addition, this ship type has large vehicle decks, the flooding of which give a rapid capsize. Historically this has been shown by e.g. the accidents with the M/S Herald of Free Enterprise in 1986 (Department of Transport 1987) and the M/S Estonia in 1994 (Källström et al. 2008). The collision research area is scientifically a challenging field because of its interaction and coupling between different scientific disciplines, e.g., hydrodynamics and structure mechanics. During a collision event, the former describes the large-scale motions of the ships involved, while the latter describes how energy is dissipated in the structures due to material deformation, fracture, etc. The impact mechanics in ship collision analysis methods and procedures is divided into two categories, which are often treated separately: external dynamics and internal mechanics. External dynamics mainly concerns the global rigid body motions of the colliding ships following the impact of the collision, taking into account the effects of the surrounding water (Pedersen and Zhang 1998 and Tabri et al. 2009a). Internal mechanics addresses the structures’ response caused by the collision, the damage caused to the structures and the energy dissipated by e.g. material deformation, rupture and friction work (Alsos et al. 2008 and Ehlers and Varsta 2009). A comprehensive overview of the scientific fields involved in collision research is given by Mansour and Liu (2008).
1.1 Motivation for study The development of knowledge and setting of rules has to a large extent been driven by investigations following from major accidents, e.g. the Stockholm agreement (IMO 1995) following the M/S Estonia accident in 1994 (Vassalos and Papanikolaou 2002). At present, however, the trend is towards a more proactive and holistic view. For example, methods have been stipulated by the International Maritime Organization (IMO) to treat damage stability with a more probabilistic approach, as amended by the Marine Safety Committee in 2005, MSC194(80). Prior to this, much effort was put into compiling damage statistics by Lützen

3
(2001) to provide a basis for probabilistic analyses, the elements of which were summarized by Guedes Soares et al. (2009a) in the HARDER project. Since 1990, when the International Ships and Offshore Structures Congress (ISSC) identified collision and grounding as a prioritized issue, four special committees have addressed the issue. In 2006, the ISSC committee V.I – Collision and Grounding outlined and suggested steps that should be present in a comprehensive collision risk analysis; see Fig. 1.2 from Pedersen et al. (1996).
Figure 1.2: Overview of steps in a comprehensive collision risk analysis, from Pedersen et al. (1996). Note that internal mechanics is denoted here as inner dynamics and external dynamics as outer mechanics.
According to the ISSC committee V.I (2006), the following issues should outline the principles of collision and grounding design standards (quoted from the reference):
A. How and why accidents occur: navigation, accident scenarios, probability of occurrence of certain types of accidents.
B. What happens (structurally) when a collision, grounding, stranding, or allusion occurs: structural mechanics in collisions and groundings.
C. What are the consequences of structural damage: property damages, environmental damages and loss of life.
D. How can each of the above be addressed: accident prevention, minimization of structural damage, mitigation of damage consequences, response to damage and loss of life.
Within each of these issues, many research efforts have been made, but work that connects them is scarce. Much focus is put on specific issues, e.g. the modelling of structure mechanics (B), but lacks the connection to the consequences of the structural damage (C). Concerning work on mitigation of damage consequences (D), there is usually a strong connection to structure analysis (B). However, the connection to the consequences (C) is missing. Therefore, work that specifically bridges the gaps between A to D, in particular linking to consequences of a collision (C) is called for. In addition, Pedersen (2010) presents issues similar to A to D to be addressed in future research efforts within the field of collision and

4
grounding research. Pedersen also suggests that methods to estimate the cost associated with the accident should be developed. Unfortunately, there are still no generally accepted collision and grounding design standards or principles based on design objectives that are universally accepted. To conclude, the above discussion motivates the work and ambition with the current thesis: to develop a computational methodology that connects the issues B to D. At the same time, it contributes to specific scientific advances within each of these issues.
1.2 Objectives of work The overall objective of the current thesis is to contribute to RoPax shipping’s further development of sustainable transport and maritime safety. In this context, sustainable transport is how RoPax shipping makes a positive contribution to transport safety in terms of protecting cargo, human lives as well as the environment. Concerning maritime safety, it is defined here as the understanding of under what conditions a ship damaged in a collision will survive without capsizing, and also what actions can be taken to enhance the ship’s chances to survive. The structural design of RoPax ships, having large open vehicle decks near the waterline, makes them vulnerable with respect to flooding and subsequent damage stability conditions in case of collision damage of the side. The time it takes for the damaged ship to capsize, Tcap, defines the time available for the crew to evacuate the ship. Therefore, in the current thesis, maritime safety and the survivability of a ship is defined by Tcap. The main objective can be further divided into the following minor and more specific objectives.
• Establish a comprehensive analysis methodology useful for ship collision simulation that can be used to calculate the expectancy of Tcap and its scatter if the uncertainties of the input parameters to the analysis procedure are known at the onset.
• Use the analysis methodology to compare, assess and propose approaches for numerical modelling in the calculation of structural damage within the established field of ship collision and grounding research.
• By means of results from experiments, compare and propose failure criteria useful for accurate and reliable numerical prediction of material deformation and rupture during ship collision/impact loading conditions. That is, to demonstrate and discuss how accurately the physics of material failure needs to be represented in a material failure model.
• Demonstrate the significance of accurate descriptions of damage opening shape and size in the estimation of Tcap in a damage stability simulation. Investigate what level of accuracy that is sufficient/needed in order to make a useful/reliable estimation of Tcap.
• Develop a methodology that considers the statistical scatter in material properties and how they affect the structural resistance against impact loading conditions. Study how these properties affect damage opening shape and size and thereby Tcap.
• Investigate and demonstrate how damage opening and shape of a struck ship is affected by the finite element model representation of the striking bow (rigid or deformable).
• Active actions following a collision: study how Tcap of a damaged ship is affected by course changes in various sea states, i.e. study if manoeuvring has an influence on Tcap.
• Passive action to enhanced maritime safety: assess innovative side-shell structures which can improve the crashworthiness of ships with respect to the damage stability and survivability of the struck ship.

5
1.3 Ship survivability analysis methodology In order to meet the objectives and estimate Tcap based on sea-state parameters, ship structural properties and collision scenario parameters, an analysis methodology is outlined. It incorporates structural collision resistance as well as ship flooding and stability in waves and the steps in the ship collision simulation procedure are shown in Fig. 1.3. The steps in it are de-coupled, i.e. carried out sequentially. It starts with a non-linear explicit finite element analysis (FEA) of the ship collision scenario under consideration, see Fig. 1.3(a), followed by dynamic damage stability simulations shown in Fig. 1.3(c). In the damage stability computation, the damage opening calculated in the FEA is represented by a grid of points that form the projected area of the damage opening, see Fig. 1.3(b). This representation of the damage opening is placed amidships in the damaged vessel in the stability simulations, as shown in Fig. 1.3(c). Thus, the dynamic stability, the flooding and ultimately Tcap are determined. Therefore, using this methodology, the influence of uncertainty factors in the FEA of the collision, Fig. 1.3(a), can be followed throughout the analyses and connected to the survivability of a struck ship.
Figure 1.3: Illustration of the collision analysis methodology. (a) FE simulation of the collision gives the shape and size of the damage opening. (b) The damage opening in (a) discretized with the vehicle deck (VD, dashed line) and still water line (WL, bold line) indicated. (c) The discretized damage opening (marked in red) is used in the damage stability computations; here, the damage opening has been placed amidships on a RoPax vessel, which is shown here in a sea-state with the damaged compartments flooded (flooded water indicated in blue). The consequences that variations in input parameters to the FEA have on the shape and size of the damage opening, and thereby Tcap, are studied thoroughly. Much of the focus in this thesis is on the modelling of the steel material in the FEA and on determining the level of detail of material physics that is relevant to take into account. This is studied through comparison between experimental and numerical analyses and described in Section 2. The analysis methodology and the steps in it are described in more detail in Section 3. In Section 4, variations and uncertainties in the modelling parameters are discussed and analysed using statistical methods. Sections 2-4 provide a basis for assessing innovative structures with respect to increased crashworthiness using FEA in Section 5. The appended papers are summarized in Section 6 where the connections between them are also illustrated. The conclusions that can be drawn from this thesis are presented in Section 7 and Section 8 gives suggestions for further work.

6
1.4 Focus and limitations The work resulting from the objectives spans over several different scientific disciplines. The aim is to achieve high scientific quality within each of these. Therefore, clear limitations are needed. The concept of risk comprises of both the probability that an event will occur as well as the potential consequences of this event. The current thesis focuses on the consequences of a collision between ships in terms of shape, size and location of the damage opening in the struck ship and their connection to Tcap. Moreover, the models used are based on a specific scenario of a collision between equally sized vessels. No statistical analyses in order to establish the most likely collision candidates or scenarios are undertaken, since the focus is on the analysis methodology, which can be applied to any collision scenario. Even though the elements of the analyses presented in this thesis are feasible for an analysis of any ship, the focus of the current thesis is on RoPax vessels. This type of vessel is of interest for two major reasons. First, RoPax vessels operate world-wide on short routes, often crossing busy shipping lanes, e.g. across the English Channel or the Strait of Öresund. Thus, they are exposed to a large probability of collision. Secondly, RoPax vessels have a large number of persons onboard in combination with vehicle decks that span the length and breadth of the ship. Flooding of this deck will quickly lead to loss of stability due to free surface effects. Thus, by addressing RoPax vessels, there is a great potential of saving human lives by mitigating the consequences in case of an accident. The current thesis emphasises internal mechanics simulations of ship-to-ship collisions, and how the uncertainty in material properties and other model parameters in these simulations affect the numerical computation of the survivability of the struck ship. External dynamics has been omitted even though a complete computational analysis methodology should incorporate it. This limitation, however, does not change the major conclusions from the work. Instead, it is recommended for further work, see Section 8. One of the objectives of the current work is to propose finite element modelling recommendations for the analysis of ship-to-ship collisions and the crashworthiness of ship side-shell structures. The constitutive material model and the understanding of the material’s characteristics are important in such analyses. Here, collisions at relatively low speeds (5-7 knots) are simulated, thus, strain rate effects have been disregarded in the analyses. Note, however, that locally in the finite element model, the strain rate during the impact may be high but this has a negligible effect in total on the global scale with respect to damage opening shape, size, energy dissipation in the structures, etc. The material data for the steel grade used in the structure analyses are obtained from experiments made on plates with the maximum sheet thickness 4 mm. The thickness of steel plating in full-scale ship structures can be significantly thicker, say between 4 and 100 mm depending on the steel grade (ABS 2009). The influence on material characteristics (ductility and ultimate strength) from possible plate thickness effects has not been included in the models.

7
2 Material characterization Metal forming processes, crashworthiness in the automotive industry and ship collisions and groundings are examples of areas, where numerical models play an important role in process development. To carry out numerical analyses of full scale ship collisions that give reliable and realistic results, good knowledge in material modelling is needed, in particular the modelling of relevant physical mechanisms in relation to material degradation and fracture. These models need input data from material testing, which is often carried out on significantly smaller specimens/structures than full-scale ship structures for which they are intended to be applied to. This discrepancy between the length scales has to be accounted for in simulation models in order to both realistically and accurately mimic the real material degradation and failure processes occurring during, in this thesis, a ship-to-ship collision event.
In the current work, a systematic approach is used to develop a material model giving reliable results for large scale ship collision calculations. This model needs to be able to capture both the energy absorbed by the structures and the fracture pattern resulting from the loading case in order to predict the shape and size of the damage opening. The systematic approach, illustrated in Fig. 2.1, combines and evaluates numerical and experimental results on different length scales for various specimens/structures.
Figure 2.1: Illustration of the combined numerical and experimental steps on different size (scale) levels to develop a methodology for realistic ship-to-ship collision simulations.

8
First, tensile tests were carried out and matched with FE analyses, using the Abaqus/Explicit software (Dassault Systèmes 2007), to investigate loading in a uniaxial stress state on a small scale. Secondly, the dependency of material behaviour on the multiaxial strain state was investigated by forming limit diagram (FLD) tests and FE analyses. The tensile and FLD tests are described in Paper A. The failure models were then further assessed with results from experiments on a more complex, small-scale ship-like structure. Finally, when having further calibrated the constitutive material and failure models, the step to full-scale FE analyses of ship collisions could be taken and shape and size of the damage opening in the struck ship determined, as described in Papers B to D. Definitions and clarification of terminology The terminology used to define a material’s characteristics, and how it can be represented by a numerical model, should always be clearly defined. Figure 2.2 is a schematic illustration of a stress-strain curve from a uniaxial tensile test of a ductile steel material. The figure is used here to define the terminology used in the summary part of this thesis. Since the commercial finite element software Abaqus/Explicit (Dassault Systèmes 2007) is used in all structure analyses, some of the definitions from this software are followed.
Figure 2.2: Material behaviour: definition of elastic region, plastic relation, point of damage initiation (DI), which is also the point of necking, followed by the region for damage evolution (DE) until fracture.
• Constitutive material model: In an FE model, data from experiments are needed to
represent and describe the material’s elastic-plastic behaviour by a material model. This model, the constitutive material model, is divided into an elastic and a plastic part. The elastic part is linear and is described by Hooke’s law up to the yield point, σy. The plastic part is often non-linear due to strain hardening effects. Hence, a power-law function may be used to model the material’s hardening characteristics, from the yield point, σy, and at least up to (and in an FE model sometimes beyond) the fracture point, εf.
• Fracture: The point on the stress-strain curve where the material reaches its ultimate strain capacity, the fracture strain, εf. In a displacement-controlled tensile test, e.g., the specimen is split into two parts, or, a crack in the specimen is clearly visible at this point.
• Damage initiation (DI): The part of the curve in Fig. 2.2 that starts at the yield stress is called pre-necking. It is defined until the point, where necking of the material occurs, εn;

9
necking is described in more detail in the following section. This point is also called damage initiation, DI, in Abaqus/Explicit.
• Damage evolution (DE): The part of the curve in Fig. 2.2 which starts at DI, or the necking point, is called post-necking. It is defined until the point, where fracture of the material occurs, εf. In Abaqus/Explicit, the material degradation process is described by a damage evolution law, where a damage variable, D, in every integration point of all finite elements is checked. When the tensile load in the current example continues to increase monotonically, the variable D goes from zero at the point of DI to unity at the point of fracture, εf. When the damage variable D reaches unity in any integration point of a finite element, this specific element is removed from the analysis. This is called the element removal/element erosion technique and means that the element remains physically in the model but its stiffness has been irreversibly put to zero; the element has failed.
• Material degradation: Taking the tensile test curve in Fig. 2.2 as the example, the material suffers from degradation due to the accumulation of damage as the tensile load is increased. Material degradation is a continuous process in the material’s interior which changes its resistance to, say, increased loading. It is complex to model this process in detail, and, depending on the purpose of the analysis, may not be relevant to model in detail. Note that the material degradation becomes significant especially in the latter part of the stress-stress curve, i.e. after the point of damage initiation, DI. It is therefore convenient to assume that the material degradation process can be represented by a model which is active from this point (DI) to the fracture point, εf. This approach is utilised in some of the analyses of the current thesis: a damage evolution (DE) law describes the material degradation process from the occurrence of damage at DI to full damage at the fracture strain, εf.
• Failure criterion: The criterion that defines when a finite element should be removed from the analysis is defined as the failure criterion. A finite element has failed, if the conditions for the failure criterion are fulfilled, and the element removal/element erosion technique follows in Abaqus/Explicit. Depending on the type of criterion that is used and how it is defined, the failure criterion can use either the DI point to define failure, or, the fracture strain, εf, defined in Fig. 2.2. Note that if a failure criterion uses the DI point to define failure, it is a simplification compared to the real case. However, in FE models of large-scale structures, this simplification may in some cases be acceptable. How to utilise failure criteria properly in analyses of ship collisions is one of the main objectives of this thesis.
• Failure model: Failure model in this thesis summary is used to define the combination of models that describe a material’s characteristics from unloaded condition to fracture, considering the elastic-plastic response and the material degradation process. Consequently, a failure model here is the constitutive material model used together with the failure criterion model. The latter is a model/criterion that defines failure at either the DI point, or, a model/criterion which first is inactive up to the DI point followed by a model/criterion that models the damage evolution (DE) up to the fracture strain, where failure is defined (i.e. models for DI and DE in Abaqus/Explicit).
In Papers A to E, there may be minor deviations with respect to the terminology described above. Note that it is only by name and not with respect to their fundamental physical definition. In each paper, however, the notations and definitions used are clearly defined. Hence, this terminology should be used when reading the papers individually.
10
General description of a material’s characteristics The stress-strain behaviour of a material is often determined from standard tensile tests, from unloaded to fractured state. Figure 2.2 illustrates the engineering stress-strain behaviour of the ductile material that is used throughout the work: the DNV classed ship building steel NVA (DNV 2007). Tensile tests of this material are described in Paper A. For the modelling of its elastic behaviour, a Young’s modulus, E, of 210 GPa and a Poisson’s ratio, ν, of 0.3 are used. Constitutive material behaviour from yielding, σy in Fig. 2.2, up to the point of necking, εn, is represented by a non-linear plastic isotropic hardening model that follows the power law relationship in Eq. (2.1):
ntruetrue K εσ ⋅= (2.1)
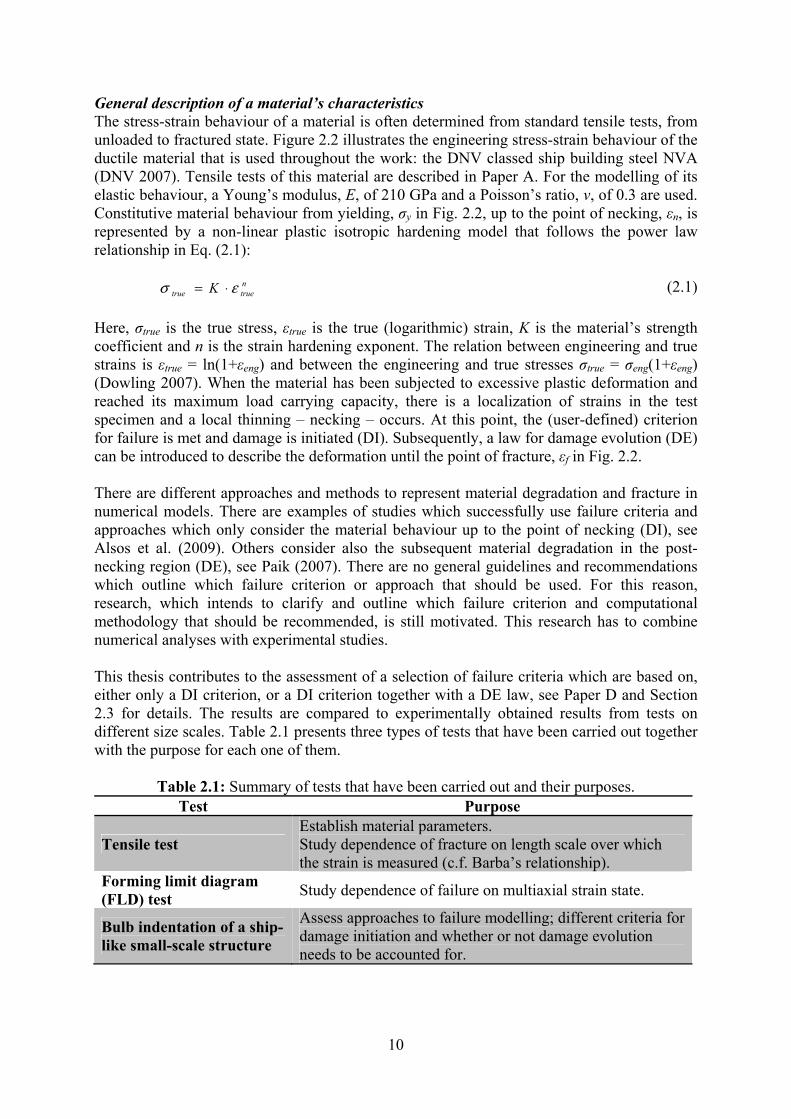
Here, σtrue is the true stress, εtrue is the true (logarithmic) strain, K is the material’s strength coefficient and n is the strain hardening exponent. The relation between engineering and true strains is εtrue = ln(1+εeng) and between the engineering and true stresses σtrue = σeng(1+εeng) (Dowling 2007). When the material has been subjected to excessive plastic deformation and reached its maximum load carrying capacity, there is a localization of strains in the test specimen and a local thinning – necking – occurs. At this point, the (user-defined) criterion for failure is met and damage is initiated (DI). Subsequently, a law for damage evolution (DE) can be introduced to describe the deformation until the point of fracture, εf in Fig. 2.2. There are different approaches and methods to represent material degradation and fracture in numerical models. There are examples of studies which successfully use failure criteria and approaches which only consider the material behaviour up to the point of necking (DI), see Alsos et al. (2009). Others consider also the subsequent material degradation in the post-necking region (DE), see Paik (2007). There are no general guidelines and recommendations which outline which failure criterion or approach that should be used. For this reason, research, which intends to clarify and outline which failure criterion and computational methodology that should be recommended, is still motivated. This research has to combine numerical analyses with experimental studies. This thesis contributes to the assessment of a selection of failure criteria which are based on, either only a DI criterion, or a DI criterion together with a DE law, see Paper D and Section 2.3 for details. The results are compared to experimentally obtained results from tests on different size scales. Table 2.1 presents three types of tests that have been carried out together with the purpose for each one of them.
Table 2.1: Summary of tests that have been carried out and their purposes. Test Purpose
Tensile test Establish material parameters. Study dependence of fracture on length scale over which the strain is measured (c.f. Barba’s relationship).
Forming limit diagram (FLD) test
Study dependence of failure on multiaxial strain state.
Bulb indentation of a ship-like small-scale structure
Assess approaches to failure modelling; different criteria for damage initiation and whether or not damage evolution needs to be accounted for.

11
The tensile and FLD tests are described in Section 2.1. On the basis of these tests, the material modelling is discussed in Section 2.2, and in Section 2.3, the verification of the material models in accordance with the approach outlined in Fig. 2.1 is described.
2.1 Experiments In this section, the tensile and FLD tests presented in Paper A are described. In these tests, the optical strain measuring system ARAMIS (GOM 2012) was used to make precise measurements of the displacements on the surface of the tested specimens. This system allows for accurate studies of local strains. The measuring system consists of two digital cameras connected to a computer with an image recognizing software matching the images from the cameras. The ARAMIS system divides the specimen surface into facets (pixels), the distortion of which is monitored in three-dimensional space throughout the test. The resulting facet displacement shows, for instance, regions of localized strains. A more detailed description of the ARAMIS system and the setup of the test is presented in Paper A. Tensile tests The data obtained from the ARAMIS recordings allow for measuring the strain over an arbitrary length on the tensile test rod. This is achieved by using two points that are positioned at an equal distance from the point of fracture, introduced as a virtual extensometer (VE). As a result, the Aramis strain, εAramis, can be determined for an arbitrary length of VE, which can be directly related to the element size in FE models. A long VE corresponds to a strain value measured over the entire length of the test rod (see the bold line in Fig. 2.3(a)) and a small value of the VE corresponds to more local strain behaviour (see the dashed lines in Fig. 2.3(a)). The ARAMIS measurements also allow for the actual smallest cross sectional area of the test specimen to be determined and thereby the experimentally measured true stress, here referred to as the Aramis stress, σAramis. The specimens used in the tensile tests were manufactured in accordance with DNV standards (2007), with a gauge length of 78 mm, specimen width and thickness 25 mm and 4 mm, respectively.
Figure 2.3: (a) Results from the tensile tests, where the stress is calculated based on the actual area of the test specimen, and the strain is measured in accordance with the length of the virtual extensometer (given in mm). (b) Presentation of the fracture strain as a function of the length of the virtual extensometer together with Barba’s relation fitted to the measured points. Necking is normally identified as the point in the engineering stress-strain diagram, where the stress reaches its maximum; see the vertical line in Fig. 2.3(a) for its corresponding Aramis
(a) (b)

12
strain value. Another definition, which is used here, is the point in the true stress-strain diagram where the different VE:s diverge, i.e. when the strains localize. Note that the two definitions of necking show good resemblance. Figure 2.3(b) shows the relation between the fracture strain, εf, and the length of the VE over which it is measured. The curve fitted to the fracture strains is a relation with one asymptote in the global fracture strain for the whole test rod and one asymptote, when the length of the virtual extensometer approaches zero. Such a relation was first suggested by Barba in 1880 and in this study, the formulation proposed by Yamada et al. (2005) is used. It expresses the fracture strain as:
⋅+=VE
f L
tWce nεε ln (2.2)
where e is the mathematical constant defined as the base of the natural logarithm, W is the original width of the specimen (25 mm), t is its original thickness (4 mm), εn is the necking strain (0.22), and LVE is the VE length over which the fracture strain is measured. The Barba parameter, c, is calibrated to obtain a curve that matches the results obtained from the experiments. This equation provides a relation between element size and fracture strain in the FE analysis. Based on experiments, Ehlers and Varsta (2009) arrive at a similar approach to represent the post-necking behaviour of steel. In Paper D, FE analyses were carried out to study the difference in taking the post-necking behaviour into account or not; see Section 4 for a discussion. Forming limit diagram (FLD) tests Forming limit diagram (FLD) tests are presented in Paper A. They were carried out to determine the dependence on multiaxial strain state of the fracture and necking of the material, a dependence that cannot be captured with uniaxial tensile tests. FLD:s are commonly used in metal forming to determine how much strain that can be applied to sheet metal in different strain states before local thinning – necking – occurs in the material. Within this field, many studies have been carried out in order to refine the methods and numerical models used and study aspects of material characteristics (see e.g. Chen et al. 2010, Kim et al. 2011 and Lin et al. 2010). The same theories are applicable to analyses of ship collisions and groundings even though studies within the metal forming industry are commonly made on thinner sheets than suitable for the use in ships. For example, Situ et al. (2011) carried out experiments very similar to those presented in Paper A, but on thin aluminium plates. One example that uses ship building steel is the giant bulge test presented by Törnqvist (2003), however, this was only for two different strain states. Thus, no tests for ship building steels with the level of accuracy as presented in Paper A have been found in the literature. The FLD tests described in Paper A were carried out in accordance with ISO 12004-2 (ISO 2007) on six different geometries, shown in Fig. 2.4(a), each representing a strain state of the material. Three samples of each geometry were tested. They were deformed out of their plane with a half-spherical indenter, while the strains on the surface were monitored using the ARAMIS system. Details on the experimental setup and evaluation are given in Paper A. Based on the results from the tests, the dependence of major and minor principal strain, ε1 and ε2, on necking and fracture of the material is determined, the results are shown in Fig 2.4(b). These results are used for the comparison to analytical models of multiaxial dependence of

13
material failure (see Section 2.2). The standard deviation of the results for the three samples and five evaluation sections for each sample is also indicated in the figure.
Figure 2.4: (a) The six test geometries: each of them corresponds to one strain state in the forming limit diagram. Geometry 1 is the circular plate (upper left) and geometry 6 is the narrowest of the geometries (lower right). (b) Results from forming limit diagram tests of the six geometries: mean values and standard deviations (denoted by the error bars) in the major and minor principal strain directions, for necking and fracture.
2.2 Failure modelling The results from the tensile and FLD tests presented in Section 2.1 enable the assessment of different approaches to modelling failure characteristics of the material, here called failure criteria, and to define a material degradation model. The failure criteria compared here divide the representation of material degradation to fracture into criteria for damage initiation (DI) and a criterion (law) for damage evolution (DE) which can be optional, (see Fig. 2.2 for an illustration). This allows for detailed modelling of each part of the material behaviour and studying these different parts separately. Damage initiation models Damage initiation (DI) in Abaqus/Explict software is defined at the necking point of the stress-strain curve, (see Section 2.1 and Fig. 2.2). This point is independent of the length scale over which the strain is measured in a tensile test, see Fig. 2.3(a), and thereby also the element size in an FE model. In the current work, three different criteria for DI are studied: the Shear, the FLD and the FLSD criteria. These criteria are available in Abaqus/Explicit (Dassault Systèmes 2007), which suggests the Shear criterion to be used to analyse and describe general material failure, while the FLD and FLSD criteria are intended for use in the analysis of (thin) sheet metals. The Shear criterion, sometimes referred to as the criterion of equivalent strain, is a phenomenological representation of the initiation of damage due to shear band localization. It is frequently used in simulations of ship collisions and groundings and has gained popularity due to its simple formulation. In its simplest form, the only input needed is the equivalent plastic strain at the onset of necking. This criterion has proven to give results with satisfying accuracy by, e.g., Karlsson et al. (2009) and Lehmann and Peschmann (2002). In Abaqus/Explicit, dependence on stress state and strain rate of the failure can also be taken into account; however, these were not used in the current work.
(b) (a)

14
The influence of strain state is often disregarded, when equivalent strain criteria similar to the Shear criterion are used. Therefore, these criteria have been challenged with failure criteria that take this behaviour into account. One example is the RTCL (Rice-Tracey, Cockroft-Latham) criterion proposed by Törnqvist (2003), which has proven to give reliable results by Ehlers et al. (2008). In addition to this, Alsos et al. (2008) proposed the BWH (Bressan-Williams-Hill) criterion. Unfortunately, it is not available in Abaqus/Explicit; however, it provides a convenient analytical expression that can be used to define input to the FLSD criterion in terms of principal stresses. It can also be expressed in principal strains and provide input to the FLD criterion. In addition, the BWH criterion expresses the major principal stress at the point of necking, or instability on the sheet material, in terms of constants obtained from the tensile test – K, n and εn – and the ratio between the principal strain rates, 12 / εεβ = .
( )( )
++
≤
++
+++
+
=
otherwise.)2/(1
3/2
3
2
0 if,1)1(3
2
1
5.01
3
2
2
1
21
2
1
ββ
ε
ββββ
ε
βββ
σn
c
n
c
K
K
(2.3)
Here, ε1c is the major principal strain where the minor principal strain is zero, i.e. where the BWH curve crosses the major principal strain axis in a forming limit diagram, c.f. Fig. 2.5. Alsos et al. (2008) argue that ε1c ≈ n. However, according to the values obtained from the FLD tests (see Fig. 2.4), this approximation slightly underestimates the results. Nevertheless, also in the current study, the ε1c parameter was set equal to the n parameter in order to minimize the number of material parameters involved in the material properties uncertainty analysis presented in Section 4. The strain-based FLD criterion is sensitive to the loading path of the deformation, which should be proportional. If, e.g., pre-strains have been induced in the material from the manufacturing rolling process, the loading path may deviate significantly from the straight one, see amongst others Stoughton and Zhu (2004) and Paper A. This will affect the results when modelling the sheet’s material characteristics. However, another formulation of the forming limit curve is possible which, instead of the principal strain space with the FLD criterion, is described in the principal stress space with the forming limit stress diagram criterion called FLSD. Stress-based criteria are insensitive to the loading path (Zhao et al. 1996). The principal stress space for forming limit diagrams was used also by Alsos et al. (2008) when proposing the stress-based BWH criterion which has similarities to the FLSD criterion. Additionally, an advantage of the BWH relation is that it is based on parameters that can all be obtained by simple tensile testing, in contrast to the FLD and FLSD criteria that require far more extensive, expensive and time-consuming testing; see Paper A for details. In order to illustrate the consequences of disregarding the multiaxial strain dependence on failure of the material, the Shear and FLD criteria are shown in principal strain space in Fig. 2.5. Assuming proportional strain paths and a constant volume of the material, an equivalent von Mises strain at the onset of necking of εn = 0.22, as used in the Shear criterion, can be expressed in principal strains as, see Paper C for the complete derivation:
( ) ( ) ( ) 22.0223
2 2
21
2
12
2
21 =++++− εεεεεε . (2.4)

15
Figure 2.5: The Shear and FLD failure criteria represented in the principal strain space along with the results from the FLD tests. The numbers indicate the tested geometry, c.f. Fig 2.4(a). Figure 2.5 presents an example of results from the FLD tests presented in Paper A. There is good agreement between the experimental results and the analytical BWH relation in Eq. (2.3). The two curves in Fig. 2.5 show that the largest differences between the Shear and FLD criteria occur where there are highly biaxial strain states. In these regions, both the FLD test results and the FLD input data curve allow for larger strains before damage is initiated. It can therefore be expected that in a finite element analysis that includes elements with high degree of biaxiality, these elements will fail (be removed from the analysis, stiffness of the elements is put to zero) earlier when the Shear criterion is used as compared to the FLD criterion. Since the BWH relation mimics tearing of the material, there is a gap between the curve representing the BWH relation and the ε1 = -ε2 curve in the negative ε2 regime. This is not in correspondence to the physics involved, since the material in such a case would fracture due to shearing, as described by Marciniak et al. (2002). Since Abaqus/Explicit numerically approximates the strain path from the last two values, elements which have a low ε2/ε1 ratio could mistakenly become excessively deformed because damage is never initiated. This was adjusted by adding an extra point on the ε1 = -ε2 limit. The Shear criterion is often used without a stiffness degradation model or damage evolution (DE) law, a method that was used successfully by Karlsson et al. (2009). This gives a very simple formulation of the criterion. If no damage evolution law is used, a suitable value for the fracture strain in relation to the element length in the model has to be determined in order for the criterion to give satisfying results. This is done through an iterative procedure that calibrates the fracture strain value. If, in a model without a law for damage evolution, the necking strain of the material is used as the critical strain, fracture would occur too early for most common steel grade materials. On the other hand, if a damage evolution law is used to represent the material’s characteristics after the point of necking more accurately, then the necking strain obtained from the tensile tests should be used as the equivalent plastic strain that defines damage initiation, marked with DI in Fig 2.2. If this is the case, additional material parameters are required in the damage evolution model to simulate the following failure process until fracture occurs (see the DE region in Fig. 2.2). This approach is used in the current study.

16
Damage evolution model The behaviour of the material after the point of necking (or DI) is referred to as the damage evolution (DE). Alsos et al. (2009) argue that this part should be neglected in the analysis, since the localized strains cannot be resolved using coarse shell elements, which are often used in FE models of full-scale ship structures. However, this part of the stress-strain diagram represents a significant part of energy in the deformation process (Paik 2007). In addition, using a damage evolution law makes the damage process gradual, as opposed to the instant failure obtained when a damage evolution law is disregarded. An instant failure causes large gradients in the FE model, which may result in undesirable and non-physical numerical effects. In Abaqus/Explicit, damage evolution is defined either through the displacement at fracture, uf, or the energy dissipated during the failure process, Gf. The former alternative was used in the current study. The displacement at fracture is defined as uf = L × εf , where L is the characteristic element length, and εf is the plastic strain at fracture taking into account the influence of the length scale or the element size. In the current work, this is accounted for with Barba’s relation (Eq. 2.2) through which the element length, L, is related to the fracture strain, εf ; see Paper A for details. The stress-strain curve from the tensile tests in Paper A is shown in Fig. 2.6(a) up to the point, where a macroscopic crack started to propagate in the test specimen. It is compared to results obtained by FE analyses using a model with linear damage evolution, which shows a deviation in stress-strain behaviour at the point of necking in comparison to the experimentally obtained results. It may also be noted that it cannot mimic the damage process and seems to underestimate the energy released during the damage process. This can be remedied if a damage variable, D, is allowed to evolve according to a bilinear relationship; see Paper A for details. When defining such a relationship, the D–uf relation has to be calibrated so that it results in the same amount of dissipated energy in order to reach zero stiffness at the same strain as the linear damage formulation, as can be seen in the illustration of the damage evolution in Fig. 2.6(b). Using the bilinear DE relationship, a calibrated value of the x-parameter, see Fig 2.6(b), to 0.2 resulted in excellent agreement with the experimentally obtained stress-strain curves, shown in Fig. 2.6(a). Thus, this bilinear DE relationship is used throughout the work.
Figure 2.6: (a) Simulated tensile tests using a linear and a piecewise linear law for damage evolution (DE). Note that the dashed line representing the experiments and the solid blue line representing the FE analyses using the bilinear damage evolution coincide. (b) Illustration of linear and piecewise linear DE relationships during the process of damage evolution.
(a) (b)

17
2.3 Verification of failure model with FEA of experimental structure Tensile tests In the failure of a tensile test specimen, two main mechanisms are present. A ductile failure, in which voids initiate, grow and coalesce in the material, is characterized by a distinct thinning of the specimen and a coarse fracture surface. On the other hand, a shear failure is due to the localization of shear bands followed by fracture in the direction of the maximum shear stress, i.e. inclined 45° relative to the loading direction. Generally, failure is due to a combination of these mechanisms, but the tensile tests on the NVA material show that the ductile failure is prevalent for this material. In order to make the detailed FE representation of the tensile tests in Paper A, the Ductile DI criterion in Abaqus/Explicit was used in a simplified form without compensating for the influence on multiaxial strain state. In this form, it is very similar to the Shear criterion as described above. In addition, the bilinear law for DE, as shown in Fig. 2.6(b), is used in the model. Figure 2.7 shows a comparison in results between a tensile test and the corresponding FE analysis using Abaqus/Explicit (for details on the modelling, see Paper A). Figure 2.7(a) shows the major principal strain on the specimen’s surface, which was calculated using the data recorded by the ARAMIS measurement system. The corresponding result for the FE analysis is shown in Fig. 2.7(b), in which the bilinear damage evolution relationship was used. The results are presented at the time, T, which is 95% of the total time to fracture, Tf. The results show very good agreement between the experiment and the FE analysis with respect to both magnitude of the major principal strain and the contours of its distribution.
Figure 2.7: Major principal strain results for a tensile test presented at T = 0.95Tf: (a) results from an experiment using the ARAMIS system and (b) results from an FE analysis using Abaqus/Explicit. Forming limit diagram (FLD) tests In the FE analyses of the FLD tests all six geometries in Fig. 2.4 were assessed. To define DI, which represented the necking in the experiments, the FLD criterion in Abaqus/Explicit was used with tabular values of ε1 and ε2 taken from the BWH curve presented in Fig. 2.5 as input. Degradation due to evolution of damage was represented in the FE model using the same bilinear damage evolution law as in the FE analysis of the tensile test, see Fig. 2.6(b). The experimental and numerical results presented in Fig. 2.8 show that the trends of both the necking and fracture are captured by the FE simulated values; however, some discrepancies are present. The points representing necking for the test geometries 2-6 are collected around the major principal strain axis, whereas the corresponding simulated points are more separated
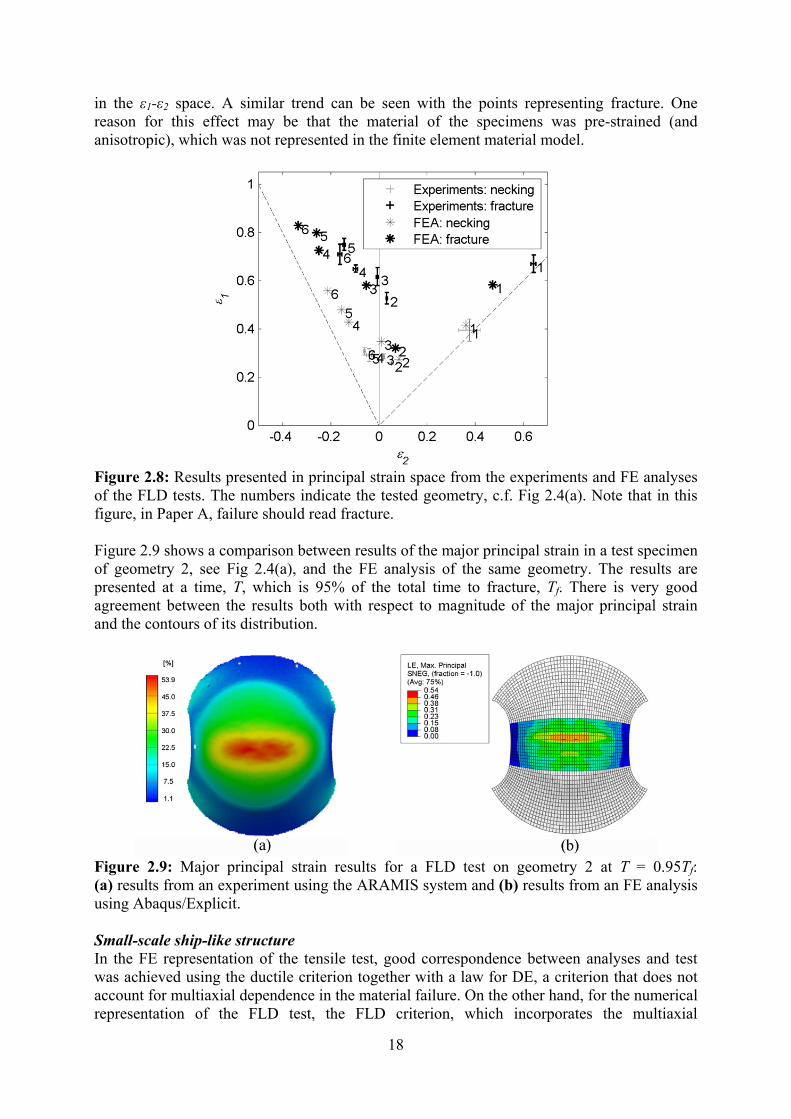
18
in the ε1-ε2 space. A similar trend can be seen with the points representing fracture. One reason for this effect may be that the material of the specimens was pre-strained (and anisotropic), which was not represented in the finite element material model.
Figure 2.8: Results presented in principal strain space from the experiments and FE analyses of the FLD tests. The numbers indicate the tested geometry, c.f. Fig 2.4(a). Note that in this figure, in Paper A, failure should read fracture. Figure 2.9 shows a comparison between results of the major principal strain in a test specimen of geometry 2, see Fig 2.4(a), and the FE analysis of the same geometry. The results are presented at a time, T, which is 95% of the total time to fracture, Tf. There is very good agreement between the results both with respect to magnitude of the major principal strain and the contours of its distribution.
Figure 2.9: Major principal strain results for a FLD test on geometry 2 at T = 0.95Tf: (a) results from an experiment using the ARAMIS system and (b) results from an FE analysis using Abaqus/Explicit. Small-scale ship-like structure In the FE representation of the tensile test, good correspondence between analyses and test was achieved using the ductile criterion together with a law for DE, a criterion that does not account for multiaxial dependence in the material failure. On the other hand, for the numerical representation of the FLD test, the FLD criterion, which incorporates the multiaxial

19
dependence of material failure, is used. Thus, these different criteria work as intended for these different loading situations and geometries despite their theoretical differences, illustrated in Fig. 2.5. Moreover, tensile and FLD tests are of significantly smaller size (scale) and less complex than the application for which the models are intended to be used: simulation of full-scale ship collisions. The assessment of the performance of these models should therefore be carried out on a structure having geometry, boundary conditions and loading conditions similar to their intended application of use. Throughout the current work, the experiment carried out by Karlsson et al. (2009) on a ship-like structure subjected to indenter loading conditions is used to compare the influence of material parameters and failure criterion representation in the numerical simulation of the structure’s characteristics. Figure 2.10(a) shows a photograph from the experiment and the corresponding numerical model is shown in Fig. 2.10 (b). It resembles a typical double-hull side-shell structure of a ship, but scaled to a third of the size of a similar full-scale ship structure. The test object consisted of one outer and one inner side-shell, web/stringer plates, web/stringer beams and stiffeners in the form of L-profiles. The global dimensions L× W× H of the structure are 1500 mm× 1090 mm× 300 mm and the sheet thickness was between 3 mm for the thinnest and 5 mm for the thickest structural elements. The structure is supported by a reinforcing frame in order to achieve controlled boundary conditions in the tests. This frame is incorporated in the FE model as well.
Figure 2.10: (a) Photograph of the side-shell structure in the test rig. (b) The FE model of the side-shell structure with the reinforcing frame. In Papers C to E, the ship-like structure was used to compare failure criteria in order to be able to make recommendations on which one to use in analyses on ship collision simulations. Thus, the DI criteria Shear, FLD and FLSD were compared, with and without a DE law. This results in six combinations, the results of which are shown in Fig. 2.11. In Fig. 2.11(a) and Fig. 2.11(b), the resultant vertical force in the indenter is presented versus its vertical displacement; the origin of the measurement of the displacement is on the upper surface of the upper sheet of the structure. Figure 2.11(c) and Fig. 2.11(d) present the energy absorbed through deformation and fracture of the structure versus the displacement of the indenter. Both the experimental and numerical results are truncated at the point, when the lower plate reaches full damage, which correspond to breach of watertight integrity in a damaged ship. The results show that all combinations of the failure criteria capture the trend of the experiments, however with a large span between the results. Failure criteria that are based on the multiaxial behaviour of the material (i.e. FLD and FLSD) result in an over-prediction of
(a) (b)

20
the forces, when a DE law is used and under-prediction, if the DE law is disregarded. The best correspondence to experimental results is achieved by using the Shear criterion together with the bilinear DE law. Thus, this is concluded to be the most accurate and appropriate approach to material modelling for application in large scale ship collision analyses.
Figure 2.11: Vertical force versus displacement of the indenter: experimental results from Karlsson et al. (2009) and FE analyses using three failure criteria and (a) disregarding the DE and (b) taking the DE into account. Energy absorbed by the structure versus indenter displacement for the same tests and FE analyses as presented in (c) disregarding the DE and (d) taking the DE into account.

21
3 Computational methodology This section gives a brief description of the computational methodology that has been developed and is presented in detail in Paper B. Section 3.1 presents the non-linear FEA of a typical collision between two ships in which the shape and size of the damage opening is calculated. This damage opening is thereafter used in the damage stability analyses, presented in Section 3.2, to calculate the time to capsize, Tcap, of the struck ship. Finally, in Section 3.3, observations made in the thesis work how the damage opening shape and size influence Tcap are discussed.
3.1 Finite element analysis of ship collisions In the event of a ship collision, the kinetic energy of the ships involved is redistributed into, e.g., damage of the structures in both ships (Alsos 2008, Ehlers 2009, Karlsson 2009), rigid body motions of the ships (Pedersen and Zhang 1998 and Tabri 2010), sloshing in partially filled ballast tanks (Tabri et al. 2009b and Zhang and Suzuki 2007) and elastic bending in the global ship beam (Pedersen and Li 2009). In a numerical analysis of a ship collision, simplifications are often made in order to have manageable models with regard to modelling effort and computational time in relation to representing the physics with sufficient accuracy. This thesis emphasises internal mechanics analysis of the ship collision event with the aim to accurately determine the shape and size of the damage opening, considering and analysing the influence from variations in the input parameters in such analyses (see Section 4 for details). Consequently, the computational methodology that has been developed does not involve external dynamics effects, tank sloshing and global hull beam bending Figure 3.1 shows an example of the FE model used in the ship-to-ship collision simulations using Abaqus/Explicit (Dassault Systèmes 2007) presented in this thesis; see Karlsson (2009) for a similar model. The collision scenario that has been simulated in Papers B to E is the collision between two similar-sized vessels; one RoPax ship being struck amidships by a small coastal tanker. The FE model consists of the parts of the ships that are deformed, i.e. a section of the side-shell of the struck RoPax ship and the bow section forward of to the collision bulkhead of the striking tanker. The size of the parts of the ships included in the FE model are sufficiently large, i.e. there is negligible influence on the analysis results from the boundary conditions put on the border lines.

22
Figure 3.1: Example of the ship collision model for a 90° collision case.
The RoPax ship has a double hull with stiffened side-shell, an outer weather deck, and an interior vehicle deck. The tanker bow section is modelled in detail with interior stiffening structures, decks and anchor box. The bow section shown in Fig. 3.1 is used in Papers D and E. For analyses carried out in Papers B and C, a similar bow section was used, however modelled without interior scantlings, thus only used as rigid. The striking bow section is restricted only to move in a prescribed direction. It is given an initial kinetic energy corresponding to a forward velocity of five or seven knots, while the side-shell structure of the struck RoPax vessel is held fixed in its circumference (i.e. zero speed). The velocity of the striking bow is decreased gradually during the collision event as energy is dissipated through deformations and fracture in the structures. The FE analysis is interrupted, when the striking ship has slowed down to zero knots. The FE model consists of four-node shell elements with reduced integration (S4R in Abaqus/Explicit) and five section points through the thickness. Generally, shell elements that are thick in relation to their side lengths give poor results in bending, because these types of elements have a plane stress formulation, thus they are unable to resolve stress gradients in their thickness direction. Hence, normal convergence analysis for explicit FE analysis was carried out. It resulted in an FE model with a 60 mm element size that gives a largest element length at thickness ratio, l/t = 3. Although this ratio is lower compared to what the recommended practice prescribes (l/t = 5), the proposed element length at thickness ratio was deemed sufficient for the current simulations (see Ehlers and Varsta 2009 for discussion). The material relation described in Section 2.2 with the elastic-plastic relation shown in Fig. 2.2 is used together with a criterion for damage initiation and a subsequent law for damage evolution. The failure strain of the material is adjusted to the element dimensions in the analyses in accordance with Barba’s relation, Eq. 2.2; see Section 2 for details of material representation and failure criteria analyses.

23
The general contact conditions criterion available in Abaqus/Explicit is used to define the contact conditions in the FE analysis together with a coefficient of friction of 0.1 or 0.3; see Paper D for a discussion. This contact criterion enforces contact constraints using a penalty contact method, which searches for node-into-face and edge-into-edge penetrations in the current configuration; hence, master and slave nodes/surfaces are employed to define contact conditions.
3.2 Dynamic damage stability analyses The damage opening obtained from an FE analysis is represented by a grid of points, shown in Fig. 3.2(a), corresponding to its projected area. The ship used in the dynamic damage stability analysis is a RoPax vessel of 176 m length overall; see Paper B for a detailed description. The SOLAS two compartment damage (IMO 2007) that the ship is designed to withstand in calm waters is selected for analysis; the static equilibrium list is approximately 3 degrees (see Paper B). The damage opening is therefore put amidships of the struck vessel, see Fig. 3.2(b); this is a collision scenario that corresponds to the SOLAS two compartment damage. This damage leads to flooding of four compartments: one void space as wide as the ship, a starboard heel tank aft of the void space, a machinery space inside the heel tank and the vehicle deck above the other compartments spanning the entire length and breadth of the ship. In waves, the vehicle deck will be flooded and the free surface effect from this is the dominating factor leading to loss of stability and capsizing of the vessel.
Figure 3.2: (a) Representation of the damage opening by a grid of points. The waterline (WL) and vehicle deck (VD) are indicated. (b) An example of results from SIMCAP simulations, the discretized damage opening (marked in red) is put amidships of the struck vessel and the flooded water is shown (flooded water indicated in blue). To study the aftermath of a collision and damage stability of a damaged ship, methods with varying levels of complexity have been reviewed by Papanikolaou (2007). In the current thesis, the dynamic damage stability analyses are carried out using the SIMCAP code developed by Schreuder (2005). It uses non-linear strip theory to calculate the incident wave forces (the Froude Krylow forces) through integration of dynamic wave pressure over the momentarily wetted hull surface at each time step. The weight and inertial forces from water that has flooded into the damaged compartments are also calculated in each time step. The surface of the flooded water inside a damaged compartment is assumed to be horizontal, and sloshing is not accounted for. A dead ship condition is assumed, i.e. no forward speed of the vessel and no outflow of water from damaged compartments, except through the damage opening, is modelled. It has been observed by simulations in Paper B that a volume of 1500 m3 of water on the vehicle deck leads to capsize of the ship within a few wave encounters.
(a) (b)

24
A time period of 30 minutes is simulated because this marks a limit for the least amount of time required for safe evacuation of the type of ship studied here (IMO 2007). If no capsize occurs within this time, the ship is deemed to have survived the collision. The significant wave heights, Hs, investigated were between 3 and 7 meters. For Hs = 3 m and below, the ship survives regardless of the damage cases investigated in the current study, and Hs above 7 m are rarely present in the Baltic area, where the ship is designed to operate. Observations presented by Hogben et al. (1986) show that less than one in a thousand wave observations in the Baltic Sea exceeds 7 m. The Jonswap spectrum was used to model the sea-state with eight different wave seeds, i.e. phase shifts between the wave components; see Paper B for details. These eight wave seeds were the same for all significant wave heights and represent the natural variation of the sea-state. Thus, for each damage opening, 40 stability simulations are carried out. Figure 3.3 presents an example of results from Paper B as the time to capsize, Tcap, for one damage opening considering the natural variation in sea-states (wave seeds) and the significant wave height. Every set of simulations in the eight different wave seeds gives variation in the results in terms of time to capsize, Tcap. Jasinowski et al. (2003) discuss the concept of capsize band, which can also be seen in Fig. 3.3; among the various wave seeds, all simulations have a Tcap below to a certain time, representing a safe region, and a Tcap above a certain time, the unsafe region. In between these safe and unsafe regions is an uncertainty band, where the ship may or may not capsize, depending on the variation in sea-state.
Figure 3.3: Results that show the times to capsize for significant wave heights, Hs, between 3-7 m with eight sea-state representations for each form a capsize band. In Papers C and D, extensive parameter analyses of the influence of damage opening shape and size, due to, amongst others, material properties and model uncertainties, at the time to capsize are presented. In Paper B, results from damage stability simulations are presented for different heading angles of the damaged ship relative to the wave direction and various damage openings. By means of these results, recommendations for an active action that can be taken to enhance the survivability of the damaged ship are discussed. The results show that the worst heading is beam seas onto the damage opening and quartering seas on the side opposite the damage. Since beam seas thus represent a worst-case scenario, this is used in the simulations carried out in Papers C and D. The safest heading is with the waves on the bow onto the damage opening, thus, a course change to this heading can be suggested as an active action to increase the damaged ship’s chances to survive for a longer period of time.

25
3.3 Observations of damage opening shape representation and Tcap Paper D presents a parameter study on modelling aspects, the results of which are followed through the chain of computations in the methodology. This is described in more detail in Section 4. However, the outcome of this parameter study is 60 different damage openings with corresponding capsize bands, presented in Appendix III and IV of Paper D. Based on these results, the consequences of the shape and size of the damage opening on the time to capsize can be analysed. The damage from the bulb in the lower part of the hull is not critical, but gives the ship an initial list that lowers the threshold for waves to flood the vehicle deck. In the cases when only the lower part of the hull is breached, the ship survives except for one or two sea-state representations. However, the shape of the damage opening at the level of the vehicle deck and just above it has a major influence on the results, since the horizontal extent of the damage in this region governs the flood rate into the vehicle deck. When the damage opening leading into the vehicle deck is situated high, the ship is more likely to survive the damage, since few waves reach high enough on the hull to flood the vehicle deck. The most severe case is when the damage opening leading into the vehicle deck extends almost to the level of the vehicle deck; in this case the flooded water cannot flow out of the opening making water accumulate faster, which reduces Tcap. In addition, it is found that small damage openings result in larger scatter and wider capsize bands. These critical elements of the shape of the damage opening have to be borne in mind when establishing a simplified model of the damage opening to be used in dynamic damage stability simulations. The representation of damage opening used in the dynamic damage stability simulations in this thesis is very detailed in relation to other models that have been suggested in the literature. Often more simplified models for the damage opening are used, from box models that only give an extent in three dimensions of the damage (IMO 2007), suitable e.g. for Monte Carlo simulations, to representing the damage opening with two square shapes – one for the bulb and one for the stem (Guedes Soares et al. 2009a), to models that attempt to capture the shape of the striking ship through prism-shaped damage openings (Zhang 1999). Using these simplified models, the level of detail to which the physics of the dynamic damage stability of the struck ship that is achieved using the grid of points shown in Fig 3.2(a) would not be achieved. Representing the damage opening with the level of detail that is done in the current thesis, more detailed conclusions can be drawn, than if one of these simplified models were used. Thus, it can be concluded that simplified models are unable to predict the survivability of a damaged ship with the same level of accuracy.

26

27
4 Uncertainty and reliability analysis Using the computational methodology outlined in Section 3, the survivability of a ship damaged in a collision can be determined based on the shape and size of the damage opening in its side-shell. In Section 3.2, the expectancy of the survivability of the ship, Tcap, and its scatter due to the natural variation in the sea-state and its representation is discussed. In Paper B, details related to uncertainties in parameters involved in the dynamic damage stability simulations using SIMCAP are presented. In the current section, emphasis is on uncertainties that have an influence on the results from explicit non-linear internal mechanics FE analyses of a ship collision scenario. Section 4.1 presents the sources of uncertainties that have been considered in the appended Papers C and D, Section 4.2 presents an analysis of response variables, followed by a variance analysis, see Section 4.3.
4.1 Sources of uncertainties There is a large variety of uncertainties involved in a numerical analysis of a ship-to-ship collision scenario. It is of course impossible to consider all of them and limitations have to be made. In the following, some of the limitations and assumptions made are mentioned for clarification; see Section 1.4 for other limitations. External dynamics analyses are not part of the current computational methodology, hence, uncertainties related to those are not considered. This restraint is of course a source of uncertainty in relation to the real event, but this thesis focuses on the internal mechanics analyses; therefore the influence of this restraint has not been quantified. Moreover, the influence on the damage shape and size in the struck ship due to relative size difference (both dead weight and dimensions) between the striking and struck ships has not been analysed. The influence of the bow section geometry of the striking ship is only touched upon in Hogström and Ringsberg (2011). Finally, the studies presented in the appended papers do not include analyses of which collision scenario that has the highest probability. Instead, the purpose is to estimate influence that variations in input parameters have on the damage opening and Tcap in the computational methodology presented in Section 3. In Papers C and D, uncertainties inherent in the quality of steel and the related scatter in the material properties are addressed as material properties uncertainty. Model uncertainty is uncertainties introduced by the modelling of the material, the FE model of the striking vessel and several of the parameters concerning the overall modelling of the collision scenario. Tables 4.1 and 4.2 from Paper D present two sets of factors in the FE analyses of ship collisions along with the levels that are studied. Set I focuses on material properties and uncertainties related to material modelling, similar to the study carried out on a small-scale structure, presented in Section 2.3, and set II focuses on parameters of the collision scenario, like the collision angle and speed of the striking ship. The model representation of the striking

28
bow section as either rigid, or deformable, is incorporated in both simulation sets. The following paragraphs discuss some of these factors in more detail.
Table 4.1: Factors studied in the ship collision simulations set I, from Paper D. Factors Value/model/criterionMaterial parameters -2σ / μ / +2σ Damage initiation Shear / FLD / FLSD Damage evolution Yes / No Bow section Rigid / Deformable
Table 4.2: Factors studied in the ship collision simulations set II, from Paper D. Factors Value/model/criterionCollision angle 45° / 60° / 90° Friction coefficient 0.1 / 0.3 Speed 5 knots / 7 knots Bow section Rigid / Deformable
Material properties uncertainties In terms of determining the material properties through testing, the tests are often carried out on samples taken from the same material batch. This is the case of, e.g., the tensile tests described in Paper A, where all test specimens are taken from the same plate. However, material specifications give requirements for material properties with minimum values or intervals, which allow for scatter in properties within a material class. In order to obtain an indication of the consequences of this scatter on the ship collision analyses outlined in Section 3 and presented in detail in Papers B to D, a collection of tensile test curves from different material batches, presented in Fig. 4.1(a), was studied. These tests were carried out on the Domex 240 YP material, a mild steel material similar to the NVA material.
Figure 4.1: (a) Engineering strain and stress relations from different batches of the Domex 240 YP mild steel. Note that the strains and stresses have been normalised with the maximum failure strain and maximum ultimate stress. (Courtesy of SSAB). (b) Test results from tensile tests on NVA steel from Paper A. The variance obtained from the Domex 240 YP applied to the NVA steel and the resulting three material curves are shown; see the text for details. From the curves in Fig. 4.1(a), the engineering stress values of the yield stress, σy, and ultimate stress, σu, as well as the engineering strain values of the necking strain, εn, and fracture strain, εf, were determined. Through a curve fit of the exponential plastic relation in Eq. (2.1), the coefficient, K, and the exponent, n, could be determined. These were used in the
(a) (b)
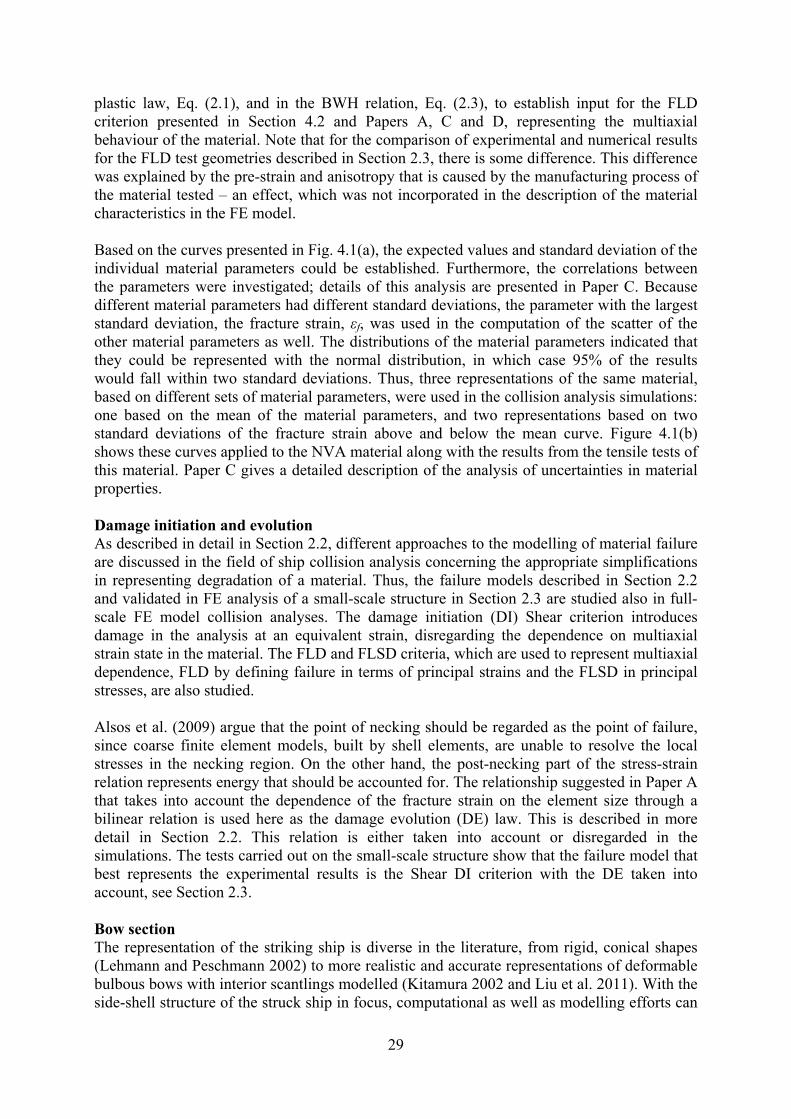
29
plastic law, Eq. (2.1), and in the BWH relation, Eq. (2.3), to establish input for the FLD criterion presented in Section 4.2 and Papers A, C and D, representing the multiaxial behaviour of the material. Note that for the comparison of experimental and numerical results for the FLD test geometries described in Section 2.3, there is some difference. This difference was explained by the pre-strain and anisotropy that is caused by the manufacturing process of the material tested – an effect, which was not incorporated in the description of the material characteristics in the FE model. Based on the curves presented in Fig. 4.1(a), the expected values and standard deviation of the individual material parameters could be established. Furthermore, the correlations between the parameters were investigated; details of this analysis are presented in Paper C. Because different material parameters had different standard deviations, the parameter with the largest standard deviation, the fracture strain, εf, was used in the computation of the scatter of the other material parameters as well. The distributions of the material parameters indicated that they could be represented with the normal distribution, in which case 95% of the results would fall within two standard deviations. Thus, three representations of the same material, based on different sets of material parameters, were used in the collision analysis simulations: one based on the mean of the material parameters, and two representations based on two standard deviations of the fracture strain above and below the mean curve. Figure 4.1(b) shows these curves applied to the NVA material along with the results from the tensile tests of this material. Paper C gives a detailed description of the analysis of uncertainties in material properties. Damage initiation and evolution As described in detail in Section 2.2, different approaches to the modelling of material failure are discussed in the field of ship collision analysis concerning the appropriate simplifications in representing degradation of a material. Thus, the failure models described in Section 2.2 and validated in FE analysis of a small-scale structure in Section 2.3 are studied also in full- scale FE model collision analyses. The damage initiation (DI) Shear criterion introduces damage in the analysis at an equivalent strain, disregarding the dependence on multiaxial strain state in the material. The FLD and FLSD criteria, which are used to represent multiaxial dependence, FLD by defining failure in terms of principal strains and the FLSD in principal stresses, are also studied. Alsos et al. (2009) argue that the point of necking should be regarded as the point of failure, since coarse finite element models, built by shell elements, are unable to resolve the local stresses in the necking region. On the other hand, the post-necking part of the stress-strain relation represents energy that should be accounted for. The relationship suggested in Paper A that takes into account the dependence of the fracture strain on the element size through a bilinear relation is used here as the damage evolution (DE) law. This is described in more detail in Section 2.2. This relation is either taken into account or disregarded in the simulations. The tests carried out on the small-scale structure show that the failure model that best represents the experimental results is the Shear DI criterion with the DE taken into account, see Section 2.3. Bow section The representation of the striking ship is diverse in the literature, from rigid, conical shapes (Lehmann and Peschmann 2002) to more realistic and accurate representations of deformable bulbous bows with interior scantlings modelled (Kitamura 2002 and Liu et al. 2011). With the side-shell structure of the struck ship in focus, computational as well as modelling efforts can

30
be saved by modelling the striking bow as rigid. This is, however, a crude assumption that is only applicable in comparative studies. Deformations and fracture in the bow section take up a significant part of the kinetic energy during the collision, and as a result, affect the shape and size of the damage opening and consequently the time to capsize. To quantify this effect, a bow section with its interior scantlings, weather deck, inner deck, frames, bulkheads and anchor box, were modelled accurately in the large-scale FE model, both as rigid and deformable. The bow section used in Paper D, which is from a small coastal tanker, is shown in Fig. 4.2, both the outer shell as well as the interior scantlings. When used as deformable, the same mesh density and material model as in the side-shell of the struck ship is used; see Paper D for additional modelling details.
Figure 4.2: The geometry of the bow section used in the simulations, (a) the outer shell (b) the inner structures. Collision angle In a simulation of ship collisions, an angle of 90° between the striking and struck ships is commonly used; see e.g. Karlsson (2009) and Paik (2007). This assumption is conservative with respect to a maximum obtained penetration depth, i.e. it is believed to cause the largest structural damage of inner side-shell, see Yamada and Endo (2008) and Zheng et al. (2007). In the current study, the damage opening area is in focus, which is important with respect to damage stability for a struck RoPax ship. The influence of the collision angle is therefore investigated by simulating collisions with angles 90°, 60° and 45°. Brown (2002) states that a critical angle for a glancing collision is around 25°. However, with the models used in the current work, it was found that for angles below 45°, the boundary effects of the deformable bow model could no longer be neglected. Brown (2002) provides a normal distribution for collision angles based on real collisions with μ = 90° and σ = 29°. Using these values, 94% of all collision cases would fall between 45° and 90°. Friction coefficient A dynamic friction coefficient commonly used in analyses of ship collision simulations is 0.3, but values as high as 0.6 have been used Paik (2007). Zheng et al. (2007) studied the effect of friction coefficients between 0 and 0.7 for collision of tanker vessels. Engineering handbooks give a friction coefficient of 0.57 for non-lubricated mild steel against mild steel and 0.09-0.19 for lubricated surfaces. In real collisions, the steel surfaces are wet and below the waterline of the ships as well as in the ballast tanks, there is bio-fouling that works as lubrication. On the other hand, the steel plates used on ships generally have a rather rough surface. Thus, the real scatter in friction
(a) (b)

31
coefficients for ship collision events is likely to be at the range of 0.1 to 0.6. In the current study, two values of the friction coefficient, 0.1 and 0.3, are used for comparison; see Karlsson et al. (2009) for results from experimental measurements. Ship speed Based on a statistical model from Lützen (2001), the striking tanker used in the current study would have a service speed of around 15 knots. However, the speed of the striking ship should at the instance of the collision be lower than its service speed, due to actions taken prior to the collision. Based on collision statistics, Brown (2002) gives a Weibull distribution
for striking ship speeds with the mean 17.4=speedμ knots and standard deviation 78.1=Speedσ
knots. Here, the speeds of five and seven knots were chosen since seven knots represents approximately double the kinetic energy in relation to five knots.
4.2 Response variables The influence the uncertainty parameters presented in Section 4.1 have on the response variables in the computational methodology described in Section 3, the shape and size of the damage opening and Tcap, is quantified in Paper D. The approach was to analyse the shape and size of the damage opening as presented in the Appendices III and IV of Paper D, which is discussed in Section 3.3. However, in order to allow for a statistical analysis, the results need to be represented by a comparative number. For the damage opening, this is represented by its area. However, each capsize band in the figures presented in Appendices III and IV of Paper D needs to be substituted into a number. For every significant wave height, here from 1 to 7 meters, Tcap is weighted with the probability that this wave height will occur. According to DNV’s recommended practice (DNV 2010), the distribution of significant wave heights in a region can be represented by a Weibull distribution. In the Baltic region, where the studied ship is designed to operate, the
mean significant wave height is SHμ = 2.50 m and the standard deviation is
SHσ = 1.75 m.
The weighting factors for each Hs are then determined by the Weibull distribution, depicted in Fig. 4.3, integrated between the wave heights, h. The sum of Tcap results over wave seeds, w, for each Hs are multiplied by this integrated weighting factor in Eq. (4.1). The sums over the wave seeds are in turn summarized over the significant wave heights and the resulting value is normalized, see the denominator in Eq. (4.1) so that the result will be 30 minutes, if no capsize occurs. Using this method, each damage opening area can be related to a comparative weighted
capT̂ that is used in the statistical analyses presented in the following section. Note
that P(Hs > 7 m) = 0.02, which is different from the measurements presented by Hogben et al. (1986). However, it can be assumed that Hs > 7 m occurs so rarely that it is reasonable to neglect.
( )
( )
= −
= =−
=7
1 1
7
1
8
1
factorweight
1
8
),(
ˆ
h
h
h
H
h wcap
h
h
H
cap
dhhf
hwTdhhf
T
S
S
(4.1)

32
Figure 4.3: Weibull distribution for Hs in the Baltic region with the weighting factors that are the integrated values between the Hs:s analysed. The results in terms of areas of the damage openings and
capT̂ for simulation set I are
summarized in Fig. 4.4 (see Appendix III and IV in Paper D for the overall results). Figure 4.4(a), shows the damage opening areas from simulation set I and it confirms the results from the reference structure in Section 2.3: when using the Shear criterion, the material is damaged earlier, giving a larger damage opening area, in contrast to utilising the FLD or FLSD criteria. Between FLD and FLSD, the FLSD criterion gives slightly larger damage openings than the FLD criterion. This applies both to using and not using a law for DE. Using a deformable bow section gives significantly smaller damage openings than if a rigid bow section is used. In most cases, the deformable bow section only gives damage from the bulb since it is strong enough to withstand the collision, whereas the stem of the striking ship buckles and deforms plastically, giving no breach in the outer shell of either the struck or the striking ship. The uncertainty in material properties has an impact, but it becomes less significant when using a deformable bow section and only the bulb penetrates the struck ship. The results in Fig. 4.5(a) for simulation set II show the same trends in using a rigid or deformable bow: the deformable bow giving smaller damage openings. Between the different ship speeds, five and seven knots, the kinetic energy is doubled, which gives roughly double the size of the damage opening. However, between the different collision angles, the results are more ambiguous; a collision angle of 90° gives the largest damage openings in most cases, but not all. In the same way, 45° gives the smallest damage opening in most cases, but not all. Concerning the friction coefficient, there is a slight difference between the results, but the effects of other factors are larger. The results for the weighted time to capsize,
capT̂ , presented in Fig. 4.4(b) and Fig. 4.5(b) show
a clear trend when compared to the results for damage openings presented in Fig. 4.4(a) and Fig. 4.5(a): a larger damage opening gives shorter Tcap. The trends discussed in Section 3.3 are also seen in these figures. For example, using a rigid bow section in the FE analysis results in larger damage openings, thus implying shorter times to capsize. The results presented in Figs 4.4 and 4.5 are further analyzed and discussed through analysis of variance in Section 4.3.

33
Figure 4.4: Results for simulation set I, including the uncertainties in material properties (μ ± 2σ), the damage initiation criterion (Shear, FLD and FLSD), whether or not a law for damage evolution (DE) is used (y = yes and n = no) as well as the issue of using a rigid or deformable bow section of the striking ship, for (a) damage opening sizes (m2) (b) the weighted
capT̂
(minutes).
Figure 4.5: Results for simulation set II, c.f. Appendix IV, including the uncertainties in collision angle (45°, 60° and 90°), the friction coefficient used (0.1 or 0.3), the collision speed (5 or 7 knots) and whether the bow section of the striking ship is modelled as rigid or deformable for (a) damage opening sizes (m2) (b) the weighted
capT̂ (minutes).
4.3 Variance analysis In order to study which of the uncertainty factors that have a statistically significant impact on the outcome of the analyses, the approach of analysis of variance (ANOVA), described in Box et al. (2005), is used. The difference between the value of a response variable and the overall mean is decomposed into an additive model made up by the differences of the mean value of each factor and the overall mean value, and a residual term as presented in Eqs (4.2) and (4.3). The residual term includes the noise of the response variables as well as the lack of fit to the model. In this case, the area of the damage opening and the weighted
capT̂ for each
simulation are used as response variables; they are affected by the factors studied in the simulation sets I and II, see Tables 4.1 and 4.2. One ANOVA is carried out for each of the simulation sets I and II.
(b) (a)
(b) (a)

34
( ) ( ) ( ) ( ) ( )
ResidualspropertiesMaterial
initiationDamage
evolutionDamagestructure Bow
3yyyyyyyyyyyyyyyy miebmieb +−−−−+−+−+−+−=− (4.2)
( ) ( ) ( ) ( ) ( )
ResidualsAngleSpeed
tcoefficienFrictionstructure Bow
3yyyyyyyyyyyyyyyy asfbasfb +−−−−+−+−+−+−=− (4.3)
The results from the ANOVA analyses are shown graphically in Figs 4.6 and 4.7. In these figures, the residuals are shown together with the variance – or deviation from the overall mean – of each factor; the yy − term in Eqs (4.2) and (4.3). Thus, the overall mean of all analyses is in the zero in each figure and the variations of the factors are represented by their deviations from the overall average. The variance of the factors is scaled by the square root of the degrees of freedom (DOF) of the residuals divided by the DOF of the factor:
factorresiduals DOFDOF in order to make an adequate comparison to the residuals. The DOF of a
factor is the number of levels the factor can take minus one; e.g., the DOF of the material parameters is two since it can assume three values: -2σ, μ and +2σ; see Box et al. (2005) for details. Factors that have a variance that exceeds that of the residuals have a statistically significant impact on the results. Those factors that have a variance that does not exceed the residuals have no influence on the outcome of the analysis. Figure 4.6 shows that all factors in simulation set I have a statistically significant impact on the results; and the largest impact on the results is whether the bow section used in the analyses is rigid or deformable. The other factors that concern the modelling of material characteristics have a comparable impact on the results. The exception is for the DE in the weighted
capT̂ that has a smaller correlation than the other factors, although still distinguishable
from the residuals.
Figure 4.6: Graphical ANOVA for the response variables in simulation set I: (a) damage opening area (m2) and (b) the weighted
capT̂ (minutes).
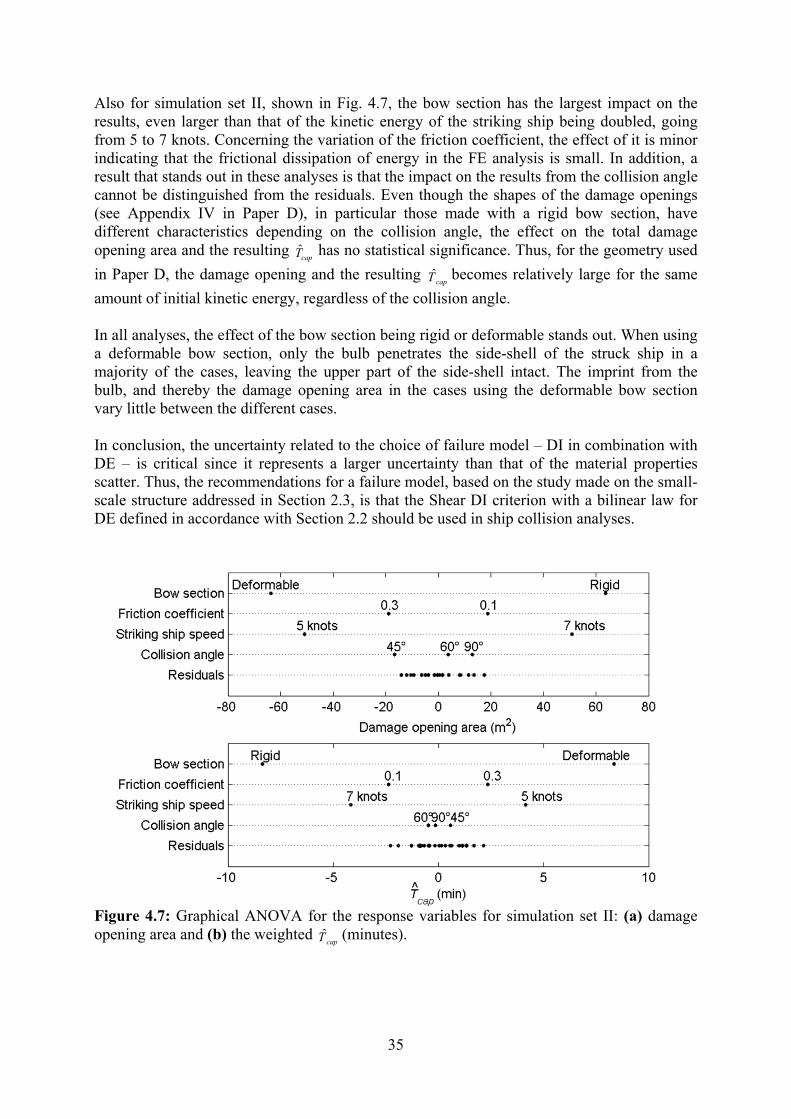
35
Also for simulation set II, shown in Fig. 4.7, the bow section has the largest impact on the results, even larger than that of the kinetic energy of the striking ship being doubled, going from 5 to 7 knots. Concerning the variation of the friction coefficient, the effect of it is minor indicating that the frictional dissipation of energy in the FE analysis is small. In addition, a result that stands out in these analyses is that the impact on the results from the collision angle cannot be distinguished from the residuals. Even though the shapes of the damage openings (see Appendix IV in Paper D), in particular those made with a rigid bow section, have different characteristics depending on the collision angle, the effect on the total damage opening area and the resulting
capT̂ has no statistical significance. Thus, for the geometry used
in Paper D, the damage opening and the resulting capT̂ becomes relatively large for the same
amount of initial kinetic energy, regardless of the collision angle. In all analyses, the effect of the bow section being rigid or deformable stands out. When using a deformable bow section, only the bulb penetrates the side-shell of the struck ship in a majority of the cases, leaving the upper part of the side-shell intact. The imprint from the bulb, and thereby the damage opening area in the cases using the deformable bow section vary little between the different cases. In conclusion, the uncertainty related to the choice of failure model – DI in combination with DE – is critical since it represents a larger uncertainty than that of the material properties scatter. Thus, the recommendations for a failure model, based on the study made on the small-scale structure addressed in Section 2.3, is that the Shear DI criterion with a bilinear law for DE defined in accordance with Section 2.2 should be used in ship collision analyses.
Figure 4.7: Graphical ANOVA for the response variables for simulation set II: (a) damage opening area and (b) the weighted
capT̂ (minutes).

36

37
5 Crashworthiness – alternative designs One of the contributions to the overall objective of this thesis – support RoPax shipping’s further development of sustainable transport and maritime safety – is an assessment of the crashworthiness of a selection of double-hull side-shell structures. In the previous sections, and in the Papers B to D, a conventional (reference) double-hull side-shell structure is used in the ship-to-ship collision simulations. The results show that the size of a damage opening in this structure may be significant and result in a rapid capsize of the struck ship. By means of the simulation procedures developed and presented in Papers A to D, for explicit non-linear internal mechanics FE analysis of ship-to-ship collisions, some crashworthy side-shell structures are compared to the reference structure with respect to five criteria, see Section 5.2 for details. By definition, a crashworthy structure is intended to minimize the damage opening of the inner barrier/side-shell or ultimately result in no opening at all during a collision or grounding, so that the watertight integrity of the vessel is maintained. The outcome of the study presented here should serve as a guide demonstrating the pros, cons and potential of the structure concepts compared.
5.1 Design philosophies According to Tavakoli (2011), two different approaches can be used in the design of a crashworthy structure, illustrated in Fig. 5.1: strength and ductile designs. The difference between them is based on in which of the two colliding ships that the major part of the initial kinetic energy is dissipated into structure deformation and fracture. This relation depends on the relative strength of the two parties. The current work takes the perspective of the struck ship that is hit by a given bow section. Thus, the strength design is here a double-hull side-shell design that remains as intact as possible and makes the bow of the striking ship take up most energy from the collision (Ehlers et al. 2012). A ductile design is a double-hull side-shell in which energy is dissipated through deformations while the watertight integrity is maintained (Karlsson 2009). One example of ductile design for the striking ship is the work carried out by Yamada an Endo (2008) on buffer bows. The purpose of the study in Paper E is to compare and assess these design approaches in relation to a traditional reference design, considered here to be a shared-energy design.

38
Figure 5.1: Energy dissipation and relative strength of two colliding ships.
5.2 Conceptual structures and evaluation criteria From a literature survey, presented in detail in Paper E, one structure according to ductile design and two following the strength design philosophy were chosen. The assessment of the characteristics of each structure was carried out systematically on a small scale, using the small-scale ship-like structure in Section 2.3 as a reference, followed by implementation of the most promising alternatives in a full-scale ship FE model. Details related to the small-scale structure FE analyses are presented in Paper E, below is only a brief description of the structures and the ones used in the full-scale ship FE model analyses. Reference double-hull side-shell structure The reference structure, shown in Fig. 5.2(a), is a conventional double-hull side-shell structure used, e.g., in RoPax vessels; the same structure as described in Section 3.1. Because of the detailed documentation of this structure in Papers B to D and in Karlsson (2009), it is appropriate as a reference structure also in the current investigation. Ductile design concept – corrugated inner side-shell structure Conceptual structures that follow the ductile design concept are fewer in the literature than those following the strength design. Tautz (2007) suggested making perforations in the web frames of a conventional structure so that the inner side-shell would detach in case of a collision and thus be able to withstand larger membrane strains. Karlsson (2009) proposed a corrugated inner side-shell structure that is intermittently welded to the web frames, see Fig 5.2(b). In Karlsson’s investigation, promising results with respect to energy absorption capacity compared to a conventional structural design are presented. The geometry of the corrugated inner side-shell structure used in the current study, shown in Fig. 5.2(b), is identical to the structure presented in Karlsson (2009). The outer side-shell is a conventional stiffened plated structure made of normal steel grade, while the inner side-shell is a corrugated plate made of high-strength steel. In case of a collision, the corrugated plate is designed to release from its supporting web frames and unfold in order to maintain watertight integrity, thereby being able to withstand a larger bow intrusion depth. The attachment points (weld joints) between the corrugated plate and the web frames is a key element for the performance of the structure; these joints should break before the corrugated plate does, allowing it to unfold. In the design proposed by Karlsson (2009), this was accomplished by intermittent welded points between the corrugated plate and the web frame.

39
The strength of the welded joints were designed so that fracture of the welds would not occur during a collision, instead, material rupture of the web should occur before the welds fracture; see experimental tests of welded tensile test coupons in Karlsson (2009). It should be noted that during in-service loading conditions, this structure requires that the outer side-shell must take up more of the service loads in terms of shear forces and bending moment in contrast to a conventional (reference) structure design. Therefore, it is anticipated that it is more suitable on smaller vessels that have more structural margins than large ships. Strength design concept – X-core structure Klanac et al. (2005) assessed a number of structures following the strength design philosophy. Following this, ISSC (2006) suggests one corrugated core, one Y-core and one X-core design. Rubino et al. (2008) show the corrugated core design to be inferior to X- and Y-core and in results in Klanac et al. (2005), the X-core is outperformed by the Y-core. However, in the study on small-scale structures in Paper E, the X-core comes out ahead of the Y-core structure in terms of energy absorption. Therefore it was chosen to be evaluated in large-scale simulations. However, in the study on the small-scale structure, no distinct conclusion could be drawn from the approach to model the welds between the outer plates and the X-core plates; see Paper E for details. Therefore, the X-core structure was modelled both with and without welds in the FE model. These models are referred to as X-core WELDS, Fig. 5.2(d), and X-core NO WELDS, Fig. 5.2(c), in the following. In addition, because of the shape of the X-core structure, see Fig. 5.2(c), there is less large-scale deformation of the structure, and bow intrusion depth, in contrast to the reference and corrugated structures before a fracture of the inner side-shell occurs. In the literature, there are alternative designs proposed for the X-core structure. They differ when it comes to the thickness of the structural elements, type of welds, selection of materials and corrugation angle; see Ehlers et al. (2012), Klanac et al. (2005) and Odefey (2011). In the current investigation, the dimensions of the X-core structure proposed by Ehlers et al. (2012), at an angle of the corrugated plates of 52°, were selected for comparison to the other structures. For more details on the modelling of the structures, see Paper E. Additionally, the current work does not involve aspects of welding methods used for the manufacturing of this type of structure. This has been discussed by, among others, Ehlers et al. (2012). In Paper E, these structures are assessed according to the following criteria:
• Intrusion depth: the distance measured from the first contact point of the striking bow’s bulb on the outer side-shell to the same point on the bulb, when the striking bow section has stopped moving.
• Energy dissipation: the capacity of a structure to absorb energy. In the current work, the energy absorption is evaluated at two instances: At the first point of fracture of the inner side-shell and when the total energy dissipation when the kinetic energy of the striking bow section is zero (i.e. it has stopped moving).
• The damage opening area of the inner side-shell after the collision.
• Weight: the weight of base and welding material.
• Manufacturing cost: material, labour and other fabrication costs.
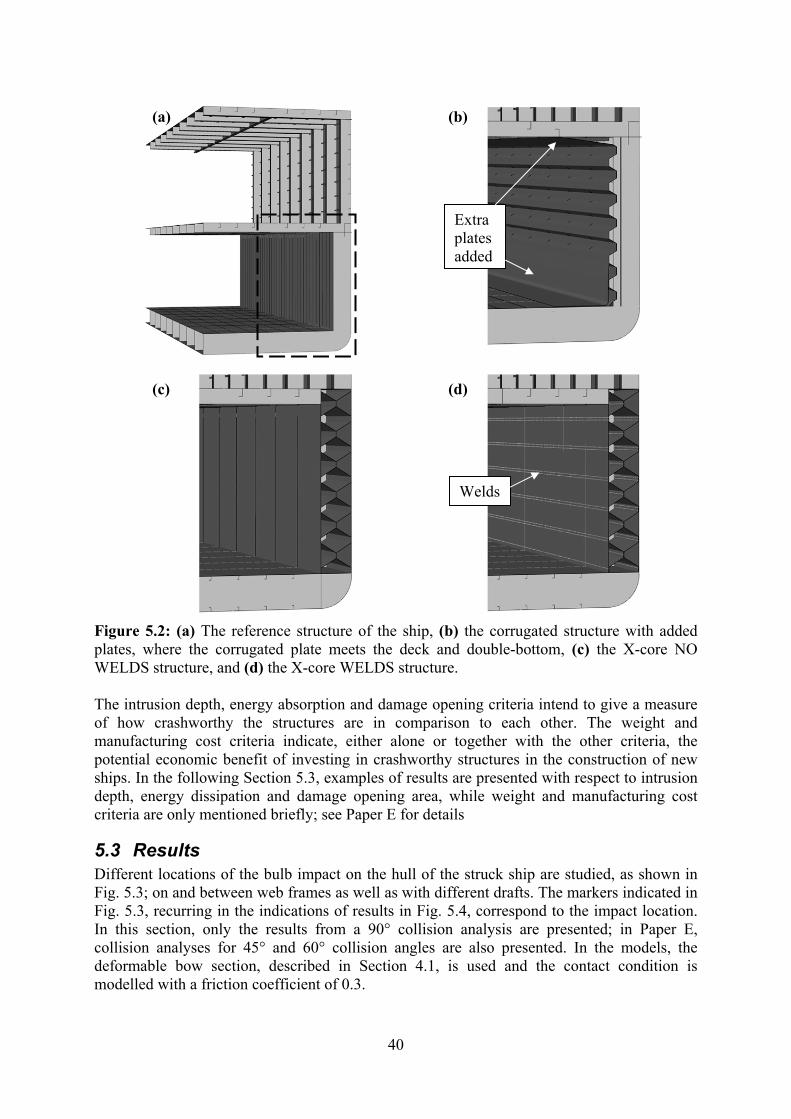
40
Figure 5.2: (a) The reference structure of the ship, (b) the corrugated structure with added plates, where the corrugated plate meets the deck and double-bottom, (c) the X-core NO WELDS structure, and (d) the X-core WELDS structure. The intrusion depth, energy absorption and damage opening criteria intend to give a measure of how crashworthy the structures are in comparison to each other. The weight and manufacturing cost criteria indicate, either alone or together with the other criteria, the potential economic benefit of investing in crashworthy structures in the construction of new ships. In the following Section 5.3, examples of results are presented with respect to intrusion depth, energy dissipation and damage opening area, while weight and manufacturing cost criteria are only mentioned briefly; see Paper E for details
5.3 Results Different locations of the bulb impact on the hull of the struck ship are studied, as shown in Fig. 5.3; on and between web frames as well as with different drafts. The markers indicated in Fig. 5.3, recurring in the indications of results in Fig. 5.4, correspond to the impact location. In this section, only the results from a 90° collision analysis are presented; in Paper E, collision analyses for 45° and 60° collision angles are also presented. In the models, the deformable bow section, described in Section 4.1, is used and the contact condition is modelled with a friction coefficient of 0.3.
(a) (b)
(c) (d)
Extra plates added
Welds

41
Figure 5.3: Impact locations for bulb intrusion. The bold markers indicate that the impact is on a web frame and the thin markers that the impact is in between web frames. Damage opening area and intrusion depth Figure 5.4 presents, for each impact location, the results of two instances in time during the collision analysis. In Fig. 5.4(a), the results are presented when the first element on the inner side-shell of the struck ship reaches full damage (the damage variable reaches unity, see Section 2.2) and is removed from the FE analysis (stiffness of the damaged element is set to zero in Abaqus/Explicit). At this point the percentage of the initial kinetic energy that has dissipated through structure deformation and friction in relation to the intrusion depth is presented in Fig 5.4(a). Also, the final damage opening area at the instance when all kinetic energy of the striking bow section is absorbed and the bow section has stopped and the intrusion depth of the striking ship is presented in Fig. 5.4(b).
Figure 5.4: (a) Intrusion depth in relation to absorbed kinetic energy and remaining speed of the striking ship for the 90° collision, when the first element reaches full damage in the lower part of the inner side-shell. (b) Final damage opening area in relation to final intrusion depth for the 90° collision. The dashed line between two similar markers indicates that the upper part of the hull has also been breached. In this case, the lower marker represents the area of the damage opening in the lower part of the hull and the upper marker the total damage opening area. To study the details in the performance of each structure concept, the collision scenario at 0 m relative draft and an impact location between the web frames was chosen; this case corresponds to the thin circles in Fig 5.3 and Fig. 5.4(a) and (b). This location is chosen since it challenges the structural concepts instead of distributing the kinetic energy to the bottom structure, vehicle deck structure or the web frames. The deformations resulting from the collision of these structures are shown in Fig. 5.5. In all four cases, the stem of the striking ship is buckled and the upper part of the side-shell of the struck ship remains intact. Note that the upper part of the side-shell is able to buckle significantly before it breaks since the

42
weather deck folds down with it. In conclusion, formation of damage opening in the upper part of the hull is dependent on local contact loads, resulting from the buckling patterns in the stem of the striking ship. The reference structure has the largest damage opening and intrusion depth whereas the corrugated structure, having only a slightly lower intrusion depth compared to the reference structure, only has half the damage opening area. Figure 5.5(b) shows that the corrugated plate has detached from the frames and unfolds as intended, giving a later rupture of the plate and, as a result, a smaller final damage opening. Concerning the different approaches to model the X-core structures, the results in Fig. 5.4 show that there is a difference between them with respect to the damage opening area and the intrusion depth; see also Fig. 5.5(c) and (d). The X-core WELDS model distributes the absorbed energy and deformations over the side-shell resulting in a smaller damage opening, whereas the X-core NO WELDS shows a more local behaviour and consequently a larger damage opening.
Figure 5.5: The deformed ship structures when the bow section has stopped: (a) reference, (b) corrugated, (c) X-core NO WELDS, and (d) X-core WELDS; collision angle 90° and at 0 m relative draft. Results – energy dissipation in structure details During the collision, the initial kinetic energy of the bow section is dissipated through deformations in the structure, subsequently referred to as internal energy and friction. The calculated energy dissipation for the collision scenario in Fig. 5.5 is presented in Fig. 5.6. The development of internal energy in the upper and lower part of the struck side-shell as well as the striking bow section is shown. The internal energy in Abaqus/Explicit is comprised of energy from elastic and plastic deformations as well as energy dissipated by damage. The points of rupture in the outer and inner side-shell are also indicated.
(a) (b)
(c) (d)

43
Figure 5.6: Calculated energy components for the collision scenario at a 90° collision angle, 0 m relative draft and impact location between two web frames: (a) reference structure, (b) corrugated structure, (c) X-core NO WELDS structure, and (d) X-core WELDS structure. The kinetic energy of the striking ship is dissipated into internal energy (IE) in the structures, presented for the upper and lower parts of the bow section and the side-shell, and friction. The points where the outer and inner side-shell ruptures are indicated.

44
The friction part of the collision energy represents the kinematic sliding between surfaces – static friction transfers forces that result in deformations – and is highly dependent on the geometry of the model. Wisniewski and Kolakowski (2003) used a collision model similar to the one in the current study, although they used a rigid bow section, and showed that the friction energy was around 30% of the initial kinetic energy given to the striking bow section. This large value may be caused by the fact that their bow section was sliding on a large contact area along the sides of the damage opening during the indentation of the side-shell. Contrary to this, Glykas and Das (2001) state that the friction energy part of their analyses is negligible, but they used a deformable bow section that collided with a rigid wall – a case in which there is little sliding between parallel surfaces. In the results presented in Fig. 5.6, the friction component of the energy is relatively small, which confirms the results presented in the variance analysis in Section 4.3, that the influence of the friction is low for the models used here. Due to the geometry of the bow, there is a shift in energy components with the intrusion depth. The larger the intrusion depth, the more energy is dissipated through plastic deformation in the upper part of the struck side-shell and striking bow section. For the X-core structures, see Fig. 5.6 (c) and (d), a larger part of the energy is dissipated in the lower part of the model, in particular for the X-core WELDS. In accordance with strength design principle, the bow section is deformed and almost 20% of the initial kinetic energy is dissipated due to deformations of the bow. The results presented in Fig 5.4 indicate that there is little difference between the different weld modelling approaches used in the X-core structure. However, at a relative draft of 0 m, X-core WELDS has sufficient strength to deform the bulb of the striking ship, which is also a reason for the damage opening being smaller in this case. Here, the strength design works as intended. Additionally, using this model, friction energy is lower compared to the other structures, since the sliding of the bulb through the side-shell is lower. Consequently, there is an uncertainty in results related to the different approaches to modelling welds for the X-core structure. The results show that the outer side-shell is ruptured at an early stage in the analysis, when only 2 - 4% of the initial kinetic energy has been dissipated in the structures. The X-core structures have an earlier rupture of the outer side-shell, which is due to them being stiffer locally than the other structures, giving higher local membrane strains in the plate. The corrugated structure gives a later rupture of the inner side-shell, as it is intended to in the ductile design approach, and also a slightly lower final intrusion depth than the reference structure. Concluding remarks The results in Fig 5.4(a) show that as watertight integrity is breached, the conceptual structures have absorbed more energy than the reference structure. The X-core structure achieves this increased energy absorption at a lower intrusion depth, whereas the structure with a corrugated inner side-shell has an increased intrusion depth. Moreover, the size of the damage opening at the final stage of the collision analysis is smaller for both structure concepts compared to the reference structure. However, in all results in Fig 5.4, the structure with the corrugated inner side-shell gives larger scatter in the results. Thus, the X-core structure is considered to be a more reliable structure and has the best overall performance in terms of crashworthiness. However, this comes at the price of increased weight and higher manufacturing cost, whereas the corrugated structure both weighs less and is less costly to manufacture than the reference structure; see Paper E for the

45
analysis. Finally, in analyses on the small-scale structure presented in Paper E, the Y-core concept was also assessed but came out short in the comparison to the X-core structure. Thus it was not assessed in the large-scale ship collision simulations. However, this structure concept has benefits in terms of weight and manufacturing costs in relation to crashworthiness and deserves further study.

46

47
6 Summary of appended papers This thesis consists of a summary part, see Sections 1 to 8, and five appended papers, Papers A to E. The purpose of the summary part is to present an overview of the work in the appended papers, and to put their scientific work and contributions into a wider context according to the aims and objectives of the thesis work; see Section 1 for details. The current section presents the relations between Papers A to E; see Fig. 6.1 for a schematic overview.
Figure 6.1: Overview of relations between Papers A to E. A computational methodology is presented in Paper B, using input from material modelling and experiments presented in Paper A. Parameter studies using the computational methodology are presented in Papers C and D. An assessment of crashworthy innovative structures is carried out and presented in Paper E. Paper A presents an in-depth study of material experiments that constitute the basis of the material modelling and simulation of structure damage in ship collision simulations. The findings are applied in explicit internal mechanics FE analysis of ship-to-ship collisions, where accurate descriptions of the damage opening’s size and damage are of interest. This

48
information is part of the computational methodology, presented in Paper B, which enables the making of realistic scenario-based numerical simulations of a struck ship’s survivability in an arbitrary sea-state. By means of this methodology, the survivability in terms of the time to capsize is determined by realistic and accurate descriptions of shape and size of the damage opening in the struck ship. The computational methodology in Paper B is used in parameter sensitivity analyses presented in Papers C and D. The consequences of model and material properties uncertainties regarding, among others, the shape and size of the damage opening in the struck ship, are studied and related to the variation in the estimation of the time to capsize. Furthermore, through the results in Papers C and D, the material modelling established in Paper A is studied further, validated and refined. As a result, with the support of the results and conclusions in Papers A to D, a study is presented in Paper E on the crashworthiness of a selection of side-shell structure concepts. In the literature, these structures have been proposed for mitigation of the consequences for a ship struck in a collision. The major contributions by each of the appended papers are summarized as follows. Paper A: Hogström, P., Ringsberg, J. W., Johnson, E. (2009). An experimental and numerical study of the effects of length scale and strain state on the necking and fracture behaviours in sheet metals. International Journal of Impact Engineering 36(10-11):1194-1203. The paper addresses experiments that have been carried out in order to validate existing failure models used in large-scale ship collision FE simulations in terms of dependence on length scale and strain state. Based on tests recorded with the optical strain measuring system ARAMIS, the stress-strain behaviour of uniaxial tensile tests was examined locally. From this information, true stress-strain relations were calculated at different length scales across the necking region of the specimen, denoted as virtual extensiometers (VE). Results of the experiments and numerical analyses of the tensile tests confirmed that Barba’s relation is valid for handling stress-strain dependence on the length scale used for (fracture) strain evaluation after necking. Forming limit tests were carried out to study the multiaxial failure behaviour of the material in terms of necking and fracture. Numerical simulations of the forming limit test tallied well with experimental results. Paper B: Schreuder, M., Hogström, P., Ringsberg, J. W., Johnson, E., Janson, C.-E. (2011). A method for assessment of the survival time of a ship damaged by collision. Journal of Ship Research 55(2):86-99. A comprehensive analysis procedure that handles the chain of events of a ship collision by connecting the damage opening shape and size, flooding, dynamic damage stability assessment and time to capsize was established. Using this methodology, the survivability of a damaged RoPax ship in terms of time to capsize can be assessed. The methodology is sequential (de-coupled) and incorporates non-linear FE analysis of a collision and dynamic damage stability simulations using the SIMCAP analysis tool. The shape and size of the damage openings predicted by FE analyses are used in damage stability analyses in which the struck ship is subjected to wave motions in an arbitrary sea-state and flooding into the damage opening. Thus, dependence of the survivability of the struck RoPax ship on significant wave height and sea-state is studied.
49
Paper C: Hogström, P., Ringsberg, J. W., Johnson, E. (2011). Survivability analysis of a struck ship with damage opening – influence from model and material properties uncertainties. Ships and Offshore Structures 4(6):339-354. The damage opening of the struck ship is calculated for a selection of damage degradation models and realistic material properties, here referred to as model and material property uncertainties. The model uncertainty is considered as a possible (user-related) insecurity in the selection of the most appropriate damage criterion for the analysis; the Shear failure and the forming limit diagram (FLD) criteria are compared in this paper. The uncertainty in material properties is studied based on the scatter of material curves in tensile tests in a number of specimens from the same class of materials. The survivability of the struck ship is estimated given the shape and size of the damage opening for all of the cases by using the computational methodology established in Paper B. Numerical analyses are verified by the comparison of results from experiments on a small-scale ship-like structure. Paper D: Hogström, P., Ringsberg, J. W. (2012). An extensive study of a ship’s survivability after collision – a parameter study of material characteristics, non-linear FEA and damage stability analyses. Submitted for publication in Marine Structures. Paper D presents an extensive study on the effect that modelling parameters have on the outcome of the computational methodology established in Paper B in terms of survivability of a ship struck in a collision. The purpose is to be able to make recommendations of a sufficient level of simplifications to arrive at reliable results in numerical simulation of ship collisions. The model and material properties uncertainties studied in Paper C are incorporated in this paper. A previous study on model uncertainty is extended to include the stress-based FLSD criterion. Uncertainties of input parameters in the FE simulations that are studied are the dispersion in material parameters, constitutive modelling approach, simplifications of striking bow section model, friction coefficient, collision angle and ship speed. Their impact on the shape and size of the damage opening and time to capsize of the struck ship and thus the consequences for survivability of the struck RoPax ship are assessed. Numerical analyses are verified by comparison of results from experiments on a small-scale ship-like structure. Paper E: Hogström, P., Ringsberg, J. W. (2012). Assessment of the crashworthiness of a selection of innovative ship structures. Submitted for publication in Ocean Engineering. Conceptual structures intended to increase the crashworthiness of ships, which have been suggested by other authors, are assessed and compared to a conventional reference structure. The objective of Paper E is to assess and discuss specific issues – benefits and challenges – related to the implementation of each structure. One concept that is built on increasing crashworthiness by allowing for a larger penetration depth before the watertight integrity is breached, as well as one concept that is built on maximizing the absorbed energy in the collision are studied. The assessment of these structures is made by comparing penetration depth, energy absorption, damage opening area, weight and manufacturing costs of each structure. Explicit FE simulations are carried out, using the modelling aspects determined in Paper D, to assess the performance of each structure concept on a small-scale experimental structure as well as in simulations of full-scale ship collisions.

50
51
7 Conclusions Understanding the survivability conditions for a RoPax ship damaged in collision is essential to maritime safety and sustainable shipping. This thesis presents a comprehensive analysis methodology that handles the chain of events of a ship collision by connecting the damage opening shape and size, flooding, dynamic damage stability assessment and time to capsize, Tcap. The methodology, presented in detail in Paper B, is shown to be useful to assess the survivability, herein regarded as Tcap, of a RoPax ship struck in a collision. This analysis methodology could, in combination with a risk-based approach, prove useful in a wide range of applications such as the assessment of regulations and design standards. The influence of shape and size of the damage opening on Tcap of a RoPax ship struck in collision based on the uncertainty of input parameters in non-linear explicit FE analyses is studied in detail. The parameters studied here include dispersion in material parameters, the material failure modelling approach, simplifications of striking bow section model, friction coefficient, collision angle and ship speed. All parameters are found to have an effect on the results and the largest influence is whether the bow section used in the analyses is rigid or deformable. The effect of this is even greater than that of the speed of the striking ship going from 5 to 7 knots, which doubles the kinetic energy to be absorbed by the structures. In order to determine the most appropriate failure model to use in FE analyses of ship-to-ship collisions, experimental data from tensile tests and forming limit tests are used. These tests are recorded with the optical strain measuring system ARAMIS, which allow for local examination of the stress-strain behaviour of the uniaxial tensile tests and the principal strains on the forming limit test specimens. From this information, true stress-strain relations are calculated at different length scales across the necking region of the specimen, denoted as virtual extensiometers (VE). Thus, models for stress-strain dependence on the length scale used for (fracture) strain evaluation after necking are verified. The failure models investigated in this thesis are the Shear, FLD and FLSD criteria for damage initiation in Abaqus/Explicit, along with a law for the evolution of damage towards the final fracture. The uncertainty related to the choice of failure model is found to be critical since it has a greater effect on the outcome of the analysis than that of the scatter of material properties within a material class. The uncertainty analysis shows that the difference in Tcap can be tenfold depending on the chosen failure model. Thus, the analyst, who designs the models, should be aware that both the choice of failure model as well as the dispersion in properties of a material have great consequences on the outcome of the analysis and account for this. It is found that the best agreement between numerical analyses and experimental results for a small-scale ship-like structure is obtained using the Shear criterion in Abaqus/Explicit for damage initiation in such a way that the post-necking behaviour of the

52
material is accounted for by a bilinear law for damage evolution. Thus, this criterion is recommended to use in FE analyses of ship-to-ship collisions. To obtain the parameters used in this failure model, results from tensile tests are sufficient. The representation of the damage opening is in the current thesis represented as a grid of points, which outlines the projected area of the damage opening in the inner side-shell of the struck RoPax ship. It is found that small variations in the shape and size of the damage opening have an influence on Tcap, depending on where the damage is situated, caused by the bulb below the water line or close to the vehicle deck caused by the stem. The shape of the damage opening caused by the bulb of the striking ship in the lower part of the hull is not critical, but gives the struck ship an initial list that lowers the threshold for waves to flood the vehicle deck. However, the shape of the damage opening at the level of the vehicle deck and just above it has a major influence on the results, since the horizontal extent of the damage in this region governs the flood rate into the vehicle deck. The level of detail on which the damage opening is modelled within this thesis, is able to predict the survivability of a ship struck in collision with an accuracy that would not be achieved using a more simplified model. On the other hand, simplified models allow for a larger quantity of analyses, but the focus of the current thesis is an accurate study of the physics of damage stability. The results presented indicate that both active and passive measures can be taken to increase the survivability of ships in relation to collisions. It is shown that altering course so that the waves are on the bow on the side of the damage opening will substantially increase the survival time of the ship studied here. Survivability of the struck RoPax ship for different cases of significant wave height and sea-state is also studied. The existence of a wave height limit below which capsize will not occur is demonstrated as well as the steady decrease of Tcap with increasing wave height. Finally, contribution to passive safety is made through a study of conceptual designs of side-shell structures intended to increase the crashworthiness. One concept that is based on increasing crashworthiness by allowing for a larger penetration depth before the watertight integrity is breached – the corrugated inner side-shell – is studied, as well as concepts that are based on maximizing the absorbed energy in the collision – the X-core and Y-core structures. The study shows that there is great potential to improve the crashworthiness of ships by applying novel design concepts. The evaluation of the conceptual structures is made on the basis of five criteria: intrusion depth, energy absorption, final damage opening area, weight and manufacturing cost. Through parameter studies of different collision scenarios, it is shown that as watertight integrity is breached, the conceptual structures have absorbed more energy and have a smaller damage opening in comparison to the reference structure. Based on the results, benefits as well as challenges related to the implementation of each structure are discussed. The work contributes to knowledge and understanding of in what conditions a RoPax ship damaged in a collision will survive without capsizing and how these can be simulated accurately using numerical models. This is achieved by analysis of variations in the input parameters in each step in the analysis methodology; model and material properties as well as scenario parameters for the FE simulations and sea-states, significant wave heights and relative wave direction for the dynamic damage stability analyses.

53
8 Future work The work presented in the current thesis spans over several different scientific disciplines. Recommendations for possible continuation of the work are suggested as follows: Risk-based standards The current thesis establishes models that can be used for calculation of the damage resulting from collisions and groundings and connects these with analyses of the conditions of the damaged vessels in terms of survivability. However, in order to give a complete range of connected rational tools for risk assessment, additional work is needed to estimate the probability of collision or grounding as well as estimate the cost associated with the accident (Pedersen 2010). Expressing the consequences of a collision in monetary terms would give a comprehensible basis for comparison when it comes to, e.g. judging an acceptable investment level to improve the design of a ship. In this case, all consequences of an accident need to be related to costs and there are models and key figures available. Concerning the cost of adverting a human fatality, values of around US$ 3 million are used in the IMO, an overview of which can be seen in Skjong and Vanem (2007). For effects on the environment, the cost to advert one tonne of oil spill is discussed by Yamada and Kaneko (2010). Assessment of additional ship types The methodology presented in the current thesis is generally applicable to the analysis of collisions between ships, but applied to a ship-type that is of particular interest because of damage stability – RoPax. The conclusions on Tcap are therefore only applicable to the RoPax ship used in the case study, or a similar ship. In future work, it would be valuable to extend the analyses to incorporate other ship types and consequences specifically related to these. One example is to model the outflow of oil (Tavakoli et al. 2012) if the methodology is applied to the collision of a tanker. Residual strength of damaged ships According to new IMO regulations, ships should be able to withstand wave and internal loads in damaged conditions such as collisions, groundings or flooding (Yamada and Kaneko 2010). In this context, actually foreseeable scenarios should be investigated, in which case methods put forward in the current thesis could be useful to analyse the consequences in combination with work on ultimate limit strength of ship structures (Kwon et al. 2011, Paik et al. 2009, Wang et al. 2002 and Yamada and Ogawa 2011).

54
External dynamics The effect of neglecting the external dynamics of a collision is difficult to quantify and should be investigated further. Incorporating this means that the kinetic energy of the striking ship will be transferred into motions of the two ships, hydrodynamic effects in the surrounding water as well as sloshing in tanks, resulting in less energy being dissipated through structure deformations. However, the motions of the ships during the collision may have effects on the shape of the damage opening, likely giving it a larger vertical extent, which will have an effect on Tcap. External dynamics have been investigated by, for example Zhang (1999) and Tabri et al. (2009a). The motions of the ships could be modelled either through fully coupled FE analysis or semi-analytical expressions in which the boundary conditions are updated according to an analytical model. The difference between coupled and de-coupled models on structural deformations in the hull beam is investigated by Tabri (2012), a work that would be of interest to combine with the methods put forward in the current thesis. Internal mechanics In plates manufactured by rolling, as is the case with ship-building plate steel, the grains in the surface become flattened in the rolling process. This effect is more pronounced on thin plates, like the 4 mm plates for which the tensile and forming limit tests are described in Section 2. However, for thicker plates, the grains in the interior will be less distorted. Therefore, additional testing on thicker plates to see effects from rolling process is recommended. In this thesis, it is assumed that the global effect that strain rates dependence in the behaviour of the material have on the outcome of the collision analyses is low. However, these effects are incorporated in the work of others, see for example Paik (2007,) and should be studied further using the computational methodology to see the effect on survivability of a damaged ship. Aged/corroded structures The effect of the ageing of ship structures should be assessed in relation to the deduction of corrosion margins on plates (Paik and Tayamballi 2002 and Guedes Soares et al. 2009b). In addition, the effect of aged and corroded welds on the survivability of a ship is an area that deserves further study. Crashworthy innovative structures Concerning the innovative structures, there are challenges related to implementing these kinds of structures in ships. The design of these conceptual structures must be made in such a way that the ability of the ship to withstand its design loads in terms of bending moment, shear forces and fatigue is maintained. The Y-core concept was also assessed but came out short in the comparison to the X-core structure. However, the Y-core structure concept has benefits in terms of weight and manufacturing costs in relation to crashworthiness and deserves further study. Finally, there is room for design optimization in order to improve the performance in terms of crashworthiness and cost effectiveness of the all the structures; corrugated inner side shell, Y-core and X-core.

55
References Alsos, H. S., Amdahl, J. and Hopperstad, O.S. (2009). On the resistance to penetration of -stiffened plates Part II – Numerical analysis. International Journal of Impact Engineering 36(7): 875-887. Alsos, H. S. (2008). Ship grounding - analysis of ductile fracture, bottom damage and hull girder response. Department of Marine Technology. Trondheim, Norway. Norwegian University of Science and Technology. Doctoral Thesis. Alsos, H. S., Hopperstad, O. S., Törnqvist, R. and Amdahl, J. (2008). Analytical and numerical analysis of sheet metal instability using a stress based criterion. International Journal of Solids and Structures 45(7-8): 2024-2055. American Bureau of Shipping (ABS). (2009). Application of high-strength hull structural thick steel plates in container carriers. Houston, Texas, USA. ABS. Box, G.E.P., Hunter, J.S. and Hunter, W.G. (2005). Statistics for Experimenters, Hoboken, New Jersey, U.S.A. John Wiley and Sons Inc. Brown, A.J. (2002). Collision scenarios and probabilistic collision damage. Marine Structures 15(4-5): 335-364. Chen, J., Zhou, X. and Chen, J. (2010). Sheet metal forming limit prediction on plastic deformation energy. Journal of Materials Processing Technology 210(2): 315-322. Dassault Systèmes, (2007). Abaqus/Explicit version 6.7 documentation, analysis users manual, section 19.2. Vélizy Villacoublay, France. Department of Transport (1987). mv Herald of Free Enterprise, Report of Court No. 8074. www.maib.gov.uk/cms_resources/Contents.pdf (Accessed on 2012-02-01) Det Norske Veritas (DNV). (2007). Rules or classification of ships/high speed, light craft and naval surface craft, Part 2, Chapter 1-2. Høvik, Norway. DNV. Det Norske Veritas (DNV). (2010). Recommended practice, DNV-RP-C205, Environmental Conditions and Environmental Loads, Høvik, Norway. DNV. Dowling, N. E. (2007). Mechanical behaviour of materials. Upper Saddle River, New Jersey, U.S.A. Pearson Education, Inc. Ehlers S., Tabri K., Romanoff J. and Varsta P. (2012). Numerical and experimental investigation on the collision resistance of the X-core structure. Ships and Offshore Structures (Awaiting publication, available on the internet). Ehlers, S. (2009). Material relation to assess the crashworthiness of ship structures. Department of Applied Mechanics. Espoo, Finland. Helsinki University of Technology. Doctoral Thesis.

56
Ehlers, S., Broekhuijsen, J., Alsos, H. S., Biehl, F. and Tabri, K. (2008). Simulating the collision response of ship side structures: a failure criteria benchmark study. International Shipbuilding Progress 55(1-2): 127-144. Ehlers, S. and Varsta, P. (2009). Stress and strain relations for non-linear finite element simulations. Thin-Walled Structures 47(11): 1203-1217. Glykas, A. and Das, P.K. (2001). Energy conservation during a tanker collision. Ocean Engineering 28(4): 361-374. GOM (2012). Retrieved 2012-02-02. Measuring systems - ARAMIS. From http://www.gom.com/metrology-systems/system-overview/aramis.html. Guedes Soares, C., Jasionowski, A., Jensen, J., McGeorge, D., Papanikolaou, A. D., Pöyliö, E., Sames, P., Skjong, R., Skovbakke Juhl, J. and Vassalos, D. (2009a). Risk-based ship design. Editor: Papanikolaou, A. D. Berlin Heidelberg, Germany. Springer-Verlag. Guedes Soares, C., Garbatov, Y. and Wang, G. (2009b). Influence of environmental factors on corrosion of ship structures in marine atmosphere. Corrosion Science 51(9): 2014-2026. Hogben, N., Dacunha, N.M.C. and Olliver, G.F. (1986). Global Wave Statistics. Feltham, UK. British Maritime Technology Ltd. Hogström, P., Ringsberg, J. W. (2011). What can we learn from uncertainty analysis with respect to survivability or time to capsize of a ship struck in collision? Proceedings of the 30th International Conference on Ocean, Offshore and Arctic Engineering (OMAE2011). Rotterdam, the Netherlands. June 19-24, 2011. Hooper, J. J., Foecke, T., Graham, L. and Weihs, T. P. (2003). Metallurgical analysis of wrought iron from the RMS Titanic. SNAME Marine Technology 40(2): 73-81. International Maritime Organization (IMO). (2007) International Convention for Safety of Life at Sea (SOLAS). London, UK. IMO Publications. International Maritime Organization (IMO). (1995), Regional agreements on specific stability requirements for Ro-Ro passenger ships. IMO resolution 14 (Annex: Stability requirements pertaining the requirement), adopted on November 29, 1995. International Organization for Standard (ISO). (2007). ISO12004-2 Metallic materials - sheet and strip - determination of forming limit curves - Part 2: determination of forming limit curves in laboratory. Geneva, Switzerland. International Organization for Standard. International Ships and Offshore Structures Congress (ISSC). (2006). Committee V.I. Collision and Grounding. Southampton, UK. 16th International Ship and Offshore Structures Congress, Vol 2. Jasionowski, A., Vassalos, D. and Guarin, J. (2003). Time based survival criteria for passenger Ro-Ro vessels. SNAME Marine Technology 40(4): 278-287.

57
Karlsson, U. (2009). Improved collision safety of ships by an intrusion-tolerant inner side shell. Marine Technology 46(3): 165-173. Karlsson, U., Ringsberg, J. W., Johnson, E., Hoseini, M. and Ulfvarsson, A. (2009). Experimental and numerical investigation of bulb impact with a ship side-shell structure. SNAME Marine Technology 46(1): 16-26. Kim, S. B., Huh, H., Bok, H. H. and Moon, M. B. (2011). Forming limit diagram of auto-body steel sheets for high-speed sheet metal forming. Journal of Material Processing Technology 211: 851-862. Kitamura, O. (2002). FEM approaches to the simulation of collision and grounding damage. Marine Structures 15(4-5): 403-428. Klanac, A., Ehlers, S., Tabri, K., Rudan, S. and Broehuijsen, J. (2005). Qualitative design assessment of crashworthy structures. In: International Congress of International Maritime Association of the Mediterranean (IMAM). Lisboa, Portugal 26-30 Sept. 2005. Kwon, S., Vassalos, D. and Mermiris, G. (2011). Progressive structural failure and residual strength of damaged ships. In: Proceedings of The Damaged Ship. London, UK 26-27 Jan. 2011. Källström, C., Allenström, B., Ottosson, P., Vassalos, D., Jasionowski, A., Rutgersson, O., Schreuder, M., Bergholtz, J., Blok, J.J. and vna Daalen, F.G. (2008). Final Report-Research Study on the Sinking Sequence of MV Estonia. Göteborg, Sweden. SSPA Research Report No 134. Lehmann, E., Peschmann, J. (2002). Energy absorption by the steel structure of ships in the event of collisions. Marine Structures 15(4-5): 403-428. Lin, J., Chan, L. C., Wang, L. (2010). Prediction of forming limit diagrams based on shear failure criterion. International Journal of Solids and Structures 47: 2855-2865. Liu, Z., Amdahl, J., Løset, S. (2011). Integrated numerical analysis of an iceberg collision with a foreship structure. Marine Structures 24(4): 377-395. Lloyd’s Register - Fairplay, (1999 - 2010). World casualty statistics. London, U.K. Lloyd's Register - Fairplay Ltd. Lützen, M. (2001). Ship collision damage. Department of Naval Architecture and Offshore Engineering. Lyngby, Denmark. Technical University of Denmark. Doctoral Thesis. Mansour, A. and Liu, D. (2008). Strenght of ships and ocean structures. Jersey City, New Jersey, U.S.A. The Society of Naval Architects and Marine Engineers. Marciniak, Z., Duncan, J. L. and Hu, S. J. (2002). Mechanics of sheet metal forming. Oxford, U.K. Butterworth-Heinemann. Marine Safety Committee, (2005). Adoption for the amendments to the international convention for the safety of life at sea, 1974, as amended, MSC194(80).

58
Mattson, B. -M. (2006). Andrea Dorias undergång. Stockholm, Sweden. Bokförlaget DN. (In Swedish). Minorsky, V. U. (1959). An analysis of ship collisions with reference to protection of nuclear power plants. Journal of Ship Research 3: 1-4. Odefey, M. (2011). Simulation of collisions between RORO vessels with improved double-hull designs. Gothenburg, Sweden. Department of Shipping and Marine Technology, Chalmers University of Technology. Master of Science Thesis. Report No. X-11/258. Paik J.K. (2007). Practical techniques for finite element modeling to simulate structural crashworthiness in ship collisions and grounding (Part I: Theory). Ships and Offshore Structures 2(1): 69-80. Paik J.K., Park, J.H. and Samuelides, E. (2009). Collision-Accidental limit states performance of double-hull oil tanker: pre-CSR versus CSR designs. Marine Technology 46(4): 183-191. Paik, J.K. and Thayamballi, A.K. (2002). Ultimate strength of ageing ships. Proceedings of the Institution of Mechanical Engineers, Part M: Journal of Engineering for the Maritime Environment 216(1): 57-77. Papanikolaou, A. D. (2007). Review of damage stability of ships - recent developments and trends. International Symposium on Practical Design of Ships and Other Floating Structures. Editors: Basu, R. I., Vadim, B., Wang, G. and Yu, Q. Houston, Texas, U.S.A. American Bureau of Shipping. 1: 497-509. Pedersen, P.T. (2010). Review and application of ship collision and grounding analysis procedures. Marine Structures 23(3): 241-262. Pedersen, P. T. and Li, Y. J. (2009). On the global ship hull bending energy in ship collisions. Marine Structures 22(1): 2-11. Pedersen, P.T., Friis-Hansen, P. and Nielsen, L.P. (1996) Collision risk and damage after collision. In: Proceedings of the RINA International Conference on the safety of passenger RoRo vessels, London, UK, 7 June 1996. Pedersen, P. T. and Zhang, S. (1998). On impact mechanics in ship collisions. Marine Structures 11(10): 429-449. Rubino, V., Deshpande, V. S. and Fleck, N. A. (2008). The collapse response of sandwich beams with a Y-frame core subjected to distributed and local loading. International Journal of Mechanical Sciences 50(2): 233-246. Schreuder, M. (2005). Time simulation of the behaviour of damaged ships in waves. Shipping and Marine Technology. Gothenburg, Sweden. Chalmers Unversity of Technology. Licentiate Thesis. Situ, Q., Jain, M. K. and Metzger, D. R. (2011). Determination of forming limit diagrams of sheet materials with a hybrid experimental-numerical approach. International Journal of Mechanical Sciences 53(9): 707-719.

59
Skjong, R., Vanem, E. and Endresen, Ø. (2007). Risk evaluation criteria. SAFEDOR Deliverable D4.5.2. Stoughton, T. B., Zhu, X. (2004). Review of theoretical models of the strain-based FLD and their relevance to the stress-based FLD. International Journal of Plasticity 20(8-9): 1463-1486. Tabri, K. (2012). Influence of coupling in the prediction of ship collision damage. Ships and Offshore Structures (Awaiting publication, available on the internet). Tabri, K. (2010). Dynamics of ship collisions. Department of Applied Mehcanics. Espoo, Finland. Aalto University. Doctoral Thesis. Tabri, K., Broekhuijsen, J., Matusiak, J. and Varsta, P. (2009a). Analytical modelling of ship collision based on full-scale experiments. Marine Structures 22(1): 42-61. Tabri, K., Matusiak, J. and Varsta, P. (2009b). Sloshing interaction in ship collisions - an experimental and numerical study. Ocean Engineering 36(17-18): 1366-1376. Tautz, I. (2007). Predetermined breaking points in a ships double hull, an innovative design concept to enhance collision safety. In: The 4th International Conference on Collision and Grounding of Ships (ICCGS) 2007. Hamburg, Germany 9-12 Sept. 2007. Tavakoli, M.T., Amdahl, J. and Leira, B. (2012). Analytical and numerical modelling of oil spill from a side tank with collision damage. Ships and Offshore Structures (Awaiting publication, available on the internet). Tavakoli, M.T. (2011). Assessment of oil spill in ship collision and grounding. Department of Marine Technology. Trondheim, Norway. Norwegian University of Science and Technology. Doctoral Thesis. Törnqvist, R. (2003). Design of crashworty ship strucures. Department of Naval Architecture and Offshore Engineering. Lyngby, Denmark. Technical University of Denmark. Doctoral Thesis. Vassalos, D. and Papanikolaou, A. D. (2002). Stockholm agreement – past, present and future (part I). Marine Technology 39(3): 137-158. Wang, G., Chen, Y., Zhang, H. and Peng, H. (2002). Longitudinal strength of ships with accidential damages. Marine Structures 15(2): 119-138. Wisniewski, K. and Kołakowski, P. (2003). The effect of selected parameters in ship collision results by dynamic FE simulations. Finite Elements in Analysis and Design 39(10): 985-1006. Yamada, Y. and Ogawa, Y. (2011). Study on the residual ultimate longitudinal strength of hull girder of a bulk carrier against sagging moment after ship collision. In: Advances of Marine Structures. Editors: Guedes Soares, C. and Fricke, W. London, UK. Taylor and Francis Group.

60
Yamada, Y. and Kaneko, F. (2010). On the derivation of CATSthr within the framework of IMO environmental FSA studies. In: The 5th International Conference on Collision and Grounding of Ships (ICCGS) 2010. Helsinki, Finland 9-12 Sept. 2007. Yamada, Y. and Endo, H. (2008). Experimental and numerical study on the collapse strength of the bulbous bow structure in oblique collision. SNAME Marine Technology 45(1): 42-53. Yamada, Y., Endo, H. and Pedersen, P. T. (2005). Numerical study on the buffer bow structure in ship-ship collision. Proceedings of the 15th International Offshore and Polar Engineering Conference. Editors: Chung, J. S., Hong, S. W., Koo, J., Komai, T., Koteramaya, W. Seoul, Korea. Internation Society of Offshore and Polar Engineers (ISOPE). Zhang, A. and Suzuki, K. (2007). A comparative study of numerical simulations for fluid-structure interaction of liquid-filled tank during ship collision. Ocean Engineering 34(5-6): 645-652. Zhang, S. (1999). The mechanics of ship collisions. Department of Naval Architecture and Offshore Engineering. Lyngby, Denmark. Technical University of Denmark. Doctoral Thesis. Zhao, L., Sowerby, R. and Sklad, M. P. (1996). A theoretical and experimental investigation of the limit strains in sheet metal forming. International Journal of Mechanical Sciences 38(12): 1307-1317. Zheng, Y., Aksu, S., Vassalos, D., Tuzcu, C. (2007). Study on side structure resistance to ship-ship collision. Ships and Offshore Structures 2(3): 273-293.