Embed Size (px)
Citation preview

1
Fuel Consumption Measurement Uncertainty
How can I evaluate the quality of my measurement results?
Romain Lardet Consumption Measurement
AVL-List GMBH

2 Any unauthorized copying, disclosure or distribution of the presentation is strictly forbidden
Content
1. What do we mean by Measurement Uncertainty ?
2. Example of measurement uncertainty evaluation based
on actual steady-state measurements
3. Evaluating the measurement uncertainty in one’s testfield
4. AVL Measurement Quality Program (MQP)

3 Any unauthorized copying, disclosure or distribution of the presentation is strictly forbidden
Measurement Uncertainty : the Basics
“uncertainty of measurement” means :
Doubt about the validity of the result of a measurement
According to the GUM* there are 2 main ways of evaluating the
measurement uncertainty :
TYPE A : method of evaluation of uncertainty by the statistical analysis
of series of observations
= evaluation based on actual measurements
TYPE B : method of evaluation of uncertainty by means other than the
statistical analysis of series of observations
= evaluation based on estimating what the different sources of
uncertainties are = modelling of the stochastic (random) and systematic
effects on the measurement.
* GUM = Guide to the expression of uncertainty in measurements edited by the Joint Committee for
Guides in Metrology (JCGM – Working Group 1)
Focus of the
presentation

4 Any unauthorized copying, disclosure or distribution of the presentation is strictly forbidden
Evaluation based on actual measurements (Type A) some mathematics are necessary
• Mean of N observations (measurements) of the quantity q
• Standard Deviation of N observations of the quantity q
• Best Estimate of the Variance of the Mean = Standard Uncertainty U

5 Any unauthorized copying, disclosure or distribution of the presentation is strictly forbidden
Evaluation based on actual measurements (Type A) …and some more
it is usual to express
measurement uncertainty of
type A as an expanded
measurement uncertainty with
a coverage factor of 95% as
described in the formula above.

6 Any unauthorized copying, disclosure or distribution of the presentation is strictly forbidden
Example of measurement uncertainty evaluation based on actual steady-state measurements.
Hypothesis :
• Engine Speed / Torque / T_oil / T_water are stable.
Procedure :
• repeat N=6 steady-state averaged measurements of t = 10 seconds
(e.g : with a data rate 5 Hz, this is 10*5 = 50 samples repeated 6 times)
• calculate the standard deviation S of those 6 averaged measurements
• calculate the expanded measurement uncertainty @95% for 6
measurements (the student factor t95,n=6 = 2.45) using the formula provided
before.
0 10 20 30 40 50 60 70 80 90 100 110 120 130 140 150 160 170 180 190 200E_TIM [h]
BS
FC
_S
[g
/kW
.h]
214
216
218
220
217.0
216.4
217.2
217.1
217.4
214.7
217.4
216.8
215.3
216.9
216.8
217.0
217.7
215.1
217.4
216.9
BS
NO
XT
PS
[g
/kW
.h]
1.2
1.4
1.61.40
1.37
1.37
1.40
0.23
1.38
1.36
1.51
1.51
1.52
1.28
1.29
0.22
1.33
1.31
1.31
1.31
1.30
MD
[N
m]
550
600
650
587
591
589
589
588
589
587
588
589
591
590
589
591
583
589
590
593
587
VF
_B
BY
[d
m³/m
in]
100
110
120
103
109
104
110
107
109
111
110
105
107
107
116
108
107
105
111
112
106
SM
_V
AL
[F
SN
]
0.0
0.1
0.2
N [
1/m
in]
2080
2120 2113
2113
2113
2113
2113
2113
2113
2113
2113
2113
2113
2113
2113
2113
2113
2113
2113
2113
RT
CB
AL
TP
[%
]
99
100
101
102
99.9 100.2
100.1
99.9
100.3
100.0
100.1
100.0
100.1
100.0
99.8 1
00.1
100.2
100.2
99.7
100.1
99.7
99.6
MF
_IA
[kg
/h]
560
580
600
620
594
594
594
594
594
594
594
593
593
594
593
594
593
592
593
592
593
592
LA
V [
1]
1.40
1.45
1.50
1.44
1.43
1.44
1.44
1.44
1.44
1.45
1.44
1.44
1.44
1.44
1.44
1.44
1.45
1.42
1.42
1.42 1.43BS
FC
_N
TS
[g
/kW
.h]
216
217
218
217.6
217.3
217.0
217.4
217.2
217.1
217.4
217.5
217.4
216.8
216.8
216.9
216.8
217.0
217.7
217.0
217.4
216.9
REF3: WHSC-Mode 10 / 2113rpm/100%
no smoke measurement
BS
FC
[g/k
Wh]
example here on the 6
first values :
U95,6 = 0.2 g/kWh (0.1%
of the average of the 6
BSFC measurements)

7 Any unauthorized copying, disclosure or distribution of the presentation is strictly forbidden
What is a “good enough” measurement uncertainty then? example with Modelling based on DoE
With DOE the testbed
effort can be reduced by
up to 90% (typ. 60%)
Prerequisite to gain the
benefit are repeatable
measurement results =
low measurement
uncertainty
in this example, to
generate the required
DOE model with a certain
confidence level, 10 times
more measurement points
are required if the
repeatability is +/-
3,5g/kWh instead of +/-
1g/kWh
an uncertainty @95% around ~ 1 g/kWh or less is usually required for efficient testing

8 Any unauthorized copying, disclosure or distribution of the presentation is strictly forbidden
Evaluation of Type A : Pros & Cons
PROS • easy to setup and automate with a
running engine
• gives a good estimation of the
repeatability one can obtain in given
conditions at a given operating point.
• can be easily combined with the
measurement of Speed / Torque in
order to check the uncertainty of the
specific fuel consumption
measurements
CONS • can not evaluate the systematic
uncertainty due to a wrongly calibrated
or drifting sensor (this effect is “hidden”
in the measurement).
• if the engine is not perfectly stable, this
instability will be included in the
calculated measurement uncertainty. it
is not always possible to distinguish
between the engine “uncertainty” and
the uncertainty of the fuel system +
installation.
The systematic uncertainty will impact especially the
comparison of measurements with other methods (e.g
Carbon Balance) or the reproducibility when performing
the same measurements on the same engine but in
another testcell with a different fuel system.

9 Any unauthorized copying, disclosure or distribution of the presentation is strictly forbidden
Sources of Systematic Uncertainties
• The adjustment of the sensor reduces the systematic measurement uncertainty to a
minimum value in comparison to a given measurement standard.
e.g : 0.1% @95% for an AVL FuelExact Mass Flow Sensor, incl. the systematic
measurement uncertainty of the calibration testbed itself.
•other systematic uncertainties : non-linearities between calibration points, Drift,
temperature influence…etc. Those can be significant !
systematic bias (repeatable) are
existing between the reference (e.g:
ISO17025 calibration testbed) and
the measurements of the sensor
before calibration
adjustment of sensor
after calibration
the bias are minimized down to a
limit value that is depending on the
calibration procedure and the
calibration testbed capabilities
REF REF

10
Any unauthorized copying, disclosure or distribution
of the presentation is strictly forbidden
Stochastic Uncertainties = all other effects that can not be compensated in calibration
Stochastic Uncertainties
Temp. Variation
Pressure Variation
Engine Others
(bubbles..etc)
Noise of the
Sensor
those effects have the following
properties :
• Usually, the lower the measured flow
rate, the higher is their relative impact
• they can be specific to the sensor
technology (e.g : sensor “natural”
noise)
• Contrary to popular belief, they can
not always be compensated by
extending the measurement time
• They are usually minimized by
optimizing the fuel system and
respecting best practices of
installation
The Engine is also a stochastic source
of uncertainty as it is never 100% stable.
The repeatability of the speed / torque
control impacts as well the
measurement uncertainty of the BSFC

11
How can I evaluate practically the measurement
uncertainty in my testfield?
12 Any unauthorized copying, disclosure or distribution of the presentation is strictly forbidden
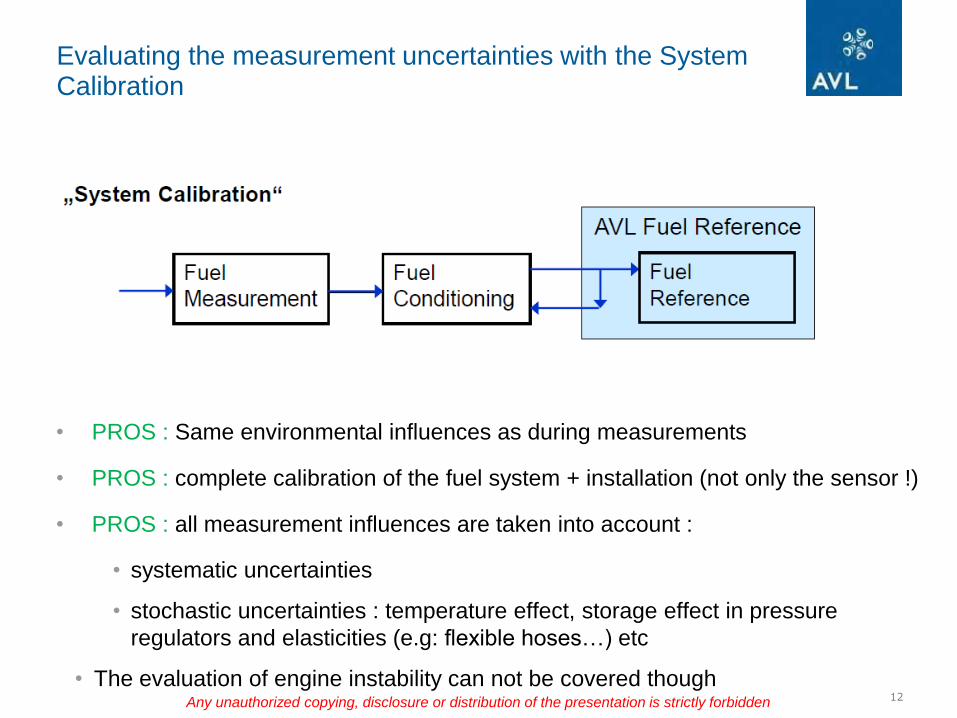
Evaluating the measurement uncertainties with the System Calibration
• PROS : Same environmental influences as during measurements
• PROS : complete calibration of the fuel system + installation (not only the sensor !)
• PROS : all measurement influences are taken into account :
• systematic uncertainties
• stochastic uncertainties : temperature effect, storage effect in pressure
regulators and elasticities (e.g: flexible hoses…) etc
• The evaluation of engine instability can not be covered though

13 Any unauthorized copying, disclosure or distribution of the presentation is strictly forbidden
Example of setup at the testbed
Cooling water
Fuel
Supply
By-pass
Fuel Line to engine
Fuel Line from engine
RS232, TCP/IP or TTL/OC
Ethernet
Interface connection
Engine
Fuel Consumption: Defined
mass flow in Calibration procedure Fuel
Supply
Fuel
Return
Hydraulic connection
AVL Fuel Reference PC: Software FCC
FUEL SYSTEM

14
Real-Life Measurement Quality Evaluation

15 Any unauthorized copying, disclosure or distribution of the presentation is strictly forbidden
Anonymous Polling :
In my testfield, I always have very good
comparison of FC measurements between
different testcells, even at low flow rate
In my testfield, it is sometimes hard to
compare FC measurements on the
same engine in different testcells using different fuel systems, especially
at low flow rate
I do not know the status
(e.g : because fuel consumption is not my
area of expertise or other reasons)
1 2 3
which of this statement do you feel is more corresponding to your situation?
please write on the small piece of paper the number 1, 2 or 3 corresponding to
you situation.

16 Any unauthorized copying, disclosure or distribution of the presentation is strictly forbidden
results 44 participants*
12.5%
46.6% 40.9%
0.0%
10.0%
20.0%
30.0%
40.0%
50.0%
Answer1
Answer2
Answer3
In my testfield, I always have very good
comparison of FC measurements between
different testcells, even at low flow rate
In my testfield, it is sometimes hard to
compare FC measurements on the
same engine in different testcells using different fuel systems, especially
at low flow rate
I do not know the status
(e.g : because fuel consumption is not my
area of expertise or other reasons)
1 2 3
*one of the answer was 1.5…
17 Any unauthorized copying, disclosure or distribution of the presentation is strictly forbidden
AVL Measurement Quality Program for Fuel Consumption Measurement
• Aim :
Assess the quality of the fuel consumption measurements for each different
type of fuel system present in the testfield.
• How :
• Complete installation check
• System calibration with AVL Fuel Reference
• Test Run Protocol showing deviation between Fuel Reference & UUT as
well as measurement uncertainty according to Type A evaluation.
18 Any unauthorized copying, disclosure or distribution of the presentation is strictly forbidden
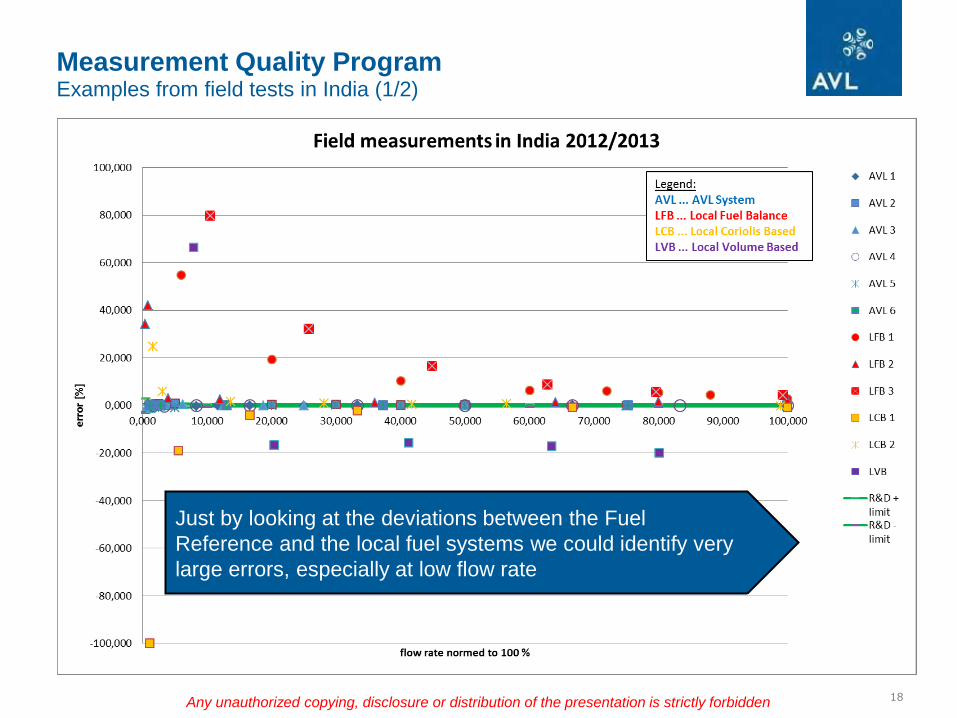
Measurement Quality Program Examples from field tests in India (1/2)
Just by looking at the deviations between the Fuel
Reference and the local fuel systems we could identify very
large errors, especially at low flow rate

19 Any unauthorized copying, disclosure or distribution of the presentation is strictly forbidden
Main reasons for errors were :
• calibration errors, drift errors of the sensor
• poor temperature conditioning (well above +/- 0.02°C)
• non optimized installation
Measurement Quality Program Examples from field tests in India (1/2)
Any unauthorized copying, disclosure or distribution
of the presentation is strictly forbidden

20 Any unauthorized copying, disclosure or distribution of the presentation is strictly forbidden
Other Test Run Protocol (ISO)

21 Any unauthorized copying, disclosure or distribution of the presentation is strictly forbidden
• Evaluating measurement uncertainty & repeatability is critical to
perform efficient engine optimization.
• During engine testing, it is easily possible to evaluate the
measurement uncertainty due to stochastic parameters using
simple statistical analysis of repetition points (largest influences
being : temperature stability, storage effect, sensor noise, engine
stability) .
• It is however not possible to figure out the measurement
uncertainty due to systematic effects without comparing the
measurement of the fuel system against a reference value. These
errors can become very large using a non optimized fuel
system/installation, especially in engine part-load (=low fuel
consumption!)
• AVL offers Measurement Quality Programs aimed at evaluating the
overall measurement uncertainty and providing counsel on how to
reach state-of-the-art measurement quality for best testing
efficiency.
Fuel Consumption Measurement Uncertainty
How can I evaluate the quality of my measurement results?

22 Any unauthorized copying, disclosure or distribution of the presentation is strictly forbidden
Other materials & to contact the presenter
attached to the presentation is the GUM and a “beginners guide to
measurement uncertainty” that I found on internet.
if you have further questions or if you wish to have an assessment of your
measurement uncertainty and quality in your own testfield, please do not
hesitate to contact me :
Romain LARDET, AVL Graz, Austria
email : [email protected]
tel : +43 316 787 1935
You can also get in contact with me via your local AVL UK account manager
and refer to this workshop.
Thank you for your participation and encouraging comments !
Sincerely,
Romain