Embed Size (px)
Citation preview
River plumes as a source of large-amplitude internalwaves in the coastal oceanJonathan D. Nash1 & James N. Moum1
Satellite images have long revealed the surface expression of largeamplitude internal waves that propagate along density interfacesbeneath the sea surface1–3. Internal waves are typically the mostenergetic high-frequency events in the coastal ocean4–6, displacingwater parcels by up to 100 m and generating strong currents andturbulence7 that mix nutrients into near-surface waters for bio-logical utilization. While internal waves are known to be gener-ated by tidal currents over ocean-bottom topography8–13, they havealso been observed frequently in the absence of any apparent tide–topography interactions1,7,14. Here we present repeated measure-ments of velocity, density and acoustic backscatter across theColumbia River plume front. These show how internal wavescan be generated from a river plume that flows as a gravity currentinto the coastal ocean. We find that the convergence of horizontalvelocities at the plume front causes frontal growth and subsequentdisplacement downward of near-surface waters. Individual freelypropagating waves are released from the river plume front whenthe front’s propagation speed decreases below the wave speed inthe water ahead of it. This mechanism generates internal waves ofsimilar amplitude and steepness as internal waves from tide–topography interactions observed elsewhere11, and is thereforeimportant to the understanding of coastal ocean mixing.It is generally assumed that internal waves radiate from locations
where tidal currents flow over topographic features such as shelf-breaks10, banks11 and sills12,13. In the last case, waves formed down-stream of a sill are trapped to the topography when their wavespeed cequals that of the opposing tidal flow u. They are released andpropagate upstream as free waves when u slackens below c (refs 8, 9,15). The Froude number F ¼ u/c # 1 sets the criterion for free wavepropagation.In the atmosphere, gravity currents16 are well-known to excite
large-amplitude waves. Perhaps the most famous is the ‘MorningGlory’, a series of ,500-m amplitude undulations over the Gulf ofCarpenteria off northern Australia17,18. Wave generation from gravitycurrents has also been observed in thunderstorm outflows19 andmountain slope drainage winds20. However, the large scales ofatmospheric flows make it difficult to obtain the detailed measure-ments necessary to show the process by which freely propagatingwaves emerge from a gravity current. Although laboratory exper-iments21,22 have helped to show this evolution, these experimentswere limited to small, sub-geophysical scales. Neither atmosphericnor laboratory observations have clearly defined the criterion forwave release.Rivers issue into the coastal ocean as tidally modulated pulses of
fresh water that form positively buoyant gravity currents23. Theevolving properties of these gravity currents are determined by theinitial momentum at the river’s mouth, by interactions with coastalcurrents and winds, and by the Earth’s rotation, which tends to turnthe current to the right in the Northern Hemisphere. These factors all
affect the location, propagation speed and sharpness of the gravitycurrent front.Satellite images capture single snapshots of waves radiating from
the mouth of the Columbia River (Fig. 1; refs 1, 2). However, theyprovide no information on the waves’ internal structure. Nor do theyshow the sequence of events leading to their generation, since theseimages are acquired infrequently (,1 per day). Our recent in situobservations across a front at the northern edge of the tidally pulsingColumbia River plume provide the necessary sequencing to clearlydefine the condition for the formation of large-amplitude internalwaves from a gravity current. By analogy to topographic release ofwaves from a sill, this condition is described in terms of a Froudenumber.Satellite sea surface temperature (SST) distinguishes the warm,
summertime plume from cold, recently upwelled coastal waters (Fig.2a–c) on 23 July 2004. High tide coincided with the image shown inFig. 2a. Plume remnants from the previous tidal cycle’s dischargeappear in the offshore thermal structure. Ebb currents started to flow
LETTERS
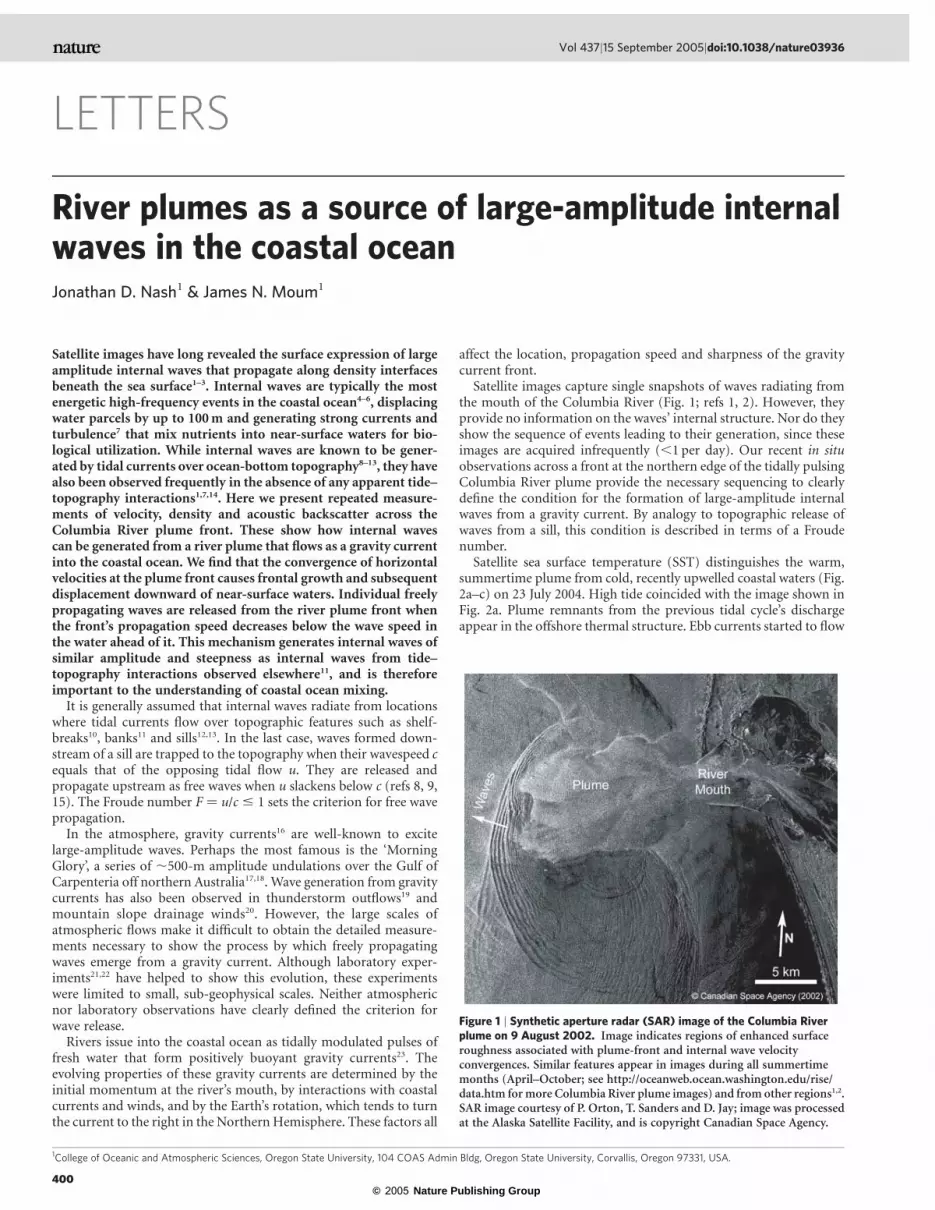
Figure 1 | Synthetic aperture radar (SAR) image of the Columbia Riverplume on 9 August 2002. Image indicates regions of enhanced surfaceroughness associated with plume-front and internal wave velocityconvergences. Similar features appear in images during all summertimemonths (April–October; see http://oceanweb.ocean.washington.edu/rise/data.htm for more Columbia River plume images) and from other regions1,2.SAR image courtesy of P. Orton, T. Sanders and D. Jay; image was processedat the Alaska Satellite Facility, and is copyright Canadian Space Agency.
1College of Oceanic and Atmospheric Sciences, Oregon State University, 104 COAS Admin Bldg, Oregon State University, Corvallis, Oregon 97331, USA.
Vol 437|15 September 2005|doi:10.1038/nature03936
400© 2005 Nature Publishing Group
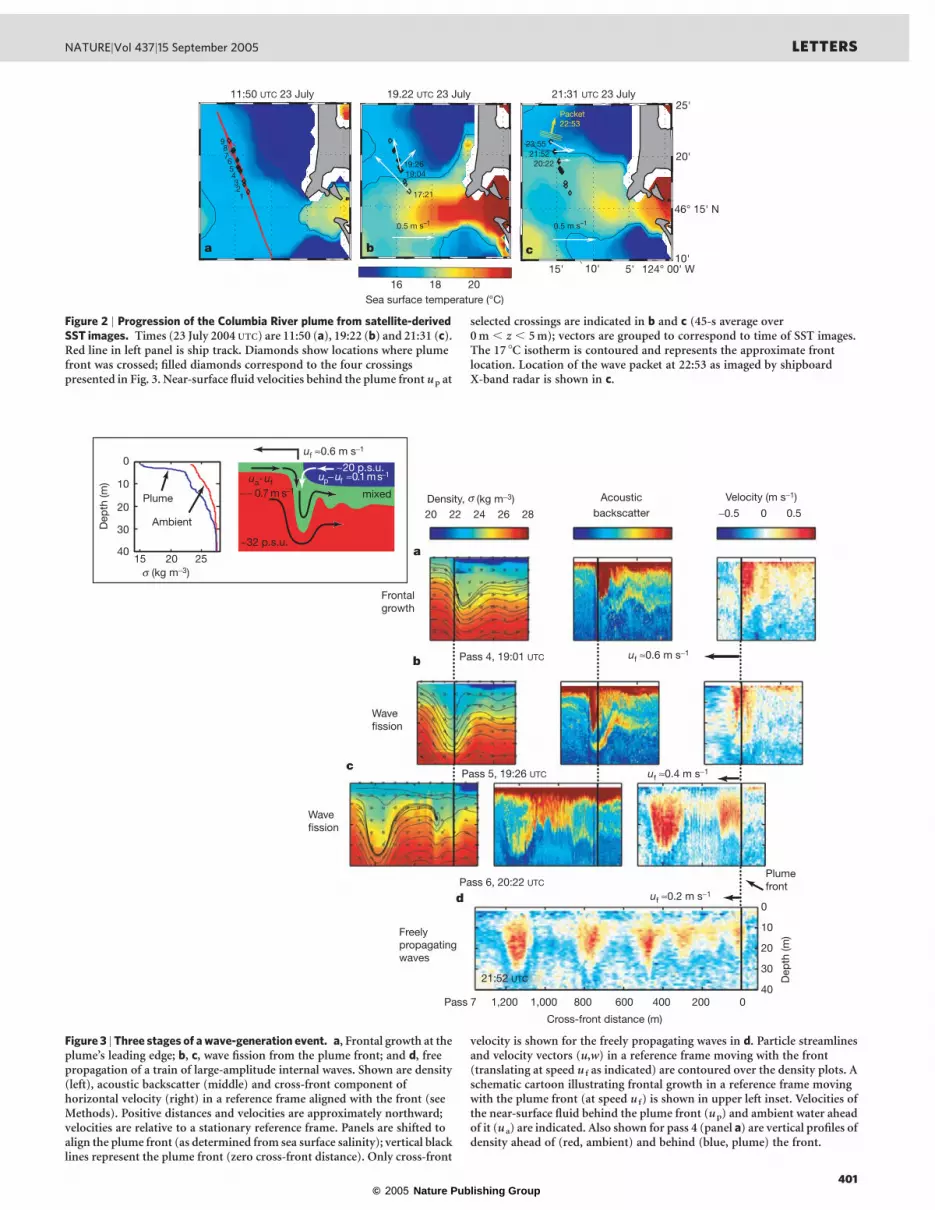
Figure 2 | Progression of the Columbia River plume from satellite-derivedSST images. Times (23 July 2004 UTC) are 11:50 (a), 19:22 (b) and 21:31 (c).Red line in left panel is ship track. Diamonds show locations where plumefront was crossed; filled diamonds correspond to the four crossingspresented in Fig. 3. Near-surface fluid velocities behind the plume front up at
selected crossings are indicated in b and c (45-s average over0 m , z , 5 m); vectors are grouped to correspond to time of SST images.The 17 8C isotherm is contoured and represents the approximate frontlocation. Location of the wave packet at 22:53 as imaged by shipboardX-band radar is shown in c.
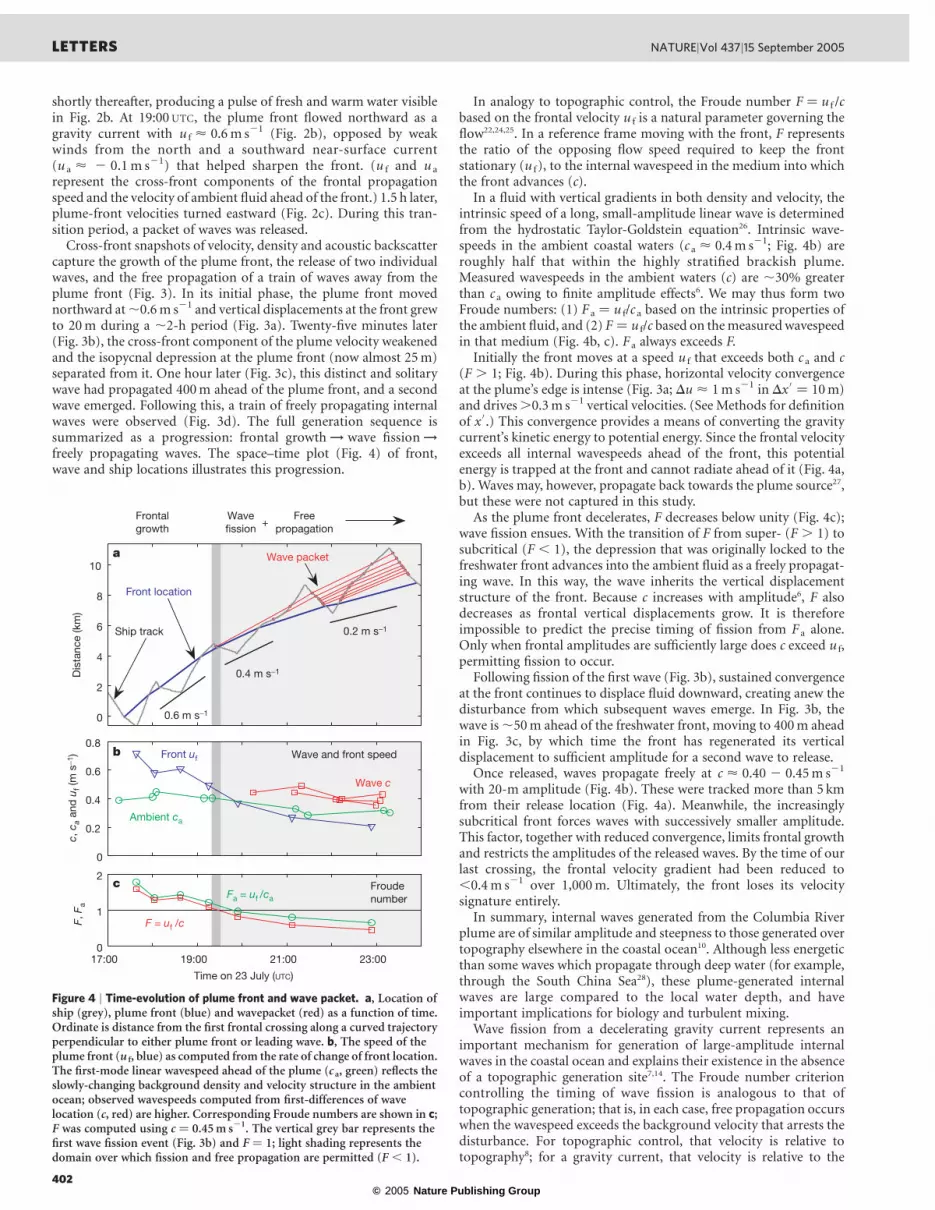
Figure 3 |Three stages of awave-generation event. a, Frontal growth at theplume’s leading edge; b, c, wave fission from the plume front; and d, freepropagation of a train of large-amplitude internal waves. Shown are density(left), acoustic backscatter (middle) and cross-front component ofhorizontal velocity (right) in a reference frame aligned with the front (seeMethods). Positive distances and velocities are approximately northward;velocities are relative to a stationary reference frame. Panels are shifted toalign the plume front (as determined from sea surface salinity); vertical blacklines represent the plume front (zero cross-front distance). Only cross-front
velocity is shown for the freely propagating waves in d. Particle streamlinesand velocity vectors (u,w) in a reference frame moving with the front(translating at speed u f as indicated) are contoured over the density plots. Aschematic cartoon illustrating frontal growth in a reference frame movingwith the plume front (at speed u f) is shown in upper left inset. Velocities ofthe near-surface fluid behind the plume front (up) and ambient water aheadof it (u a) are indicated. Also shown for pass 4 (panel a) are vertical profiles ofdensity ahead of (red, ambient) and behind (blue, plume) the front.
NATURE|Vol 437|15 September 2005 LETTERS
401© 2005 Nature Publishing Group
shortly thereafter, producing a pulse of fresh and warm water visiblein Fig. 2b. At 19:00 UTC, the plume front flowed northward as agravity current with u f < 0.6m s21 (Fig. 2b), opposed by weakwinds from the north and a southward near-surface current(u a < 2 0.1m s21) that helped sharpen the front. (u f and u a
represent the cross-front components of the frontal propagationspeed and the velocity of ambient fluid ahead of the front.) 1.5 h later,plume-front velocities turned eastward (Fig. 2c). During this tran-sition period, a packet of waves was released.Cross-front snapshots of velocity, density and acoustic backscatter
capture the growth of the plume front, the release of two individualwaves, and the free propagation of a train of waves away from theplume front (Fig. 3). In its initial phase, the plume front movednorthward at,0.6m s21 and vertical displacements at the front grewto 20m during a ,2-h period (Fig. 3a). Twenty-five minutes later(Fig. 3b), the cross-front component of the plume velocity weakenedand the isopycnal depression at the plume front (now almost 25m)separated from it. One hour later (Fig. 3c), this distinct and solitarywave had propagated 400m ahead of the plume front, and a secondwave emerged. Following this, a train of freely propagating internalwaves were observed (Fig. 3d). The full generation sequence issummarized as a progression: frontal growth ! wave fission !freely propagating waves. The space–time plot (Fig. 4) of front,wave and ship locations illustrates this progression.
In analogy to topographic control, the Froude number F ¼ u f /cbased on the frontal velocity u f is a natural parameter governing theflow22,24,25. In a reference frame moving with the front, F representsthe ratio of the opposing flow speed required to keep the frontstationary (u f), to the internal wavespeed in the medium into whichthe front advances (c).In a fluid with vertical gradients in both density and velocity, the
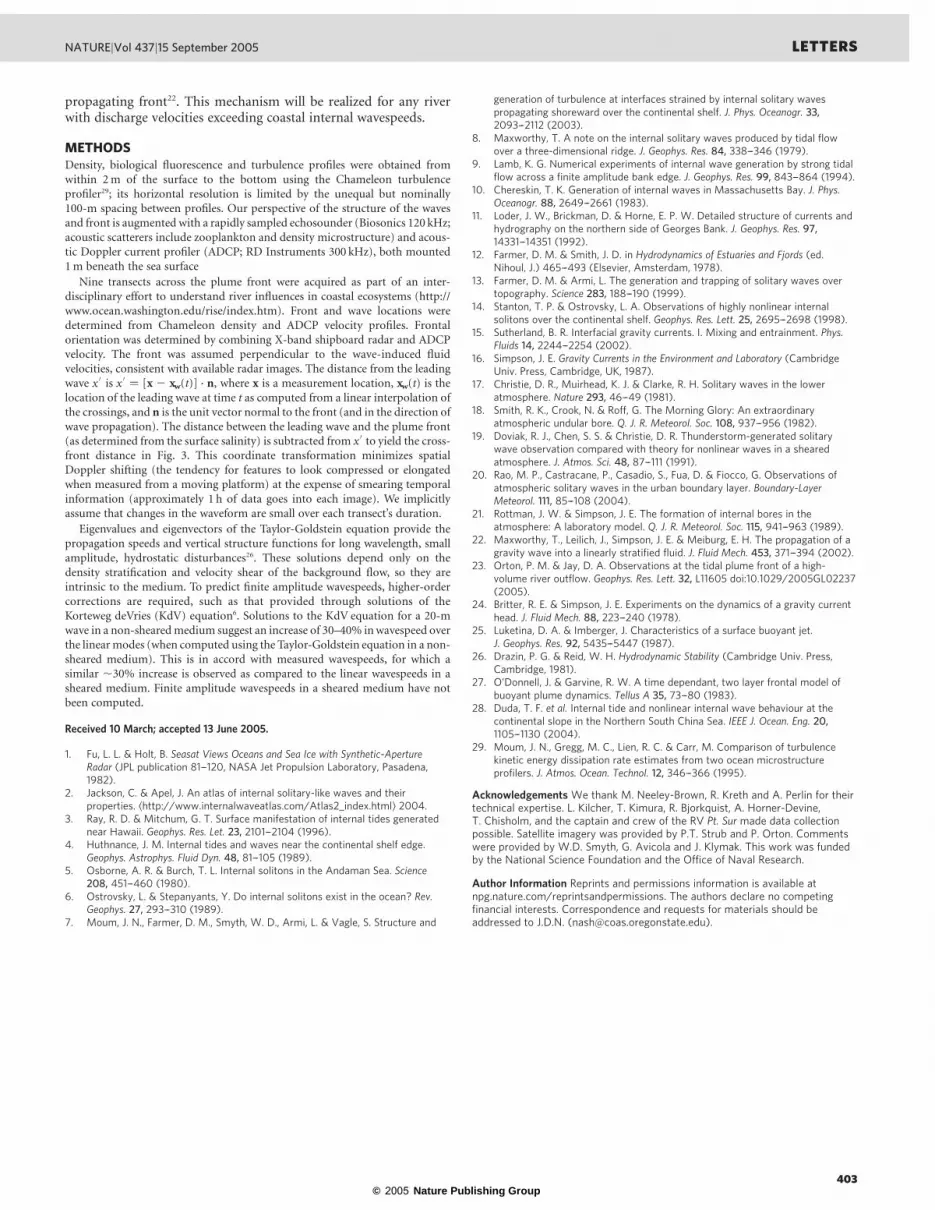
intrinsic speed of a long, small-amplitude linear wave is determinedfrom the hydrostatic Taylor-Goldstein equation26. Intrinsic wave-speeds in the ambient coastal waters (c a < 0.4m s21; Fig. 4b) areroughly half that within the highly stratified brackish plume.Measured wavespeeds in the ambient waters (c) are ,30% greaterthan c a owing to finite amplitude effects6. We may thus form twoFroude numbers: (1) F a ¼ u f/c a based on the intrinsic properties ofthe ambient fluid, and (2) F ¼ u f/c based on themeasuredwavespeedin that medium (Fig. 4b, c). Fa always exceeds F.Initially the front moves at a speed u f that exceeds both c a and c
(F . 1; Fig. 4b). During this phase, horizontal velocity convergenceat the plume’s edge is intense (Fig. 3a; Du < 1m s21 in Dx
0¼ 10m)
and drives.0.3m s21 vertical velocities. (See Methods for definitionof x
0.) This convergence provides a means of converting the gravity
current’s kinetic energy to potential energy. Since the frontal velocityexceeds all internal wavespeeds ahead of the front, this potentialenergy is trapped at the front and cannot radiate ahead of it (Fig. 4a,b). Waves may, however, propagate back towards the plume source27,but these were not captured in this study.As the plume front decelerates, F decreases below unity (Fig. 4c);
wave fission ensues. With the transition of F from super- (F . 1) tosubcritical (F , 1), the depression that was originally locked to thefreshwater front advances into the ambient fluid as a freely propagat-ing wave. In this way, the wave inherits the vertical displacementstructure of the front. Because c increases with amplitude6, F alsodecreases as frontal vertical displacements grow. It is thereforeimpossible to predict the precise timing of fission from F a alone.Only when frontal amplitudes are sufficiently large does c exceed u f,permitting fission to occur.Following fission of the first wave (Fig. 3b), sustained convergence
at the front continues to displace fluid downward, creating anew thedisturbance from which subsequent waves emerge. In Fig. 3b, thewave is,50m ahead of the freshwater front, moving to 400m aheadin Fig. 3c, by which time the front has regenerated its verticaldisplacement to sufficient amplitude for a second wave to release.Once released, waves propagate freely at c < 0.40 2 0.45m s21
with 20-m amplitude (Fig. 4b). These were tracked more than 5 kmfrom their release location (Fig. 4a). Meanwhile, the increasinglysubcritical front forces waves with successively smaller amplitude.This factor, together with reduced convergence, limits frontal growthand restricts the amplitudes of the released waves. By the time of ourlast crossing, the frontal velocity gradient had been reduced to,0.4m s21 over 1,000m. Ultimately, the front loses its velocitysignature entirely.In summary, internal waves generated from the Columbia River
plume are of similar amplitude and steepness to those generated overtopography elsewhere in the coastal ocean10. Although less energeticthan some waves which propagate through deep water (for example,through the South China Sea28), these plume-generated internalwaves are large compared to the local water depth, and haveimportant implications for biology and turbulent mixing.Wave fission from a decelerating gravity current represents an
important mechanism for generation of large-amplitude internalwaves in the coastal ocean and explains their existence in the absenceof a topographic generation site7,14. The Froude number criterioncontrolling the timing of wave fission is analogous to that oftopographic generation; that is, in each case, free propagation occurswhen the wavespeed exceeds the background velocity that arrests thedisturbance. For topographic control, that velocity is relative totopography8; for a gravity current, that velocity is relative to the
Figure 4 | Time-evolution of plume front and wave packet. a, Location ofship (grey), plume front (blue) and wavepacket (red) as a function of time.Ordinate is distance from the first frontal crossing along a curved trajectoryperpendicular to either plume front or leading wave. b, The speed of theplume front (u f, blue) as computed from the rate of change of front location.The first-mode linear wavespeed ahead of the plume (ca, green) reflects theslowly-changing background density and velocity structure in the ambientocean; observed wavespeeds computed from first-differences of wavelocation (c, red) are higher. Corresponding Froude numbers are shown in c;F was computed using c ¼ 0.45 m s21. The vertical grey bar represents thefirst wave fission event (Fig. 3b) and F ¼ 1; light shading represents thedomain over which fission and free propagation are permitted (F , 1).
LETTERS NATURE|Vol 437|15 September 2005
402© 2005 Nature Publishing Group
propagating front22. This mechanism will be realized for any riverwith discharge velocities exceeding coastal internal wavespeeds.
METHODSDensity, biological fluorescence and turbulence profiles were obtained fromwithin 2m of the surface to the bottom using the Chameleon turbulenceprofiler29; its horizontal resolution is limited by the unequal but nominally100-m spacing between profiles. Our perspective of the structure of the wavesand front is augmented with a rapidly sampled echosounder (Biosonics 120 kHz;acoustic scatterers include zooplankton and density microstructure) and acous-tic Doppler current profiler (ADCP; RD Instruments 300 kHz), both mounted1m beneath the sea surface
Nine transects across the plume front were acquired as part of an inter-disciplinary effort to understand river influences in coastal ecosystems (http://www.ocean.washington.edu/rise/index.htm). Front and wave locations weredetermined from Chameleon density and ADCP velocity profiles. Frontalorientation was determined by combining X-band shipboard radar and ADCPvelocity. The front was assumed perpendicular to the wave-induced fluidvelocities, consistent with available radar images. The distance from the leadingwave x 0 is x 0
¼ [x 2 xw(t)] · n, where x is a measurement location, xw(t) is thelocation of the leading wave at time t as computed from a linear interpolation ofthe crossings, and n is the unit vector normal to the front (and in the direction ofwave propagation). The distance between the leading wave and the plume front(as determined from the surface salinity) is subtracted from x 0 to yield the cross-front distance in Fig. 3. This coordinate transformation minimizes spatialDoppler shifting (the tendency for features to look compressed or elongatedwhen measured from a moving platform) at the expense of smearing temporalinformation (approximately 1 h of data goes into each image). We implicitlyassume that changes in the waveform are small over each transect’s duration.
Eigenvalues and eigenvectors of the Taylor-Goldstein equation provide thepropagation speeds and vertical structure functions for long wavelength, smallamplitude, hydrostatic disturbances26. These solutions depend only on thedensity stratification and velocity shear of the background flow, so they areintrinsic to the medium. To predict finite amplitude wavespeeds, higher-ordercorrections are required, such as that provided through solutions of theKorteweg deVries (KdV) equation6. Solutions to the KdV equation for a 20-mwave in a non-shearedmedium suggest an increase of 30–40% inwavespeed overthe linearmodes (when computed using the Taylor-Goldstein equation in a non-sheared medium). This is in accord with measured wavespeeds, for which asimilar ,30% increase is observed as compared to the linear wavespeeds in asheared medium. Finite amplitude wavespeeds in a sheared medium have notbeen computed.
Received 10 March; accepted 13 June 2005.
1. Fu, L. L. & Holt, B. Seasat Views Oceans and Sea Ice with Synthetic-ApertureRadar (JPL publication 81–-120, NASA Jet Propulsion Laboratory, Pasadena,1982).
2. Jackson, C. & Apel, J. An atlas of internal solitary-like waves and theirproperties. khttp://www.internalwaveatlas.com/Atlas2_index.htmll 2004.
3. Ray, R. D. & Mitchum, G. T. Surface manifestation of internal tides generatednear Hawaii. Geophys. Res. Let. 23, 2101–-2104 (1996).
4. Huthnance, J. M. Internal tides and waves near the continental shelf edge.Geophys. Astrophys. Fluid Dyn. 48, 81–-105 (1989).
5. Osborne, A. R. & Burch, T. L. Internal solitons in the Andaman Sea. Science208, 451–-460 (1980).
6. Ostrovsky, L. & Stepanyants, Y. Do internal solitons exist in the ocean? Rev.Geophys. 27, 293–-310 (1989).
7. Moum, J. N., Farmer, D. M., Smyth, W. D., Armi, L. & Vagle, S. Structure and
generation of turbulence at interfaces strained by internal solitary wavespropagating shoreward over the continental shelf. J. Phys. Oceanogr. 33,2093–-2112 (2003).
8. Maxworthy, T. A note on the internal solitary waves produced by tidal flowover a three-dimensional ridge. J. Geophys. Res. 84, 338–-346 (1979).
9. Lamb, K. G. Numerical experiments of internal wave generation by strong tidalflow across a finite amplitude bank edge. J. Geophys. Res. 99, 843–-864 (1994).
10. Chereskin, T. K. Generation of internal waves in Massachusetts Bay. J. Phys.Oceanogr. 88, 2649–-2661 (1983).
11. Loder, J. W., Brickman, D. & Horne, E. P. W. Detailed structure of currents andhydrography on the northern side of Georges Bank. J. Geophys. Res. 97,14331–-14351 (1992).
12. Farmer, D. M. & Smith, J. D. in Hydrodynamics of Estuaries and Fjords (ed.Nihoul, J.) 465–-493 (Elsevier, Amsterdam, 1978).
13. Farmer, D. M. & Armi, L. The generation and trapping of solitary waves overtopography. Science 283, 188–-190 (1999).
14. Stanton, T. P. & Ostrovsky, L. A. Observations of highly nonlinear internalsolitons over the continental shelf. Geophys. Res. Lett. 25, 2695–-2698 (1998).
15. Sutherland, B. R. Interfacial gravity currents. I. Mixing and entrainment. Phys.Fluids 14, 2244–-2254 (2002).
16. Simpson, J. E. Gravity Currents in the Environment and Laboratory (CambridgeUniv. Press, Cambridge, UK, 1987).
17. Christie, D. R., Muirhead, K. J. & Clarke, R. H. Solitary waves in the loweratmosphere. Nature 293, 46–-49 (1981).
18. Smith, R. K., Crook, N. & Roff, G. The Morning Glory: An extraordinaryatmospheric undular bore. Q. J. R. Meteorol. Soc. 108, 937–-956 (1982).
19. Doviak, R. J., Chen, S. S. & Christie, D. R. Thunderstorm-generated solitarywave observation compared with theory for nonlinear waves in a shearedatmosphere. J. Atmos. Sci. 48, 87–-111 (1991).
20. Rao, M. P., Castracane, P., Casadio, S., Fua, D. & Fiocco, G. Observations ofatmospheric solitary waves in the urban boundary layer. Boundary-LayerMeteorol. 111, 85–-108 (2004).
21. Rottman, J. W. & Simpson, J. E. The formation of internal bores in theatmosphere: A laboratory model. Q. J. R. Meteorol. Soc. 115, 941–-963 (1989).
22. Maxworthy, T., Leilich, J., Simpson, J. E. & Meiburg, E. H. The propagation of agravity wave into a linearly stratified fluid. J. Fluid Mech. 453, 371–-394 (2002).
23. Orton, P. M. & Jay, D. A. Observations at the tidal plume front of a high-volume river outflow. Geophys. Res. Lett. 32, L11605 doi:10.1029/2005GL02237(2005).
24. Britter, R. E. & Simpson, J. E. Experiments on the dynamics of a gravity currenthead. J. Fluid Mech. 88, 223–-240 (1978).
25. Luketina, D. A. & Imberger, J. Characteristics of a surface buoyant jet.J. Geophys. Res. 92, 5435–-5447 (1987).
26. Drazin, P. G. & Reid, W. H. Hydrodynamic Stability (Cambridge Univ. Press,Cambridge, 1981).
27. O’Donnell, J. & Garvine, R. W. A time dependant, two layer frontal model ofbuoyant plume dynamics. Tellus A 35, 73–-80 (1983).
28. Duda, T. F. et al. Internal tide and nonlinear internal wave behaviour at thecontinental slope in the Northern South China Sea. IEEE J. Ocean. Eng. 20,1105–-1130 (2004).
29. Moum, J. N., Gregg, M. C., Lien, R. C. & Carr, M. Comparison of turbulencekinetic energy dissipation rate estimates from two ocean microstructureprofilers. J. Atmos. Ocean. Technol. 12, 346–-366 (1995).
Acknowledgements We thank M. Neeley-Brown, R. Kreth and A. Perlin for theirtechnical expertise. L. Kilcher, T. Kimura, R. Bjorkquist, A. Horner-Devine,T. Chisholm, and the captain and crew of the RV Pt. Sur made data collectionpossible. Satellite imagery was provided by P.T. Strub and P. Orton. Commentswere provided by W.D. Smyth, G. Avicola and J. Klymak. This work was fundedby the National Science Foundation and the Office of Naval Research.
Author Information Reprints and permissions information is available atnpg.nature.com/reprintsandpermissions. The authors declare no competingfinancial interests. Correspondence and requests for materials should beaddressed to J.D.N. ([email protected]).
NATURE|Vol 437|15 September 2005 LETTERS
403© 2005 Nature Publishing Group