Embed Size (px)
Citation preview
Nonlinear Processes in Geophysics (2003) 10: 13–26Nonlinear Processesin Geophysicsc© European Geosciences Union 2003
Large amplitude solitary waves in and near the Earth’smagnetosphere, magnetopause and bow shock:Polar and Cluster observations
C. Cattell1, C. Neiman1, J. Dombeck1, J. Crumley1, J. Wygant1, C. A. Kletzing2, W. K. Peterson3, F. S. Mozer4, andM. Andr e5
1School of Physics and Astronomy, University of Minnesota, Minneapolis, MN 55455, USA2Dept. of Physics and Astronomy, University of Iowa, Iowa City, IA 52242, USA3Lockheed Martin Space Sciences Laboratory, Palo Alto, CA 94304, USA4Space Sciences Laboratory, University of California, Berkeley, CA 94720, USA5Swedish Institute for Space Physics, Uppsala, Sweden
Received: 29 November 2001 – Revised: 12 March 2002 – Accepted: 27 March 2002
Abstract. Solitary waves with large electric fields (up to100’s of mV/m) have been observed throughout the magne-tosphere and in the bow shock. We discuss observations byPolar at high altitudes (∼ 4–8RE), during crossings of theplasma sheet boundary and cusp, and new measurements byPolar at the equatorial magnetopause and by Cluster near thebow shock, in the cusp and at the plasma sheet boundary. Wedescribe the results of a statistical study of electron solitarywaves observed by Polar at high altitudes. The mean solitarywave duration was∼2 ms. The waves have velocities from∼ 1000 km/s to> 2500 km/s. Observed scale sizes (paral-lel to the magnetic field) are on the order of 1–10λD, withe8/kTe from ∼ 0.01 toO(1). The average speed of solitarywaves at the plasma sheet boundary is faster than the aver-age speed observed in the cusp and at cusp injections. Theamplitude increases with both velocity and scale size. Theseobservations are all consistent with the identification of thesolitary waves as electron hole modes. We also report thediscovery of solitary waves at the magnetopause, observed inPolar data obtained at the subsolar equatorial magnetopause.Both positive and negative potential structures have been ob-served with amplitudes up to∼ 25 mV/m. The velocitiesrange from 150 km/s to> 2500 km/s, with scale sizes the or-der of a kilometer (comparable to the Debye length). Initialobservations of solitary waves by the four Cluster satellitesare utilized to discuss the scale sizes and time variability ofthe regions where the solitary waves occur. Preliminary re-sults from the four Cluster satellites have given a glimpse ofthe spatial and temporal variability of the occurrence of soli-tary waves and their association with other wave modes. In
Correspondence to:C. Cattell([email protected])
all the events studied, significant differences were observedin the waveforms observed simultaneously at the four loca-tions separated by∼ 1000 km. When solitary waves wereseen at one satellite, they were usually also seen at the othersatellites within an interval of a few seconds. In associationwith an energetic electron injection and a highly compressedmagnetosphere, Cluster has observed the largest amplitudesolitary waves (> 750 mV/m) ever reported in the outer mag-netosphere.
1 Introduction
Solitary waves have been identified throughout the Earth’smagnetosphere at narrow boundaries, such as the plasmasheet boundary (Matsumoto et al., 1994; Franz et al., 1998;Cattell et al., 1999) and the bow shock (Bale et al., 1998;Mangeney et al., 1999), and in strong currents, such as thoseassociated with auroral acceleration region (Temerin et al.,1982; Bostrom et al., 1988; Mozer et al., 1997; Ergun etal., 1998). They have also been seen at the high altitude po-lar cap boundary (Tsurutani et al., 1998), the high-latitudecusp boundary layer (Pickett et al., 1999), at high altitudecusp injections (Cattell et al., 2001b), and within the solarwind (Magenay et al., 1999). Recently Cattell et al. (2002)have reported the first observations of solitary waves at themagnetopause. Almost all of these observations have beenof electron solitary waves, which are seen both at high andlow altitudes and are observed for wide range offce/fpe.In contrast, to date, ion solitary waves have only been ob-served in the auroral zone at low altitudes in the region wherefce/fpe � 1. Recent studies of ion solitary waves in theauroral zone have been presented by Bounds et al. (1999),
14 C. Cattell et al.: Large amplitude solitary waves in and near the Earth’s magnetosphere
Crumley et al. (2001) and Dombeck et al. (2001). Solitarywaves are usually observed as a symmetric bipolar pulse inthe electric field component parallel to the geomagnetic field.Other shapes, such as three pulses (Mangenay et al., 1999)and offset bipolar pulses (Tsurutani et al., 1998), have alsobeen described.
In this paper, we describe the results of a statistical studyof large amplitude electron solitary waves observed at theplasma sheet boundary, and at the high altitude cusp and cuspinjections using the Polar EFI instrument. We also presentexamples of solitary waves at the magnetopause obtained asthe Polar orbit precessed into the subsolar magnetopause. Inaddition, we show initial examples of solitary waves fromthe four Cluster satellites in several different regions of themagnetosphere.
The electric field and spacecraft potential measurementsutilized herein for the Polar studies were made by the dou-ble probe electric field instrument (Harvey et al., 1995). Thisinstrument, which saturates at∼ 1 V/m, obtains 3D measure-ments of the electric field in bursts (waveform capture) ofhigh-time resolution data. Data obtained at two differentburst rates (1600 and 8000 samples/s) are shown herein. ThePolar high data rate bursts are not filtered. This was doneto insure that the timing would be accurate (no frequencydependent phase shifts) and that the waveforms were not dis-torted by filtering. The low data rate bursts (not used fortiming) have a 2-pole filter at 500 Hz. The top frequencyshown in all the Polar spectra is the Nyquist frequency. Inaddition to the electric field (potential difference between op-posing probes), the spacecraft potential was utilized to indi-cate changes in density (Pedersen, 1995). The delay timesbetween signals at opposing probes were examined using across-correlation analysis to estimate the propagation speedof electric field structures, utilizing an automatic programthat first identifies bipolar pulses in the parallel componentof the electric field data in the magnetic field-aligned coor-dinate system. The largest velocities which can be measured(∼ 2500 km/s) correspond to the resolution of the time delayand depend on the boom orientation. Events where no timedelay could be measured are included in the statistics as “in-finite velocity”. The automatic program used to calculate ve-locity also determines the structure width and solitary waveamplitude. Note that the method yields scale sizes which areapproximately a factor of 4 larger than those obtained whenthe potential is fit to a Gaussian, since the duration of thesolitary wave is based on the gradient in the parallel electricfield changing its sign rather than on the Gaussian half-width.Details of this procedure and sample cross-correlation anal-ysis are described elsewhere (Dombeck et al., 2001). Onlythe high rate data are utilized for timing and statistical stud-ies. Note that wave amplitudes are given for the maximumelectric field, not for the peak-to-peak amplitude. The ACmagnetic field from the search coils (Gurnett et al., 1995)were sampled in the burst memory at the same rate as theelectric field. DC magnetic field data, obtained from thefluxgate magnetometers (Russell et al., 1995) were utilizedto determine the location of the boundaries. In addition, ion
composition measurements made by the TIMAS instrument(Shelley et al., 1995) were examined to determine the proba-ble source region and plasma characteristics. Hydra (Scudderet al., 1995) provided additional information on the particledistributions and moments in these regions.
The data for the Cluster study were obtained as the Clus-ter satellites traversed the bow shock, magnetopause, cuspand the plasma sheet boundary. The electric field and space-craft potential measurements were made by the double probeelectric field instruments (Gustaffson et al., 1988), whichwere designed to obtain bursts of high-time resolution datain many different modes. Electric field data at frequenciesfrom DC to Nyquist frequency of 9 kHz were obtained in thewaveform captures described herein. The Cluster data shownare filtered with a 2-pole low pass filter at 4 kHz. The filterswere designed so that there were no frequency-dependentphase shifts, again so that the timing and the shapes of thewaveforms would be accurate. Spectra are shown up to4 kHz. Single probe measurements were not transmitted forthe events described herein, so solitary wave velocities couldnot be measured. The spacecraft potential was used to pro-vide preliminary identification of the various boundaries andfor determining boundary orientation and velocity. Note thatthe Cluster instruments only measure the electric field in thespin plane (approximately the ecliptic plane).
2 Polar discovery of solitary waves at the magnetopause
The precession of the Polar orbit so that apogee is in theequatorial plane has enabled a study of the subsolar, low-latitude magnetopause with a modern suite of instruments.During March and April 2001, Polar repeatedly encounteredthe magnetopause. Cattell et al. (2002) reported the discov-ery of solitary waves in waveform capture data obtained atthese magnetopause crossings. The three-dimensional natureof the Polar electric field instrument was critical for this dis-covery because the dominant component of the geomagneticfield is in theZ direction (out of the ecliptic plane). Two-dimensional instruments, which measure the component ofthe electric field in thex − y (ecliptic) plane, would not usu-ally be able to observe solitary waves.
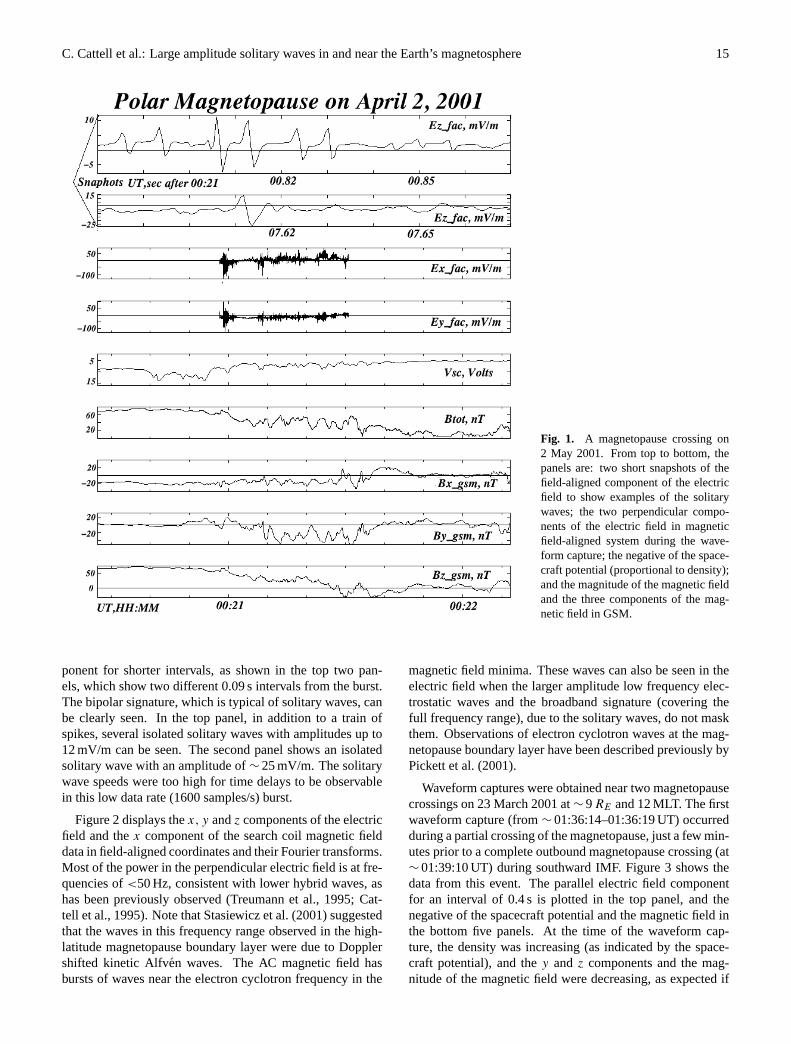
An example of an equatorial magnetopause crossing on2 May 2001 at 9.4RE and 11.6 MLT, when the interplan-etary magnetic field (IMF) was southward, is presented inFig. 1. The transition from the magnetosphere (low density)to the magnetosheath (high density) can be clearly seen inthe negative of the spacecraft potential (fifth panel) whichis proportional to density. The transition is also clear in themagnetic field in geocentric solar magnetospheric (GSM) co-ordinates (panels 6–9). The electric field waveform capturewas obtained throughout the magnetopause current layer, andpart of the∼34 s burst extended into the magnetosheath. Thetwo perpendicular components in magnetic field-aligned co-ordinates (shown in panels 3 and 4) have very large ampli-tude waves (up to∼ 150 mV/m). In order to see the solitarywave signatures, it is necessary to look at the parallel com-
C. Cattell et al.: Large amplitude solitary waves in and near the Earth’s magnetosphere 15
Fig. 1. A magnetopause crossing on2 May 2001. From top to bottom, thepanels are: two short snapshots of thefield-aligned component of the electricfield to show examples of the solitarywaves; the two perpendicular compo-nents of the electric field in magneticfield-aligned system during the wave-form capture; the negative of the space-craft potential (proportional to density);and the magnitude of the magnetic fieldand the three components of the mag-netic field in GSM.
ponent for shorter intervals, as shown in the top two pan-els, which show two different 0.09 s intervals from the burst.The bipolar signature, which is typical of solitary waves, canbe clearly seen. In the top panel, in addition to a train ofspikes, several isolated solitary waves with amplitudes up to12 mV/m can be seen. The second panel shows an isolatedsolitary wave with an amplitude of∼ 25 mV/m. The solitarywave speeds were too high for time delays to be observablein this low data rate (1600 samples/s) burst.
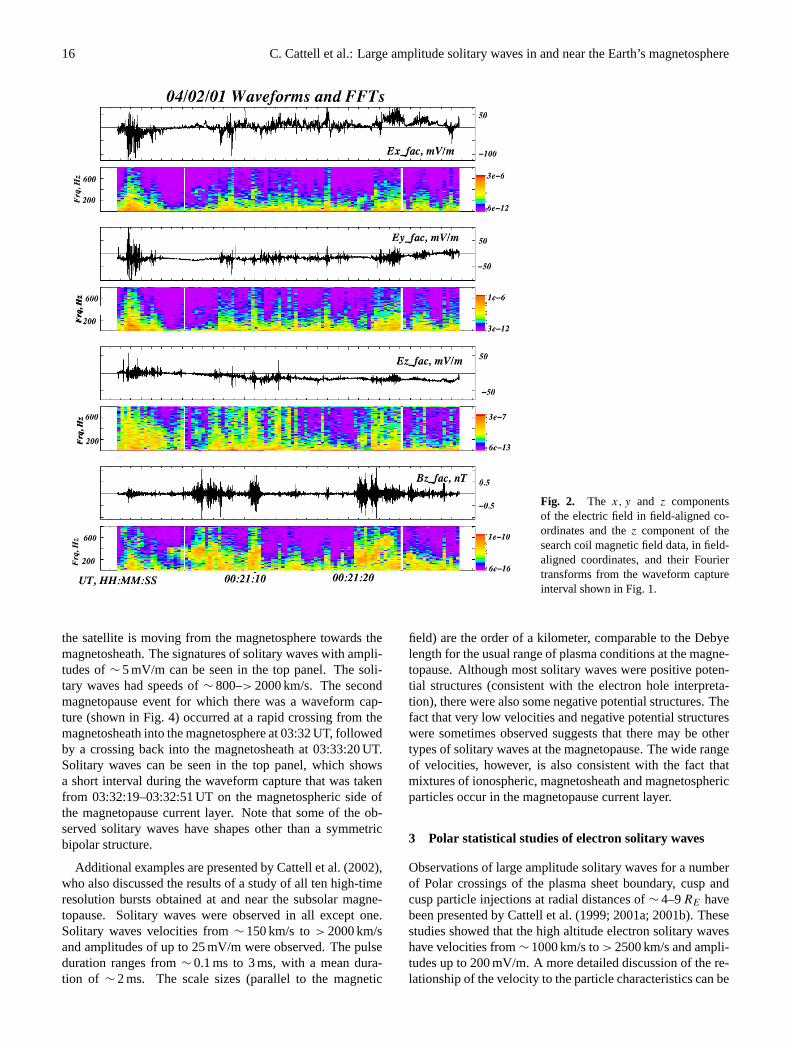
Figure 2 displays thex, y andz components of the electricfield and thex component of the search coil magnetic fielddata in field-aligned coordinates and their Fourier transforms.Most of the power in the perpendicular electric field is at fre-quencies of<50 Hz, consistent with lower hybrid waves, ashas been previously observed (Treumann et al., 1995; Cat-tell et al., 1995). Note that Stasiewicz et al. (2001) suggestedthat the waves in this frequency range observed in the high-latitude magnetopause boundary layer were due to Dopplershifted kinetic Alfven waves. The AC magnetic field hasbursts of waves near the electron cyclotron frequency in the
magnetic field minima. These waves can also be seen in theelectric field when the larger amplitude low frequency elec-trostatic waves and the broadband signature (covering thefull frequency range), due to the solitary waves, do not maskthem. Observations of electron cyclotron waves at the mag-netopause boundary layer have been described previously byPickett et al. (2001).
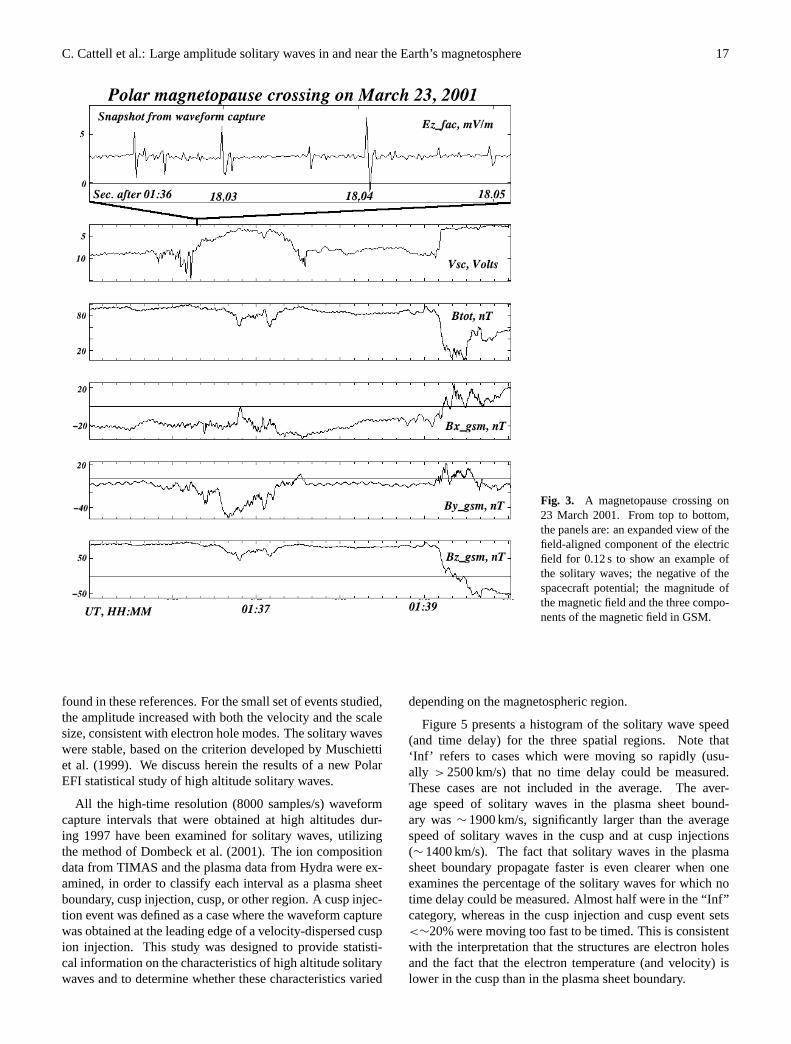
Waveform captures were obtained near two magnetopausecrossings on 23 March 2001 at∼ 9RE and 12 MLT. The firstwaveform capture (from∼ 01:36:14–01:36:19 UT) occurredduring a partial crossing of the magnetopause, just a few min-utes prior to a complete outbound magnetopause crossing (at∼ 01:39:10 UT) during southward IMF. Figure 3 shows thedata from this event. The parallel electric field componentfor an interval of 0.4 s is plotted in the top panel, and thenegative of the spacecraft potential and the magnetic field inthe bottom five panels. At the time of the waveform cap-ture, the density was increasing (as indicated by the space-craft potential), and they andz components and the mag-nitude of the magnetic field were decreasing, as expected if
16 C. Cattell et al.: Large amplitude solitary waves in and near the Earth’s magnetosphere
Fig. 2. The x, y and z componentsof the electric field in field-aligned co-ordinates and thez component of thesearch coil magnetic field data, in field-aligned coordinates, and their Fouriertransforms from the waveform captureinterval shown in Fig. 1.
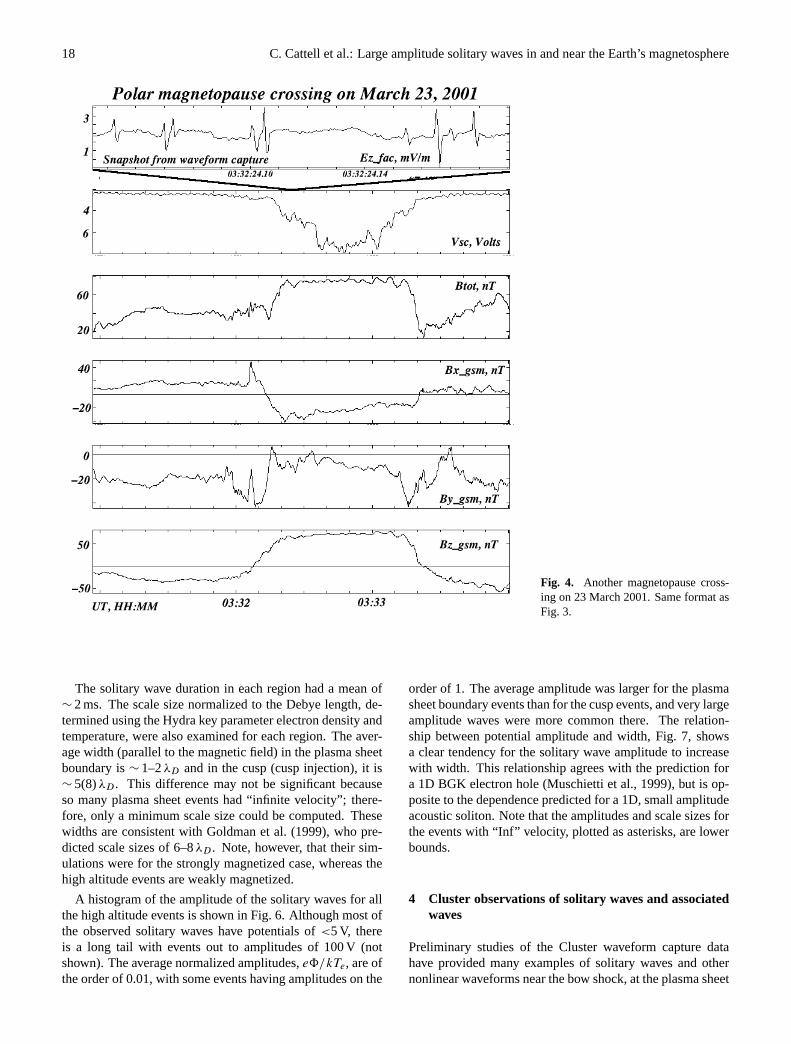
the satellite is moving from the magnetosphere towards themagnetosheath. The signatures of solitary waves with ampli-tudes of∼ 5 mV/m can be seen in the top panel. The soli-tary waves had speeds of∼ 800–> 2000 km/s. The secondmagnetopause event for which there was a waveform cap-ture (shown in Fig. 4) occurred at a rapid crossing from themagnetosheath into the magnetosphere at 03:32 UT, followedby a crossing back into the magnetosheath at 03:33:20 UT.Solitary waves can be seen in the top panel, which showsa short interval during the waveform capture that was takenfrom 03:32:19–03:32:51 UT on the magnetospheric side ofthe magnetopause current layer. Note that some of the ob-served solitary waves have shapes other than a symmetricbipolar structure.
Additional examples are presented by Cattell et al. (2002),who also discussed the results of a study of all ten high-timeresolution bursts obtained at and near the subsolar magne-topause. Solitary waves were observed in all except one.Solitary waves velocities from∼ 150 km/s to> 2000 km/sand amplitudes of up to 25 mV/m were observed. The pulseduration ranges from∼ 0.1 ms to 3 ms, with a mean dura-tion of ∼ 2 ms. The scale sizes (parallel to the magnetic
field) are the order of a kilometer, comparable to the Debyelength for the usual range of plasma conditions at the magne-topause. Although most solitary waves were positive poten-tial structures (consistent with the electron hole interpreta-tion), there were also some negative potential structures. Thefact that very low velocities and negative potential structureswere sometimes observed suggests that there may be othertypes of solitary waves at the magnetopause. The wide rangeof velocities, however, is also consistent with the fact thatmixtures of ionospheric, magnetosheath and magnetosphericparticles occur in the magnetopause current layer.
3 Polar statistical studies of electron solitary waves
Observations of large amplitude solitary waves for a numberof Polar crossings of the plasma sheet boundary, cusp andcusp particle injections at radial distances of∼ 4–9RE havebeen presented by Cattell et al. (1999; 2001a; 2001b). Thesestudies showed that the high altitude electron solitary waveshave velocities from∼ 1000 km/s to> 2500 km/s and ampli-tudes up to 200 mV/m. A more detailed discussion of the re-lationship of the velocity to the particle characteristics can be
C. Cattell et al.: Large amplitude solitary waves in and near the Earth’s magnetosphere 17
Fig. 3. A magnetopause crossing on23 March 2001. From top to bottom,the panels are: an expanded view of thefield-aligned component of the electricfield for 0.12 s to show an example ofthe solitary waves; the negative of thespacecraft potential; the magnitude ofthe magnetic field and the three compo-nents of the magnetic field in GSM.
found in these references. For the small set of events studied,the amplitude increased with both the velocity and the scalesize, consistent with electron hole modes. The solitary waveswere stable, based on the criterion developed by Muschiettiet al. (1999). We discuss herein the results of a new PolarEFI statistical study of high altitude solitary waves.
All the high-time resolution (8000 samples/s) waveformcapture intervals that were obtained at high altitudes dur-ing 1997 have been examined for solitary waves, utilizingthe method of Dombeck et al. (2001). The ion compositiondata from TIMAS and the plasma data from Hydra were ex-amined, in order to classify each interval as a plasma sheetboundary, cusp injection, cusp, or other region. A cusp injec-tion event was defined as a case where the waveform capturewas obtained at the leading edge of a velocity-dispersed cuspion injection. This study was designed to provide statisti-cal information on the characteristics of high altitude solitarywaves and to determine whether these characteristics varied
depending on the magnetospheric region.
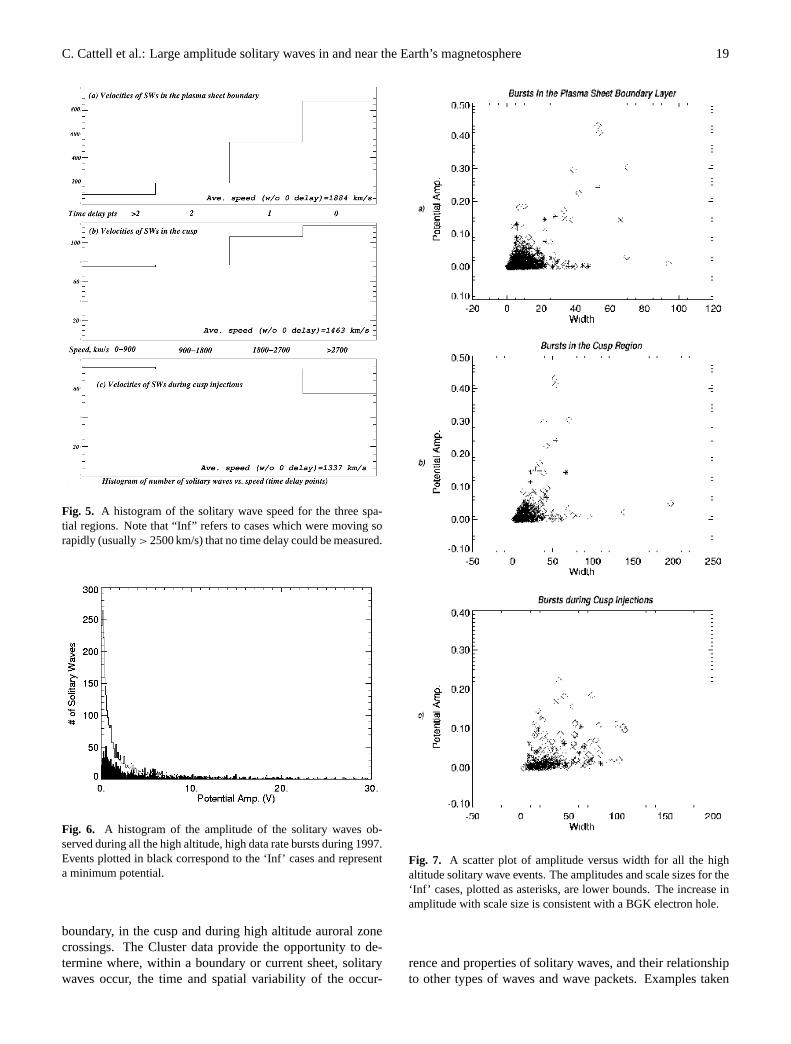
Figure 5 presents a histogram of the solitary wave speed(and time delay) for the three spatial regions. Note that‘Inf’ refers to cases which were moving so rapidly (usu-ally > 2500 km/s) that no time delay could be measured.These cases are not included in the average. The aver-age speed of solitary waves in the plasma sheet bound-ary was∼ 1900 km/s, significantly larger than the averagespeed of solitary waves in the cusp and at cusp injections(∼ 1400 km/s). The fact that solitary waves in the plasmasheet boundary propagate faster is even clearer when oneexamines the percentage of the solitary waves for which notime delay could be measured. Almost half were in the “Inf”category, whereas in the cusp injection and cusp event sets<∼20% were moving too fast to be timed. This is consistentwith the interpretation that the structures are electron holesand the fact that the electron temperature (and velocity) islower in the cusp than in the plasma sheet boundary.
18 C. Cattell et al.: Large amplitude solitary waves in and near the Earth’s magnetosphere
Fig. 4. Another magnetopause cross-ing on 23 March 2001. Same format asFig. 3.
The solitary wave duration in each region had a mean of∼ 2 ms. The scale size normalized to the Debye length, de-termined using the Hydra key parameter electron density andtemperature, were also examined for each region. The aver-age width (parallel to the magnetic field) in the plasma sheetboundary is∼ 1–2λD and in the cusp (cusp injection), it is∼ 5(8)λD. This difference may not be significant becauseso many plasma sheet events had “infinite velocity”; there-fore, only a minimum scale size could be computed. Thesewidths are consistent with Goldman et al. (1999), who pre-dicted scale sizes of 6–8λD. Note, however, that their sim-ulations were for the strongly magnetized case, whereas thehigh altitude events are weakly magnetized.
A histogram of the amplitude of the solitary waves for allthe high altitude events is shown in Fig. 6. Although most ofthe observed solitary waves have potentials of<5 V, thereis a long tail with events out to amplitudes of 100 V (notshown). The average normalized amplitudes,e8/kTe, are ofthe order of 0.01, with some events having amplitudes on the
order of 1. The average amplitude was larger for the plasmasheet boundary events than for the cusp events, and very largeamplitude waves were more common there. The relation-ship between potential amplitude and width, Fig. 7, showsa clear tendency for the solitary wave amplitude to increasewith width. This relationship agrees with the prediction fora 1D BGK electron hole (Muschietti et al., 1999), but is op-posite to the dependence predicted for a 1D, small amplitudeacoustic soliton. Note that the amplitudes and scale sizes forthe events with “Inf” velocity, plotted as asterisks, are lowerbounds.
4 Cluster observations of solitary waves and associatedwaves
Preliminary studies of the Cluster waveform capture datahave provided many examples of solitary waves and othernonlinear waveforms near the bow shock, at the plasma sheet
C. Cattell et al.: Large amplitude solitary waves in and near the Earth’s magnetosphere 19
Fig. 5. A histogram of the solitary wave speed for the three spa-tial regions. Note that “Inf” refers to cases which were moving sorapidly (usually> 2500 km/s) that no time delay could be measured.
Fig. 6. A histogram of the amplitude of the solitary waves ob-served during all the high altitude, high data rate bursts during 1997.Events plotted in black correspond to the ‘Inf’ cases and representa minimum potential.
boundary, in the cusp and during high altitude auroral zonecrossings. The Cluster data provide the opportunity to de-termine where, within a boundary or current sheet, solitarywaves occur, the time and spatial variability of the occur-
Fig. 7. A scatter plot of amplitude versus width for all the highaltitude solitary wave events. The amplitudes and scale sizes for the‘Inf’ cases, plotted as asterisks, are lower bounds. The increase inamplitude with scale size is consistent with a BGK electron hole.
rence and properties of solitary waves, and their relationshipto other types of waves and wave packets. Examples taken
20 C. Cattell et al.: Large amplitude solitary waves in and near the Earth’s magnetosphere
on three days at different locations are presented below.On 7 March 2001, three of the Cluster satellites collected
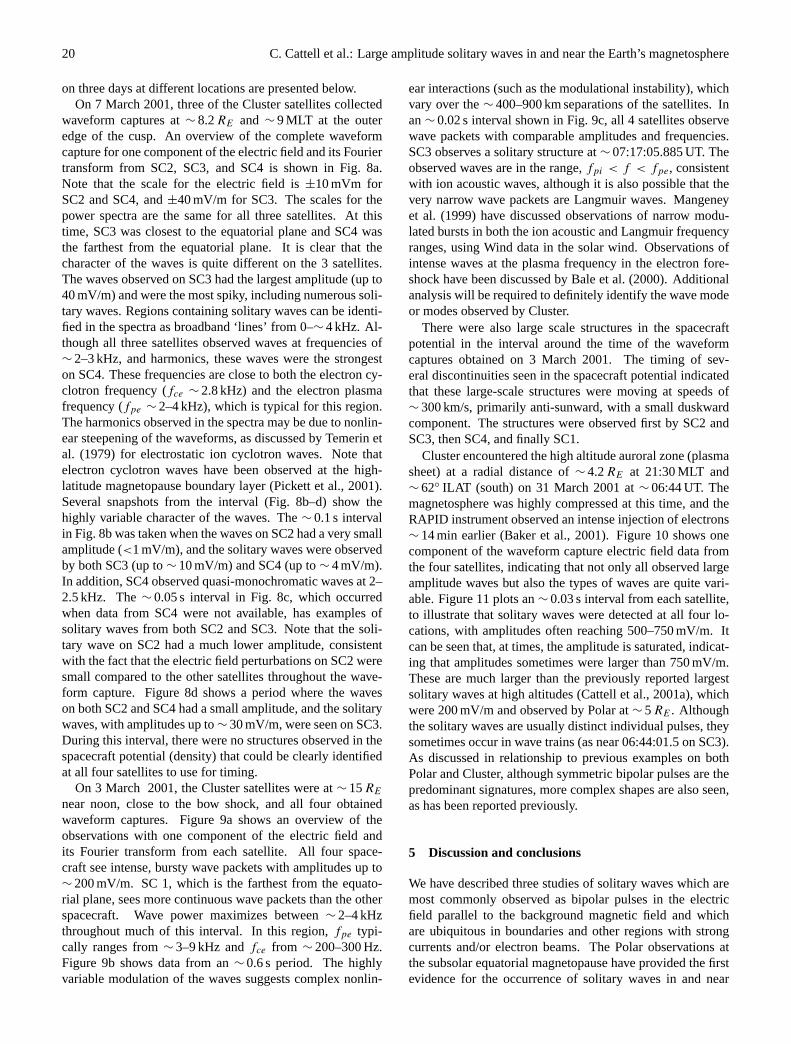
waveform captures at∼ 8.2RE and ∼ 9 MLT at the outeredge of the cusp. An overview of the complete waveformcapture for one component of the electric field and its Fouriertransform from SC2, SC3, and SC4 is shown in Fig. 8a.Note that the scale for the electric field is±10 mVm forSC2 and SC4, and±40 mV/m for SC3. The scales for thepower spectra are the same for all three satellites. At thistime, SC3 was closest to the equatorial plane and SC4 wasthe farthest from the equatorial plane. It is clear that thecharacter of the waves is quite different on the 3 satellites.The waves observed on SC3 had the largest amplitude (up to40 mV/m) and were the most spiky, including numerous soli-tary waves. Regions containing solitary waves can be identi-fied in the spectra as broadband ‘lines’ from 0–∼ 4 kHz. Al-though all three satellites observed waves at frequencies of∼ 2–3 kHz, and harmonics, these waves were the strongeston SC4. These frequencies are close to both the electron cy-clotron frequency (fce ∼ 2.8 kHz) and the electron plasmafrequency (fpe ∼ 2–4 kHz), which is typical for this region.The harmonics observed in the spectra may be due to nonlin-ear steepening of the waveforms, as discussed by Temerin etal. (1979) for electrostatic ion cyclotron waves. Note thatelectron cyclotron waves have been observed at the high-latitude magnetopause boundary layer (Pickett et al., 2001).Several snapshots from the interval (Fig. 8b–d) show thehighly variable character of the waves. The∼ 0.1 s intervalin Fig. 8b was taken when the waves on SC2 had a very smallamplitude (<1 mV/m), and the solitary waves were observedby both SC3 (up to∼ 10 mV/m) and SC4 (up to∼ 4 mV/m).In addition, SC4 observed quasi-monochromatic waves at 2–2.5 kHz. The∼ 0.05 s interval in Fig. 8c, which occurredwhen data from SC4 were not available, has examples ofsolitary waves from both SC2 and SC3. Note that the soli-tary wave on SC2 had a much lower amplitude, consistentwith the fact that the electric field perturbations on SC2 weresmall compared to the other satellites throughout the wave-form capture. Figure 8d shows a period where the waveson both SC2 and SC4 had a small amplitude, and the solitarywaves, with amplitudes up to∼ 30 mV/m, were seen on SC3.During this interval, there were no structures observed in thespacecraft potential (density) that could be clearly identifiedat all four satellites to use for timing.
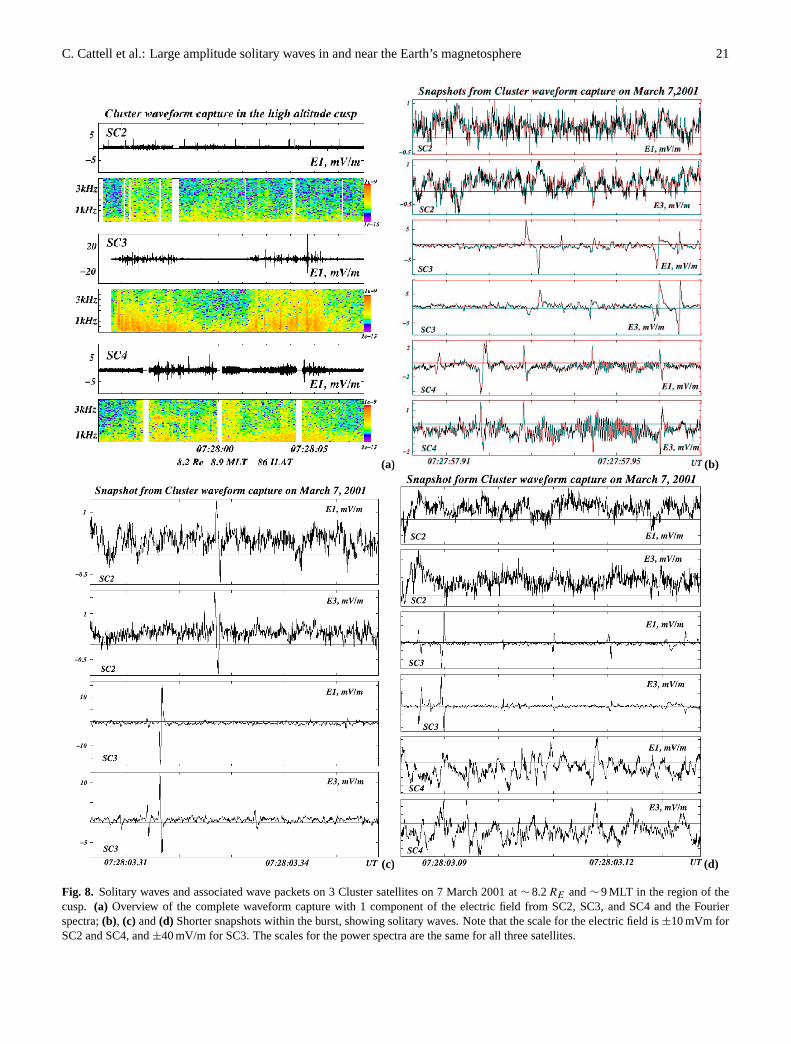
On 3 March 2001, the Cluster satellites were at∼ 15RE
near noon, close to the bow shock, and all four obtainedwaveform captures. Figure 9a shows an overview of theobservations with one component of the electric field andits Fourier transform from each satellite. All four space-craft see intense, bursty wave packets with amplitudes up to∼ 200 mV/m. SC 1, which is the farthest from the equato-rial plane, sees more continuous wave packets than the otherspacecraft. Wave power maximizes between∼ 2–4 kHzthroughout much of this interval. In this region,fpe typi-cally ranges from∼ 3–9 kHz andfce from ∼ 200–300 Hz.Figure 9b shows data from an∼ 0.6 s period. The highlyvariable modulation of the waves suggests complex nonlin-
ear interactions (such as the modulational instability), whichvary over the∼ 400–900 km separations of the satellites. Inan∼ 0.02 s interval shown in Fig. 9c, all 4 satellites observewave packets with comparable amplitudes and frequencies.SC3 observes a solitary structure at∼ 07:17:05.885 UT. Theobserved waves are in the range,fpi < f < fpe, consistentwith ion acoustic waves, although it is also possible that thevery narrow wave packets are Langmuir waves. Mangeneyet al. (1999) have discussed observations of narrow modu-lated bursts in both the ion acoustic and Langmuir frequencyranges, using Wind data in the solar wind. Observations ofintense waves at the plasma frequency in the electron fore-shock have been discussed by Bale et al. (2000). Additionalanalysis will be required to definitely identify the wave modeor modes observed by Cluster.
There were also large scale structures in the spacecraftpotential in the interval around the time of the waveformcaptures obtained on 3 March 2001. The timing of sev-eral discontinuities seen in the spacecraft potential indicatedthat these large-scale structures were moving at speeds of∼ 300 km/s, primarily anti-sunward, with a small duskwardcomponent. The structures were observed first by SC2 andSC3, then SC4, and finally SC1.
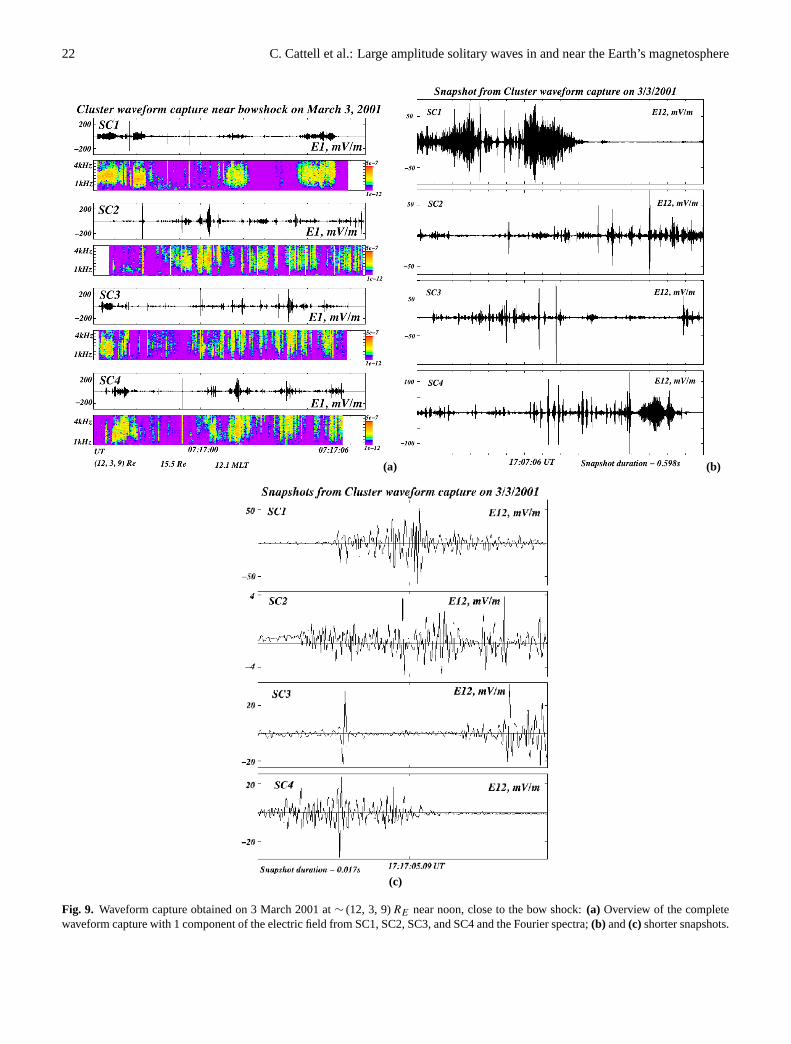
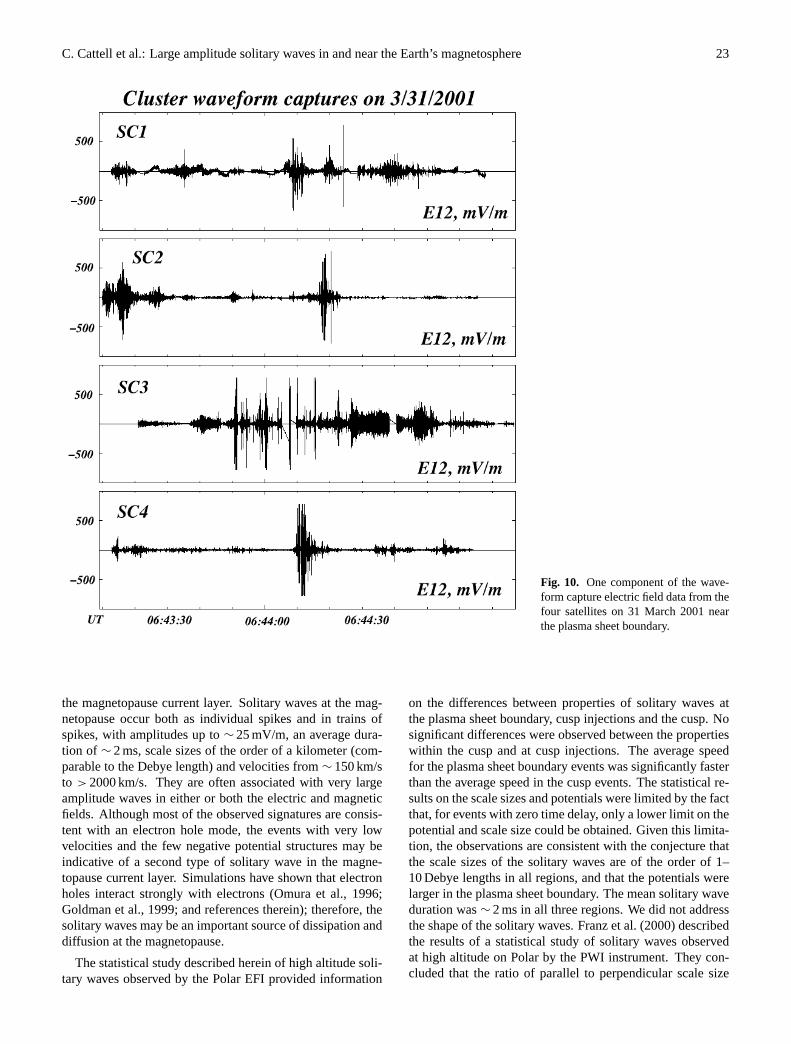
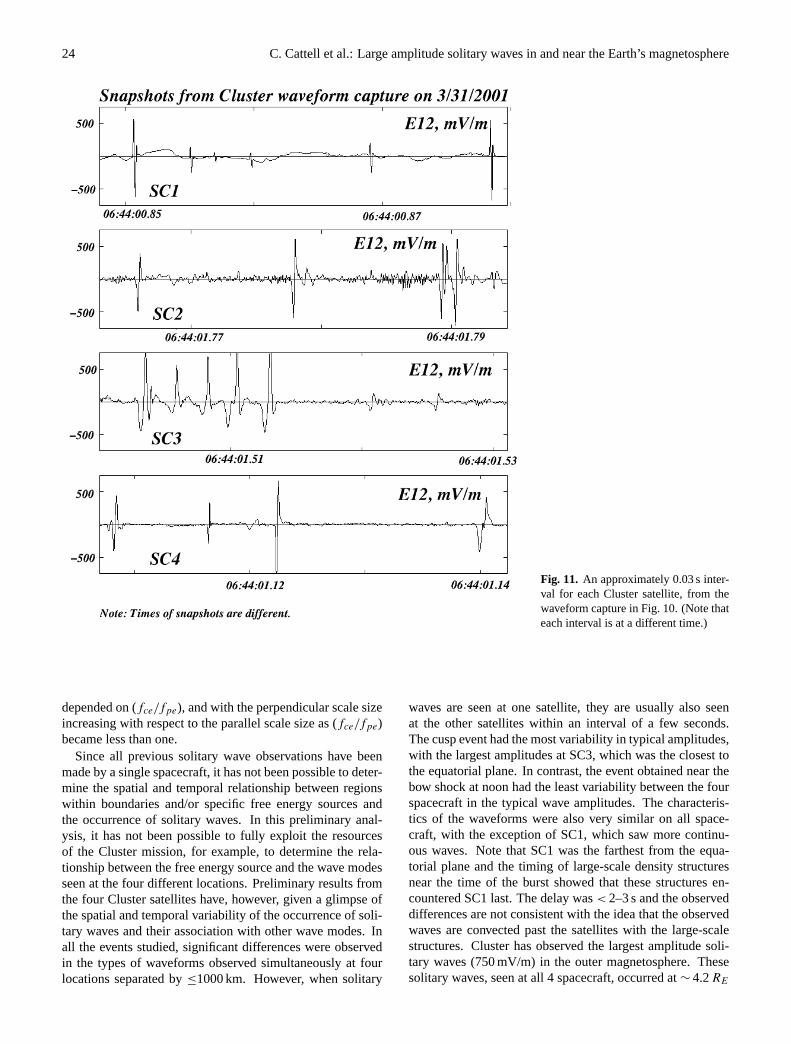
Cluster encountered the high altitude auroral zone (plasmasheet) at a radial distance of∼ 4.2RE at 21:30 MLT and∼ 62◦ ILAT (south) on 31 March 2001 at∼ 06:44 UT. Themagnetosphere was highly compressed at this time, and theRAPID instrument observed an intense injection of electrons∼ 14 min earlier (Baker et al., 2001). Figure 10 shows onecomponent of the waveform capture electric field data fromthe four satellites, indicating that not only all observed largeamplitude waves but also the types of waves are quite vari-able. Figure 11 plots an∼ 0.03 s interval from each satellite,to illustrate that solitary waves were detected at all four lo-cations, with amplitudes often reaching 500–750 mV/m. Itcan be seen that, at times, the amplitude is saturated, indicat-ing that amplitudes sometimes were larger than 750 mV/m.These are much larger than the previously reported largestsolitary waves at high altitudes (Cattell et al., 2001a), whichwere 200 mV/m and observed by Polar at∼ 5RE . Althoughthe solitary waves are usually distinct individual pulses, theysometimes occur in wave trains (as near 06:44:01.5 on SC3).As discussed in relationship to previous examples on bothPolar and Cluster, although symmetric bipolar pulses are thepredominant signatures, more complex shapes are also seen,as has been reported previously.
5 Discussion and conclusions
We have described three studies of solitary waves which aremost commonly observed as bipolar pulses in the electricfield parallel to the background magnetic field and whichare ubiquitous in boundaries and other regions with strongcurrents and/or electron beams. The Polar observations atthe subsolar equatorial magnetopause have provided the firstevidence for the occurrence of solitary waves in and near
C. Cattell et al.: Large amplitude solitary waves in and near the Earth’s magnetosphere 21
(a) (b)
(c) (d)
Fig. 8. Solitary waves and associated wave packets on 3 Cluster satellites on 7 March 2001 at∼ 8.2RE and∼ 9 MLT in the region of thecusp. (a) Overview of the complete waveform capture with 1 component of the electric field from SC2, SC3, and SC4 and the Fourierspectra;(b), (c) and(d) Shorter snapshots within the burst, showing solitary waves. Note that the scale for the electric field is±10 mVm forSC2 and SC4, and±40 mV/m for SC3. The scales for the power spectra are the same for all three satellites.
22 C. Cattell et al.: Large amplitude solitary waves in and near the Earth’s magnetosphere
(a) (b)
(c)
Fig. 9. Waveform capture obtained on 3 March 2001 at∼ (12, 3, 9)RE near noon, close to the bow shock:(a) Overview of the completewaveform capture with 1 component of the electric field from SC1, SC2, SC3, and SC4 and the Fourier spectra;(b) and(c) shorter snapshots.
C. Cattell et al.: Large amplitude solitary waves in and near the Earth’s magnetosphere 23
Fig. 10. One component of the wave-form capture electric field data from thefour satellites on 31 March 2001 nearthe plasma sheet boundary.
the magnetopause current layer. Solitary waves at the mag-netopause occur both as individual spikes and in trains ofspikes, with amplitudes up to∼ 25 mV/m, an average dura-tion of ∼ 2 ms, scale sizes of the order of a kilometer (com-parable to the Debye length) and velocities from∼ 150 km/sto > 2000 km/s. They are often associated with very largeamplitude waves in either or both the electric and magneticfields. Although most of the observed signatures are consis-tent with an electron hole mode, the events with very lowvelocities and the few negative potential structures may beindicative of a second type of solitary wave in the magne-topause current layer. Simulations have shown that electronholes interact strongly with electrons (Omura et al., 1996;Goldman et al., 1999; and references therein); therefore, thesolitary waves may be an important source of dissipation anddiffusion at the magnetopause.
The statistical study described herein of high altitude soli-tary waves observed by the Polar EFI provided information
on the differences between properties of solitary waves atthe plasma sheet boundary, cusp injections and the cusp. Nosignificant differences were observed between the propertieswithin the cusp and at cusp injections. The average speedfor the plasma sheet boundary events was significantly fasterthan the average speed in the cusp events. The statistical re-sults on the scale sizes and potentials were limited by the factthat, for events with zero time delay, only a lower limit on thepotential and scale size could be obtained. Given this limita-tion, the observations are consistent with the conjecture thatthe scale sizes of the solitary waves are of the order of 1–10 Debye lengths in all regions, and that the potentials werelarger in the plasma sheet boundary. The mean solitary waveduration was∼ 2 ms in all three regions. We did not addressthe shape of the solitary waves. Franz et al. (2000) describedthe results of a statistical study of solitary waves observedat high altitude on Polar by the PWI instrument. They con-cluded that the ratio of parallel to perpendicular scale size
24 C. Cattell et al.: Large amplitude solitary waves in and near the Earth’s magnetosphere
Fig. 11. An approximately 0.03 s inter-val for each Cluster satellite, from thewaveform capture in Fig. 10. (Note thateach interval is at a different time.)
depended on (fce/fpe), and with the perpendicular scale sizeincreasing with respect to the parallel scale size as (fce/fpe)became less than one.
Since all previous solitary wave observations have beenmade by a single spacecraft, it has not been possible to deter-mine the spatial and temporal relationship between regionswithin boundaries and/or specific free energy sources andthe occurrence of solitary waves. In this preliminary anal-ysis, it has not been possible to fully exploit the resourcesof the Cluster mission, for example, to determine the rela-tionship between the free energy source and the wave modesseen at the four different locations. Preliminary results fromthe four Cluster satellites have, however, given a glimpse ofthe spatial and temporal variability of the occurrence of soli-tary waves and their association with other wave modes. Inall the events studied, significant differences were observedin the types of waveforms observed simultaneously at fourlocations separated by≤1000 km. However, when solitary
waves are seen at one satellite, they are usually also seenat the other satellites within an interval of a few seconds.The cusp event had the most variability in typical amplitudes,with the largest amplitudes at SC3, which was the closest tothe equatorial plane. In contrast, the event obtained near thebow shock at noon had the least variability between the fourspacecraft in the typical wave amplitudes. The characteris-tics of the waveforms were also very similar on all space-craft, with the exception of SC1, which saw more continu-ous waves. Note that SC1 was the farthest from the equa-torial plane and the timing of large-scale density structuresnear the time of the burst showed that these structures en-countered SC1 last. The delay was< 2–3 s and the observeddifferences are not consistent with the idea that the observedwaves are convected past the satellites with the large-scalestructures. Cluster has observed the largest amplitude soli-tary waves (750 mV/m) in the outer magnetosphere. Thesesolitary waves, seen at all 4 spacecraft, occurred at∼ 4.2RE
C. Cattell et al.: Large amplitude solitary waves in and near the Earth’s magnetosphere 25
within the plasma sheet on auroral field lines, in associationwith a highly compressed magnetosphere.
Acknowledgements.Analysis of Polar electric and magnetic fielddata was supported by the NASA under grants NAG 5–3182,NAG5–3217, and NAG5–7885. J. Dombeck was supported byNASA GSRP NGT5–50251 and J. Crumley by NGT5–50293.Analysis of the Cluster electric field data was supported by NAG5–9985. Analysis of HYDRA data at University of Iowa was per-formed under NASA grant number NAG5–2231 and DARA grant50 OC 8911 0. We would also like to thank C. T. Russell for useof the fluxgate magnetometer data and J. Vernetti for work on theCluster burst-mode software. C. Cattell is a Cotrell Scholar. Herparticipation in this workshop was supported by Research Corpora-tion.
References
Bale, S., Kellogg, P., Larson, D., et al.: Bipolar electrostatic struc-tures in the shock transition region: Evidence of electron phasespace holes, Geophys. Res. Lett., 25, 2929, 1998.
Bale, S., Larson, D., Lin, A., et al.: On the beam speed and wavenumber of intense electron plasma waves near the foreshockedge, J. Geophys. Res., 105, 27 353, 2000.
Baker, D., Ergun, R. E., Burch, J., et al.: A Telescopic and Micro-scopic View of a Magnetospheric Substorm on 31 March 2001,Geophys. Res. Lett., 10.1029/2001/GL014491, 2002.
Bostrom, R., Gustafsson, G., Hollback, B., et al.: Characteristics ofsolitary waves and double layers in the magnetospheric plasma,Phys. Rev. Lett., 61, 82, 1988.
Bounds, S., Pfaff, R., Knowlton, A., et al.: Solitary potential struc-tures associated with ion and electron beams near 1RE , J. Geo-phys. Res., 104, 28 709, 1999.
Cattell, C., Wygant, J., Mozer, F., Okada, T., Kokubun, S., and Ya-mamoto, T.: ISEE-1 and Geotail observations of low frequencywaves at the magnetopause, J. Geophys. Res., 100, 11 823, 1995.
Cattell, C., Wygant, J., Dombecks, J., et al.: Observations of largeamplitude parallel electric field wave packets at the plasma sheetboundary, Geophys. Res. Lett., 25, 857–900, 1998.
Cattell, C., Dombecks, J., Wygant, J., et al.: Comparisons of Polarsatellite observations of solitary wave velocities in the plasmasheet boundary and the high altitude cusp to those in the auroralzone, Geophys. Res. Lett., 26, 425–428, 1999.
Cattell, C., Dombecks, J., Keiling, A., et al.: Comparison of solitarywaves and wave packets observed at plasma sheet boundary toresults from the auroral zone, Phys. Chem. Earth, 26, 97, 2001a.
Cattell, C., Crumley, J., Dombeck, J., Lysak, R., Kletzing, C., Peter-son, W. K., and Collin, H.: Polar Observations Of Solitary WavesAt High And Low Altitudes And Comparison To Theory, Adv.Space Res., 28, 1631, 2001b.
Cattell, C., Crumley, J., Dombeck, J., Wygant, J., and Mozer, F. S.:Polar observations of solitary waves at the Earth’s magnetopause,Geophys. Res. Lett., 29, 2001GL01400469-1, 2002.
Crumley, J., Cattell, C., Lysak, R., and Dombeck, J.: Studies of ionsolitary waves using simulations including hydrogen and oxygenbeams, J. Geophys. Res., 106, 6007, 2001.
Dombeck, J., Cattell, C., Crumley, J., Peterson, W., Collin, H., andKletzing, C.: Observed trends in auroral zone ion solitary wavestructure characteristics using data from Polar, J. Geophys. Res.,106, 19 013, 2001.
Ergun, R., Carlson, C., McFadden, J., et al.: FAST satellite observa-tions of large amplitude solitary wave structures, Geophys. Res.Lett., 25, 2041–2044, 1998.
Franz, J., Kintner, P., and Pickett, J.: Polar observations of coher-ent electric field structures, Geophys. Res. Lett., 25, 1277–1280,1998.
Franz, J., Kintner, P., and Pickett, J.: On the perpendicular scale sizeof electron phase space holes, Geophys. Res. Lett., 27, 169–172,2000.
Harvey, P., Mozer, F., Pankow, D., et al.: The Electric Field Instru-ment on the Polar Satellite, in: The Global Geospace Mission,(Ed) Russell, C. T., p. 583, 1995.
Goldman, M., Oppenheim, M., and Newman, D.: Nonlinear two-stream instabilities as an explanation for auroral biploar wavestructures, Geophys. Res. Lett., 26, 1821–1824, 1999.
Gurnett, D., Persoon, A., Randall, R., et al.: The Polar Plasma WaveExperiment, in: The Global Geospace Mission, (Ed) Russell, C.T., p. 597, 1995.
Gustafsson, G., Aggson, T., Bostrom, R., et al.: The spherical probeelectric field and wave experiment, in: The Cluster Mission-Scientific and Technical Aspects of the Instruments, ESA SP-1103, ESA Publications Div., Noordwijk, The Netherlands, p.31, 1988.
Mangeney, A., Salem, C., Lacombeet, C., et al.: WIND observa-tions of coherent electrostatic waves in the solar wind, Ann. Geo-physicae, 17, 307, 1999.
Matsumoto, H., Kojima, H., Miyatake, T., et al.: Electrostatic soli-tary waves (ESW) in the magnetotail: BEN waveforms observedby Geotail, Geophys. Res. Lett., 21, 2915, 1994.
Matsumoto, H., Frank, L., Omura, Y., et al.: Generation mecha-nism of ESW based on the GEOTAIL Plasma Wave Observa-tion, Plasma Observation and Particle Simulation, Geophys. Res.Lett., 26, 421–424, 1999.
Mottez, F., Perrault, A., Roux, A., et al.: Coherent structures inthe magnetotail triggered by counterstreaming electron beams, J.Geophys. Res., 102, 11 399, 1997.
Mozer, F., Ergun, R., Temerin, M., et al.: New features in timedomain electric field structures in the auroral acceleration region,Phys. Rev. Lett., 79, 1281, 1997.
Muschietti, L., Ergun, R., Roth, I., et al.: Phase-space electron holesalong magnetic field lines, Geophys. Res. Lett., 26, 1093, 1999.
Omura, Y., Matsumoto, H., Miyake, T., et al.: Electron beam in-stabilities as the generation mechanism of electrostatic solitarywaves in the magnetotail, J. Geophys. Res, 101, 2685–2697,1996.
Pedersen, A.: Solar wind and magnetospheric plasma diagnosticsby spacecraft electrostatic potential measurements, Ann. Geo-physicae, 13, 118, 1995.
Pickett, J. S., Gurnett, D., Menietti, A., et al.: Plasma waves ob-served during cusp energetic particle events and their correlationwith Polar and Akebono satellite and ground data, Adv. SpaceRes., 24, 23, 1999.
Pickett, J. S., Franz, J., et al.: Plasma waves observed in the cuspturbulent boundary layer: An analysis of high time resolutionwave and particle measurements from the Polar spacecraft, J.Geophys. Res, 106, 19 081, 2001.
Russell, C. T., Share, R., Means, J., et al.: The GGS/Polar Mag-netic Fields Investigation, in: The Global Geospace Mission,(Ed) Russell, C. T., p. 563, 1995.
Scudder, J., Hunsacker, F., Miller, G., et al.: Hydra-A 3-D elec-tron and ion hot plasma instrument for the Polar spacecraft of theGGS mission, in: The Global Geospace Mission, (Ed) Russell,
26 C. Cattell et al.: Large amplitude solitary waves in and near the Earth’s magnetosphere
C. T., p. 459, 1995.Shelley, E. G., Ghelmetti, A., Balsinger, H., et al.: The Toroidal
Imaging Mass-Angle Spectrograph (TIMAS) for the Polar Mis-sion, in: The Global Geospace Mission, (Ed) Russell, C. T., p.497, 1995.
Stasiewicz, K., Seyler, C., Mozer, F., Gustaffson, G., Pickett, J., andPopielawska, B.: Magnetic bubbles and kinetic Alfven waves inthe high-latitude magnetopause boundary, J. Geophys. Res., 106,29 503, 2001.
Temerin, M., Woldorff, M., and Mozer, F. S.: Nonlinear steepeningof the electrostatic ion cyclotron wave, Phys. Rev. Lett., 43, 1941,1979.
Temerin, M., Cerny, K., Lotko, W., et al.: Observations of solitarywaves and double layers in the auroral plasma, Phys. Rev. Lett.,48, 1175, 1982.
Treumann, R., LaBelle, J., and Bauer, T.: Diffusion Processes:An Observational Perspective, in: Physics of the Magnetopause,Geophys. Mon. 90, AGU, (Eds) Song, P., Sonnerup, B., andThomsen, M., p. 331, 1995.
Tsurutani, B., Arballo, J., Lakhina, G., Ho, C., Buti, B., Pickett, J.,and Gurnett, D.: Plasma waves in the dayside polar cap boundarylayer: Bipolar and monopolar eletric pulses and whistler modewaves, Geophys. Res. Lett., 25, 4117, 1998.