Embed Size (px)
Citation preview

Results to September 30, 2017
Conference call
October 31, 2017
Gilles MICHEL - Chairman & Chief Executive Officer
Olivier PIROTTE - Chief Financial Officer

2
Disclaimer
More comprehensive information about Imerys may be obtained on its website (www.imerys.com).
under Regulated Information, including its Registration Document filed under No. D.17-0190 on
March 21, 2017 with Autorité des marchés financiers. Imerys draws the attention of investors to the
“Risk factors and Internal control” set forth in section 4 of the Registration Document.
This document contains projections and other forward-looking statements. Investors are cautioned
that such projections and forward-looking statements are subject to various risks and uncertainties
(many of which are difficult to predict and generally beyond the control of Imerys) that could cause
actual results and developments to differ materially from those expressed or implied.
Note:
• Photo credits: Imerys photo library. Rights Reserved. xxx.
October 31, 2017 Results to September 30, 2017

Results to September 30, 2017
Highlights
Conclusion
Appendix
4
14
16

Highlights

Quarterly organic growth (2)
+ X,X %
Net income from current operations (€m)
Revenue (€m)
Key figures as at September 30, 2017
5
(1) « Current » means « before other organic growth »
(2) Organic growth: growth at comparable Group structure and exchange rates
+ 8.5 %
Current operating income (COI. €m) (1)
+ 8.6 % + 6.8 %
9M17 : + 2.4 %
Results to September 30, 2017 October 31, 2017
3,084 3,127
3,394
9M 15 9M 16 9M 17
409 442
480
13.3% 14.1% 14.1%
9M 15 9M 16 9M 17
260 275
342 362
293
3.28 € 3.48 € 3.71 €
9M 15 9M 16 9M 17
+ 0.1 %
- 4.5 %
- 3.3 %
- 5.6 % - 5.1 %
- 1.8 % - 2.6 % - 2.5 %
+ 1.4 %
+ 2.4 %
+ 1.2 %
+ 3.6 %
+ 3.2 %
+ 0.9 %
- 0.9 %
- 3.3 %
- 4.6 % - 3.9 %
- 3.7 %
- 2.9 %
- 1.4 %
- 0.4 %
+ 0.6 %
+ 2.1 %
T4-14 T1-15 T2-15 T3-15 T4-15 T1-16 T2-16 T3-16 T4-16 T1-17 T2 17 T3 17
Quarterly organic growth
Rolling 12 months organic growth
Better overall market environment
6
(*) 2016 estimates
(1) Census (2) RISI (3) Worldsteel (4) IHS automotive, Wards (5) ACEA, (6) Commissariat Général
au Développement Durable, trailing three months
Pick up in production limited to low-production costs basins, without impact on demand for ceramic proppants
Sales of clay roof tiles down by - 2,8 % 9M 2017 vs 9M 2016 : new single family housing starts + 16,2 % as at
end August 2017 (6)
Persisting weakness in renovation
Acceleration of steel production in the US (+ 3.1 %) and in Europe (+ 4.1 %), 9M 2017 vs 9M 2016 (3)
+ 5.6 % globally
Decrease in printing and writing paper in Europe (-2.0 %) and in the US (- 5.0%) in H1 2017 vs H1 2016 (2)
Emerging markets stable H1 2017 vs H1 2016
Firm current consumption (ex. food and beverage, consumer electronics, health & beauty, etc.)
Further increase in housing starts (single family and collective) in the US (+ 3.1 % 9M 2017 vs 9M 2016),
building permits (+ 5.0 % 9M 2017 vs 9M 2016) (1).
Good momentum in Europe, overall
~ 1 %
~7 %
~10 %
~15 %
~15 %
~20 %
Slight decline in car sales in the US as at end of September (- 1.6 %) (4)
Car sales in Europe + 3.7 % 9M 2017 vs 9M 2016 (5) ~10 %
Roofing in France
US shale oil
Results to September 30, 2017
% of Group
revenue*
Construction
and renovation
Current
consumption
Paper
Iron / Steel
Automotive
October 31, 2017
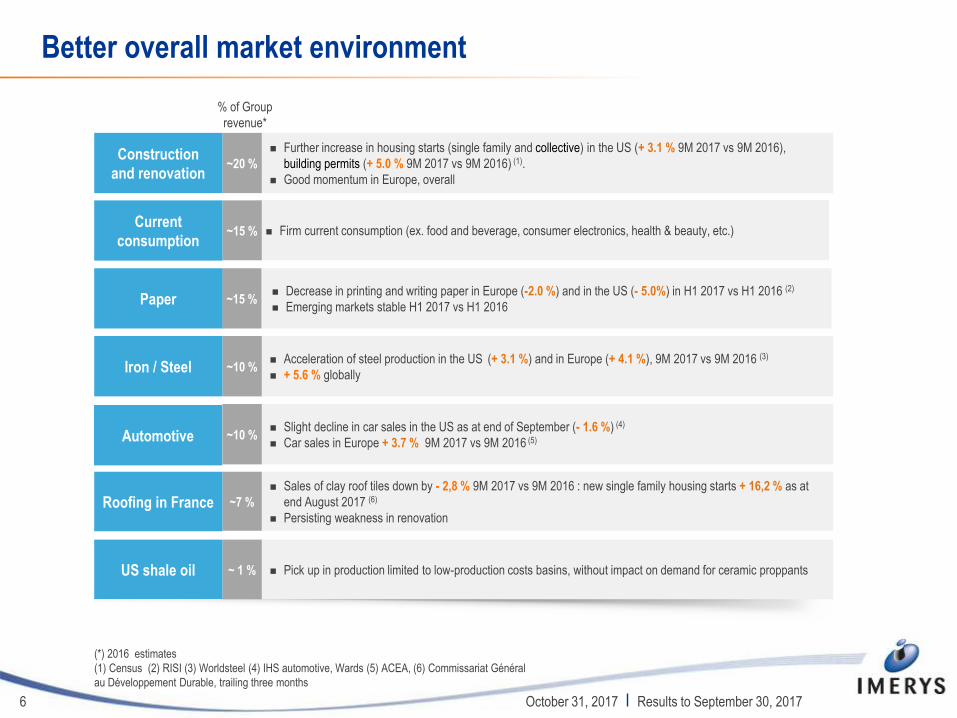
Evolution of revenue for the first nine months of 2017 (€m)
3,127
3,394
182
9 76
9M 2016 Scope Currencies Volumes & price-mix 9M 2017
+ 8.5 % revenue increase
7
Organic growth of + 2.4 % for the first nine months of 2017, of which + 3.6% in Q3
Volumes up + 1.8 %, with positive price-mix effect of + 0.6 % for the first nine months
Integration of Kerneos
Significant negative currency impact in Q3 (- 25 M€)
+ 5.8 % + 0.3 % + 2.4 % + 8.5 %
Kerneos
Misc.
91
91
October 31, 2017 Results to September 30, 2017

Revenue (€m)
320 339
Q3 16 Q3 17
Energy Solutions & Specialties (29 % of consolidated revenue)
8
Revenue by end market*
Revenue by division
* 2016 Data
+ 5.9%
+ 6.0%
Broad-based improvement of activity
Graphite & Carbon: dynamic markets for mobile
energy and conducting polymers
Carbonates: positive trends in Asia-Pacific
and in packaging applications
Monolithic refractories: growth in industrial markets
in Europe
Unchanged market environment for ceramic
proppants
October 31, 2017 Results to September 30, 2017
937 992
9M 16 9M 17
47%
39%
11%
3 %
Carbonates
Monolithic refractories
Graphite & Carbone
Oilfield solutions
23%
21%
16%
13%
12%5%
4% 6%
New construction
Paper
Steel
Energy
Consumer goods
Automotive, trucks &commercial vehiclesIndustrial Equipment
Miscellaneous

Revenue (€m)
282 302
Q3 16 Q3 17
852 932
9M 16 9M 17
Filtration & Performance Additives (27 % of consolidated revenue)
9
Revenue by end market*
Revenue by division
* 2016 Data
+ 9.3%
+ 7.1% Revenue benefiting from robust sales
momentum in supportive markets
New developments in health & beauty,
construction, agriculture and plastics
recycling markets
October 31, 2017 Results to September 30, 2017
40%
28%
32%
Performance additives
Filtration
Metallurgy
27%
20%16%
10%
8%5%
14%
Consumer goods
Automotive
Construction andrenovationSteel
Industrial equipment
Paper
Miscellaneous

Revenue (€m)
928 898
9M 16 9M 17
294 286
Q3 16 Q3 17
Revenue by end market*
Revenue by division
Ceramic Materials (26 % of consolidated revenue)
10
* 2016 data
** Source : FFTB : Fédération française de tuiles et briques
- 3.3% - 1.8%
Sequential improvement
Weak paper markets
Clay roof tiles sales down - 2.3% in Q3**
due to slack renovation segment
Good ceramic markets overall
October 31, 2017 Results to September 30, 2017
LFL: - 3.2%
LFL: - 2.7%
26%
33%
41% Roofing
Ceramics
Kaolin
35%
26%
25%
7%3% 4%
Paper
Renovation
New construction
Consumer goods
Automotive
Miscellaneous

Revenue (€m)
147
263
Q3 16 Q3 17
Revenue by end market *
Revenue by division
446
619
9M 16 9M 17
High Resistance Minerals (18 % of consolidated revenue)
11
* 2016 data
+ 38.6% + 79.5%
Kerneos
Good sales and innovation dynamics in very
supportive markets
Very strong organic growth in Q3 with relatively
favorable comparison basis
Integration of recent acquisitions, Kerneos
in particular, integrated since July 18
Kerneos
October 31, 2017 Results to September 30, 2017
30%
55%
15%
Refractory minerals
Fused minerals
Kerneos
24%
18%
17%
15%
12%
8%6%
Steel
Industrial equipment
Automotive
Construction &renovation
Energy
Consumer goods
Miscellaneous
91
91

Evolution of Current Operating Income for the first nine months of 2017 (€m)
442
480 16
2 56
(1) (36) 1
9M 2016 Scope Currencies Volumes andprice mix
Variable costs Fixed costs andoverheads
Miscellaneous 9M 2017
Current operating income up + 8.6 %
12
Operating margin stable at 14.1 %, despite negative currency impact in Q3
Contribution from recent acquisitions, Kerneos in particular
Positive contribution from volumes and price-mix for + 56 M€
Variable costs under control (1 M€) thanks to operational excellence programs
Increase in activity and ongoing deployment of human and industrial capital necessary to the growth
of the Group
Fixed costs and overheads: + 36 M€
October 31, 2017 Results to September 30, 2017
+ 8.6 %
14.1 % Operating margin
14.1 %
Volumes 37
Price mix 18

Net income from current operations up by + 6.8%
13
(1) Average weighted number of outstanding shares: 79 031 930 (9M 2017)
versus 78 774 246 (9M 2016)
Increase in current financial expense reflecting marked currency effect in the 3rd quarter
Other operating income and expenses halved
M€ 9M 2016 9M 2017 Change
Current operating income 441.5 479.5 + 8.6%
Current financial expense (47.5) (63.1)
Average cost of debt 2.3 % 1.8 %
Current income tax (117.2) (122.8)
Average tax rate 29.7 % 29.5 %
Minority interests (2.3) (0.4)
Net income from current operations, Group’s share 274.5 293.2 + 6.8%
Net income from current operations, Group’s share, per share (1) 3.48 € 3.71 € + 6.5%
Other operating income and expenses, net (55.5) (25.4)
Net income, Group’s share 219.0 267.8 + 22.3%
October 31, 2017 Results to September 30, 2017

Conclusion

Conclusion
15
Recent acquisitions, especially Kerneos, expected to contribute gradually
Objective of 2017 net income from current operations growth to exceed + 7 %
confirmed
October 31, 2017 Results to September 30, 2017

Appendix

Revenue and current operating income by quarter
17 October 31, 2017 Results to September 30, 2017
Revenue (€m) Q1 2015 Q2 2015 Q3 2015 Q4 2015 Q1 2016 Q2 2016 Q3 2016 Q4 2016 Q1 2017 Q2 2017 Q3 2017
Energy Solutions & Specialties 312.5 323.5 314.1 303.0 300.8 316.2 319.6 314.0 321.6 332.0 338.7
Filtration & Performance Additives 218.9 306.2 284.5 271.9 278.2 292.1 282.0 292.2 312.4 317.0 302.2
Ceramic Materials 291.0 301.4 285.8 294.2 323.2 311.4 293.8 293.6 310.9 300.9 285.9
High Resistance Minerals 165.3 165.0 156.0 143.1 148.3 151.5 146.5 151.4 184.2 171.5 263.1
Eliminations & Holding companies (14.1) (12.4) (13.2) (10.2) (12.4) (12.6) (12.1) (12.5) (15.9) (14.3) (16.7)
TOTAL 973.6 1,083.7 1,027.2 1,002.2 1,038.1 1,058.6 1,029.8 1,038.7 1,113.2 1,107.1 1,173.2
Like-for-like revenue growth Q1 2015 Q2 2015 Q3 2015 Q4 2015 Q1 2016 Q2 2016 Q3 2016 Q4 2016 Q1 2017 Q2 2017 Q3 2017
Energy Solutions & Specialties - 4.7% - 3.5% - 9.7% - 8.1% - 6.8% - 2.9% - 3.2% + 1.2% + 1.0% + 0.7% + 5.3%
Filtration & Performance Additives + 2.8% + 3.6% - 0.1% + 2.7% + 2.3% - 1.7% - 0.5% + 6.0% + 6.5% + 4.0% + 4.8%
Ceramic Materials - 6.3% - 1.7% - 4.4% - 4.7% + 2.8% - 2.3% - 2.1% - 3.8% - 4.7% - 2.9% - 1.8%
High Resistance Minerals - 7.4% - 10.4% - 3.4% - 10.5% - 6.4% - 4.4% - 5.5% + 4.9% + 14.6% + 4.4% + 10.7%
Like-for-like revenue growth - 4.5% - 3.3% - 5.6% - 5.1% - 1.8% - 2.6% - 2.5% + 1.4% + 2.4% + 1.2% + 3.6%
Current Operating Income (€m) Q1 2015 Q2 2015 Q3 2015 Q4 2015 Q1 2016 Q2 2016 Q3 2016 Q4 2016 Q1 2017 Q2 2017 Q3 2017
Consolidated C.O.I. 123.2 150.8 135.0 129.1 135.4 157.7 148.5 140.6 147.2 165.4 166.9
Operating margin 12.7% 13.9% 13.1% 12.9% 13.0% 14.9% 14.4% 13.5% 13.2% 14.9% 14.2%

Current operating income and operating margin by semester
18 October 31, 2017 Results to September 30, 2017
Current Operating Income (€m) H1 2012 H2 2012 H1 2013 H2 2013 H1 2014 H2 2014 H1 2015 H2 2015 H1 2016 H2 2016 H1 2017
Energy Solutions & Specialties 77.5 65.7 67.9 60.2 72.1 77.5 64.4 55.3 67.0 62.9 68.8
Filtration & Performance Additives 45.4 44.9 51.3 49.6 58.0 55.4 88.0 90.1 105.0 109.7 125.0
Ceramic Materials 112.5 97.0 108.5 111.2 104.4 106.7 106.8 103.3 113.7 109.7 107.0
High Resistance Minerals 53.6 41.6 37.4 32.7 36.5 36.3 41.4 40.2 40.0 38.0 47.5
Eliminations & Holding companies (23.6) (26.6) (21.0) (20.7) (23.2) (29.0) (26.5) (24.8) (32.7) (31.2) (35.7)
Consolidated C.O.I 265.4 222.7 244.0 233.0 247.7 246.9 274.0 264.1 293.0 289.1 312.6
Operating Margin H1 2012 H2 2012 H1 2013 H2 2013 H1 2014 H2 2014 H1 2015 H2 2015 H1 2016 H2 2016 H1 2017
Energy Solutions & Specialties 11.8% 10.4% 10.9% 9.6% 11.5% 11.8% 10.1% 9.0% 10.9% 9.9% 10.5%
Filtration & Performance Additives 14.3% 14.2% 15.9% 15.9% 17.9% 16.6% 16.8% 16.2% 18.4% 19.1% 19.9%
Ceramic Materials 17.3% 15.7% 17.4% 19.1% 17.9% 18.6% 18.0% 17.8% 17.9% 18.7% 17.5%
High Resistance Minerals 13.9% 11.7% 11.1% 10.3% 11.1% 11.6% 12.5% 13.4% 13.3% 12.8% 13.4%
Consolidated Operating Margin 13.4% 11.7% 13.0% 12.8% 13.5% 13.3% 13.3% 13.0% 14.0% 14.0% 14.1%

Revenue by region as at September 30, 2017
19 October 31, 2017 Results to September 30, 2017
43%
25%
28%
4%
Western Europe
USA/ Canada
Emerging markets
Other (Japan/ Australia)

20
9M 2017 revenue by region
34%
23%
35%
8%
Western Europe USA/ Canada
Emerging markets Other (Japan/ Australia)
October 31, 2017 Results to September 30, 2017
Energy Solutions & Specialties
Carbonates Natural (GCC) and Precipitated (PCC) Calcium
Carbonates used as filling or coating pigment for paper
production and functional additives for paints, plastics etc..
Monolithic Refractories Unshaped refractory materials used to protect industrial
equipment from high temperatures in heavy industries
(steel, cement, power generation, petro-chemicals, etc.)
Protection for furnaces, kilns, crucibles and incinerators
Graphite & Carbon High performance graphite powder for mobile energy,
electronics and engineering, refractories for the transport
and automotive markets
Oilfield Solutions Production of ceramic proppants
for non-conventional oil and gas exploration

9M 2017 revenue by region
21
39%
33%
25%
3%
Western Europe USA/ Canada
Emerging markets Other (Japan/ Australia)
October 31, 2017 Results to September 30, 2017
Filtration & Performance Additives
Performance Additives Additives for paints, plastics, polymers, rubbers,
adhesives, sealants, pharma & personal care
(mainly talc, mica and wollastonite, etc.)
Filtration Filtration minerals providing filter aid for edible
liquids such as beer, wine, oil, fruit juice, etc.
(mainly diatomite and perlite)
Perlite based solutions used in building materials
and horticulture
Metallurgy Bentonite (binders for foundry, sealing solutions,
additives for drilling and for consumer products)
and continuous casting fluxes for the steel
industry

9M 2017 revenue by region
22
59% 17%
21% 3%
Western Europe USA/ Canada
Emerging markets Other (Japan/ Australia)
October 31, 2017 Results to September 30, 2017
Ceramic Materials
Roofing Clay roof tiles in France
Ceramics Raw materials and bodies for tableware, sanitary and
floor tiles, quartz, technical ceramics
Kaolin Kaolin for applications in the paper, paints, plastics,
ceramics and refractories markets, etc.

9M 2017 revenue by region
23
41%
25%
29%
5%
Western Europe USA/ Canada
Emerging markets Other (Japan/ Australia)
October 31, 2017 Results to September 30, 2017
High Resistance Minerals
Fused Minerals Fused alumina and bauxite for abrasives (cutting,
grinding and polishing mills, sandpapers), zirconium
for refractories, oxygen sensor
Refractory Minerals Production of acidic refractory minerals including
andalusite and chamottes
Kerneos Binders and additives for floor mortars, self levelling
screeds, adhesives, tile joint and technical mortars
Special hydraulic binders for monolithic refractory
concretes, proofing and patching mortars for
sewage system infrastructure

New housing starts
(in thousands)
Market indicators for construction, printing & writing paper
Source : RISI
24
Printing & writing paper
(in millions of tons)
October 31, 2017 Results to September 30, 2017
0,0
5,0
10,0
15,0
20,0
25,0
2008 2009 2010 2011 2012 2013 2014 2015 2016
MT
Mature markets Emerging markets
Printing & writing paper (in millions of tons)

Light vehicle registrations
(basis 100 in Q4 2007)
Indicators for steel production and passenger car registrations
25
Steel production
(in thousands of tons)
October 31, 2017 Results to September 30, 2017
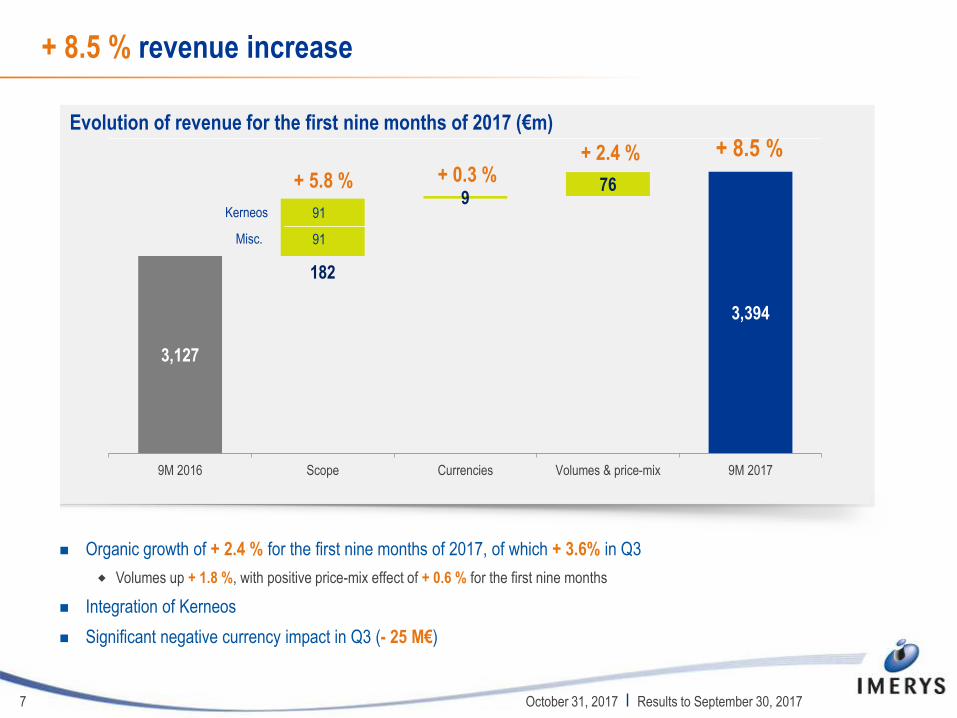
Industrial production indicator: industrial equipment
26 October 31, 2017 Results to September 30, 2017
New orders index (machine and
industrial equipment manufacturing
in EU-28 (adjusted for seasonal effect
and working days)
New orders index (machine and
industrial equipment manufactuing in the
U.S.A. (adjusted for seasonal effect )

Kerneos: a new platform to grow Imerys’ minerals-based specialties
27
A world class technology platform
Entering into a new and growing market segment Leveraging growing adoption rate of aluminate technologies
in construction
Enhancing Imerys financial performance with above Group-
average top line growth, profitability and cash flow generation
Close fit with Imerys’ business model Leading technologies, high quality assets with global footprint,
secured access to mineral reserves
Leadership position: worldwide # 1 in calcium aluminates
performance binders
High-functional value products with multiple key properties,
for a small share of client input costs
Innovation leadership and customer focus
Shared culture of excellence
Main strategic rationale for Imerys
October 31, 2017 Results to September 30, 2017

Kerneos: global leadership positions with proven track record of growth and profitability
28
Revenue by segment
Sustained revenue growth (€m)
(1) Free cash flow before taxes, excluding exceptional and non recurring items.
Free cash flow excludes financial lease charges
211 280
157
137
368 417 CAGR:
+ 3.3%
High profitability (€m)
74
99
20% 24%
EBITDA EBITDA margin
CAGR:
+ 8.0%
68%
32%
Proven track-record of growth and
resilient profitability at high level
Revenue: + 3.3% CAGR 2012-2016,
of which + 6.2% organic growth p.a.
in construction technologies
24% EBITDA margin in 2016
Strong free cash flow: 60 M€
in 2016 (1)
Refractory technologies
Construction technologies & other specialty applications
Refractory technologies
Construction technologies & other specialty applications
Worldwide #1 in CAC
performance binders
for construction
technologies
Worldwide #1 in CAC
performance binders
for refractories
2012 2016 2012 2016
October 31, 2017 Results to September 30, 2017

With Kerneos, Imerys would complement its global footprint…
29
Global presence: 1,500 employees in
9 industrial facilities and 17 sales offices
Competitive industrial base located in
key markets
Secured access to required minerals
(including ownership of red bauxite
mines)
Strong customer focus with recognized
technical support and expertise
Significant presence in growing
geographies: ca. 50% of revenue in
North America and emerging markets:
Sole CAC player with global footprint
Production Plants
Commercial Offices
Countries with Industrial Sites
Norfolk
Guaxindiba
Richards Bay
Johannesburg
West Thurrock
Dunkerque
Le Teil
Zhenzghou
Kolkata Vizag (1)
Ghuizhou
Shanghai
Tianjin
Istanbul Stockholm
Saint Petersburg
Oberhausen
Milan
Madrid
FosMer
Tokyo
Singapore
Sydney
Integrated Bauxite mining sites
Revenue by region (2016)
Europe 54%
North America
24%
Emerging markets
22%
October 31, 2017 Results to September 30, 2017

… and enhance its profile with 2/3 of Kerneos activities offering growth potential
30
Leveraging growing adoption rate of aluminate
technologies in construction
Construction technologies and specialty
applications: long-term growth outperforming
construction markets
Self leveling and quick drying properties
Cost effective solution
High penetration potential of mortars using CAC
technology in the US
Continuing CAC penetration in all European
markets (France, Germany and the UK)
Customer base including premium players
(Sika, Bostik, Weber, Mapei, Thomsit, etc.)
Other specialty applications
CAC products for wastewater treatment, mining industry, metal refinery, engineering jobs
and specialized concrete producers
Bauxite mining activities
Construction
market
CAC for
construction
Adoption
of modern
technologies
(flooring etc.)
+4-5% p.a.
Penetration
of CAC
October 31, 2017 Results to September 30, 2017

Refractory technologies: high value offering
31
Serving primarily as binders for refractory products (monolithics)
Performance binders are critical to the performance of client products
Represents a small share of client input cost in refractories
Benefiting from a resilient performance
Selling almost exclusively added value CAC products with high level of technical service
Serving several high temperature industries (steel, cement, glass, petrochemical, incinerators, etc.)
Substitution from bricks to monolithic refractories
CAC market for refractories prospect
Expectations of mature countries recovery, India growth and increasing CAC penetration
in emerging markets
Expectation of markets with growing demand of modern standard
October 31, 2017 Results to September 30, 2017

32
Innovation leadership supported by strong R&D capabilities
October 31, 2017 Results to September 30, 2017
High quality R&D strengthening Imerys’
innovation capabilities
2 R&D centers dedicated to Construction
technologies (France) and Refractories (China)
5 application laboratories worldwide offering
customers’ support
Large cooperation network with universities
and institutes
Selected trademarks
New products sales evolution over last 10 years €m and % of Net Sales
New products sales (€m) % of net sales
3
22
34
1.0%
6.6%
8.2%
2006 2010 2015

€23 m run-rate annual synergies identified
Leveraging geographical coverage
Kerneos stronger presence in some geographies
Enhancing innovation potential
New technologies/ applications
Cross fertilization opportunities
Cost optimization
Procurement efficiencies
Industrial set up
33
Pre-tax synergies phasing (€m)
9
18
23
Year 1 Year 2 Year 3
October 31, 2017 Results to September 30, 2017

Imerys and Kerneos: a value creative transaction
Estimated enterprise value of c.€880 million €23m annual run rate synergies from third full year of consolidation
8.9x 2016 LTM EBITDA1 and 7.2x post run-rate annual synergies
Financed from Imerys’ available resources Available cash and secured financing
Complies with our objective to maintain an investment grade rating
Ensures financing flexibility: deleveraging thanks to solid cash
generation
Value creative acquisition ROCE above WACC within 3 years, in line with Imerys stringent
acquisition criteria
High single digit EPS2 accretion from first full-year of consolidation
34
7.2x 2016 EBITDA post run-rate annual synergies (1)
High single-digit EPS accretion from Year 1
1. Last 12 months, as of September 30, 2016
2. Net income from current operations per share
October 31, 2017 Results to September 30, 2017

Kerneos, a further step in Imerys’ development strategy that matches all our value-creation criteria
Excellent fit with Imerys business model
35
World class technology platform
Significant synergies identified
Consistent with investment grade objective
Strong innovation capabilities
Enhancement of Imerys growth and profitability profile
Entry into a new growing market segment
October 31, 2017 Results to September 30, 2017

www.imerys.com
Investor Relations
Vincent GOULEY
+ 33 (0)1 49 55 64 69
Imerys 154 rue de l’Université
75007 PARIS
+ 33 (0)1 49 55 63 00
www.imerys.com